Detailed Hydrodynamic Feasibility Assessment for Leque Island and Zis a Ba Restoration Projects


Pacific Northwest National Laboratory, Marine Sciences Division, 1100 Dexter Avenue North, Suite 400, Seattle, WA 98109, USA
*
Author to whom correspondence should be addressed.
J. Mar. Sci. Eng. 2018, 6(4), 140; https://doi.org/10.3390/jmse6040140
Submission received: 29 September 2018
/
Revised: 13 November 2018
/
Accepted: 14 November 2018
/
Published: 16 November 2018
(This article belongs to the Special Issue Selected Papers from the 15th Estuarine and Coastal Modeling Conference)
Abstract
:Numerous restoration projects are underway in Puget Sound, Washington, USA with the goal of re-establishing intertidal wetlands that were historically lost due to dike construction for flood protection and agricultural development. One such effort is the restoration effort within the Stillaguamish Delta, benefitting from the cumulative effects from the Leque Island and zis a ba restoration projects. The preferred restoration design calls for the removal of perimeter dikes at the two sites and the creation of tidal channels to facilitate the drainage of tidal flows. A 3-D high-resolution unstructured-grid coastal ocean model based on FVCOM was developed to evaluate the hydrodynamic response of the estuary to restoration alternatives. A series of hydrodynamic modeling simulations were then performed to quantify the hydrodynamic response of the nearshore restoration project, such as periodic inundation, suitable currents, and desired habitat/salinity levels. Sediment impacts were also examined, including the potential for excessive erosion or sedimentation requiring maintenance. Simulation results indicate that the preferred alternative scenario provides the desired estuarine response, which is consistent with the planned design. A decrease in velocities and bed shear in the main river channels was noted for the restored condition associated with the increased inundation of tidal flat area and reduced tidal flows through the main channels. High bed shear near the restored tidal channel entrances indicates that the inlets may evolve in size until equilibrium is established.
1. Introduction
Puget Sound is a complex system of estuaries, basins, deltas, and habitats located at the northwestern coast of the USA. It houses large populations of birds, marine mammals, and fish. Puget Sound supports a massive community of hunters, fishermen and nature enthusiasts, etc. Over the last 150 years, economic development in Puget Sound has resulted in the alteration of habitat-sustaining processes and significant losses of wildlife habitat and fishes. A series of engineering activities such as the construction of dikes for irrigation practices that took place over a period of approximately 100 years has been recognized as one of the major causes of those habitat changes and losses [1]. In addition, the condition of these historic perimeter dikes in many Puget Sound estuaries has deteriorated and has become a concern from a maintenance, environmental issues and economic perspective. A potential long-term solution to the flooding, environmental and dike maintenance issues, while also providing ecological benefits of restored tidal marsh habitat with the goal of recovering the salmon fishery in Puget Sound, is nearshore restoration through dike removal or breaching. This has been actively evaluated by Washington State Department of Fish and Wildlife (WDFW), the U.S. Army Corp of Engineers (USACE), and the National Oceanic and Atmospheric Administration (NOAA) together with sovereign Indian nations [2,3]. This is also the case at “Leque Island” and “zis a ba” sites close to the mouth of Stillaguamish River estuary, where restoration actions have been proposed, and is the subject of this assessment.
Eight restoration scenarios including simultaneous restoration actions at the Leque-adjacent zis a ba site have been evaluated by Ducks Unlimited Inc. in collaboration with WDFW and the Stillaguamish Tribe. These scenarios included existing dike removal, the removal of damaged and repaired dike sections to create breaches, lowering the dike and the construction of new setback dikes. With the help of a detailed 3-D hydrodynamic model of the Stillaguamish estuary, we examined the effects of the proposed restoration actions on physical oceanographic parameters such as water surface elevations, salinity, currents, and bed shear stress relative to existing conditions. Numerous modeling studies based on the 3-D hydrodynamic model have been conducted in the past to improve the ecosystem and water quality due to anthropogenic causes such as excessive nutrient loading [4,5] and engineering activities [6,7,8] in the Puget Sound region.
We also examined the response of the proposed restoration scenarios to high-flow conditions critical for assessing erosion impacts and long-duration runs using a year-long record from 2003, when the highest number of flood flow events in recent years occurred. Based on the results, the indications were that proposed changes for most scenarios would provide an estuarine response consistent with the planned design [9].
In this effort, we updated the model with improved bathymetry using new LIDAR data collected by the Stillaguamish Tribe and the U.S. Geological Survey (USGS). The configuration of the preferred restoration designs at the Leque Island and zis a ba sites were updated from the conceptual levels to design and pre-construction level detail, and the updated information was incorporated into the modeling framework through further grid refinement. The model was then applied with a focus on site-specific questions related to impacts of the selected alternatives on nearby infrastructure such as dikes, outfalls, and pipelines with respect to inundation, erosion, and sedimentation. The results were examined relative to the baseline at specified locations of interest.
2. Materials and Methods
2.1. Study Area
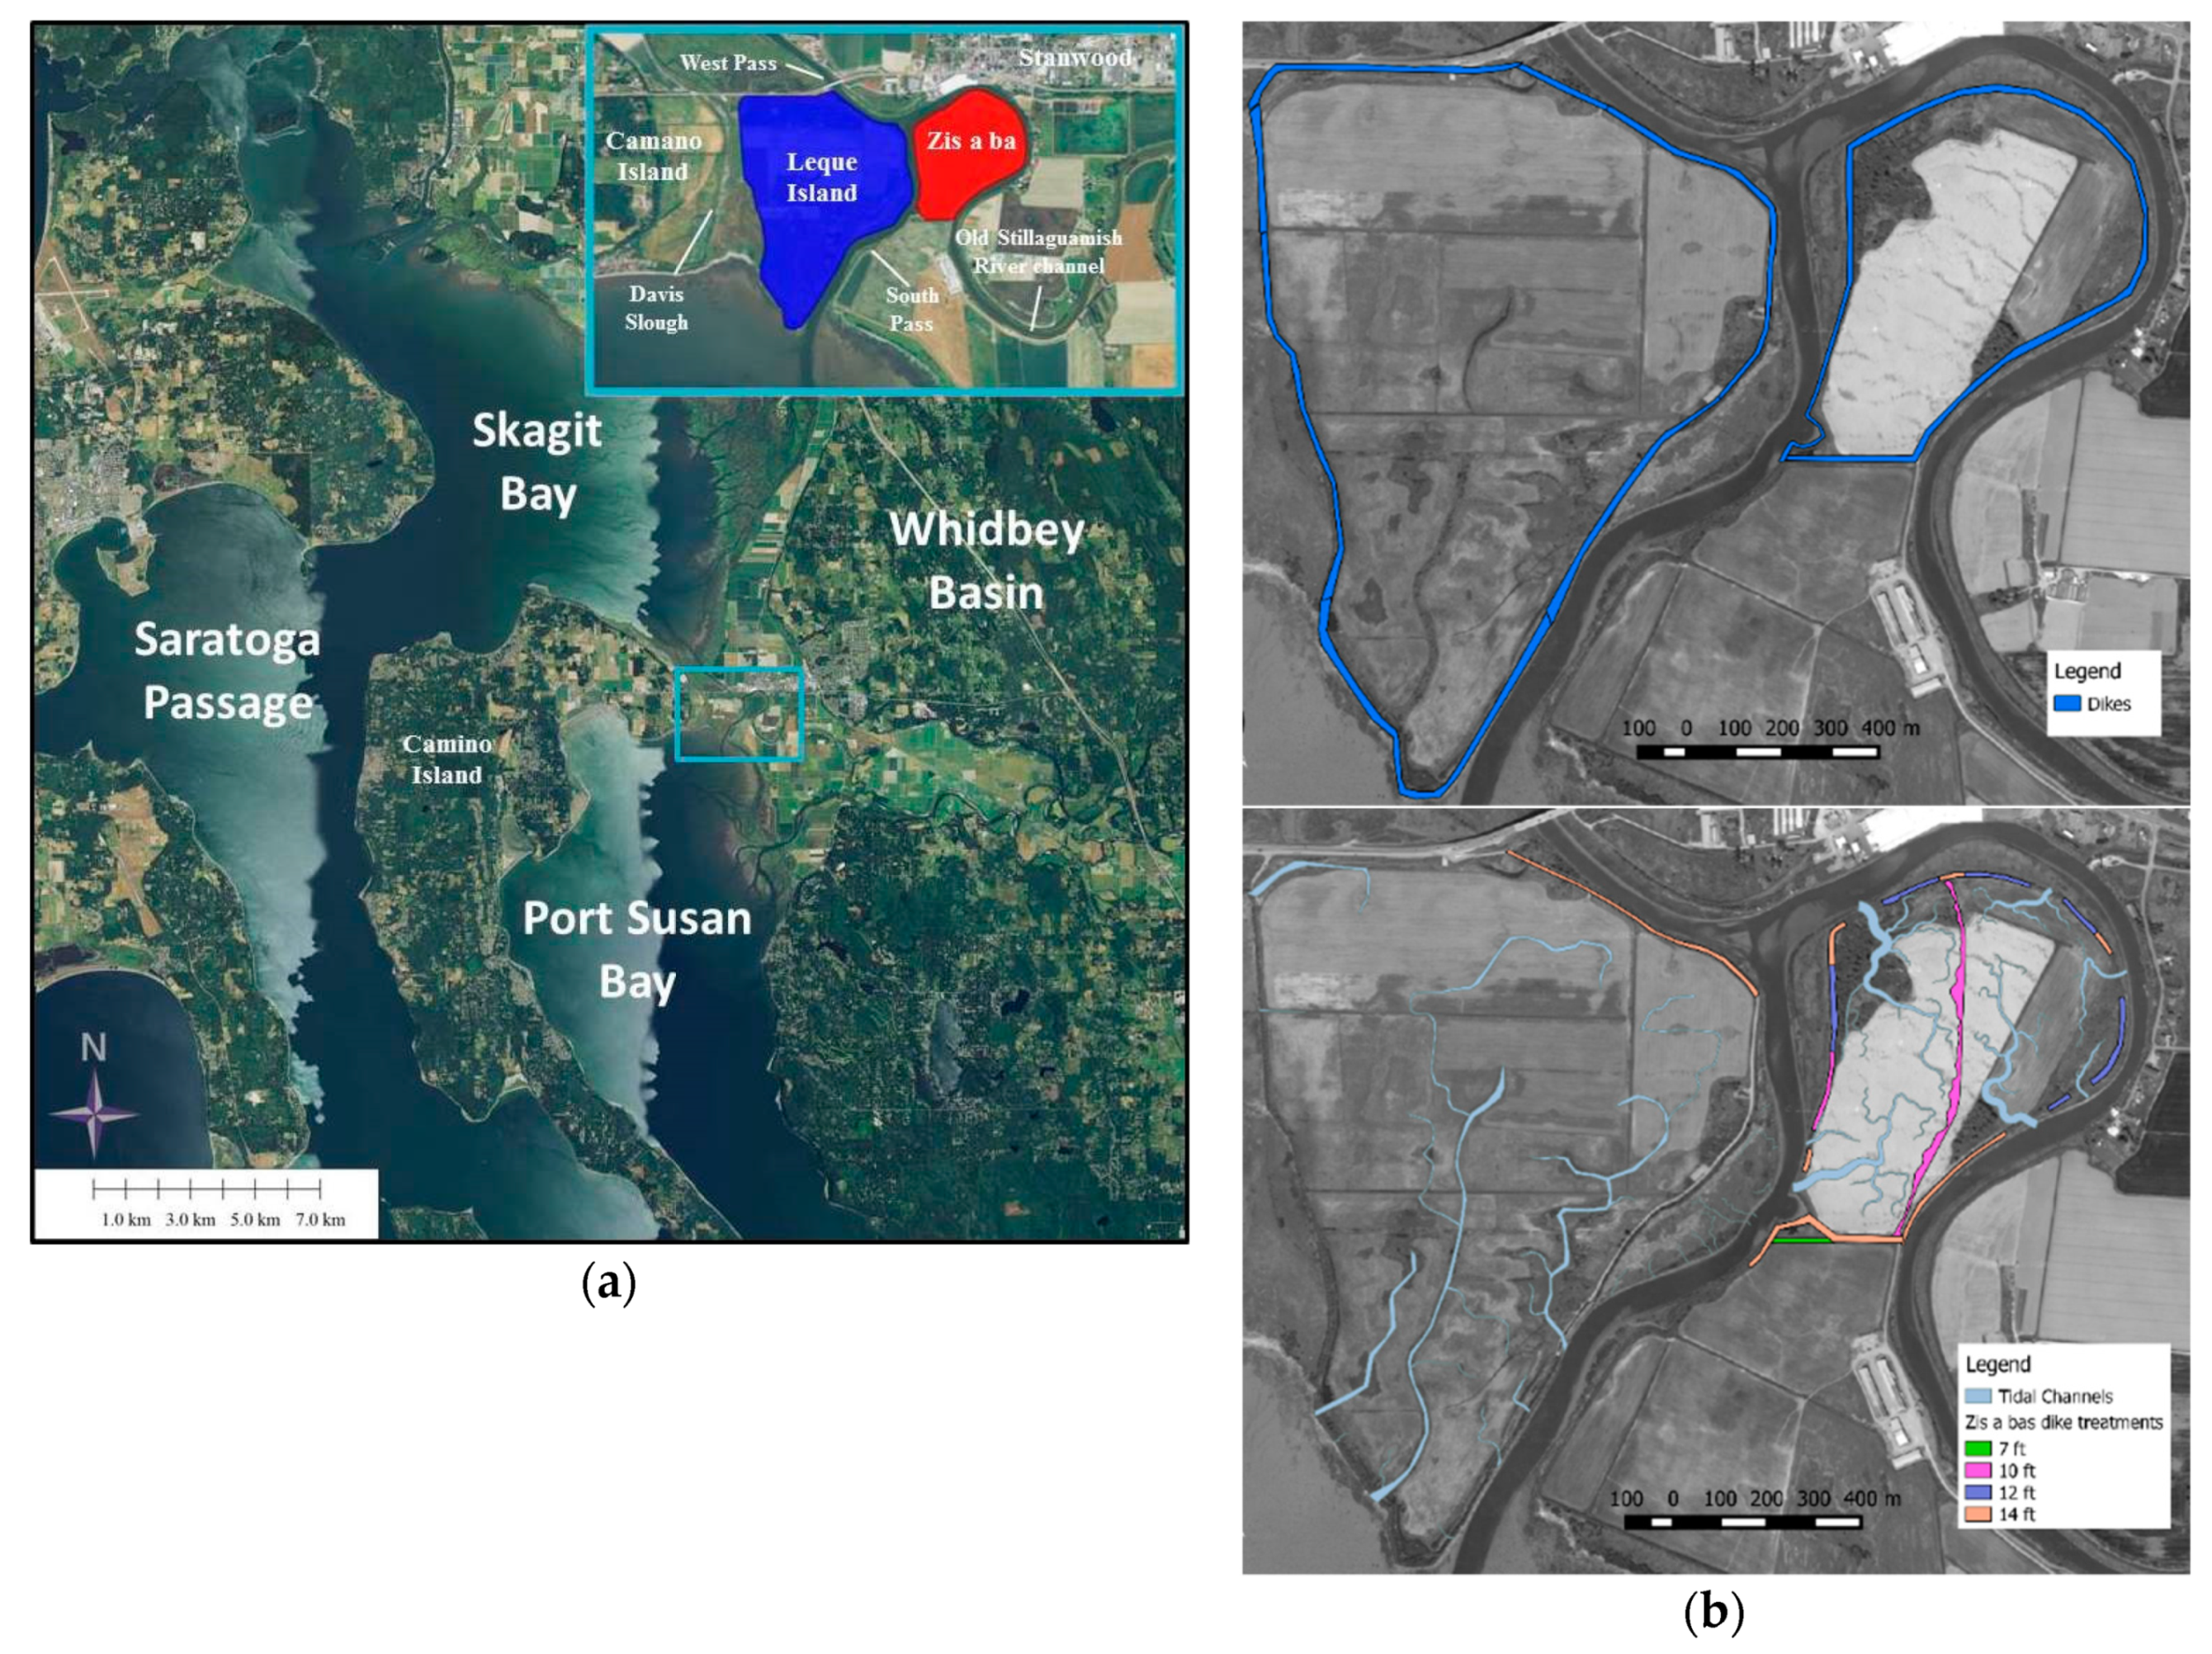
Leque Island and zis a ba are former tidal marshlands that are located close to the mouth of the Old Stillaguamish River Channel (OSRC) in the Stillaguamish River Delta. The study sites are between Skagit Bay and Port Susan Bay (Figure 1a). The OSRC splits into two distributary channels, West Pass and South Pass, along the eastern shoreline of Leque Island. On the northeast side of Leque Island, the main connection between Skagit Bay and Port Susan Bay is West Pass of the Stillaguamish River. West Pass flows north of Leque Island into Skagit Bay. South Pass flows along the southeast shoreline of Leque Island into Port Susan Bay. The 36-ha zis a ba site is located northeast of Leque Island, separated by South Pass. The Old Stillaguamish River mainstream flows around the east and north sides of zis a ba, separating zis a ba and the City of Stanwood to the north. South Pass separates zis a ba from Leque Island to the west.
2.2. Hydrodynamics of Port Susan Bay and Skagit Bay
The model was constructed using the unstructured grid Finite Volume Community Ocean Model (FVCOM) version 2.7 framework [10]. The approach was to use the FVCOM hydrodynamic model of Port Susan Bay and Skagit Bay [9], suitably updated with recent bathymetry information provided by the Stillaguamish Tribe and USGS, to first simulate existing (pre-restoration) conditions to serve as the baseline for comparison with the preferred restoration conditions. The preferred restoration condition consists of the modified bathymetry and topography of the study area.
In particular, perimeter dikes at the Leque Island and zis a ba sites would be removed or breached to allow the restoration of tidal processes and periodic inundation and dewatering during ebb and flood. To facilitate the drainage of the site during ebb, tidal channels were incorporated per designs developed by Hood [11] from an allometric analysis of tidal channel planform relative to marsh areas coupled with LIDAR data, and the number, location and size (i.e., width and length) of tidal channels for Leque Island were computed. At the zis a ba site, in addition to tidal drainage channels, the placement of a berm in the middle of the site was proposed, resulting in a division of the site into two sub-basins. The berm placement was driven by the need to protect an underground wastewater outfall line. Figure 1b is a schematic representation of the dike and tidal channel configuration for (top) the baseline scenario corresponding to the existing pre-restoration condition and (bottom) the preferred restoration alternative scenario corresponding to post restoration condition as evaluated in this manuscript.
The baseline scenario refers to the existing conditions, maintaining the current river system by permanently repairing failed dikes on Leque Island. The preferred restoration alternative scenario includes the full restoration of Leque Island, eliminating all dikes on the southern side of the island, and retaining a spur dike along the northeastern border of the island as described in Table 1 below.
2.3. Hydrodynamic Model Setup and Validation
2.3.1. Model Setup, Bathymetry Update and Grid Refinement
Bathymetry was created from different data sources. The main source of bathymetry and topography in the intertidal regions was LIDAR data obtained from the Puget Sound LIDAR Consortium. That bathymetry was then updated using new LIDAR data obtained by The Nature Conservancy (TNC) in 2012. The Snohomish County Surface Water Management Division provided channel cross-section data for Hatt Slough and the OSRC including the West Pass and South Pass reaches. We further updated the bathymetry using the most recent LIDAR data from detailed surveys conducted near the zis a ba project site by the Stillaguamish Tribe. Finally, bathymetry was linearly interpolated into the grid. In the vertical direction, a vertical sigma coordinate system was used using five uniformly distributed vertical layers.
The grid includes Skagit Bay, Port Susan Bay, and Swinomish Channel. In this study, two different grids were generated: (1) the baseline grid and (2) the preferred alternative grid. For the baseline, the grid remained coarse for the inner part of Leque Island and zis a ba sites, but was refined along West Pass, South Pass, and the lower Stillaguamish River (Figure 2a). The inner part is defined as the area of the Leque Island interior to the dikes that is not under tidal inundation. This refinement effort was aimed at understanding in detail the erosion and deposition areas along the Stillaguamish River channels outside of the proposed restoration sites under existing conditions. The baseline grid consists of 35,630 elements and 19,380 nodes in the horizontal plane. This grid was used for validation simulations and for generating baseline conditions for comparison with the preferred alternative simulations.
2.3.2. Boundary Conditions
We specified tidal elevation at four open boundaries: (1) the mouth of Skagit Bay; (2) Deception Pass; (3) Swinomish Channel; and (4) the mouth of Port Susan Bay using the X-TIDE program for the period from 10 to 26 October 2005.
We specified salinity as a constant value of 30 ppt along the Port Susan, Yokeko Point, and Padilla Bay boundaries. This boundary value is based on field data collected at Kayak Point Station. Salinity was set to 25 ppt at the Skagit Bay boundary, based on available Skagit Bay data from previous studies. At all boundaries, we set the temperature to 14 °C. The temperature effect on density-induced currents was not considered in the simulation. Field data indicated that temperature variations are not significant (<3 °C) compared to salinity variation (<20 ppt) during the time of simulation.
We obtained wind data from NOAA’s National Weather Service site at the Everett/Paine Field Station, which is approximately 30 miles south of the study area. The dominant wind direction is toward the north with wind speed average ≈ 3.4 m/s during the period of interest. Wind force was applied uniformly to the entire model domain and applied at the water-surface as wind stress.
The inflows to the Stillaguamish River system include the Stillaguamish River and the Skagit River. For this study, the total Stillaguamish River flow into Port Susan Bay was estimated by summing the flows from the North and South Forks of the Stillaguamish River. Flow data were obtained from USGS gauge 12167000 near Arlington, Washington and Washington State Department of Ecology gauge 05A105 at RM 33.4 on the South Fork Stillaguamish. The period from 10 to 26 October 2005 during which field data were collected in Port Susan Bay, was selected for the simulation. The average river flow during the period of interest was 69.57 m3/s.
Skagit River flows were obtained from the USGS gauge 12200500 at Mount Vernon, Washington. The Skagit River influences the project site and Port Susan Bay through estuarine flow that occurs from Skagit Bay to Port Susan through the West Pass of the Old Stillaguamish River. The average river flow during the period from 10 to 26 October 2005 was 349.17 m3/s, with a high-flow event (about 651 m3/s as a daily average) that was observed on 18 October 2005.
2.4. Model Validation Results
We conducted this validation effort to ensure that model performance was within a reasonable level of accuracy. The model validation includes a comparison of predicted water surface elevation, salinity, and velocity time series results with observed data. Oceanographic data collected by TNC from 10 to 26 October 2005 were used for model validation. These data were collected as part of the hydrodynamic and ecological assessment for the Port Susan Bay restoration project near the mouth of the Stillaguamish River [12].
Mooring station locations are shown in Figure 2b. Two mooring stations were deployed in the main channels of South Pass and Hatt Slough near the mouth of the Stillaguamish River. The South Pass station was equipped with a current meter and conductivity–temperature–depth (CTD) instrument for continuous tidal elevations, salinity and temperature measurements. Hatt Slough Station was equipped with an acoustic Doppler current profiler (ADCP) for continuous current measurements and a CTD for continuous tidal elevations, salinity, and temperature measurements.
Two CTDs were deployed at the Kayak Point Station. Instantaneous salinity and temperature profiles were also sampled at the South Pass, Hat Sough, and Kayak Point stations during the deployment and retrieval of the instruments.
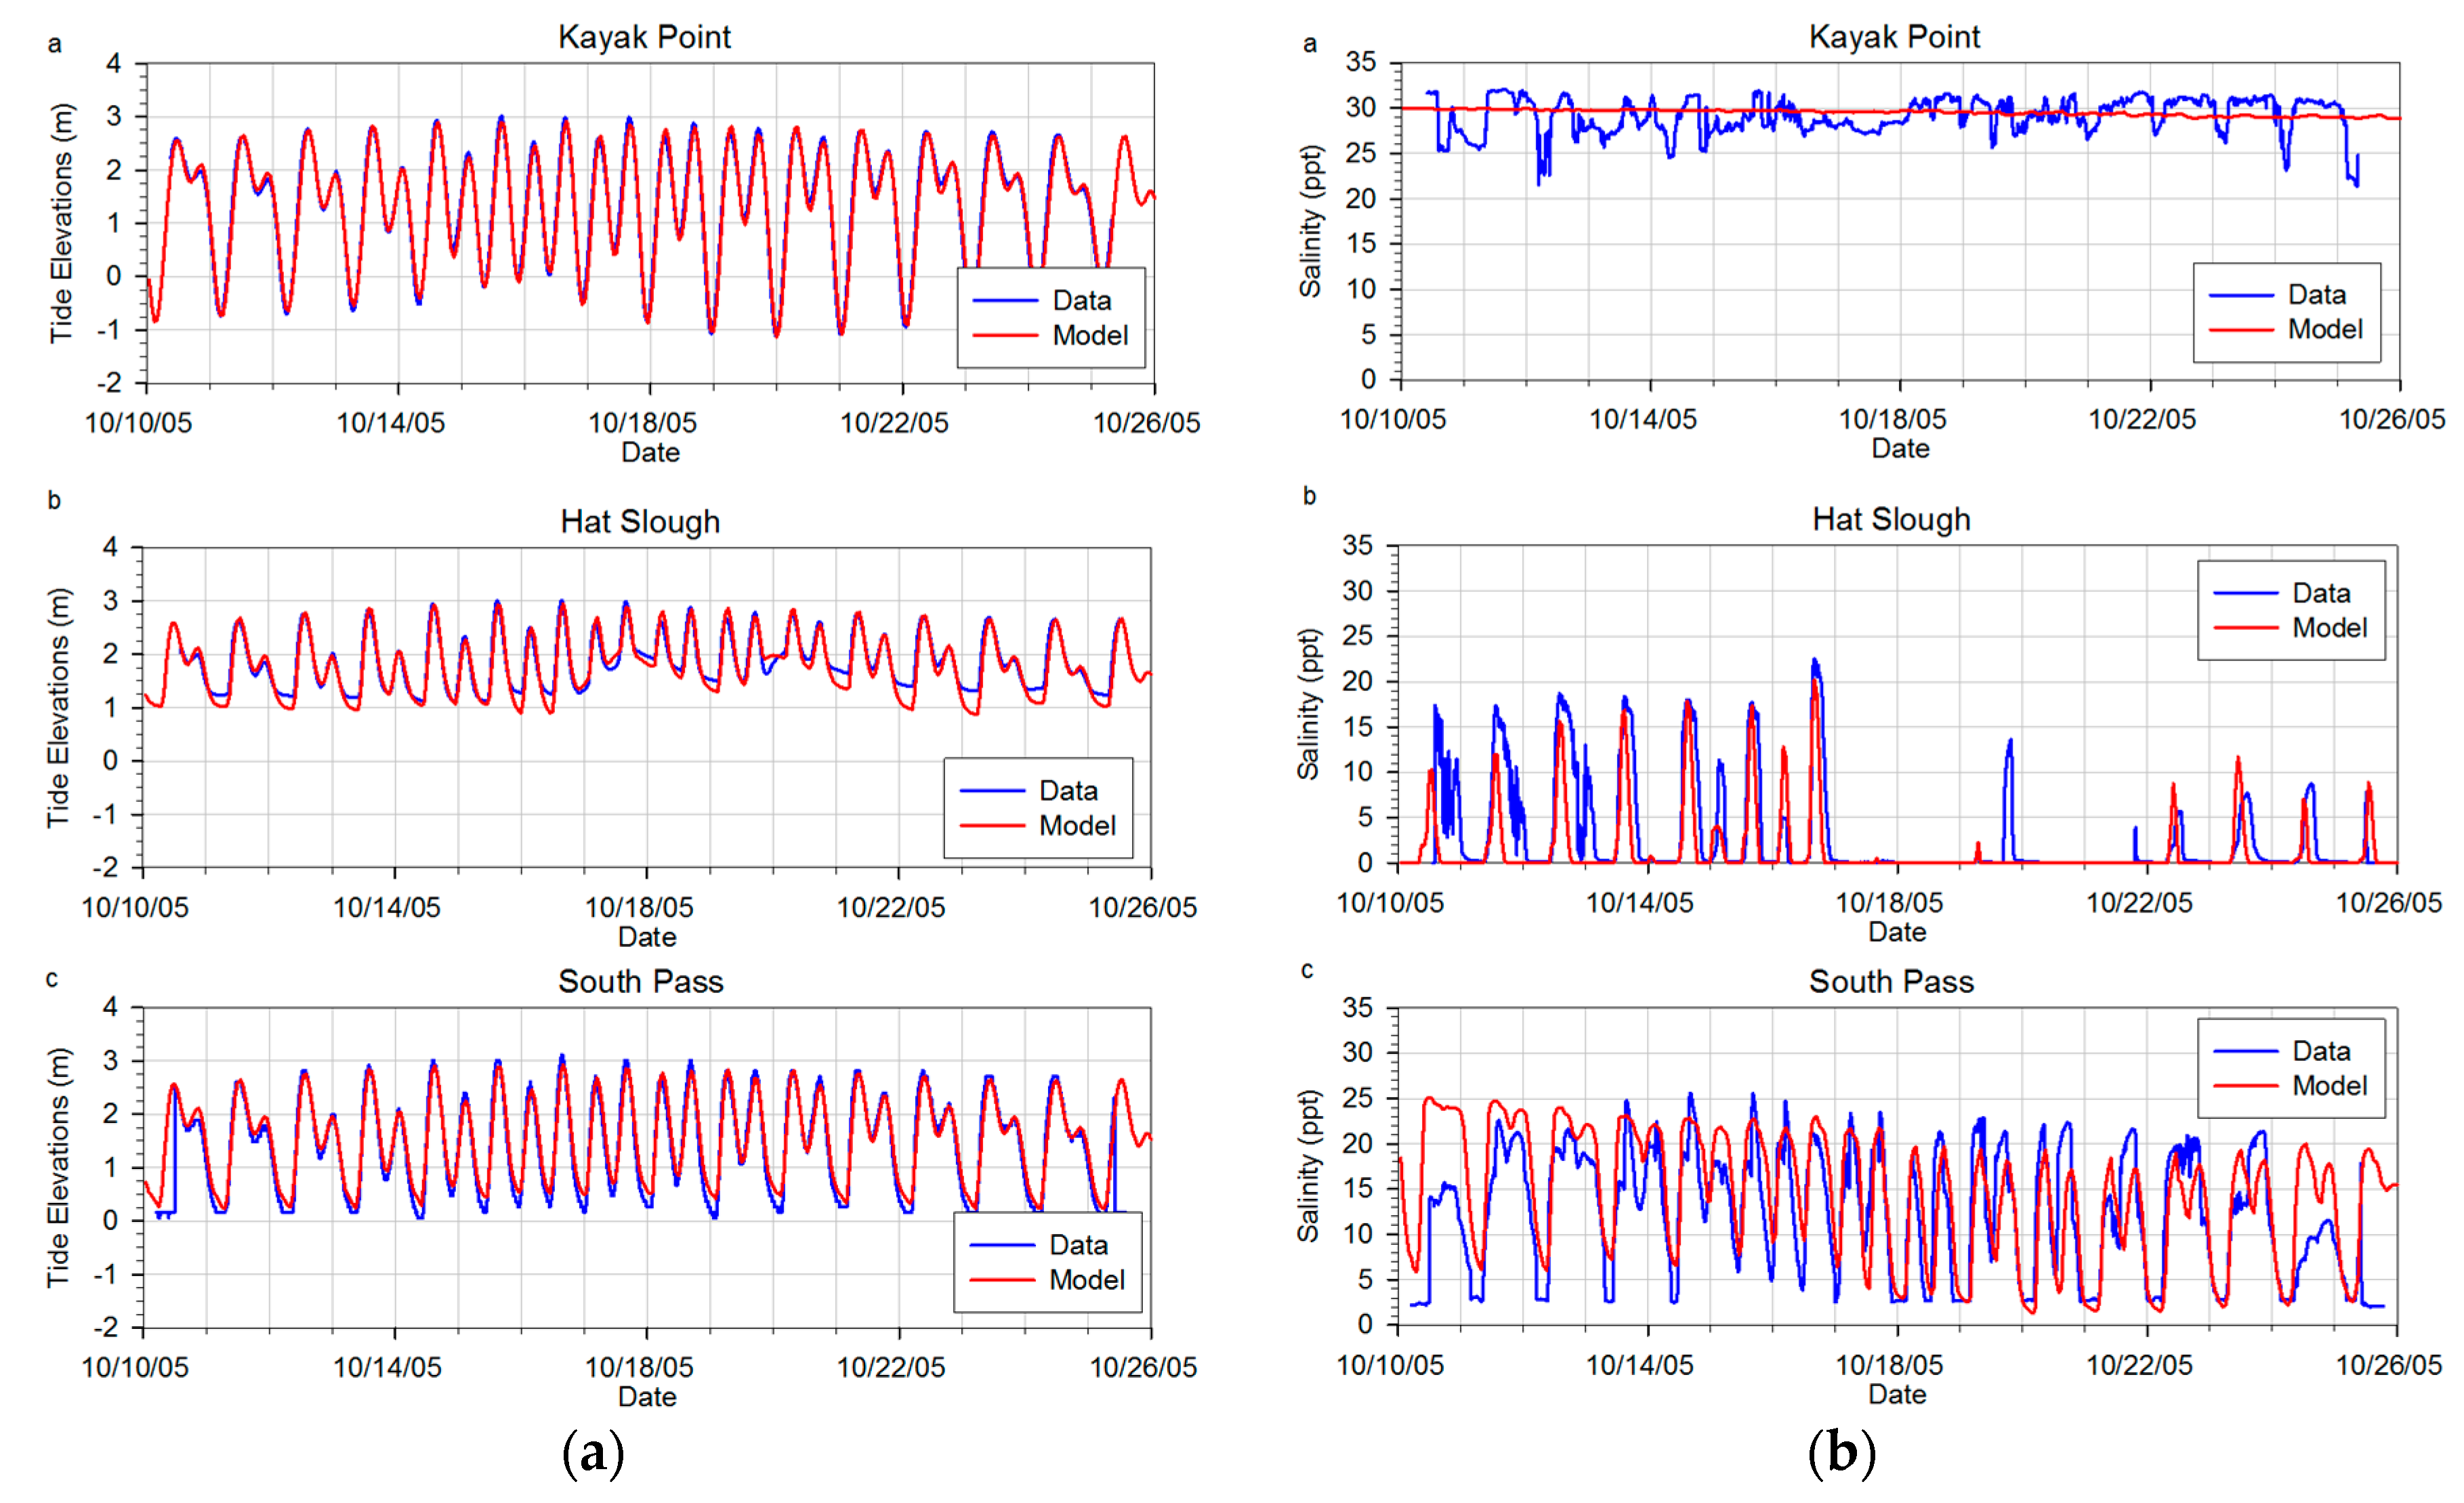
Predicted water surface elevations are in good agreement with the observed monitoring data at the Kayak Point, Hatt Slough, and South Pass Stations (Figure 3a). The spring-neap tidal cycle and the diurnal variation were well reproduced in the model. Predicted high and low tidal phases also were matched well with observed data. The predicted tidal range at the Kayak Point station ranges from −1 to 3 m as also observed in the Puget Sound coastal region. Weaker tidal elevations were found at South Pass and Hatt Slough. The tidal ranges at South Pass and Hatt Slough were in the range of 3 m and 2 m, respectively, due to the effects of shallow water depths and river backwater. During the high-flow event from 17 to 21 October 2005, tidal elevations at Hatt Slough and South Pass were further elevated because of the river backwater effect.
Table 2 provides validation error statistics comparing measured water surface elevation data to simulated results. Error statistics include the root mean square error (RMSE), mean error (ME), and mean error relative (RME) [6]. The overall root mean square error (RMSE) relative to tidal range is <10% with a negative bias of 4 cm and average RMSE of 24 cm.
The predicted salinity time series were compared with field data. Figure 3b shows the comparison of the predicted and observed salinity time series at the Kayak Point, Hatt Slough, and South Pass stations. Predicted salinities matched reasonably well with the observed data, except at the Kayak Point station. Little variation is detected for predicted salinity at Kayak Point because salinity variations there were mainly controlled by the open-boundary condition. At the open boundary, the salinity was specified as constant at 30 ppt. Salinity at the Hatt Slough Stations showed strong tidal fluctuations, varying from 0 ppt during low tide to 20–25 ppt during high tide in a full tidal cycle. Sharp salinity intrusion was observed during high tide at the Hatt Slough Station. Some discrepancies between observed data and modeled salinity were detected at the Hatt Slough and South Pass Stations. We believe the source of this error is the lack of information on fresh-water river flow distribution between Hatt Slough and the OSRC.
Validation error statistics comparing observed data to simulated results for salinity were computed (Table 2). The overall RMSE is 4 ppt with a bias of −1.3 ppt and a mean absolute salinity error of 2.7 ppt.
Predicted velocities were compared to field-observed data at South Pass and Hatt Slough. We decomposed the predicted velocities into north and south components for a direct comparison to the observed data. Predicted velocities generally matched well with the observed data at both the South Pass and Hatt Slough stations (Figure 4). Predicted velocities at the South Pass station were dominated by the north component, whereas velocities at the Hatt Slough station were dominated by the east component.
Error statistics comparing measured versus simulated velocity are also provided in Table 2. The comparison was done for a mid-depth layer at both sites. Model predictions match the field data well at a reasonable level of accuracy. Overall, the RMSE in the north and south directions is less than 14 cm/s, and the mean absolute error is 7 cm/s, except at the Hatt Slough station. This represents <10% error relative to the range of current magnitudes in the Stillaguamish River estuary.
2.5. Simulation of the Preferred Restoration Alternative Scenario at Leque Island and Zis a Ba
We selected conditions experienced during field data collection in October 2005 that were used previously in model calibration to serve as the typical conditions. Flooding and inundation (i.e., restoration area, duration, and frequency), salinity variations, and potential for erosion were the parameters of interest. In addition, high-river-flow conditions representing maximum potential for sediment erosion, deposition, and geomorphological changes were also developed. During extreme fluvial events, major geomorphologic changes such as river channel erosion and the enlargement of steep, incised channels often occur. This scenario was evaluated using bank-full, channel-forming flow and used in combination with the October 2005 tidal conditions. The baseline results were regenerated first followed by the preferred restoration results at Leque Island and zis a ba sites for the two estuarine flow conditions.
2.5.1. Preferred Restoration Alternative Scenario Setup
At the Leque Island site, selected alternative restoration action includes the creation of a network of tidal channels and the removal of the majority of the existing dike footprint to restore tidal processes to the entire property. However, a spur dike, which is a linear section of dike adjacent to the West Pass and South Pass bifurcation of the OSRC, is retained. Skagit River System Cooperative has provided predictions and recommendations for the location, number and size (i.e., length) of tidal channels based on allometric analysis of the tidal channel planform relative to marsh area. These proposed tidal channels will allow the effective exchange of water, fish, and nutrients between the marsh and Port Susan Bay [11].
Figure 5 shows grid details corresponding to the preferred alternative at the Leque Island site. The perimeter dike has been lowered to grade and tidal channels have been incorporated. The design widths of the tidal channels vary between 5 m and 20 m and the depths vary between 1 m and 2 m. To avoid high computational costs and model stability, we limited model cells to as small as 2.5 m to allow 5-m wide channels to be represented. The number of cells gradually increases with distance as the channel widths increase towards the channel mouths.
Figure 6 shows a model grid detail corresponding to the preferred alternative at the zis a ba site. Unlike the Leque Island site, the perimeter dike was lowered to a specified elevation and breached at a number of locations. The preferred alternative design includes sustaining a partial section of dike adjacent to the southwest bank of the OSRC. Also, as shown in Figure 6, the design includes a north-south oriented berm that divides the site into two drainage basins. More details on the zis a ba restoration design can be found in the zis a ba restoration project design [13]. The design widths of tidal channels vary between 2 m and 26 m and depths vary between 0.5 m at the mouth of the channels and approximately −2 m at the upstream end of the channels.
The model input, parameters and settings were the same as used in the validation and baseline scenario simulation. On the Pacific Northwest National Laboratory (PNNL) high performance cluster using 384 processors, simulations of selected alternative scenarios took about a day of computer time to simulate two-week periods.
2.5.2. Typical Estuarine Conditions of October 2005
The baseline (existing conditions) and the preferred alternatives at the Leque Island and zis a ba sites were both simulated using the same model inputs (i.e., model parameters and forcing) corresponding to typical conditions. We conducted simulations for 2-week periods within the range of 5–26 October 2005, a window selected to represent the typical estuarine conditions.
The results for each scenario are presented as horizontal plots of surface velocity vector distributions overlaid with salinity contours at peak ebb and flood tides. This allows the salinity values to be examined at the two extremes during flood and slack tide, from which areal extents of the tidal exposure may be assessed. We present the contour plots of maximum bed shear stress during a 2-week simulation period, which allows the visual assessment of areas most likely to experience the highest bed shear stresses and potential for sediment erosion. The difference plots of maximum bed shear stress also are presented so that differences between the baseline and preferred alternative scenarios can be examined.
Finally, the time series of water surface elevation (m), salinity (ppt), velocity magnitude (m/s), and bed shear at 11 stations were plotted over a period of 16 days. Time series plots for the preferred restoration alternative scenario were provided with baseline results for relative comparison and evaluated with reference to the desired characteristics for a tidal restoration project. Figure 7 shows the locations of the 11 stations where time series plots of water surface elevation, salinity, bottom velocity, and bed shear stress were generated over the complete 2-week simulation. The model’s bottom velocity was obtained from velocity information at the lowermost layer of the model sigma-layers (i.e., 10th layer). Bed shear stress was internally computed in the model using the formula , where ρ is sea water density, Cd is the drag coefficient, and is the critical bed shear velocity.
Guidance from the Skagit River System Cooperative [14] provides information about the desired water characteristics after restoration; those characteristics are a depth range between 20 cm and 38 cm and a salinity range between 5 ppt and 15 ppt, which can support fish habitat.
We examined bed shear stress as the best indicator of expected sediment transport given site-specific variability in bed characteristics and critical shear stress properties controlling erosion potential. We presented bed shear stress in Pascals (Pa). An approximate correlation between the size of sediment particles and critical shear stress for erosion are provided in [15]. Assuming non-cohesive sediments, particles erode and re-suspend when bed shear stress exceeds the limit of critical shear stress values. Silt has maximum critical stress for erosion 0.11 Pa, whereas sand has maximum critical stress for erosion 1.26 Pa.
2.5.3. Simulation of Stillaguamish River High-Flow Conditions
The performance of the proposed restoration actions during high-river-flow conditions was evaluated primarily to assess potential erosion and deposition concerns. The high flow was defined as the bank-full flow condition of 750.62 m3/s. This flow was determined through sensitivity tests reported in Whiting and Khangaonkar [6]. The sensitivity test was conducted by increasing daily average flow values in increments of 566 m3/s of the 16-day period in October 2005. Locations along both the Old Stillaguamish River and Hatt Slough were selected to identify where overtopping seemed most likely to happen. The final flow of 750.62 m3/s was selected as the design high-flow value that the river system could sustain before overtopping occurred.
3. Results & Discussion
3.1. Baseline Scenario
The baseline scenario represents the conditions of the system as it exists today subject to tidal and stream flow forcing. Figure 8a shows a close-up of the baseline scenario grid covering Leque Island and zis a ba surrounded by the perimeter dike.
3.1.1. Typical Estuarine Flow Conditions
Predicted horizontal salinity and velocity distributions in the surface layer corresponding to high tide and low tide on 24 October 2005 for typical estuarine and high-flow conditions are presented. The mouth of the Old Stillaguamish River is strongly influenced by tides. This strong tidal effect is seen clearly in salinity plots that show upstream propagation up the Lower Old Stillaguamish River during incoming flood tide. Tidal exchange between Skagit Bay and Port Susan Bay occurs through the West Pass and South Pass channels. Figure 9 shows inundation and salinity contour plots at high (bottom) and low tides (top), respectively. The intertidal flats in Port Susan and Skagit Bay are fully inundated, reaching elevations above the toes of the perimeter dikes during high tide, and exposed during the ebb tide. The perimeter dike prevents the inundation of the Leque Island and zis a ba restoration areas. The improvement of model bed elevation by increasing grid resolution along the main river channel increased the simulated resolution of the wetting and drying intertidal regions during the ebb and flood periods.
Fresh water from the OSRC appears to exit into Port Susan mostly through South Pass. During low tide following ebb, the salinity difference between West Pass and South Pass can be as high as 6 ppt (Figure 9: top). The salinity levels and intrusion upriver near the project sites at Leque and zis a ba on the OSRC were sensitive to the fraction of the fresh water split between the Old Stillaguamish River and Hatt Slough. Salinity levels at Davis Slough remain relatively high throughout the tidal cycles as they are controlled primarily by Skagit Bay salinities.
3.1.2. High-Flow Conditions
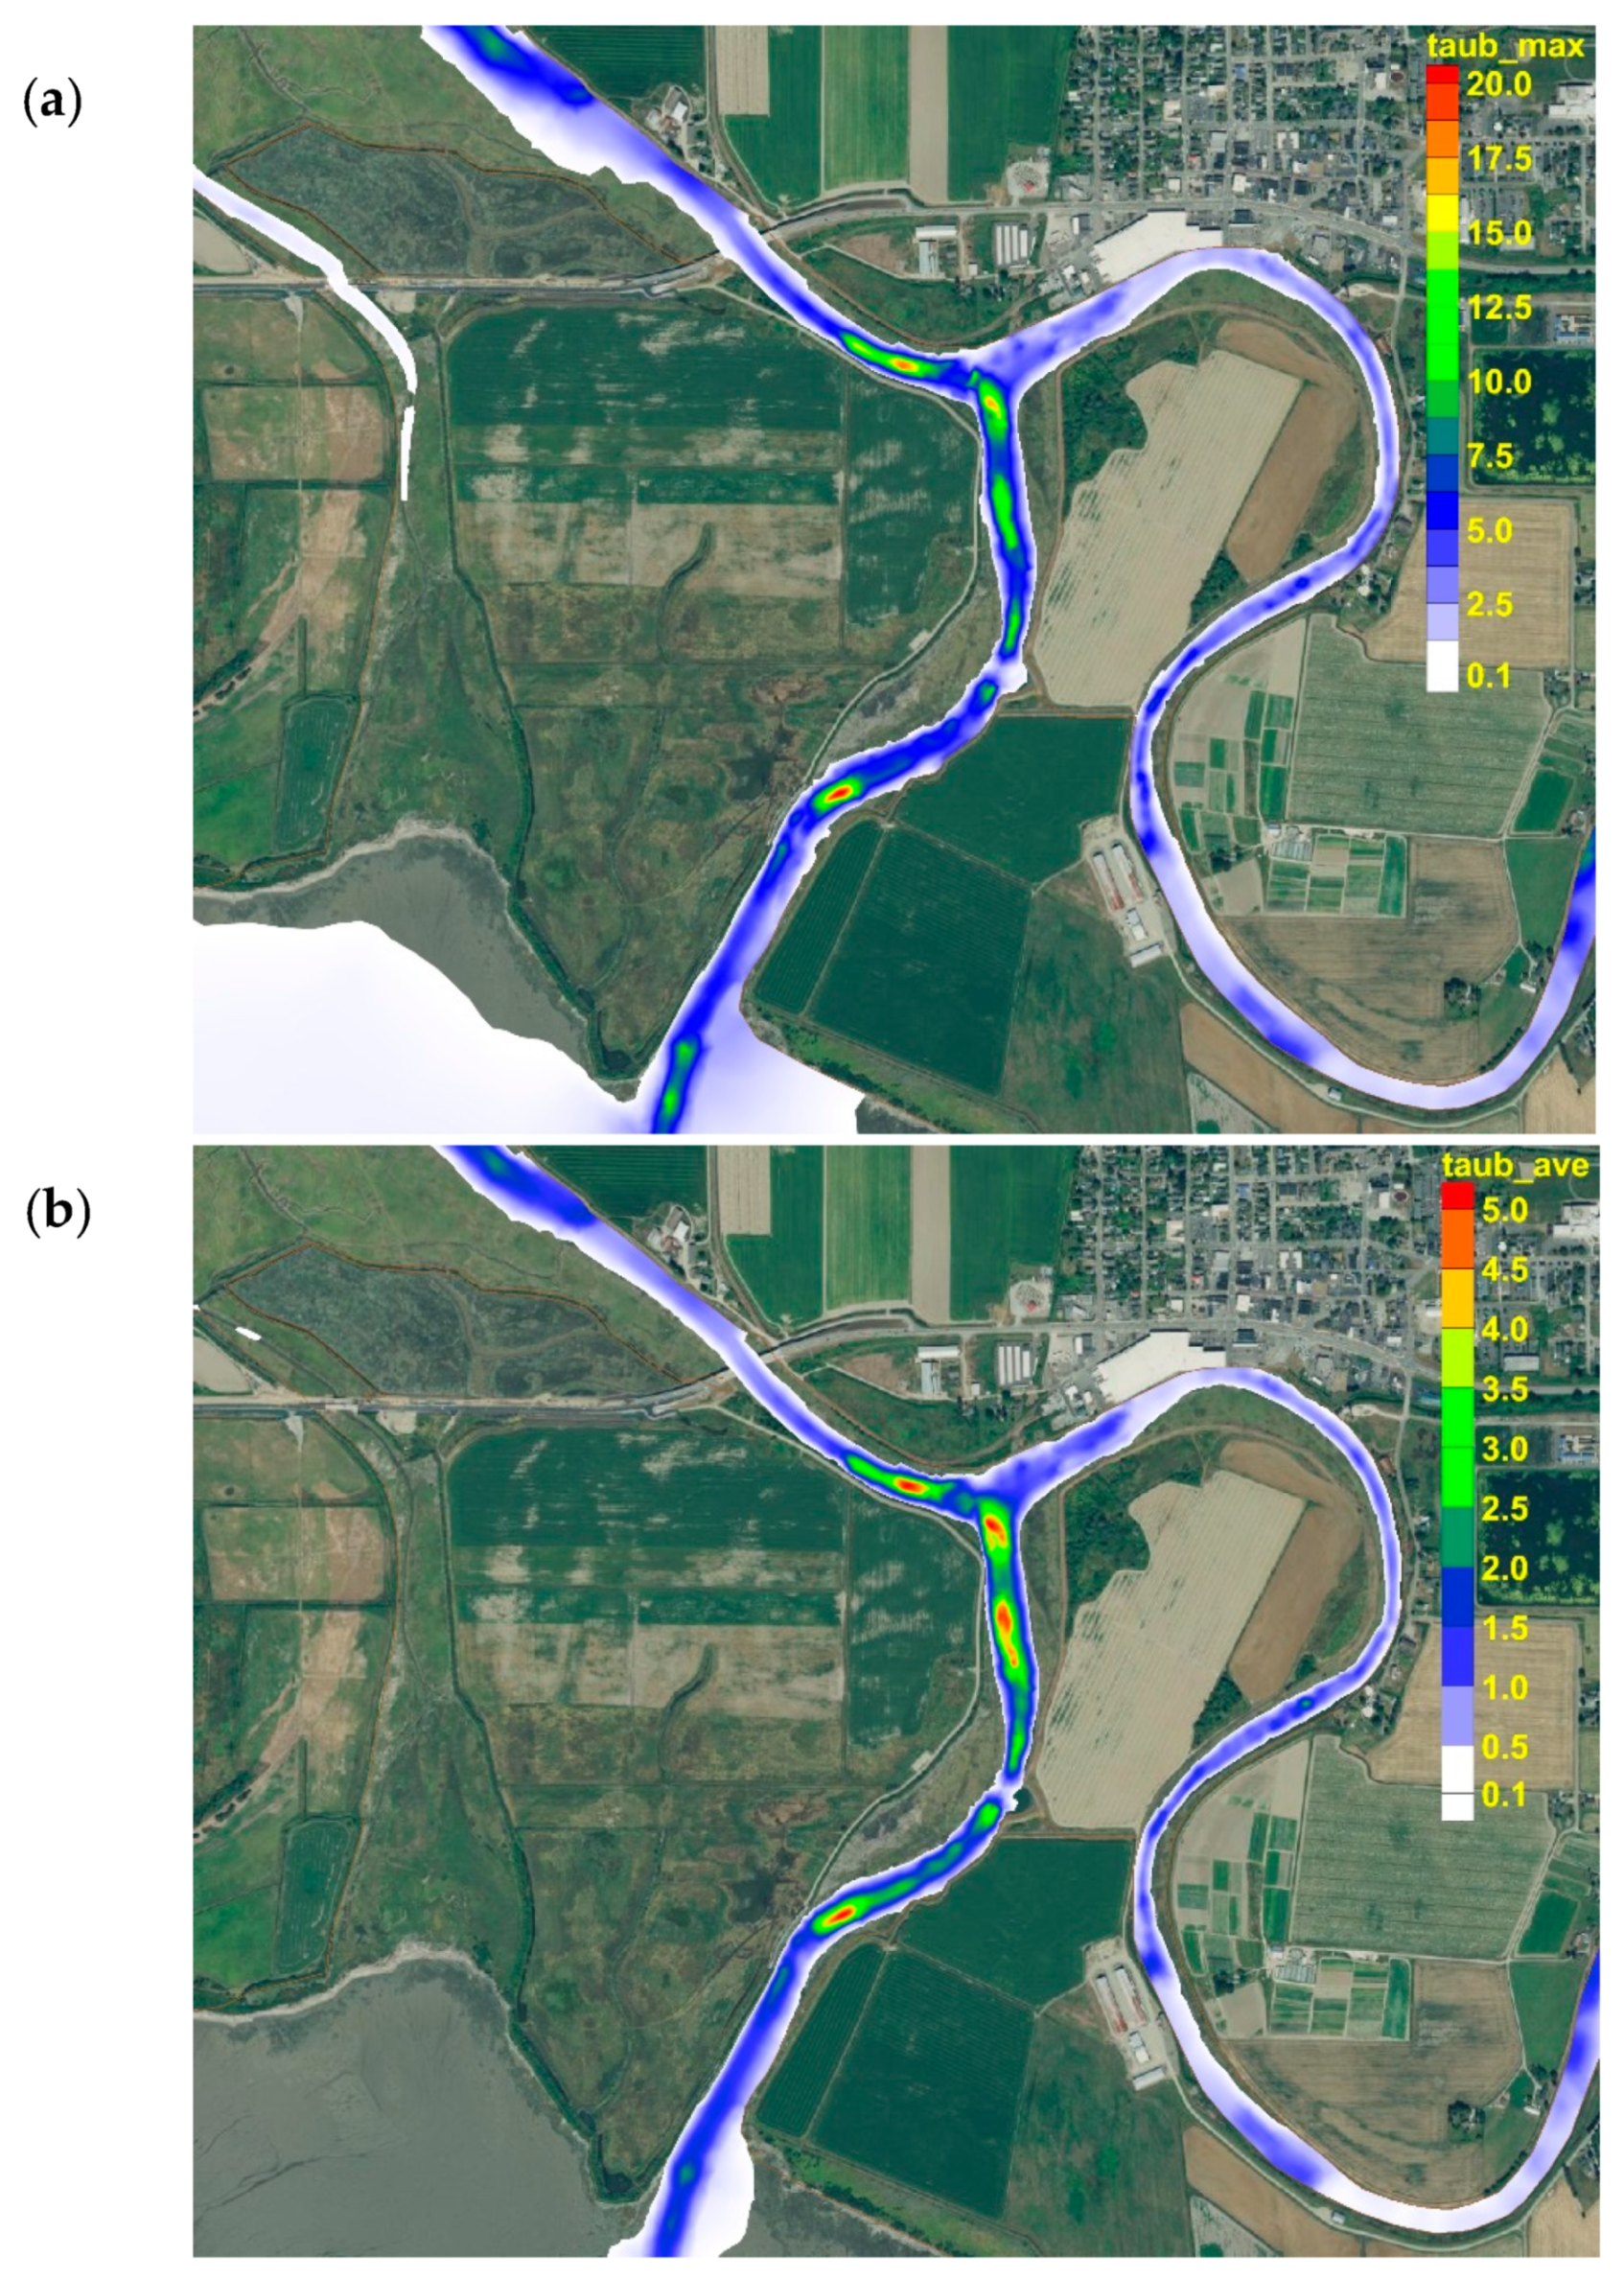
In these high-flow conditions, we focus mainly on examining and identifying regions of high bed shear stress with potential for erosion. Figure 10 shows the maximum and average of bed shear stress for the baseline scenario at high-flow condition (750.62 m3/s) over a 2-week simulation period. As expected, South Pass experiences high bed shear stress as it acts as the main tidal channel connecting Port Susan and Skagit Bay and provides exchange flow associated with the OSRC. From the plan view of the mean bed shear stress, higher bed shear stresses (>5 Pa) are mostly predicted in South Pass and West Pass reaches immediately downstream of the OSRC channel split at Leque Island.
3.2. Preferred Restoration Alternative Scenario
Figure 8b shows the grid for the preferred restoration alternative scenario, which involves the partial removal of the perimeter dikes and the creation of a network of tidal channels on both the Leque Island and the zis a ba sites.
3.2.1. Typical Estuarine Conditions
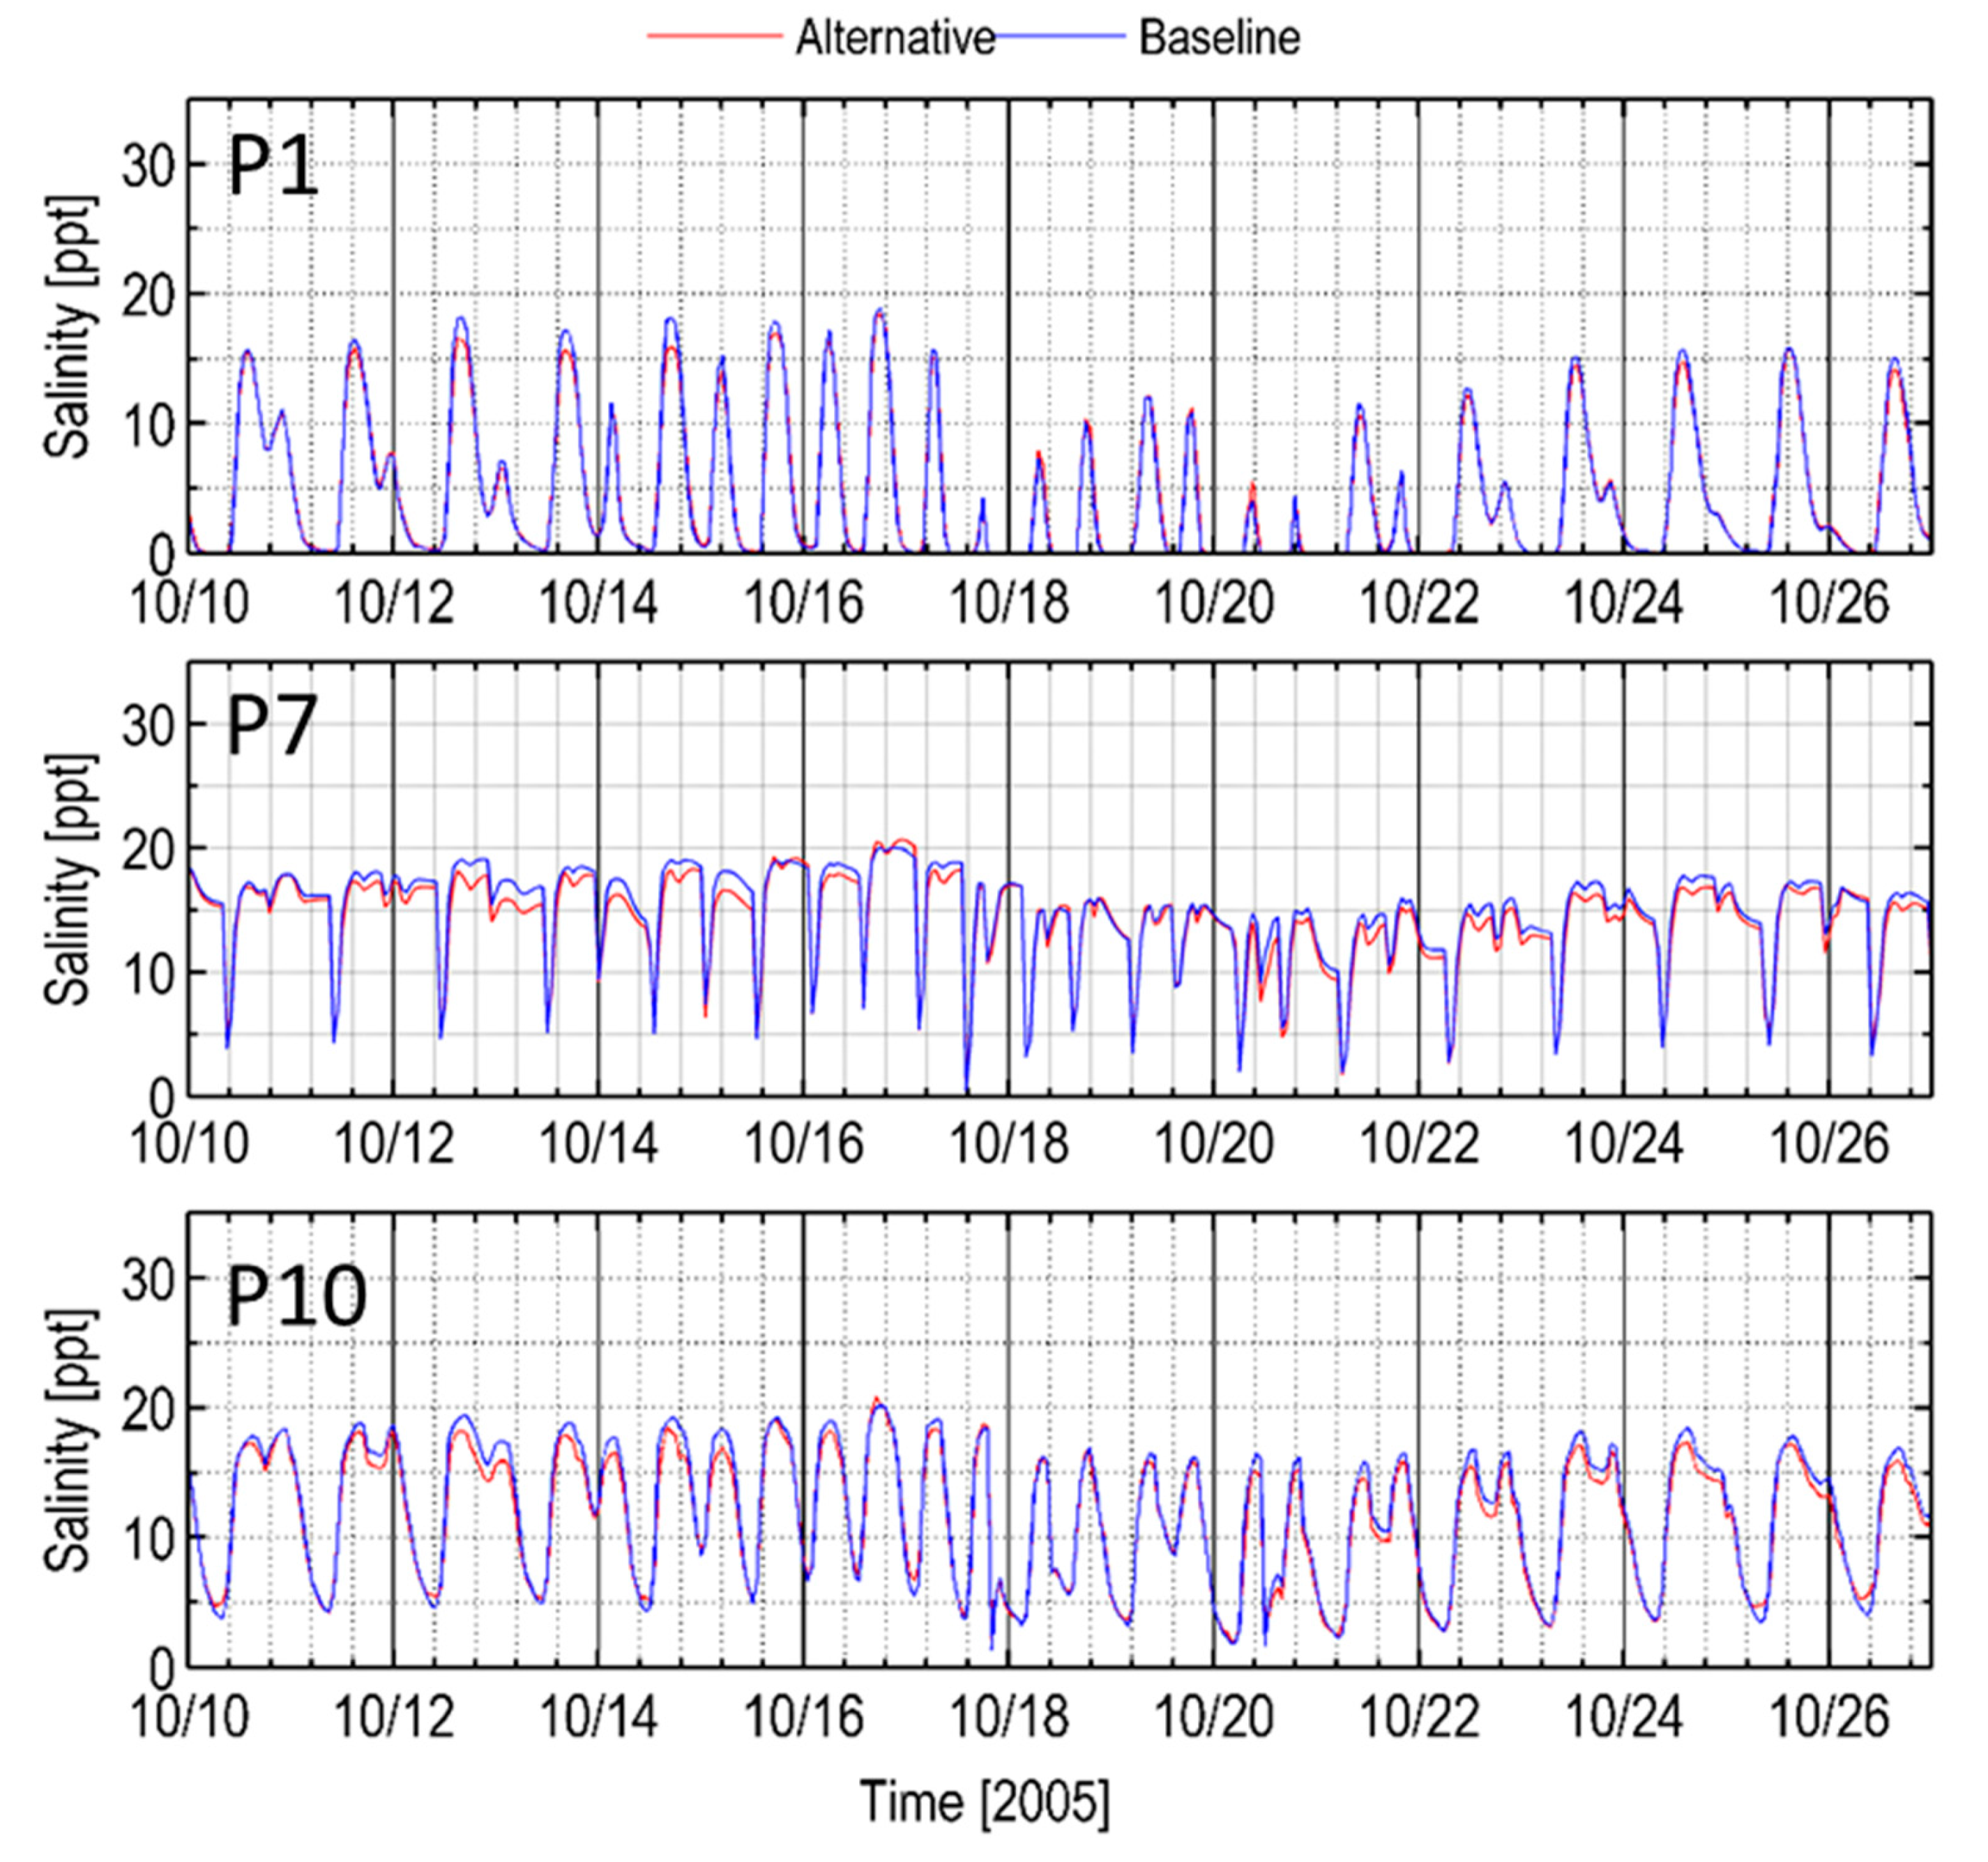
To facilitate a quantitative comparison of the preferred alternative scenarios and the baseline scenario, we selected 3 out of 11 stations in the main river channels near the Leque Island and zis a ba sites. Station P1 was selected at the lower OSRC near zis a ba. Station P7, located near the 532 Bridge, was selected to represent West Pass, at which point the water flux is mainly controlled by Skagit Bay. We selected Station P10 to represent South Pass (see Figure 7 for locations of stations P1, P7, and P10.)
The preferred restoration alternative does not cause any significant changes in water elevations at the West Pass and the lower OSRC stations. The mean water surface elevation for the preferred restoration alternative scenario is ≈0.01 m lower relative to the baseline scenario.
However, the results show that the restoration action would alter the predicted salinity at West Pass, South Pass, and the OSRC stations. Salinity is mainly controlled by tidal mixing and upstream fresh-water discharge from the Stillaguamish River. As shown in Figure 11, there is a notable decrease in salinity levels in South Pass (P10), and the influence extends all the way north into West Pass (P7) during high tide. The plot shows that salinity in the preferred alternative scenario can be up to 2 ppt lower than the baseline scenario in West Pass, South Pass, and the lower OSRC stations. The results indicate that the proposed restoration will result in a small decrease in the amount of seawater intrusion into the OSRC, West Pass and South Pass channels.
The inundation areas at high and low tides at Leque Island and zis a ba are shown in Figure 12. During high tide, Leque Island is nearly fully inundated (Figure 12b). The tidal channels connecting Leque Island with South Pass and Port Susan bring seawater into the Leque Island site. The tidal channel at the northwest side connecting Davis Slough and Leque Island also contributes to the inundation. During low tide, southern tidal channels at Port Susan and South Pass become primary drainage channels, allowing water to be transported back to Port Susan (Figure 12a). It appears that the restoration area does not drain fully during low tide. Pockets of seawater are shown to remain in the Leque Island. This is due to the fact that the model does not account for the percolation of wetted areas and cannot resolve fine scale undulations of bathymetry and the associated drainage. It should be noted that the areas that do not drain are isolated low areas, which will be inundated during the next high tide.
The outflow of freshwater from OSRC primarily occurs through the South Pass during ebb which also carries the majority of net outflow to Port Susan Bay and remains relatively unchanged in the preferred restoration alternative scenario. In the existing as well as in the restored condition, a relatively small outflow of brackish water to Skagit Bay also occurs through West Pass during the flood period.
The predicted horizontal distribution of salinity for the preferred restoration alternative scenario over the restored area is also shown in Figure 12. The seawater enters Leque Island site primarily from the tidal channels at Port Susan Bay and South Pass (Figure 12b). On the zis a ba site, brackish water (≈14 ppt) inundation occurs through the west side of the island and the presence of the berm separates the east side of zis a ba. Inundation of the east side of the zis a ba site occurs with brackish water of lower salinity (≈4 ppt) from the Old Stillaguamish River main stem through channels excavated as part of the restoration design.
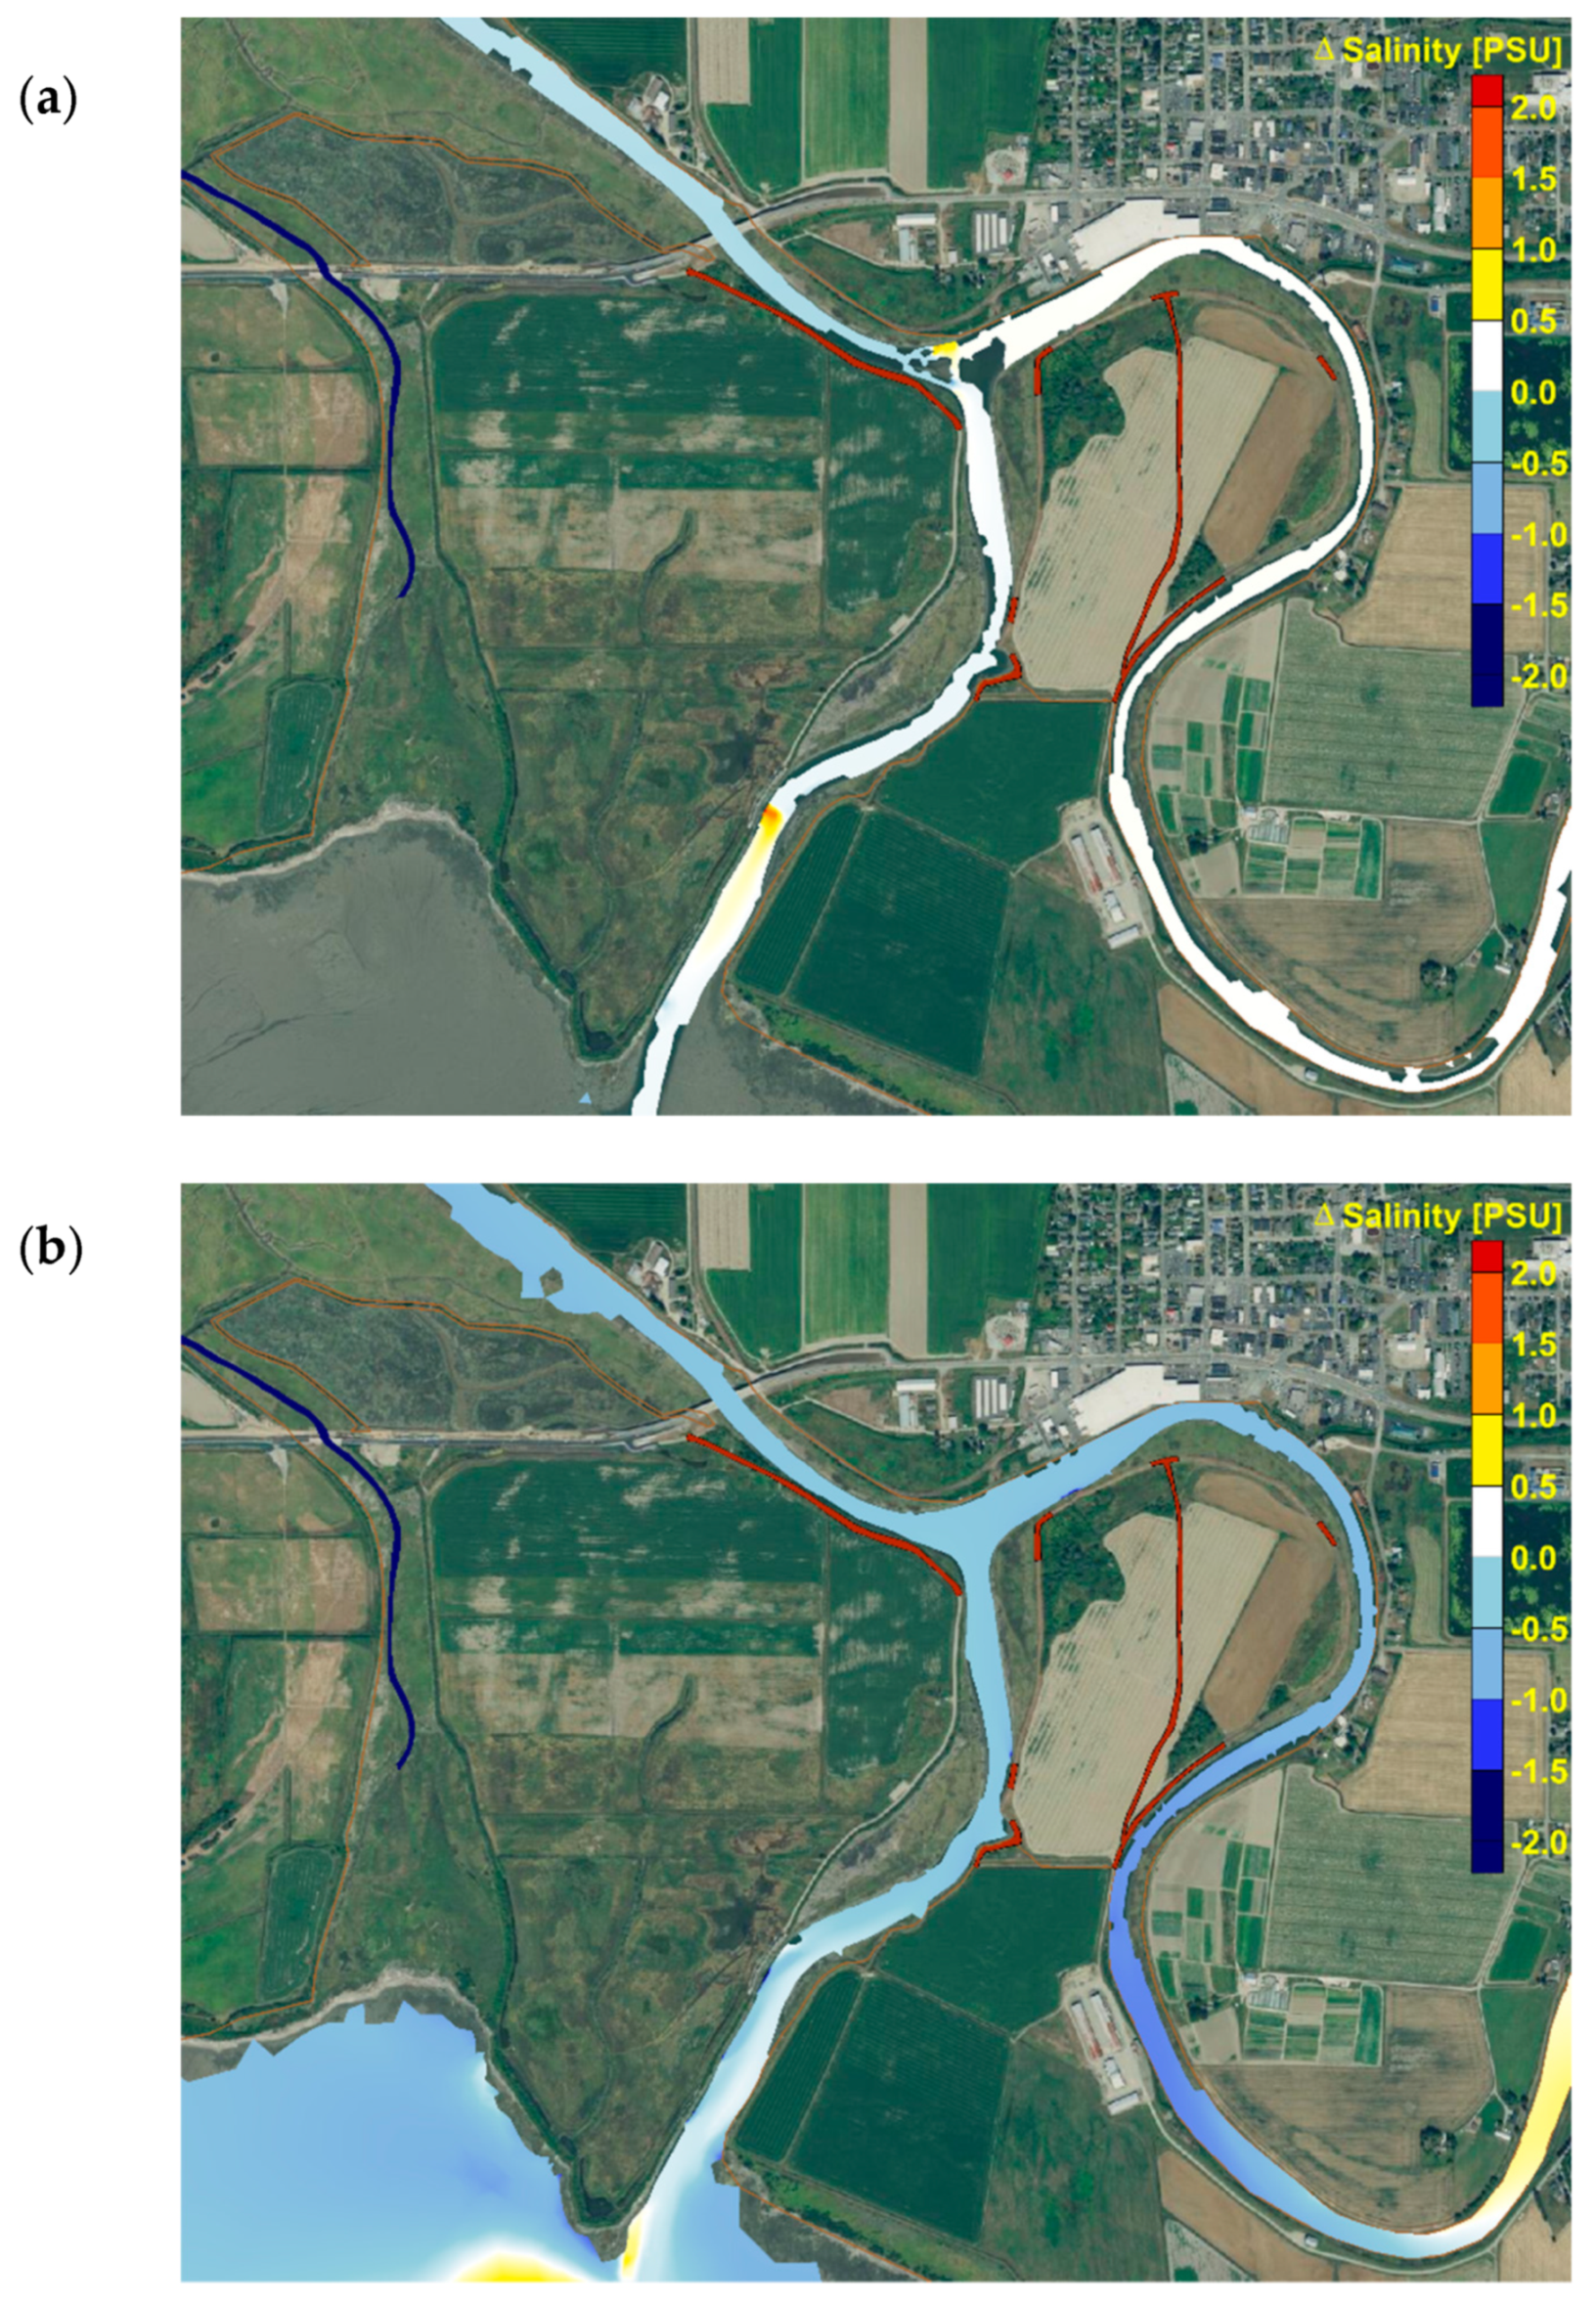
Figure 13 is a difference-plot showing the change in predicted salinity between the baseline scenario and the preferred restoration alternative conditions at high and low tides. During low tide following ebb, salinity concentrations are lower (≈−0.5 ppt) in West Pass relative to the baseline, as also shown in the P7 station time series plot (Figure 11), but are relatively unaffected in South Pass or OSRC. A similar reduction in salinity is noted in all three channels during high tide following flood, indicating an overall reduction in the intrusion of saline water from Port Susan. It is noted that this comparison only represents the spring high/low tide condition and that pockets of higher (≈+0.5 ppt) salinity water may be trapped and intrude upstream during other periods in the tidal cycle as seen in the high tide panel at the upstream end of OSRC.
The comparison of results indicate that the proposed restoration action will not result in significant changes in velocities at P1, P7, and P10 stations (figure not shown). At P1 and P7, the differences are negligible; however, in South Pass, an increase in peak velocity is noticeable during flood as well as ebb. An increase in peak velocity of up to 0.09 m/s during spring tide is predicted in South Pass for the preferred restoration alternative scenario.
Figure 14 presents the time series of bed shear stress at the representative stations. Mean bed shear stress at West Pass is predicted to be lower by 0.01 Pa relative to the baseline scenario. Mean bed shear stress at South Pass is predicted to increase by 0.04 Pa, with a peak increase of 0.8 Pa during spring tide. These results indicate that, while West Pass is predicted to experience a slightly lower bed shear stress under the preferred restoration alternative scenario, South Pass will likely experience higher bed shear stress.
3.2.2. High-Flow Conditions
The focus of the high-flow simulation was to evaluate the impact of the proposed restoration action on bed shear stress during channel-forming flow conditions. An examination of the time series of water elevations at the Old Stillaguamish River (P1), West Pass (P7), and South Pass (P3) shows that water surface levels are not significantly different in the preferred restoration alternative scenario relative to those in the baseline scenario. This implies that the storage volume offered by the restored marshes is not significant with respect to the flood reduction benefit that is often associated with restoration actions in flood plains.
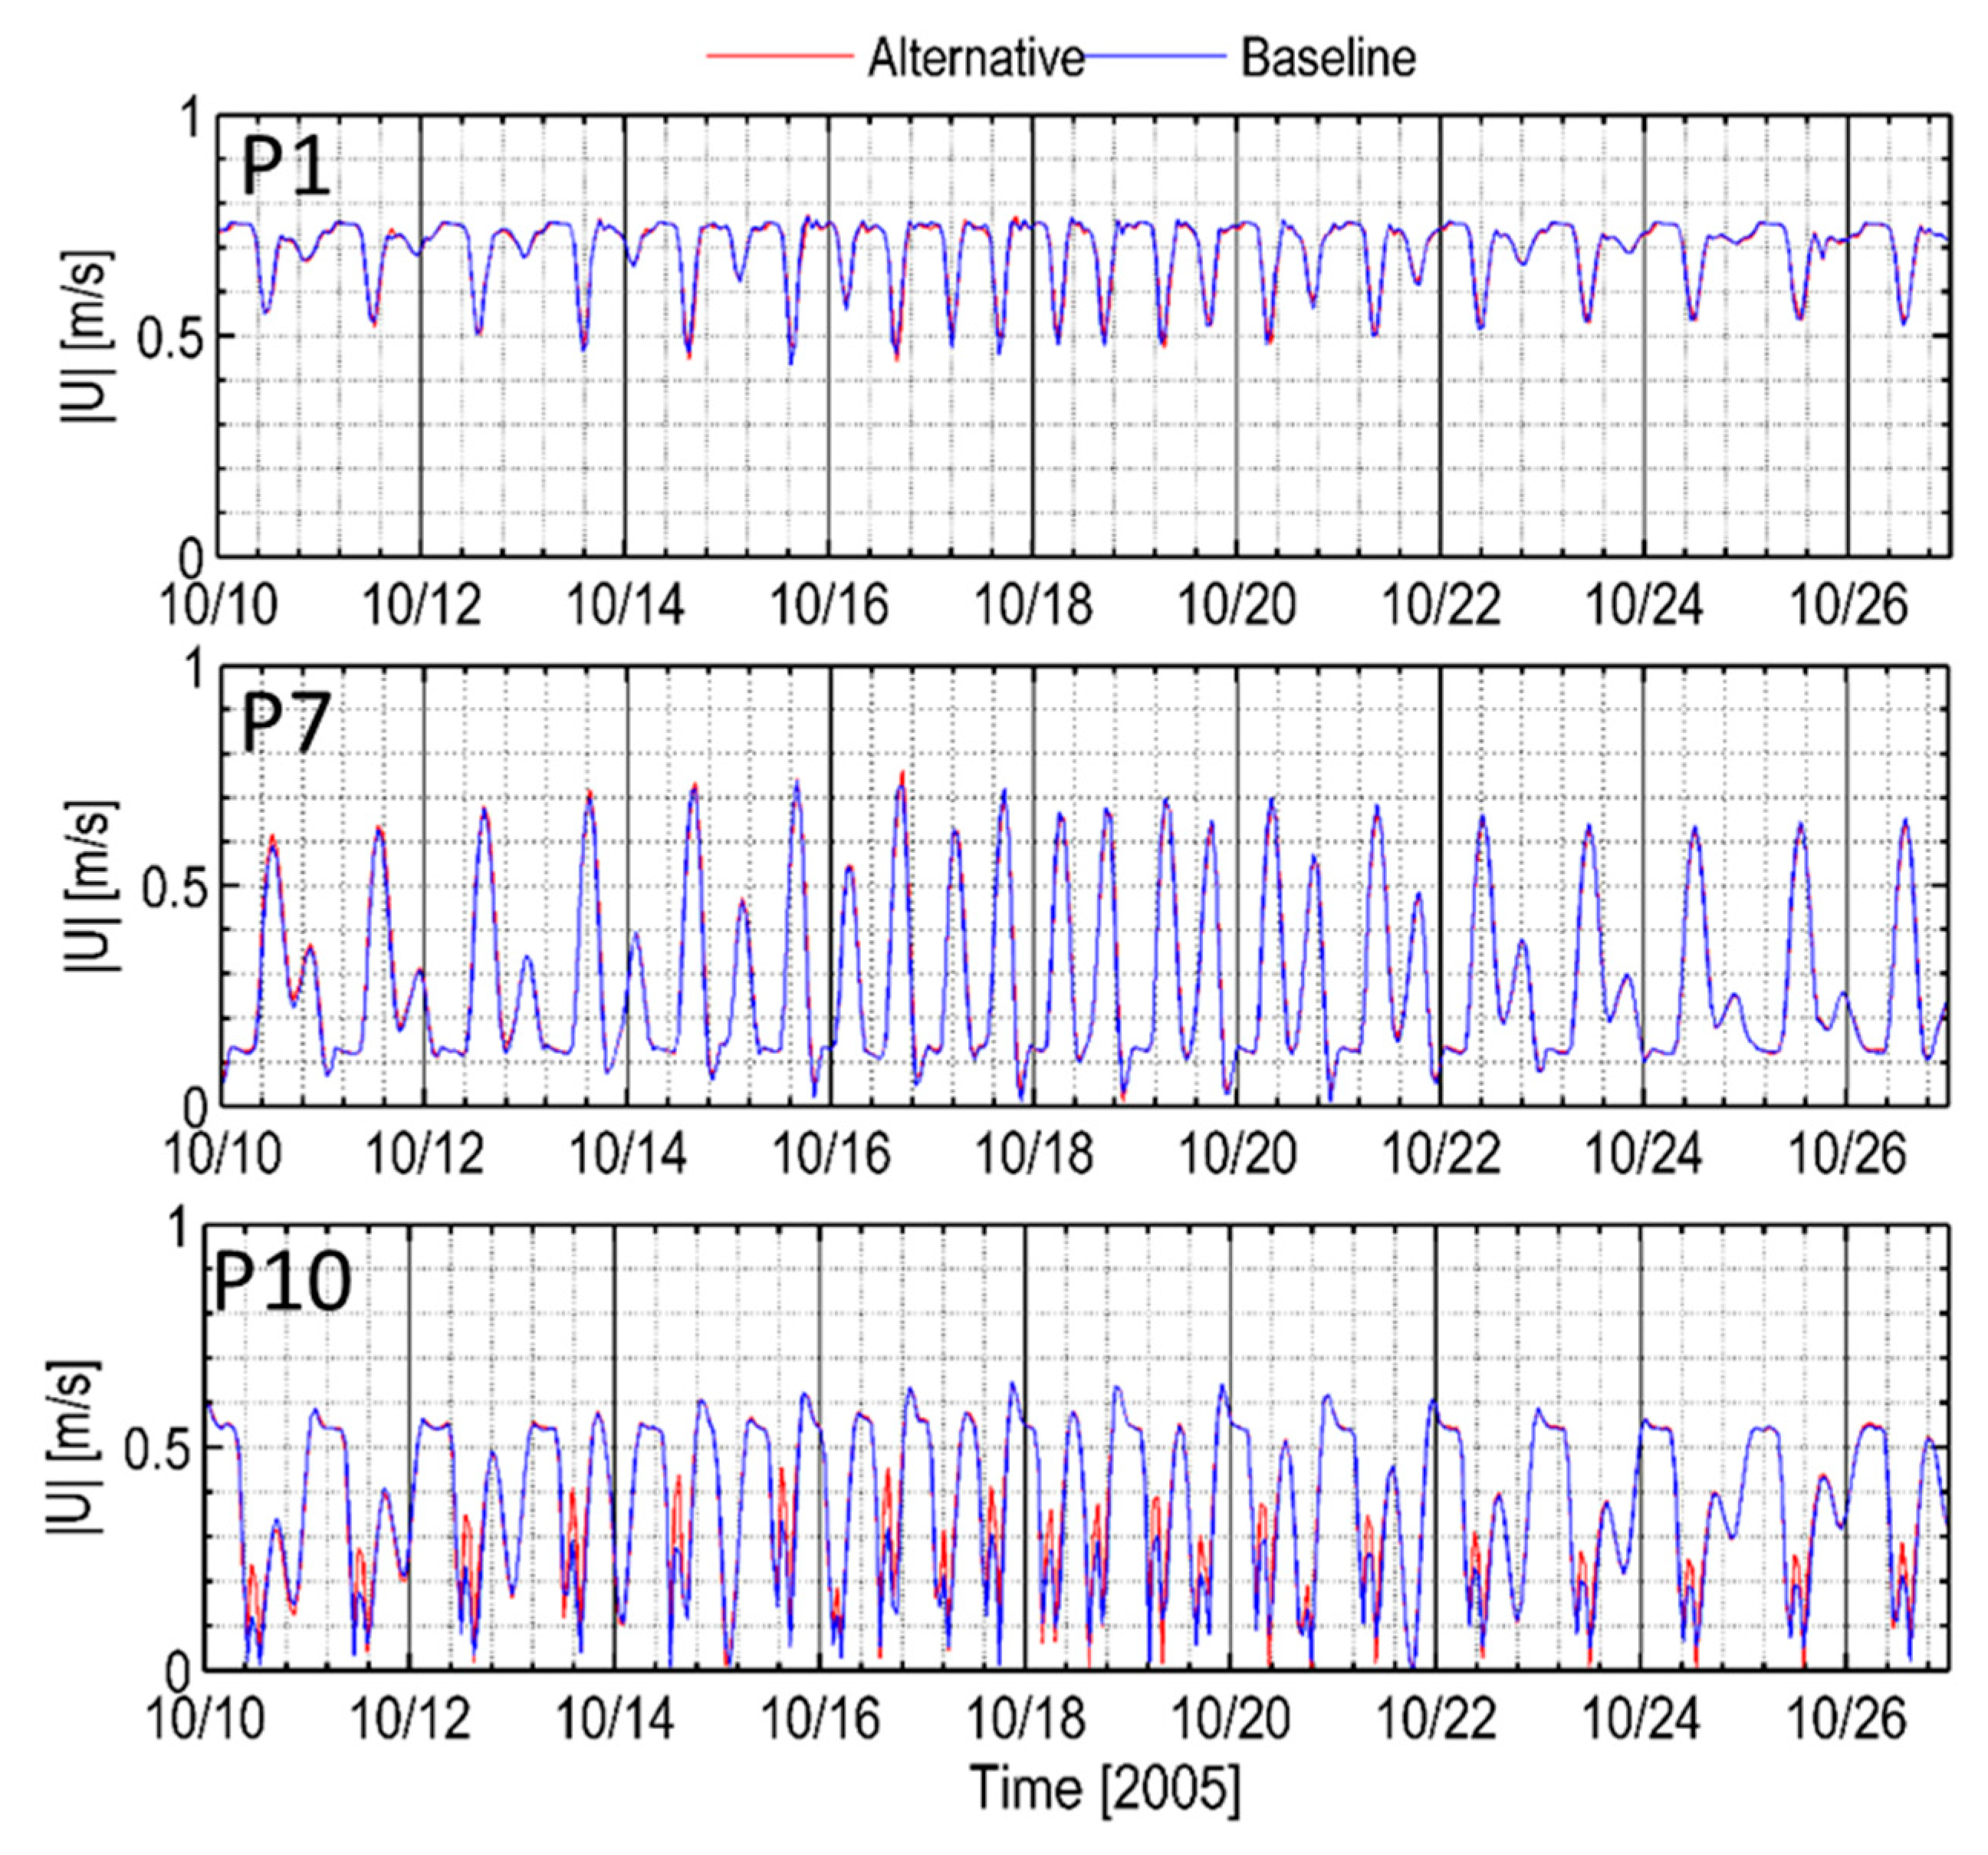
An examination of the time series results of predicted velocity magnitudes at Station P1 (ORSC), P7 (West Pass), and P10 (Port Susan) for the preferred restoration alternative scenario shows that the velocity magnitudes under high flows are relatively unchanged compared to the baseline scenario. Figure 15 shows that velocity magnitudes in West Pass and the lower OSRC in particular remained relatively unchanged under the preferred restoration alternative scenario relative to the baseline scenario. In South Pass, velocity magnitudes were predicted to be higher relative to the baseline scenario during peak flood period by ≈0.12 m/s and relatively little change is seen during ebb when peak velocities are nearly twice as high as those during the flood.
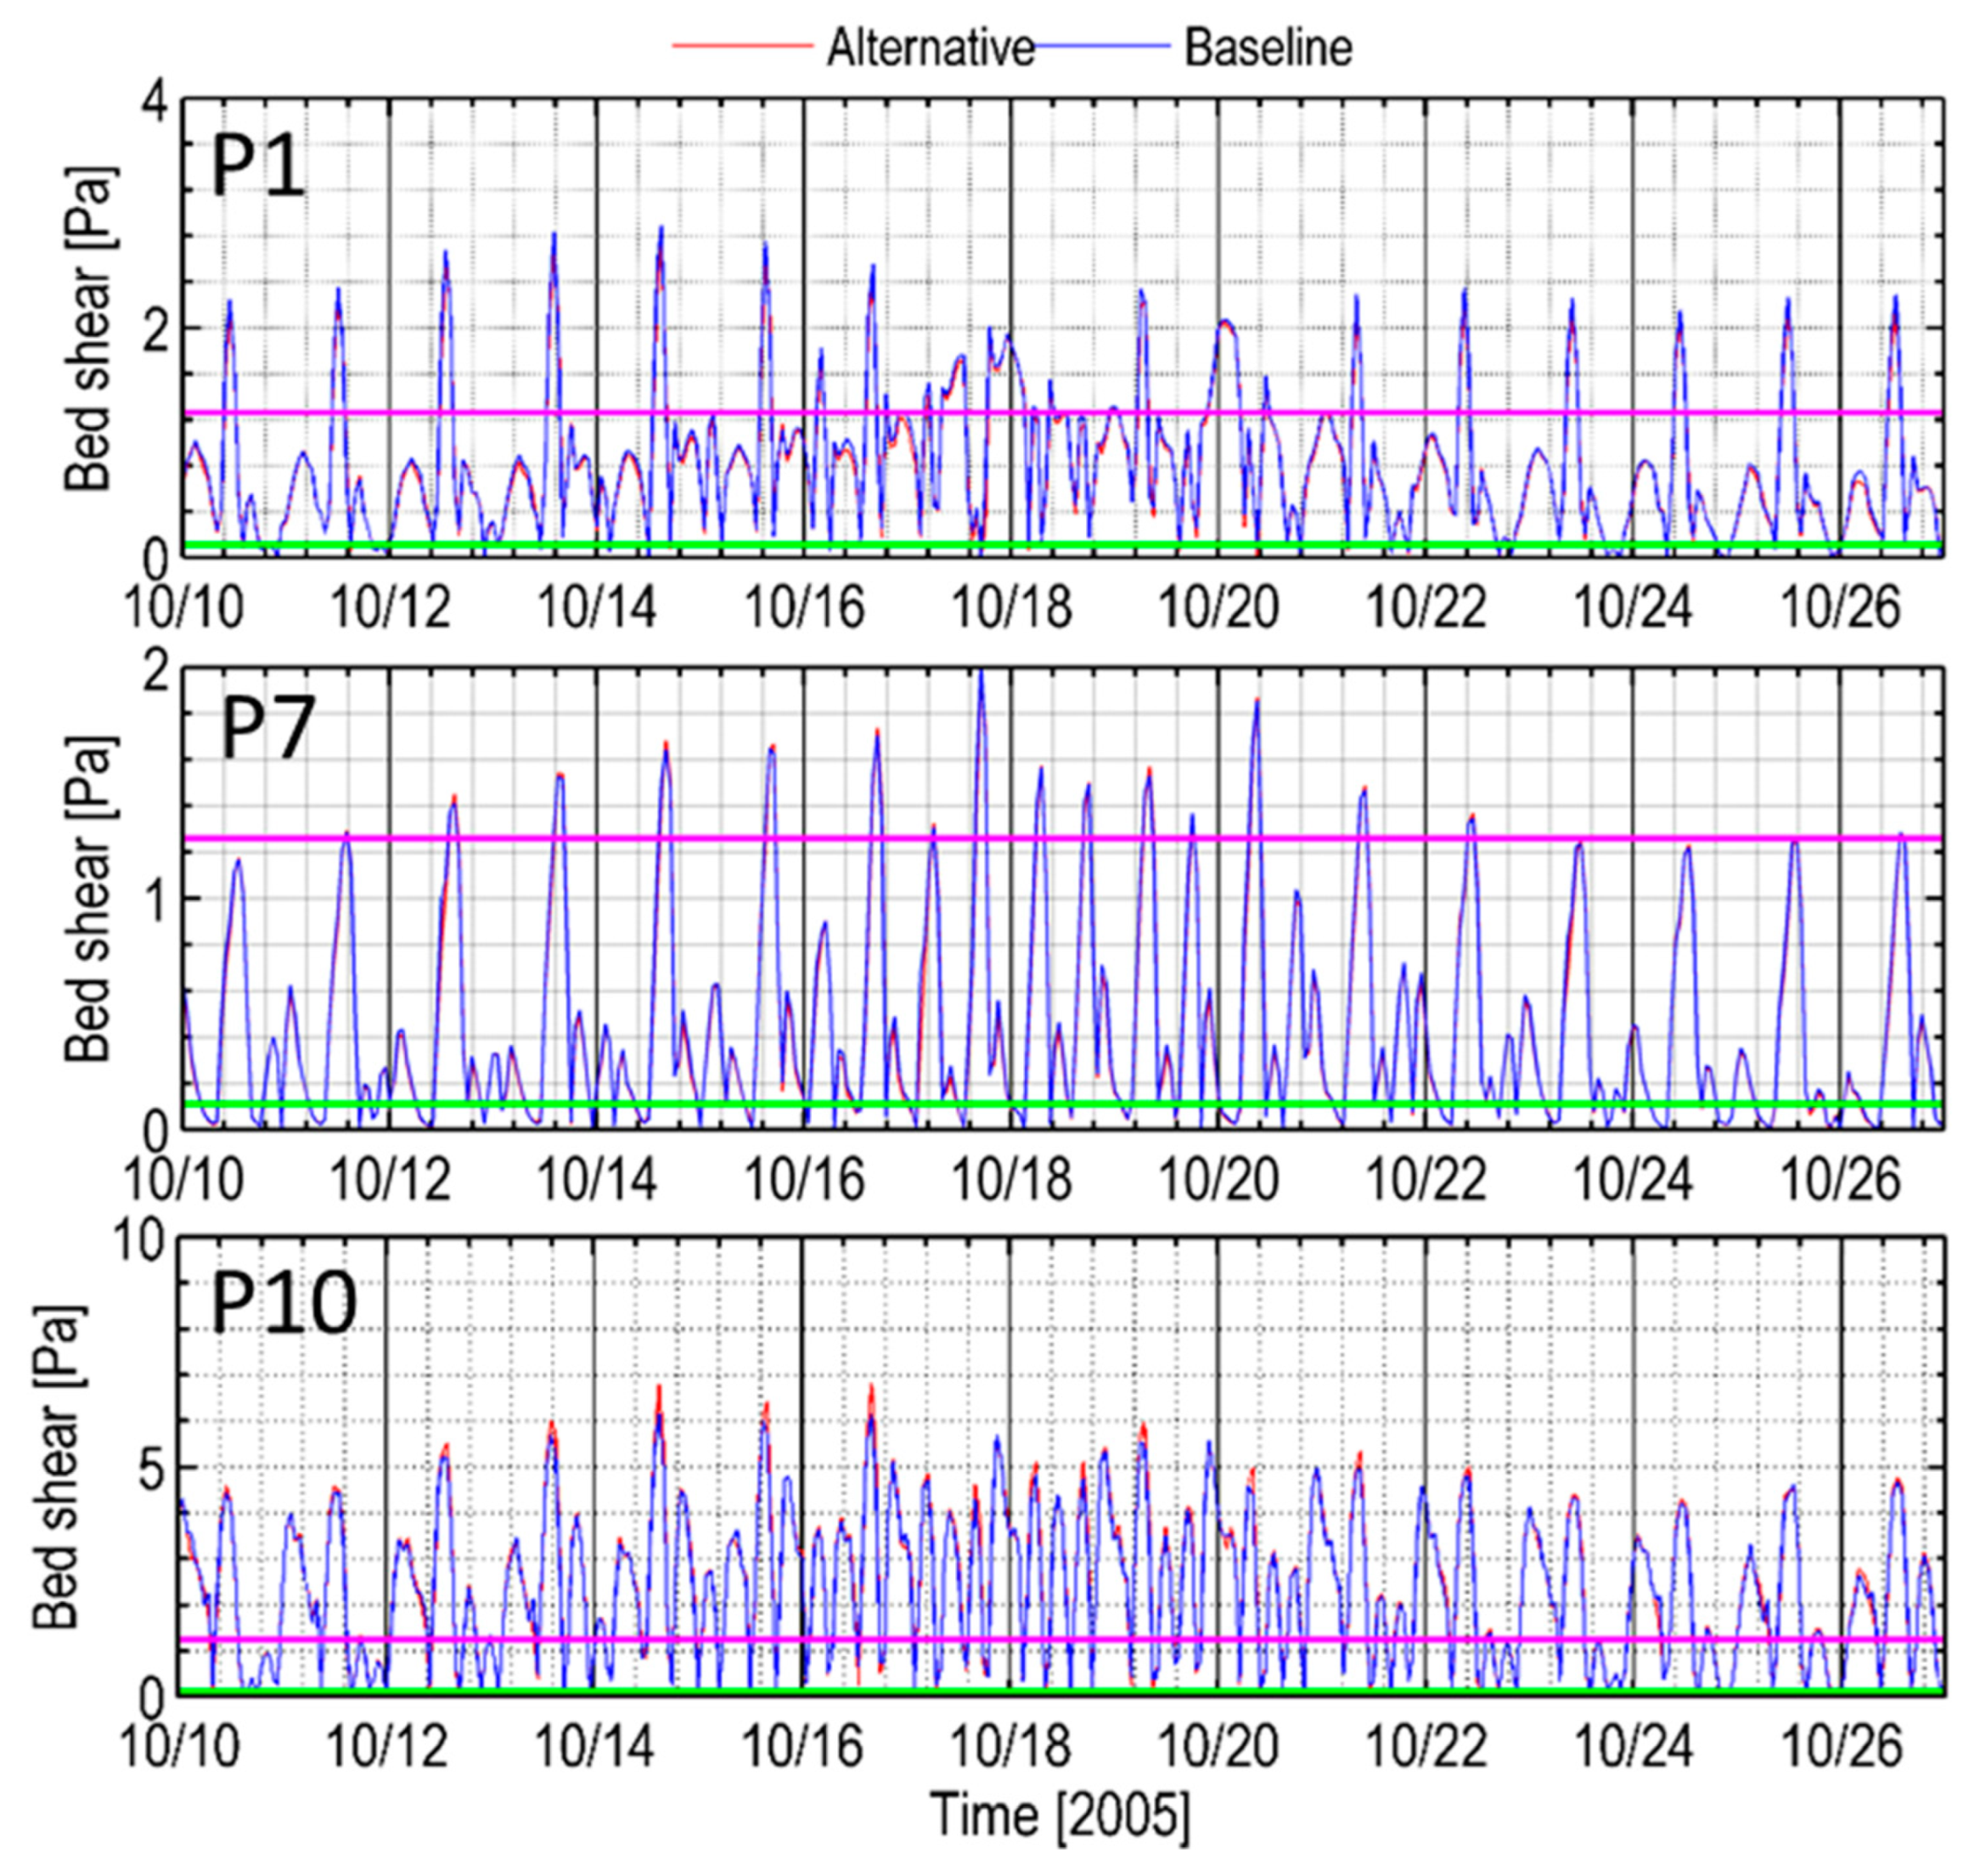
The time series of predicted bed shear stress at the same representative locations during high river flow are shown in Figure 16 for the baseline and preferred alternative scenarios. During the high-flow condition, under the preferred restoration alternative scenario, bed shear stress changes in West Pass and Old Stillaguamish River are relatively small with an average increase of 0.01 Pa. A higher bed shear stress increase of 1.5 Pa is predicted at South Pass station P10 relative to the baseline scenario during the flood period, but relatively little change is predicted during peak ebb, during which peak bed shear stress values reach as high as 7 Pa. These magnitudes, which were above the critical bed shear stress for sand and higher grain sizes in the baseline, were a little higher during the flood tidal period. This could result in an increased upstream movement of sediment during the flood tide.
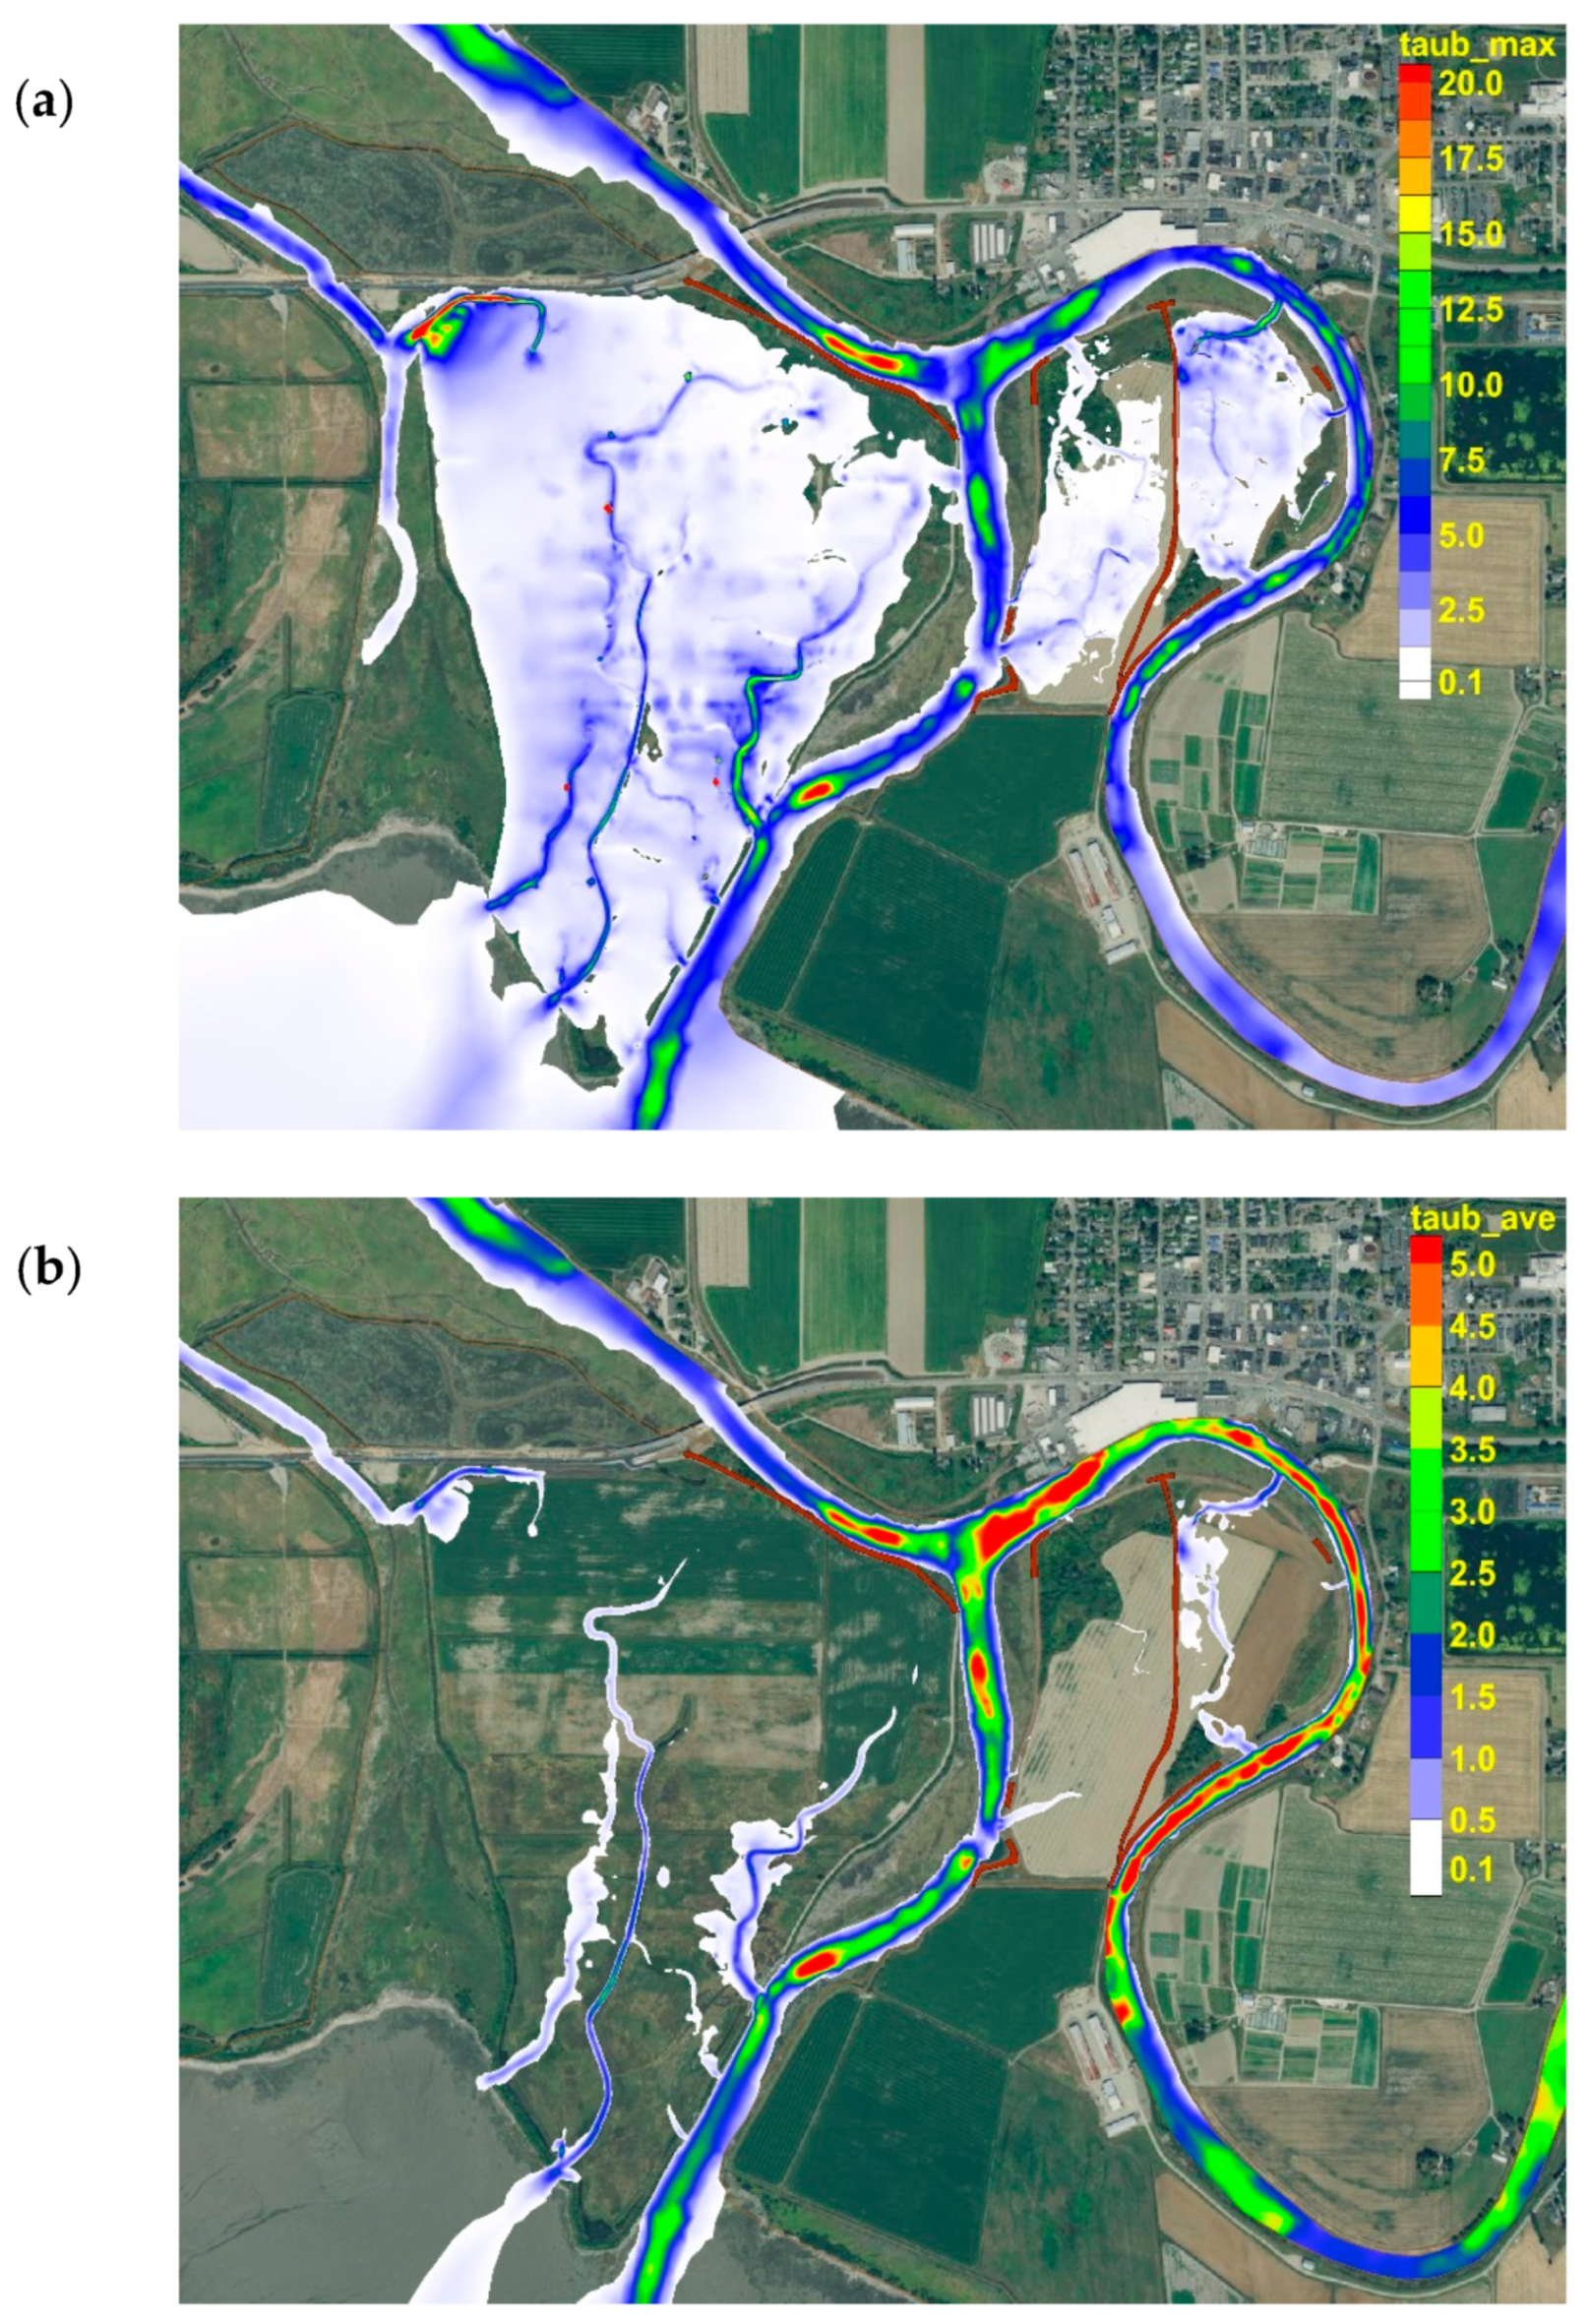
Figure 17 shows the horizontal distribution of maximum and mean bed shear stress for high-flow (bank-full) conditions at 750.62 m3/s. The simulated mean bed shear stress result shows that from Twin City Foods downstream to the river channel breach, bed shear stresses higher than 4.5 Pa are noted. This result indicates that the predicted bed shear stress is likely higher in the entire OSRC around zis a ba. The tidal channels over the restoration sites at Leque Island and zis a ba are predicted to experience bed shear stresses in the 1.5 Pa to 2.0 Pa range, which are lower than those predicted in the main river channels. However, bed shear stresses in the tidal channels are also above the critical bed shear stress for sand and gravel during high-flow conditions.
Figure 18 shows a mean bed shear stress difference plot for the preferred restoration alternative scenario and the baseline scenario. An increase in bed shear stress is predicted at most locations in West Pass and South Pass. A decrease in bed shear stress is noted in the OSRC section just east of zis a ba and between the mouths of the tidal channel from zis a ba. This decrease in bed shear is associated with a reduction in river channel flow due to the fraction that is diverted over the east zis a ba site. The presence of tidal channels could alter the bed shear stress in the West Pass and South Pass channels. An increase of up to 0.3 Pa of bed shear stress relative to the baseline can occur in West Pass and South Pass channels at these locations. This increase is small relative to the typical magnitude of bed shear stress, which is significantly higher than that needed for the movement of silt and sand and will not result in a significant increase in scour or channel widening.
Bed shear stress distributions in West Pass during high flow conditions are higher under the preferred restoration alternative scenario relative to the baseline scenario, which is opposite to the predictions for typical estuarine flow conditions. Unlike high-flow conditions, the creation of tidal channels and storage across eastern zis a ba leads to a slight increase in bed shear stress along the eastern bend of Old Stillaguamish River around zis a ba. Very little change is predicted in the bed shear stress upstream of the Twin Foods facility. Bed shear stresses at the Leque Island and zis a ba restoration sites are predicted to be highest near the mouth of the tidal channels. The entrance to the tidal channels will likely evolve until an equilibrium cross section is reached.
To facilitate quantitative comparison of scenarios, cumulative frequency statistics were generated for bed shear stress at the selected 11 stations.
Table 3 provides the percentage of the time that bed shear stresses exceed 0.11 Pa (i.e., sand erosion) at the 11 time series stations at the high-flow (bank-full) Condition. An examination of the time series of bed shear stress at stations in the Old Stillaguamish River (P1, P2, P4, P5, and P6) shows that bed shear stresses are not significantly different in the preferred restoration alternative scenario relative to those in the baseline scenario. Bed shear at these locations will be greater than 0.11 Pa (sand erosion) 100% of the time. Stations P10 and P11 (South Pass) experience bed shear stress exceeding 0.11 Pa roughly 80–90% of the time, which is lower compared to the Lower Old Stillaguamish River. The percentage of time that the bed shear stress exceeds 0.11 Pa are ≈ 60–80% at Stations P7 and P8 located in West Pass. Overall, the results indicate that the preferred restoration alternative scenario would increase the percentage of time for bed shear stress to exceed 0.11 Pa at West Pass and South Pass, while the Lower Old Stillaguamish River would experience the same condition in the percentage of time bed shear stress that exceeds 0.11 Pa. In summary, the increases in bed shear will ensure that sediment deposition is not predicted to be a problem; yet, the increases are small enough for increased scour also not to be likely, other than that predicted at the mouths of the tidal drainage channels at restoration sites.
4. Conclusions
A three-dimensional hydrodynamic model of Port Susan Bay, Skagit Bay, and the interconnecting region including the restoration sites at Leque Island and zis a ba region was developed to generate detailed quantitative oceanographic information for the preferred restoration alternative scenario as part of the restoration feasibility assessment. The effects of restoration involving combinations of creating tidal channels and the removal of sections of dikes from the Leque Island and zis a ba sites were evaluated and compared with baseline (i.e., existing) conditions. A series of hydrodynamic modeling simulations including a typical condition of October 2005 and a high-flow condition representing bank-full conditions were performed for both scenarios, and a set of parameters (i.e., water elevation, salinity, and bed shear stress) was evaluated to quantify the hydrodynamic response of the near-shore restoration project.
The model was first applied to existing conditions prior to restoration, representing the baseline scenario. The baseline simulation successfully reproduced coastal hydrodynamics in the intertidal region of interest in Port Susan Bay near the mouth of the Stillaguamish River, which is tidally dominated with large variations in water-surface levels (≈3 m range) and salinity (0 to 25 ppt). The baseline simulation also showed that the model results, especially water levels in the Stillaguamish River distributaries entering Port Susan Bay (Hatt Slough and OSRC), are sensitive to the respective distributary channel characteristics over the tidal flats in Port Susan Bay. The salinity levels and intrusion upriver near the project sites at Leque Island and zis a ba on the OSRC were also sensitive to the fraction of the fresh water split between Old Stillaguamish River and Hatt Slough.
Following validation, the model was applied to test the response of the preferred restoration alternative scenario at Leque Island and zis a ba for typical estuarine flow conditions and high-flow (bank-full) conditions. An examination of the simulation results for the typical estuarine flow conditions of October 2005 shows that the preferred restoration alternative scenario at Leque Island and zis a ba results in an immediate desired tidal response and the restoration of estuarine functions over the Leque Island and zis a ba project site, which were previously diked off and shielded from tidal exposure. In addition, the results show clearly that proposed actions will likely not cause a significant change in the hydrodynamic behavior of the estuary.
Simulations with the preferred restoration alternative also showed a small lowering in water-surface levels (≈0.01 m lower relative to the baseline scenario) in West Pass, South Pass, and OSRC stations. This result indicates that there is a small decrease in the pressure gradient relative to baseline conditions as the tidal prism is now distributed over the restored area. Under the preferred restoration alternative scenario, there are notable changes to salinity relative to the baseline scenario. The results indicate that proposed restoration will likely decrease the amount of seawater intrusion into the OSRC, West Pass and South Pass channels. As a result, predicted salinities in the preferred alternative scenario are ≈0.5 ppt lower than the baseline scenario in West Pass, South Pass, and the lower OSRC stations.
An examination of tidally averaged velocities and flows shows that the outflow of freshwater from OSRC primarily occurs through the South Pass during ebb, which also carries the majority of net outflow to Port Susan Bay and remains relatively unchanged in the preferred restoration alternative scenario. Results indicate that proposed restoration action will not result in significant changes in velocities at most locations. At the Leque Island and zis a ba restoration sites, bed shear stress is predicted to be highest near the entrances of the tidal channel that drain the sites. It is expected that the mouths of these tidal channel entrances will likely evolve until an equilibrium cross-section is reached.
The potential for erosion and flooding-related damage was examined using the bank-full river flow condition for the baseline and preferred alternative scenario. The results reflect the fact that the locations of the Leque Island and zis a ba restoration sites are near the river mouth. These sites are primarily dominated by the influence of tidal exchange flow and not significantly affected by changes in river flow. During high-flow (bank-full) conditions, the Leque Island and zis a ba sites also experienced increases in velocity magnitudes and bed shear stresses relative to typical flow conditions, especially in the main river channels. However, results for the preferred restoration alternative scenario show that the velocity magnitudes under high flows are relatively unchanged compared to the baseline scenario. In South Pass, velocity magnitudes were predicted to be higher relative to the baseline scenario during peak flood period by ≈0.12 m/s and relatively little change is seen during ebb when peak velocities are nearly twice as high as those during the flood. During the high-flow condition, under the preferred restoration alternative scenario, bed shear stresses in West Pass and South Pass are slightly higher.
Overall, simulation results indicate that the preferred restoration alternative scenario provides an estuarine response consistent with the planned design. The preferred restoration actions would result in relatively minor changes in water surface elevations and salinity in the OSRC surrounding the restoration sites. Because of changes in the tidal prism from increased storage and drainage from the restoration sites, minor changes in velocity magnitude and associated bed shear stresses are predicted. At most locations in the surrounding river channels, under typical flow conditions, there is a small reduction in bed shear stress and a small increase in bed shear stress near the mouths of tidal drainage channels from the restoration sites. These changes in bed shear are negligible relative to the typical magnitude of bed shear stress under baseline conditions, which is significantly higher than that needed for the movement of silt and sand. The overall conclusion based on the results is that tidal estuarine functions will be successfully restored at the Leque Island and zis a ba sites through the proposed actions and should lead to an increase in available tidal marsh area in the system. Also, the impacts on existing circulation and estuarine characteristics would be relatively small.
Author Contributions
Conceptualization, A.N. and T.K.; methodology, A.N. and T.K.; model development and validation, A.N.; formal analysis, A.N. and T.K.; writing—original draft preparation, A.N. and T.K.; writing—review & editing, A.N. and T.K.; project administration, T.K.
Funding
This research was funded by Ducks Unlimited, Inc. through CWFO Agreement No 69998 under contract DE-AC05-76RL01830.
Acknowledgments
The authors would like to thank The Nature Conservancy, Cardno, and Snohomish County for providing LIDAR survey, bathymetric survey, and oceanographic monitoring data for use in model development and validation. We also would like to thank; Jonathan Whiting of Pacific Northwest National Laboratory for providing information on bathymetry data and previous phase model assessment result. Steve Liske of Duck Unlimited Inc. who provided the designs for the Leque Island and zis a ba restoration project, background information, historic monitoring data; and Loren Brokaw of Washington State Department of Fish and Wildlife who provided direction and guidance for the assessment and helped facilitate numerous technical discussions and stakeholder meetings.
Conflicts of Interest
The authors declare no conflict of interest.
References
- Liu, J.G.; Dietz, T.; Carpenter, S.R.; Alberti, M.; Folke, C.; Moran, E.; Pell, A.N.; Deadman, P.; Kratz, T.; Lubchenco, J.; et al. Complexity of coupled human and natural systems. Science 2007, 317, 1513–1516. [Google Scholar] [CrossRef] [PubMed]
- Battin, J.; Wiley, M.W.; Ruckelshaus, M.H.; Palmer, R.N.; Korb, E.; Bartz, K.K.; Imaki, H. Projected impacts of climate change on salmon habitat restoration. Proc. Natl. Acad. Sci. USA 2007, 104, 6720–6725. [Google Scholar] [CrossRef] [PubMed] [Green Version]
- Scholz, N.L.; Myers, M.S.; McCarthy, S.G.; Labenia, J.S.; McIntyre, J.K.; Ylitalo, G.M.; Rhodes, L.D.; Laetz, C.A.; Stehr, C.M.; French, B.L.; et al. Recurrent die-offs of adult coho salmon returning to spawn in Puget Sound lowland urban streams. PLoS ONE 2011, 6, e28013. [Google Scholar] [CrossRef] [PubMed]
- Khangaonkar, T.; Sackmann, B.; Long, W.; Mohamedali, T.; Roberts, M. Simulation of annual biogeochemical cycles of nutrient balance, phytoplankton bloom(s), and DO in Puget Sound using an unstructured grid model. Ocean Dyn. 2012, 62, 1353. [Google Scholar] [CrossRef]
- Khangaonkar, T.; Nugraha, A.; Xu, W.W.; Long, W.; Bianucci, L.; Ahmed, A.; Mohamedali, T.; Pelletier, G. Analysis of hypoxia and sensitivity to nutrient pollution in Salish Sea. J. Geophys. Res. Ocean. 2018, 123, 4735–4761. [Google Scholar] [CrossRef]
- Khangaonkar, T.; Nugraha, A.; Hinton, S.; Michalsen, D.; Brown, S. Sediment transport into the Swinomish Navigation Channel, Puget Sound—Habitat restoration versus navigation maintenance needs. J. Mar. Sci. Eng. 2017, 5, 19. [Google Scholar] [CrossRef]
- Khangaonkar, T.; Nugraha, A.; Wang, T.P. Hydrodynamic zone of influence due to a floating structure in a Fjordal Estuary—Hood Canal Bridge Impact Assessment. J. Mar. Sci. Eng. 2018, 6, 119. [Google Scholar] [CrossRef]
- Yang, Z.; Wang, T.; Cline, D.; Williams, B. Hydrodynamic modeling analysis to support nearshore restoration projects in a changing climate. J. Mar. Sci. Eng. 2014, 2, 18–32. [Google Scholar] [CrossRef]
- Whiting, J.; Khangaonkar, T. Hydrodynamic Modeling Analysis for Leque Island and zis a ba Restoration Feasibility Study; Technical Report for United States Department of Energy, Document Number PNNL-24023; Pacific Northwest National Laboratory: Seattle, WA, USA, January 2015. [Google Scholar]
- Chen, C.; Liu, H.; Beardsley, R.C. An unstructured, finite-volume, three-dimensional, primitive equation ocean model: Application to coastal ocean and estuaries. J. Atmos. Ocean. Technol. 2003, 20, 159–186. [Google Scholar] [CrossRef]
- Hood, W.G. Conceptual Tidal Channel Design for the Leque Island Restoration Site; Technical Report; Skagit River System Cooperative: La Conner, WA, USA, June 2015. [Google Scholar]
- Yang, Z.Q.; Khangaonkar, T.; Lee, C. Hydrodynamic Modeling Analysis for Leque Island Restoration Feasibility Study; Technical Report for Ducks Unlimited, Inc., Document Number PNWD-3813; Pacific Northwest National Laboratory: Seattle, WA, USA, January 2007. [Google Scholar]
- Stillaguamish Tribe of Indians. Zis a ba Restoration Project Design; Technical Report 42445008; Cardno: Snohomish County, WA, USA, May 2016. [Google Scholar]
- Hood, W.G.; Skagit River System Cooperative, La Conner, WA, USA; Khangaonkar, T.; Pacific Northwest National Laboratory, Seattle, WA, USA. Personal communication, 2014.
- Julien, P.Y. Erosion and Sedimentation; Cambridge University Press: Cambridge, UK, 1998. [Google Scholar]
Figure 1.
(a) Location of the Leque Island and zis a ba sites in Whidbey Basin. (b) Schematic representation of (top) the baseline scenario and (bottom) the preferred restoration alternative scenario.
Figure 1.
(a) Location of the Leque Island and zis a ba sites in Whidbey Basin. (b) Schematic representation of (top) the baseline scenario and (bottom) the preferred restoration alternative scenario.

Figure 2.
(a) Baseline model grid of the Skagit and Stillaguamish River estuaries including Skagit Bay, Port Susan Bay, and the Leque Island and zis a ba. The inset shows detail the Leque Island and zis a ba project sites. (b) Oceanographic observation stations at Port Susan Bay, October 2005.
Figure 2.
(a) Baseline model grid of the Skagit and Stillaguamish River estuaries including Skagit Bay, Port Susan Bay, and the Leque Island and zis a ba. The inset shows detail the Leque Island and zis a ba project sites. (b) Oceanographic observation stations at Port Susan Bay, October 2005.

Figure 3.
Comparison of predicted and measured (a) water surface elevations and (b) salinity at the Kayak Point, Hatt Slough, and South Pass stations, respectively.
Figure 3.
Comparison of predicted and measured (a) water surface elevations and (b) salinity at the Kayak Point, Hatt Slough, and South Pass stations, respectively.

Figure 4.
Comparison of predicted and measured velocity components at the Hatt Slough (a) and South Pass (b) stations, respectively. Data is from mid-depth of the water column.
Figure 4.
Comparison of predicted and measured velocity components at the Hatt Slough (a) and South Pass (b) stations, respectively. Data is from mid-depth of the water column.

Figure 5.
Preferred alternative grid for the Leque Island site.

Figure 6.
Preferred alternative design (a) and grid (b) for the zis a ba site.

Figure 7.
Eleven station locations on the Leque Island and the zis a ba sites.

Figure 8.
(a) Baseline scenario grid overlaying the bed elevation map. (b) Preferred restoration alternative scenario grid overlaying the bed elevation map.
Figure 8.
(a) Baseline scenario grid overlaying the bed elevation map. (b) Preferred restoration alternative scenario grid overlaying the bed elevation map.

Figure 9.
Horizontal distribution of salinity at low tide (07:00: a) and high tide (13:00: b) for the baseline scenario on 24 October 2005.
Figure 9.
Horizontal distribution of salinity at low tide (07:00: a) and high tide (13:00: b) for the baseline scenario on 24 October 2005.

Figure 10.
Horizontal distribution of maximum (a) and mean bed shear stress in Pa (b) for the baseline scenario for the high-flow (bank-full) condition at 750.62 m3/s.
Figure 10.
Horizontal distribution of maximum (a) and mean bed shear stress in Pa (b) for the baseline scenario for the high-flow (bank-full) condition at 750.62 m3/s.

Figure 11.
Preferred vs. baseline scenarios: time series of Salinity at Station P1, P7, and P10 for typical estuarine conditions (October 2005).
Figure 11.
Preferred vs. baseline scenarios: time series of Salinity at Station P1, P7, and P10 for typical estuarine conditions (October 2005).

Figure 12.
Horizontal distribution of salinity at low tide (07:00: a) and high tide (13:00: b) for the preferred restoration alternative scenario on 24 October 2005.
Figure 12.
Horizontal distribution of salinity at low tide (07:00: a) and high tide (13:00: b) for the preferred restoration alternative scenario on 24 October 2005.

Figure 13.
Salinity difference contours of the preferred restoration alternative scenario relative to the baseline at low tide (07:00: a) and high tide (13:00: b) on 24 October 2005.
Figure 13.
Salinity difference contours of the preferred restoration alternative scenario relative to the baseline at low tide (07:00: a) and high tide (13:00: b) on 24 October 2005.

Figure 14.
Preferred vs. baseline scenarios: time series of bed shear stress at stations P1, P7, and P10 for typical estuarine conditions (October 2005). Critical bed shear for erosion of sand (0.11 Pa) and gravel (1.26 Pa) are marked as green and pink lines.
Figure 14.
Preferred vs. baseline scenarios: time series of bed shear stress at stations P1, P7, and P10 for typical estuarine conditions (October 2005). Critical bed shear for erosion of sand (0.11 Pa) and gravel (1.26 Pa) are marked as green and pink lines.

Figure 15.
Preferred vs. baseline scenarios: time series of velocity magnitude at Stations P1, P7, and P10 for bank-full conditions at 750.62 m3/s river flow (tides and wind corresponding to October 2005).
Figure 15.
Preferred vs. baseline scenarios: time series of velocity magnitude at Stations P1, P7, and P10 for bank-full conditions at 750.62 m3/s river flow (tides and wind corresponding to October 2005).

Figure 16.
Preferred vs. baseline scenarios: time series of bed shear stress at Stations P1, P7, and P10 for bank-full conditions at 750.62 m3/s river flow (tides and wind corresponding to October 2005). Critical bed shear for the erosion of sand (0.11 Pa) and gravel (1.26 Pa) is marked as green and pink lines.

Figure 17.
Horizontal distribution of maximum (a) and mean bed shear stress (b) for the preferred restoration alternative scenario for high-flow (bank-full) conditions at 750.62 m3/s.
Figure 17.
Horizontal distribution of maximum (a) and mean bed shear stress (b) for the preferred restoration alternative scenario for high-flow (bank-full) conditions at 750.62 m3/s.

Figure 18.
Mean difference bed shear stress contours of the preferred restoration alternative scenario relative to the baseline scenario at the high-flow (bank-full) condition at 750.62 m3/s.
Figure 18.
Mean difference bed shear stress contours of the preferred restoration alternative scenario relative to the baseline scenario at the high-flow (bank-full) condition at 750.62 m3/s.


Table 1.
Descriptions of the model scenarios at the Leque Island and zis a ba sites.
| Scenario | Leque Island | zis a ba |
|---|---|---|
| Baseline | Existing conditions | Existing conditions |
| Preferred alternative: full restoration at Leque Island and zis a ba sites | Partial removal of existing dike (retaining northeastern spur dike), creation of tidal channels, filling existing ditch and borrow area | Partial removal of existing dike, lowering the perimeter dike elevation, creation of tidal channels, construction of a berm, filling existing ditch and borrow area |
Table 2.
Model error statistics for water surface elevation, salinity, and velocity.
| Station | ME (m) | RMSE (m) | RME (%) |
|---|---|---|---|
| Tide: water surface elevation (m) | |||
| Kayak Point | −0.05 | 0.26 | 6.33 |
| Hatt Slough | −0.07 | 0.23 | 11.92 |
| South Pass | 0.00 | 0.24 | 7.27 |
| Salinity (ppt) | |||
| Kayak Point | 0.48 | 1.51 | 1.83 |
| Hatt Slough | −1.62 | 2.20 | 4.46 |
| South Pass | −2.81 | 4.38 | 5.71 |
| Velocity (m/s) | |||
| Hatt Slough (u) | −0.07 | 0.08 | 0.11 |
| South Pass (u) | 0.01 | 0.13 | 0.18 |
| Mean | −0.03 | 0.11 | 0.14 |
| Hatt Slough (v) | −0.04 | 0.19 | 0.24 |
| South Pass (v) | 0.01 | 0.03 | 0.04 |
| Mean | −0.01 | 0.11 | 0.14 |
Table 3.
Bed shear stress response for all scenarios.
| Location | Percentage of Time of Bottom Shear Stress [%] | |
|---|---|---|
| Alternative | Baseline | |
| >0.11 Pa (Sand) | >0.11 Pa (Sand) | |
| P1 | 100 | 100 |
| P2 | 100 | 100 |
| P3 | 100 | 100 |
| P4 | 100 | 100 |
| P5 | 100 | 100 |
| P6 | 100 | 100 |
| P7 | 66.91 | 63.91 |
| P8 | 75.27 | 75.25 |
| P9 | 4.89 | 1.95 |
| P10 | 90.77 | 89.48 |
| P11 | 85.68 | 79.15 |
© 2018 by the authors. Licensee MDPI, Basel, Switzerland. This article is an open access article distributed under the terms and conditions of the Creative Commons Attribution (CC BY) license (http://creativecommons.org/licenses/by/4.0/).
Share and Cite
MDPI and ACS Style
Nugraha, A.; Khangaonkar, T. Detailed Hydrodynamic Feasibility Assessment for Leque Island and Zis a Ba Restoration Projects. J. Mar. Sci. Eng. 2018, 6, 140. https://doi.org/10.3390/jmse6040140
AMA Style
Nugraha A, Khangaonkar T. Detailed Hydrodynamic Feasibility Assessment for Leque Island and Zis a Ba Restoration Projects. Journal of Marine Science and Engineering. 2018; 6(4):140. https://doi.org/10.3390/jmse6040140
Chicago/Turabian StyleNugraha, Adi, and Tarang Khangaonkar. 2018. "Detailed Hydrodynamic Feasibility Assessment for Leque Island and Zis a Ba Restoration Projects" Journal of Marine Science and Engineering 6, no. 4: 140. https://doi.org/10.3390/jmse6040140
Note that from the first issue of 2016, this journal uses article numbers instead of page numbers. See further details here.