Onset of Motion of Sediment underneath Scour Protection around a Monopile

DHI, Agern Allé 5, 2970 Hørsholm, Denmark
*
Author to whom correspondence should be addressed.
†
These authors contributed equally to this work.
J. Mar. Sci. Eng. 2018, 6(3), 100; https://doi.org/10.3390/jmse6030100
Submission received: 14 June 2018
/
Revised: 11 August 2018
/
Accepted: 24 August 2018
/
Published: 29 August 2018
(This article belongs to the Special Issue Offshore Wind Structures)
Abstract
:The stability of scour protections is, potentially, an important issue during the design of fixed foundations for offshore wind turbines. One of the failure mechanisms observed at placed scour protection around offshore foundations is suction of sediment through the scour protection and subsequent sinking of the scour protection. Incipient motion of sediment and the initiation of suction underneath scour protections around piles in the marine environment were studied under waves, current and combined waves and current conditions. The motion of a thin layer of sediment underneath the scour protection was studied through the glass bottom of the test flume, which provided a clear view of the initiation of the motion of the sediment. The results show that the mobility depends on the Keulegan–Carpenter () number for the pile, the ratio between waves and current flow and the ratio between the thickness of the scour protection and the base sediment. The critical mobility number is smaller for the wave-dominated situation compared to current-dominated conditions, which again are smaller than for combined waves and current conditions. Consequently, larger -numbers cause larger critical mobility numbers than smaller -numbers. Design diagrams are presented for the threshold of incipient motion of sediment underneath a scour protection in waves, current and combined waves and current.
1. Introduction
Over the last few decades, offshore wind energy has become an important source of energy supply. During the same period, the construction of offshore wind farms has moved from protected near-shore locations (e.g., inner Danish waters) to highly exposed locations tens of kilometers offshore (e.g., the North Sea), in some cases even 100–200 km offshore. Consequently, the design and installation of offshore wind farms are more complex and comprehensive as they depend on several parameters such as water depth, metocean design conditions and soil conditions, to mention a few. Although the conditions at the different locations have become more diverse and complex, the cost of energy from offshore wind has decreased rapidly over the last decade. However, there is still room for optimization of the key components of the structure, including the foundation, which may be monopiles driven into the seabed at up to around a 40–50 m water depth. These optimizations have to be materialized to ensure that offshore wind energy will be competitive compared to other sources of energy.
One way to reduce the costs (CAPEX and OPEX) of offshore wind energy is by improving the management of local scour at the foundations. The CAPEX costs can be reduced by an improved design allowing less offshore operations and materials. The coastal sediments in the areas, where the foundations are installed, are often fine sand or silt, making the seabed very mobile and subject to severe scour.
Scour around unprotected foundations such as monopiles has been studied extensively over the years, and the findings have been compiled and discussed in the books of Breusers and Raudkivi [1], Hoffmans and Verheij [2], Whitehouse [3], Melville and Coleman [4] and Sumer and Fredsøe [5]. Recently, Sumer et al. [6] added data on back-filling to this knowledge base. Most of the material in these books and the papers is based on physical model tests, but during little more than a decade, numerical studies have been added: Roulund et al. [7], Liu and Garcia [8], Kirkil et al. [9], Zhao et al. [10], Khosronejad et al. [11] and Baykal et al. [12].
Offshore wind turbine foundations are usually protected by a scour protection, typically placed graded rock. The placed rock can protect against the removal of the surrounding seabed, and a well-designed scour protection system secures short-term and long-term stability of the foundation structure itself and the secondary structures such as array cables. The design of a scour protection system should cover three failure modes: (1) instability of cover stones due to hydrodynamic loading; (2) subsidence of the scour protection into the seabed due to suction removal of the base sediment through the voids of the stone material; and (3) the loss of stones at the periphery of the scour protection caused by edge scour. It should be noted that some changes due to the three failure modes (dynamic design) may be acceptable and in some cases even beneficial, e.g., in the case of a falling apron and edge scour. In all cases, changes to a scour protection related to the three failure modes should be limited and within the limitations provided in the design to ensure that the development is acceptable for the entire structure. It should be mentioned that foundations without scour protection are seen when metocean and soil conditions allow for this; however, this will often require longer piles.
Field investigations of scour protections over longer periods (years) have been reported by Hansen et al. [13], Raaijmakers et al. [14,15], Bolle et al. [16], Whitehouse et al. [17], Nielsen et al. [18] and Petersen et al. [19], among others, and these studies reveal the dynamic response of the scour protections to the mentioned failure modes. Some cases of deformation were expected from design considerations, while others involved significant settlements, and costly repair measures of the scour protections have been made to ensure the structural stability of the foundations. These studies have also, in some cases, confirmed the results from physical model tests, while in other cases, revealed the need for additional tests for better understanding of the processes in and around the scour protections.
The considerable cost of a scour protection system and the observed failure in field applications have been the basis of several research studies to explain the failure of scour protections and ultimately optimize future scour protection designs.
The first studies of the stability of scour protections around piles originated from bridge scour in river hydraulics, where several empirical criteria exist such as Wörman [20], Chiew [21], Hoffmans and Verheij [2] and May et al. [22]. The stability of scour protections in the marine environment involves also the hydrodynamic loading by waves and combined waves and current. The failure mechanisms have been presented by Chiew [21], Chiew and Lim [23], Lauchlan and Melville [24], De Vos et al. [25,26], Nielsen et al. [27,28,29], Sumer and Nielsen [30] and Petersen et al. [19,31]. As in the case of unprotected monopiles, numerical models to predict the dynamic response of a scour protection over long time spans have been presented and validated against field measurements; see Petersen and Nielsen [32].
The present study aims at improving the knowledge of the second failure mode of scour protection, where the sediment underneath the scour protection is mobilized and sucked out through the overlaying scour protection. The process of incipient motion of sediment underneath the scour protection is studied in order to determine the onset of motion for the case of current, waves and combined waves and current. Data are collected to establish design diagrams.
2. Experimental Setup
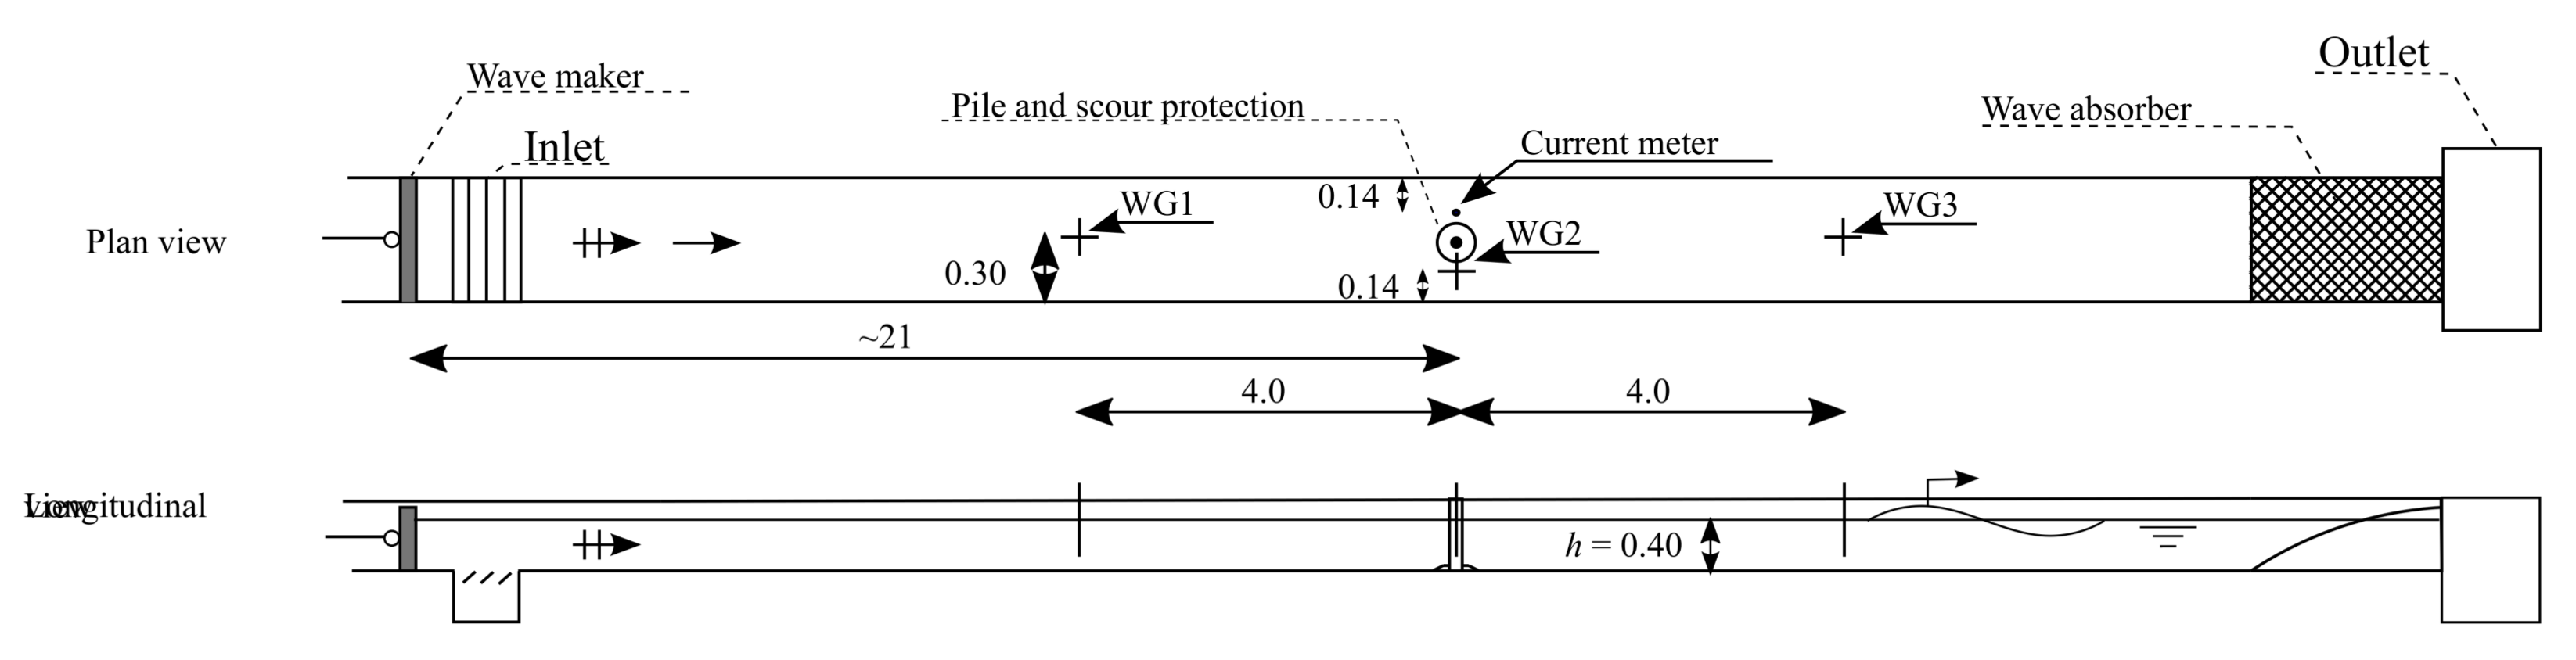
The experiments were conducted in a combined wave and current flume. The flume was 0.6 m wide, 0.8 m deep and 35 m long (excluding inlets and outlets). A sketch of the flume is shown in Figure 1.
The flume was equipped with a recirculation pump with a capacity of up to 0.5 m/s and a piston-type wavemaker capable of generating waves higher than 10 cm with periods in the range from 1.0–3.5 s.
The current velocities were measured using a 3-cm diameter propeller manufactured by OTT placed 0.37 of the water depth above the bottom. In addition to the propeller, the current flux was measured using a magnetic flowmeter installed in the return pipe of the flume. The current velocity in the flume was calibrated undisturbed, without pile and scour protection, at the position of the pile. During this calibration, the velocity profile was measured by moving the propeller to different elevations; the current profile was found to be logarithmic. The propeller was placed at the center of the pile during the calibration.
Regular waves were used in the wave-alone and combined wave and current experiments, and they were generated by a programmable piston-type of wave generator placed in the far-offshore end of the flume. The wavemaker in the wave flume was controlled by a DHI Wave Synthesizer with AWACS Version 2.15 (Active Wave Absorption Control System, DHI, Hørsholm, Denmark). This made it possible to generate desired incident waves and absorption of the associated reflected waves. The AWACS system was active during all wave tests including combined waves and current tests and was found to work as desired under all the applied conditions. A wave absorber, of the Dutch-beach type, was placed in the onshore end of the flume to handle reflection. The wavemaker was calibrated prior to the tests without monopile and scour protection in the flume.
Three conventional resistance-type wave gauges were used to monitor the surface elevation. Wave Gauge 1 (WG1) was placed upstream of the pile; WG2 was placed at the pile between the pile and the wall; and WG3 was placed downstream of the pile. The accurate positions of the wave gauge are seen in Figure 1. Note that WG2 was placed at the center position of the pile during the calibration of the wave maker, before the installation of the pile. The orbital velocity in the waves was calculated based on linear wave theory and the wave heights from the time series of surface elevation obtained from the measurements obtained from WG2; note that no disturbance was observed when comparing wave heights with and without the pile.
The pile, with a diameter cm, was placed directly on the glass base bottom of the flume and glued to it to ensure that no water passed between the inside and outside of the pile. The pile diameter was selected to accommodate a reasonable range of: (1) the stone-size-to-pile-size ratio (); (2) the boundary-layer-to-pile-size ratio ( or in the case of a fully-developed boundary layer) in the case of current-alone tests; and (3) the Keulegan–Carpenter number () for the pile in the case of waves and combined wave and current tests.
Scour protection consisting of stones was placed in a circle at the base of the pile. The scour protections consisted of crushed angular stones of sizes ( mm and mm) and 11.0 mm ( mm and mm); both types of material used for scour protection were narrow graded with (in which ).
The width of the scour protection was cm, enabling a berm-width-to-pile-size ratio of the test series . The height of the scour protection berm was , 23 and 30 mm.
3. Procedure for Evaluation of the Onset of Motion
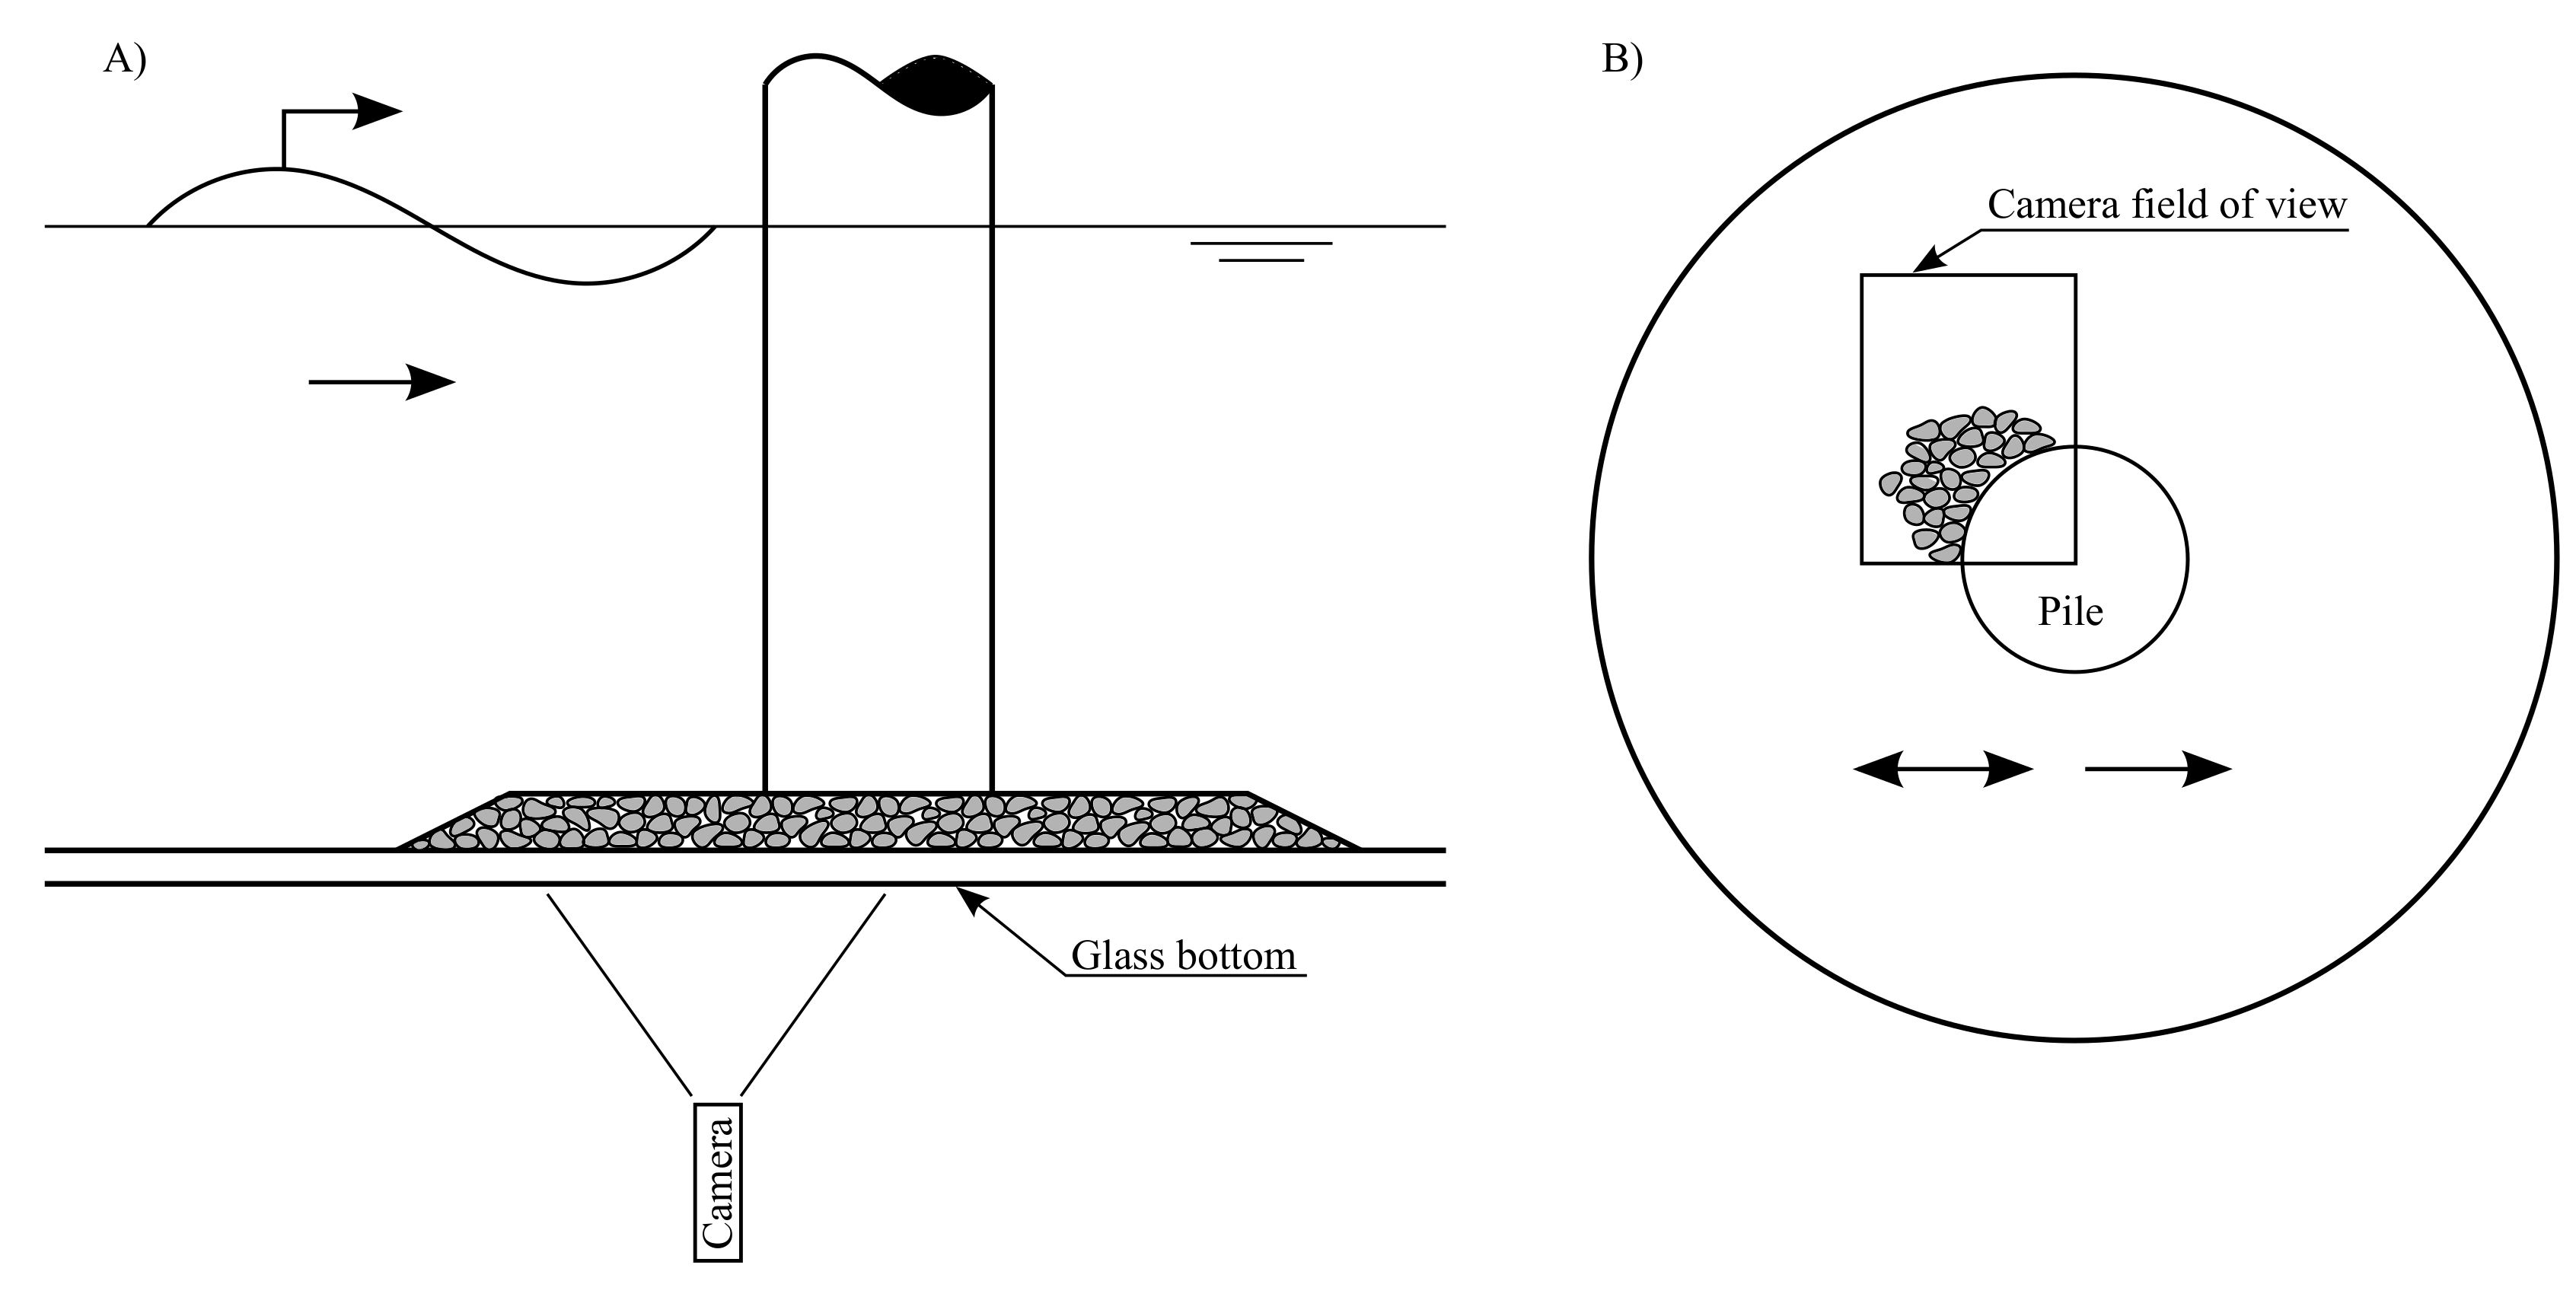
The motion of the sediment beneath the scour protection was observed through the glass bottom of the flume. A thin layer of sediment (0.5–1 mm) was placed around the pile, and the scour protection was installed on top of this before the flume was filled. The thin layer of sediment could easily be removed when the critical value was reached, and the development of a spot without sediment could be seen through the glass bottom of the flume. The sediment underneath the scour protection was video recorded through the glass bottom during the tests. This procedure was similar to the procedure applied by Nielsen et al. [28]; however, that study was based on observations of single particles placed in single pores in between the stones. This allowed a more detailed view of the trajectory of the particle; motion was defined as the particle being moved to another pore or trapped in between one of the stones forming the pore and the bottom of the flume. Such a detailed view of the trajectories of individual particles was not possible in the present study. On the other hand, the present procedure provided a better spatial view of the process as all pores were covered by sediment and therefore used in each test. Regardless, the results (see Figure 5) showed that the two methods gave almost identical results. The smooth glass bed of the flume could cause sliding of the sediment en masse; however, this was not observed during the tests. Furthermore, the very thin layer of sediment on the base bottom of the flume did not represent the actual conditions in the field as the base bottom did not allow any flow through it. However, the effect of the flow through the base sediment was very limited: Burcharth and Andersen [33] presented the following equation for flow in porous media:
where I is the pressure gradient (adverse pressure gradient from the cylinder, set to 0.3), is a coefficient (set to 240 for sand and 0 for the stones assuming fully-turbulent flow [33]), n is the porosity (set to 0.4), is the kinematic viscosity (set to m/s), g is the acceleration due to gravity (9.81 m/s), d is the grain size (set to 0.2 mm for sand and 10 mm for stones), V is the discharge velocity of the water and is a coefficient set to zero for sand (assuming fully-laminar flow) and 3.6 for the stones [33]. Solving Equation (1) using these numbers shows that discharge velocity through the sand will be less than 0.1 mm/s or more than 100-times smaller than the flow through the stones. Based on this, it can be concluded that the effect of the impermeable bottom in the flume was neglectable.
The onset of motion was determined by gradually increasing the loading. In the case of current, the velocity was increased in small steps of around 2 cm/s, which was the smallest velocity step practically achievable. Each velocity step was kept constant for at least 2 min, which was found to be sufficient to reach steady state conditions during a sensitivity test. The sediment was observed visually and the motions recorded on video, as previously mentioned, during this period. The sensitivity test was made in a similar way as the actual tests, but with a longer duration (5 min) at each velocity step. The sensitivity test showed that the sediment reacted very quickly (clearly visible within 30–45 s) to the change in the flow conditions, while no movements were observed after a long duration at milder flow conditions.
The wave tests were conducted in a similar manner using regular waves; the wave height was increased while the wave period was kept constant. The wave height was increased by approximately 0.5–1.0 cm, and each wave height step consisted of 40 waves during which the mobility of the stones in the scour protection was observed.
For the combined wave and current tests, the current and wave period was kept constant, while the wave height was gradually increased as for the wave-alone tests. This was done, as a change in current velocity would change the water level.
4. Test Conditions
Table 1, Table 2 and Table 3 summarize the test conditions for the current, waves and combined wave and current tests, respectively. The main results are included in the tables, as well. Some parameters are kept constant throughout the tests: the diameter of the monopile, , was constant at 5 cm; the horizontal extension of the scour protection (overall outer diameter) was constant at cm; the water depth, h, was constant at 40 cm; and the relative density, s, of the sediment was kept constant at 2.65.
Table 1 comprises the following parameters and results: is the median diameter of the stones and the scour protection; is the median size of the sediment under the scour protection; is the thickness of the scour protection; is the critical depth-averaged-current velocity for onset of motion; is the critical non-dimensional mobility number defined as:
is, together with , proportional to the pressure gradient caused by the approached velocity and driving the flow in the scour protection. is the size of the stones directly on the seabed and proportional to the pore size of these; they represent the hydraulic friction in scour protection. It should be noted that the mobility number defined above is similar, but simplified compared to the mobility number used by Nielsen et al. [28], where a term taking the porosity of the scour protection into account was included. However, the porosity of the stones is largely constant and very often unknown in the design phase; for this reason, omitted in the present definition.
Where the mobility number represents the local conditions at the seabed underneath the scour protection, represents the scour protection as a whole. The thickness of the scour protection is, in relation to suction, the most important parameter describing the entire scour protection. It represents the hydraulic friction of the entire scour protection, together with in the mobility number.
The critical Reynolds number for the sediment grains, , is defined as:
where is the kinematic viscosity of the water ( m/s).
In Table 2, is the wave height between the measured crest and trough level of the regular waves during the tests, and T is the wave period. Note that the wavemaker was calibrated without the monopile installed, as well as during the tests. It was found that the influence of the pile on the surface elevation was neglectable at the point of measuring, and for this reason, the measured waves from the tests were reported. is the critical mobility number defined as:
where is the maximum undisturbed orbital wave velocity at the bed calculated using small amplitude linear wave theory:
in which k is the wave number obtained from the dispersion relation:
where is the angular wave frequency, , and g is the gravitational acceleration. in Equation (5) is the critical wave height where the motion of the cover stones was observed.
The -number is defined as:
The Reynolds number, , associated with the critical mobility number is defined equivalently to the steady current case.
and in Table 3 are the critical mobility number and wave-current ratio, respectively, and defined as:
and:
The critical Reynolds number is defined equivalently to the wave and the current cases.
5. Results
5.1. Effect of Waves
Figure 3 shows the critical mobility number, , for the case of waves alone, as a function of the relative thickness of the scour protection, . The mobility depends on the Keulegan–Carpenter number (-number) and the thickness of the scour protection relative to the size of the base material. The critical mobility number increases for large -numbers (more current like motion). This is expected as waves tend to mobilize sediments at lower velocities and bed shear stresses compared to steady current. Furthermore, the very low -numbers do not allow the development of the horseshoe vortex; see, e.g., Sumer and Fredsøe [5]. Furthermore, the critical mobility number increases for a relatively thicker scour protection. A thicker scour protection can be expected to provide a better cover of the base sediment.
5.2. Effect of Combined Waves and Current
Figure 4 shows the critical mobility as a function of the current-to-wave ratio represented by the -number. The main point of interest is the fact that the critical mobility is higher in the cases of combined waves and current compared to both waves and current alone. A similar phenomenon was observed by Dixen et al. [34] in the case of the seabed protected by stones without a monopile. Dixen et al. [34] suggested that this is linked to the reduced near-bed velocity in current-dominated regimes of combined wave and current flow; see also Fredsøe et al. [35].
5.3. Effect of Current, Waves and Combined Waves and Current
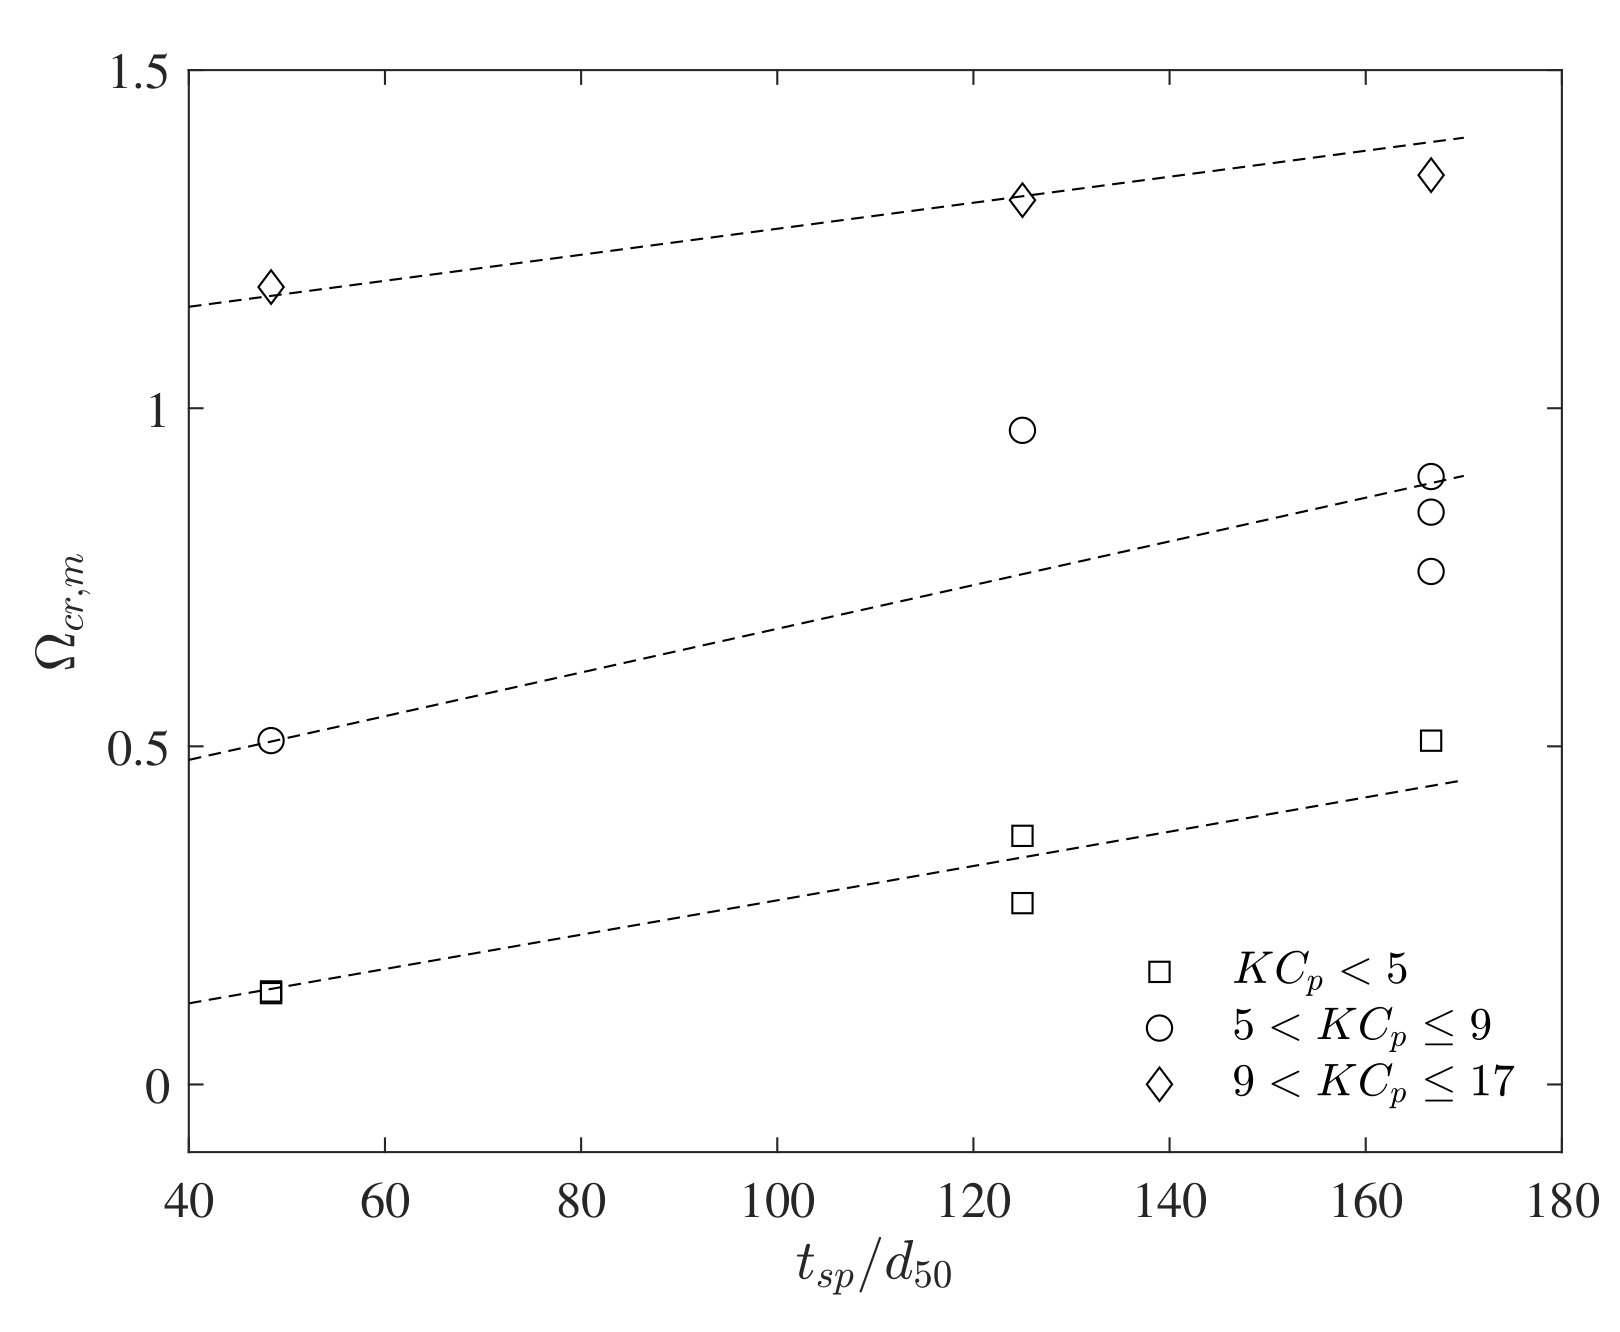
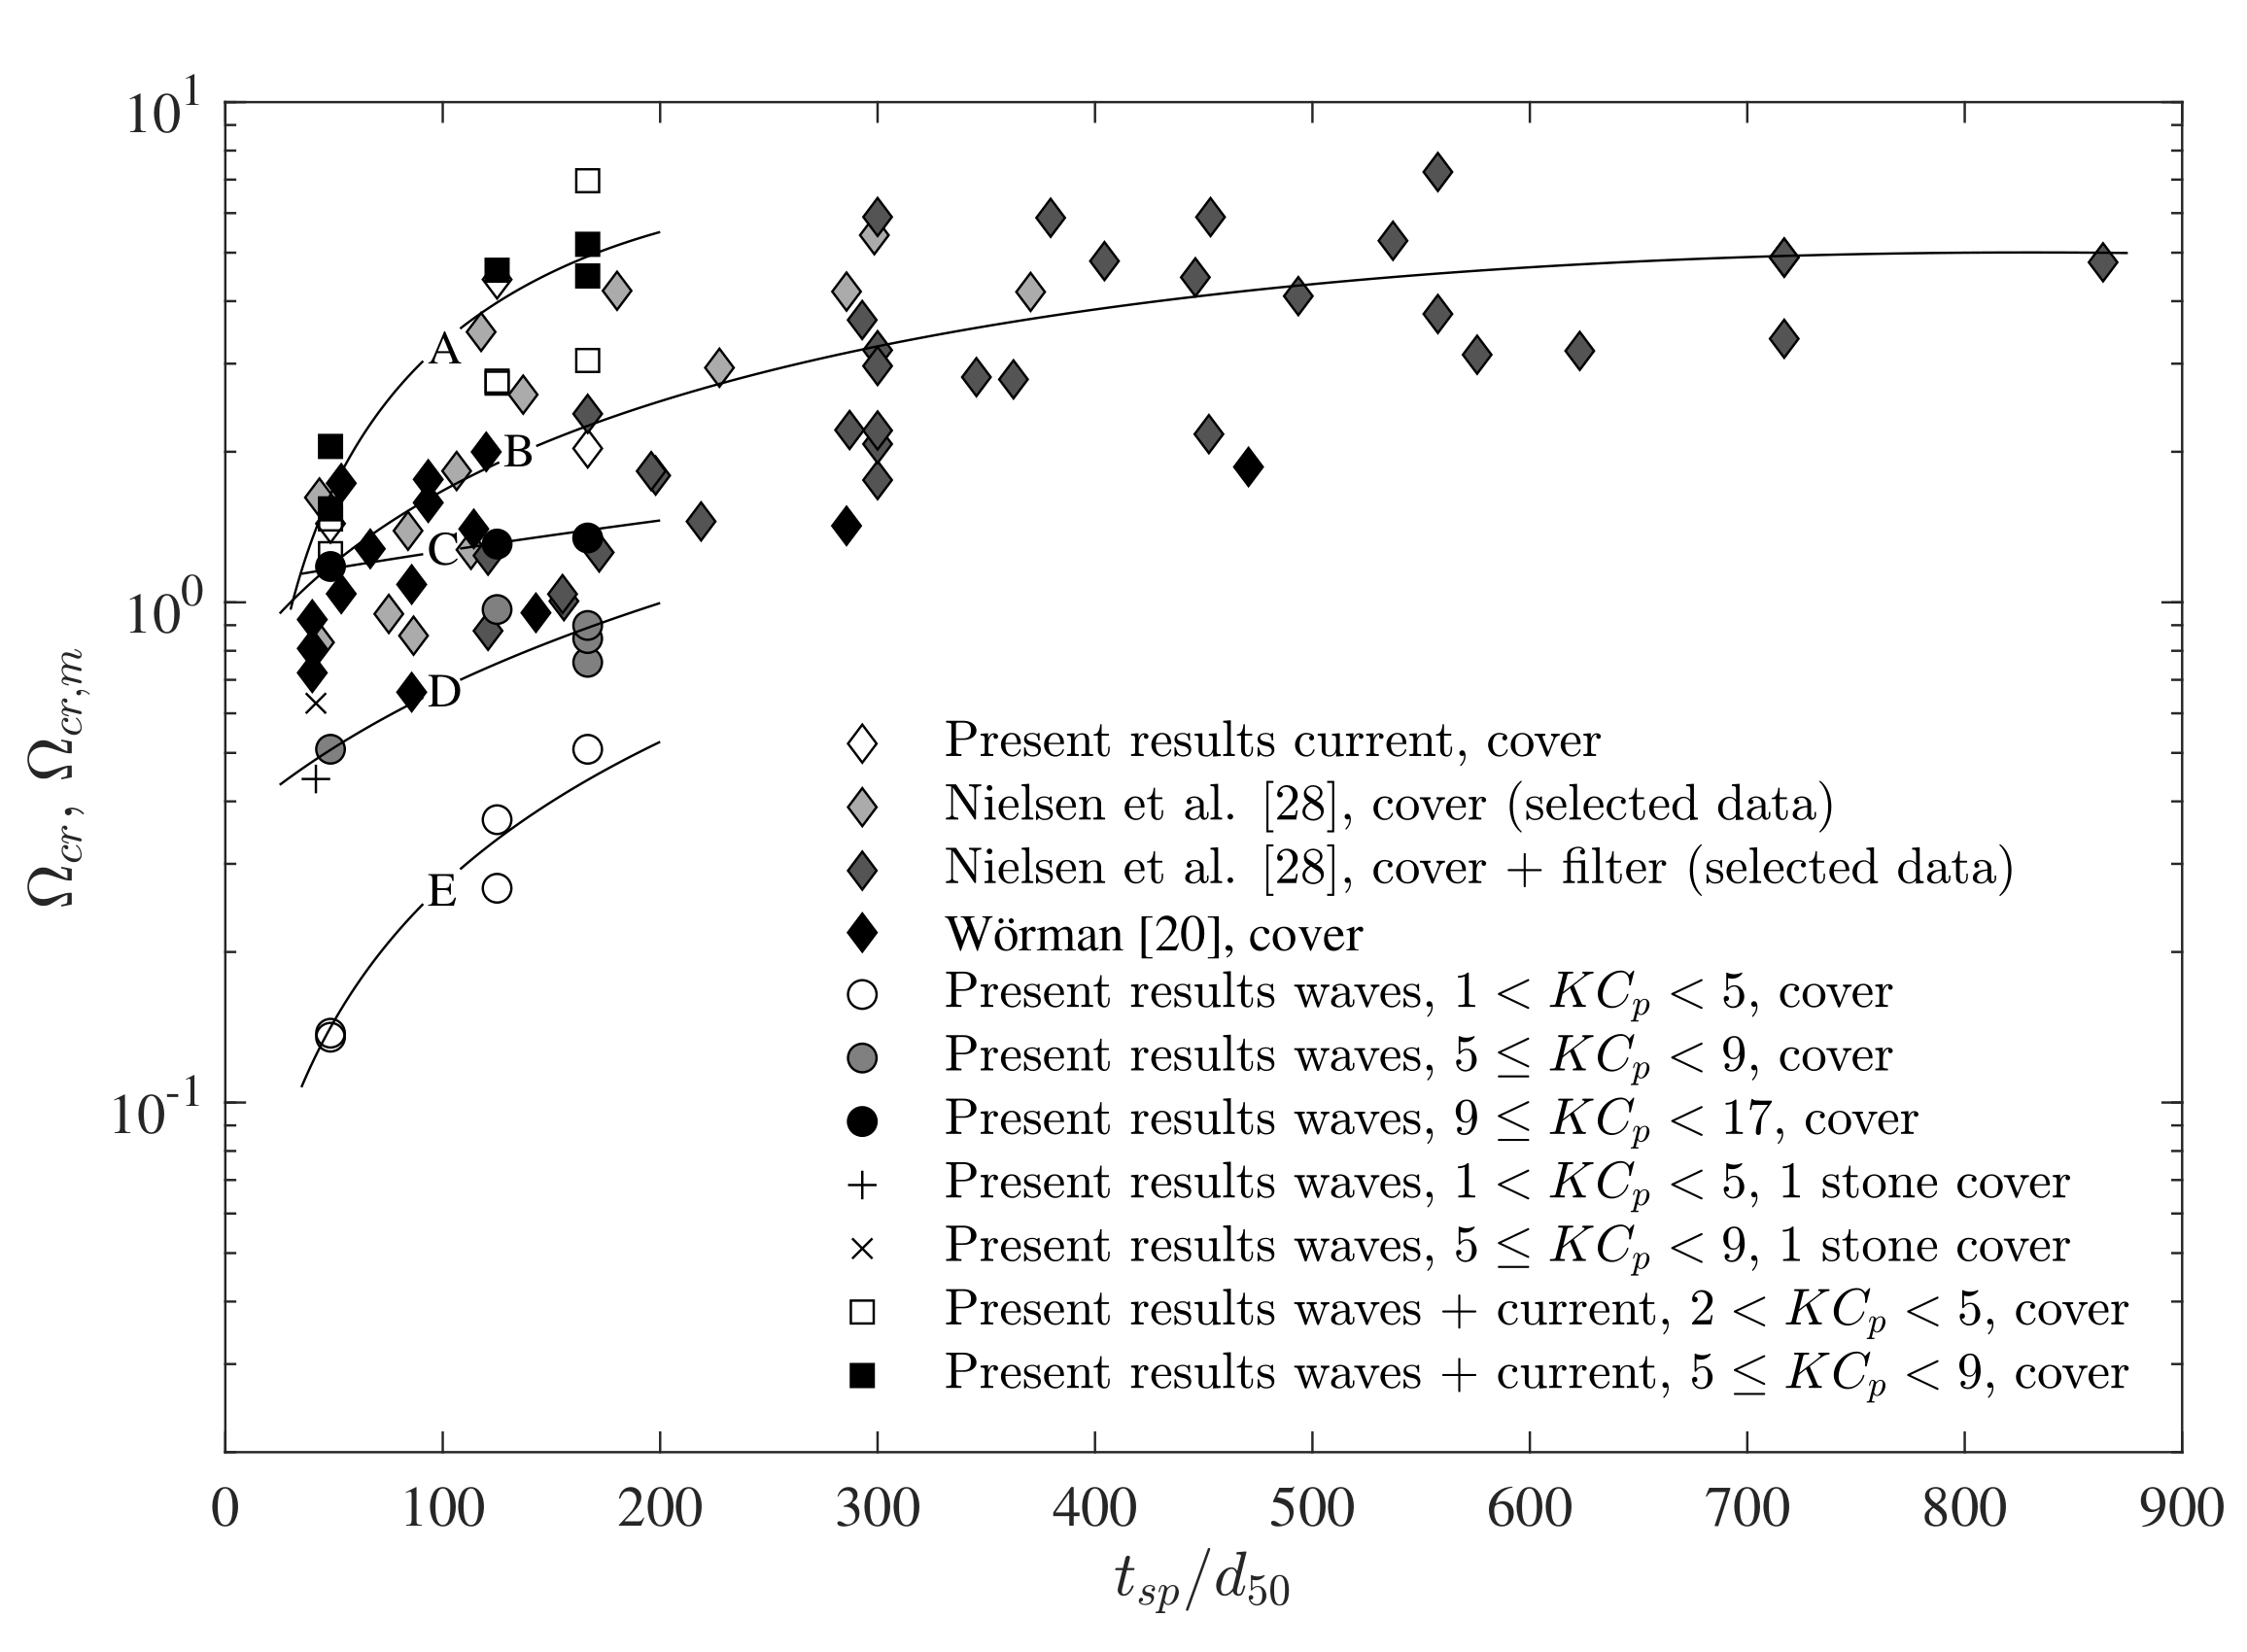
Figure 5 shows the critical mobility as a function of the relative thickness of the scour protection, , in the case of current alone, waves alone and combined waves and current. The figure shows a similar trend as for the waves alone. A dependency of the relative thickness of the scour protection, , on the critical mobility number is seen. The critical mobility number in the case of current is increasing for up to around 600, where it becomes constant. For larger relative thickness of the scour protection, the critical mobility number seems to be constant at about five in the case of current. It is also seen that the critical mobility number is smaller in the case of waves alone, while it increases in the case of combined waves and current, as also seen in Figure 4. The critical mobility number for waves alone was increasing with increasing -number as expected, while the combined wave and current tests seemed to be more or less independent of the -number within the tested interval (–9 and –0.65).
Some scatter was seen in the data for all three cases (current, waves and combined waves and current); however, the scatter was approximately the same as was seen for the standard Shields curve; see, e.g., [5], p. 10.
Of special interest are the two tests with only one layer of stones (marked with an ‘x’ and a ‘+’). Especially in the case of very low -numbers (‘+’), the critical mobility number was found to be significantly larger than for scour protections with two or more layers of stones. A similar effect was seen for the higher -numbers (‘x’), but much less pronounced. It has not been possible to explain the reason for this based on these two data points. It indicates, however, that the method is not applicable for very thin scour protections with only one layer of stones.
5.4. Comparison with Other Design Methods
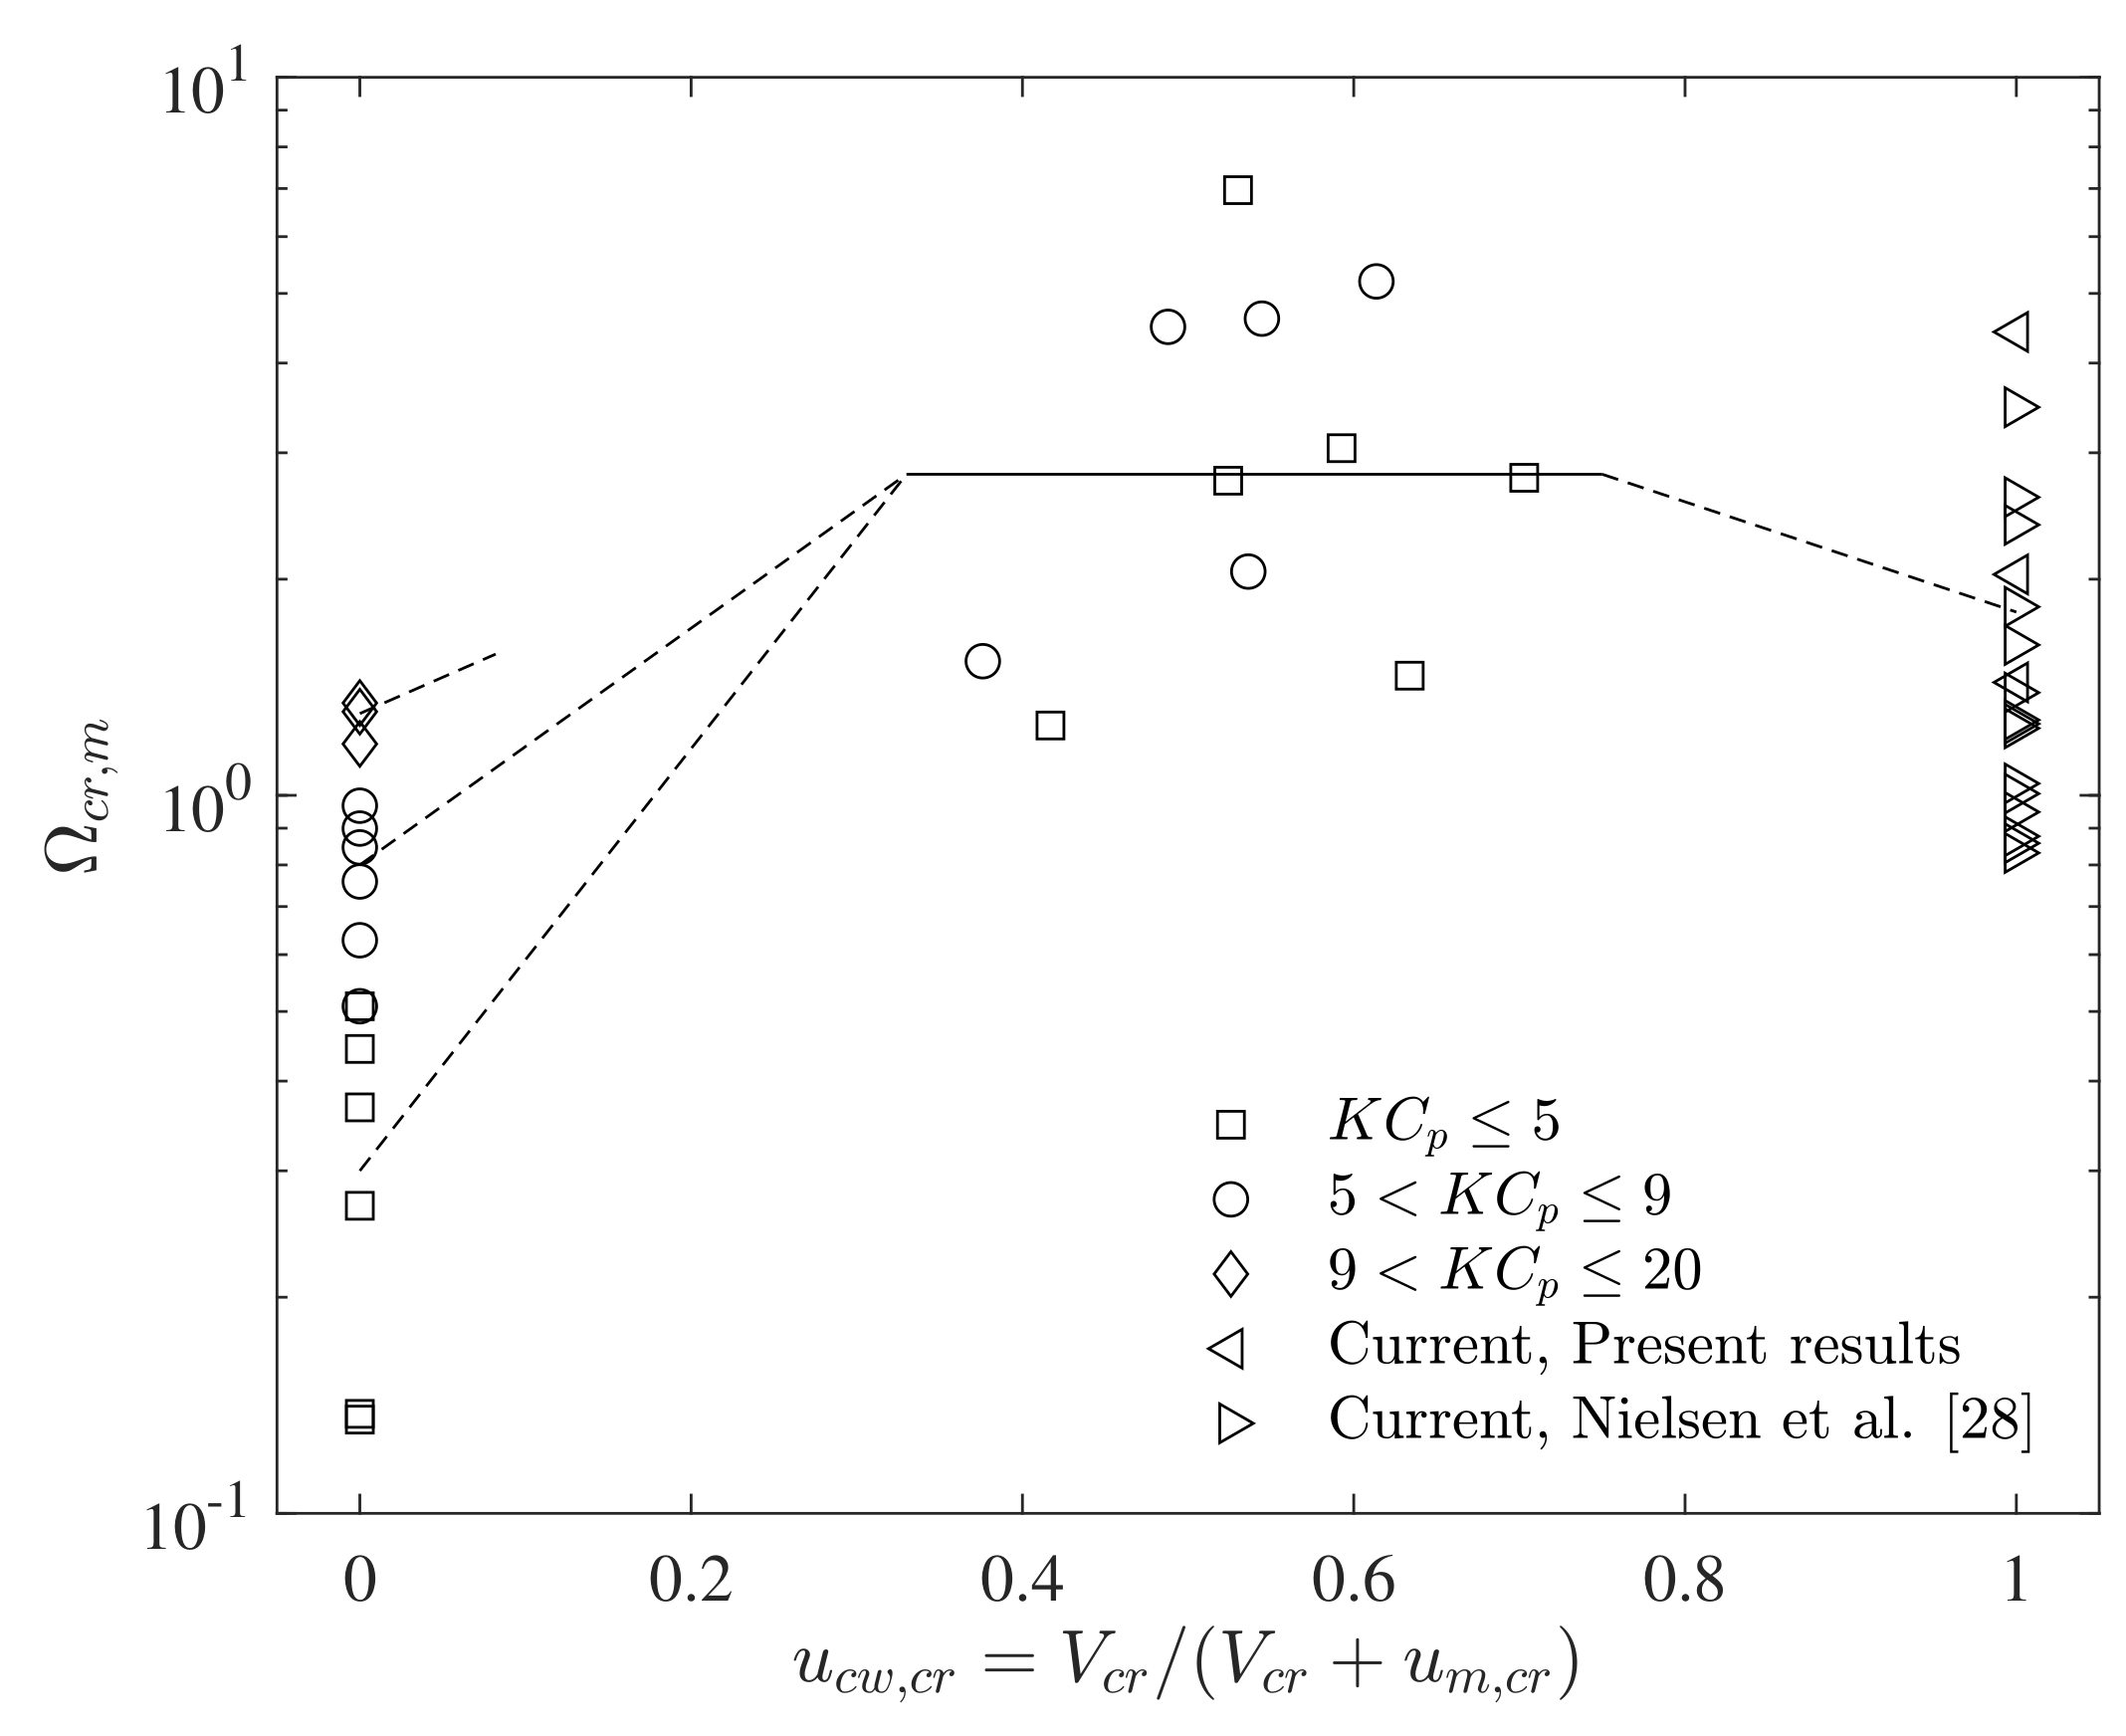
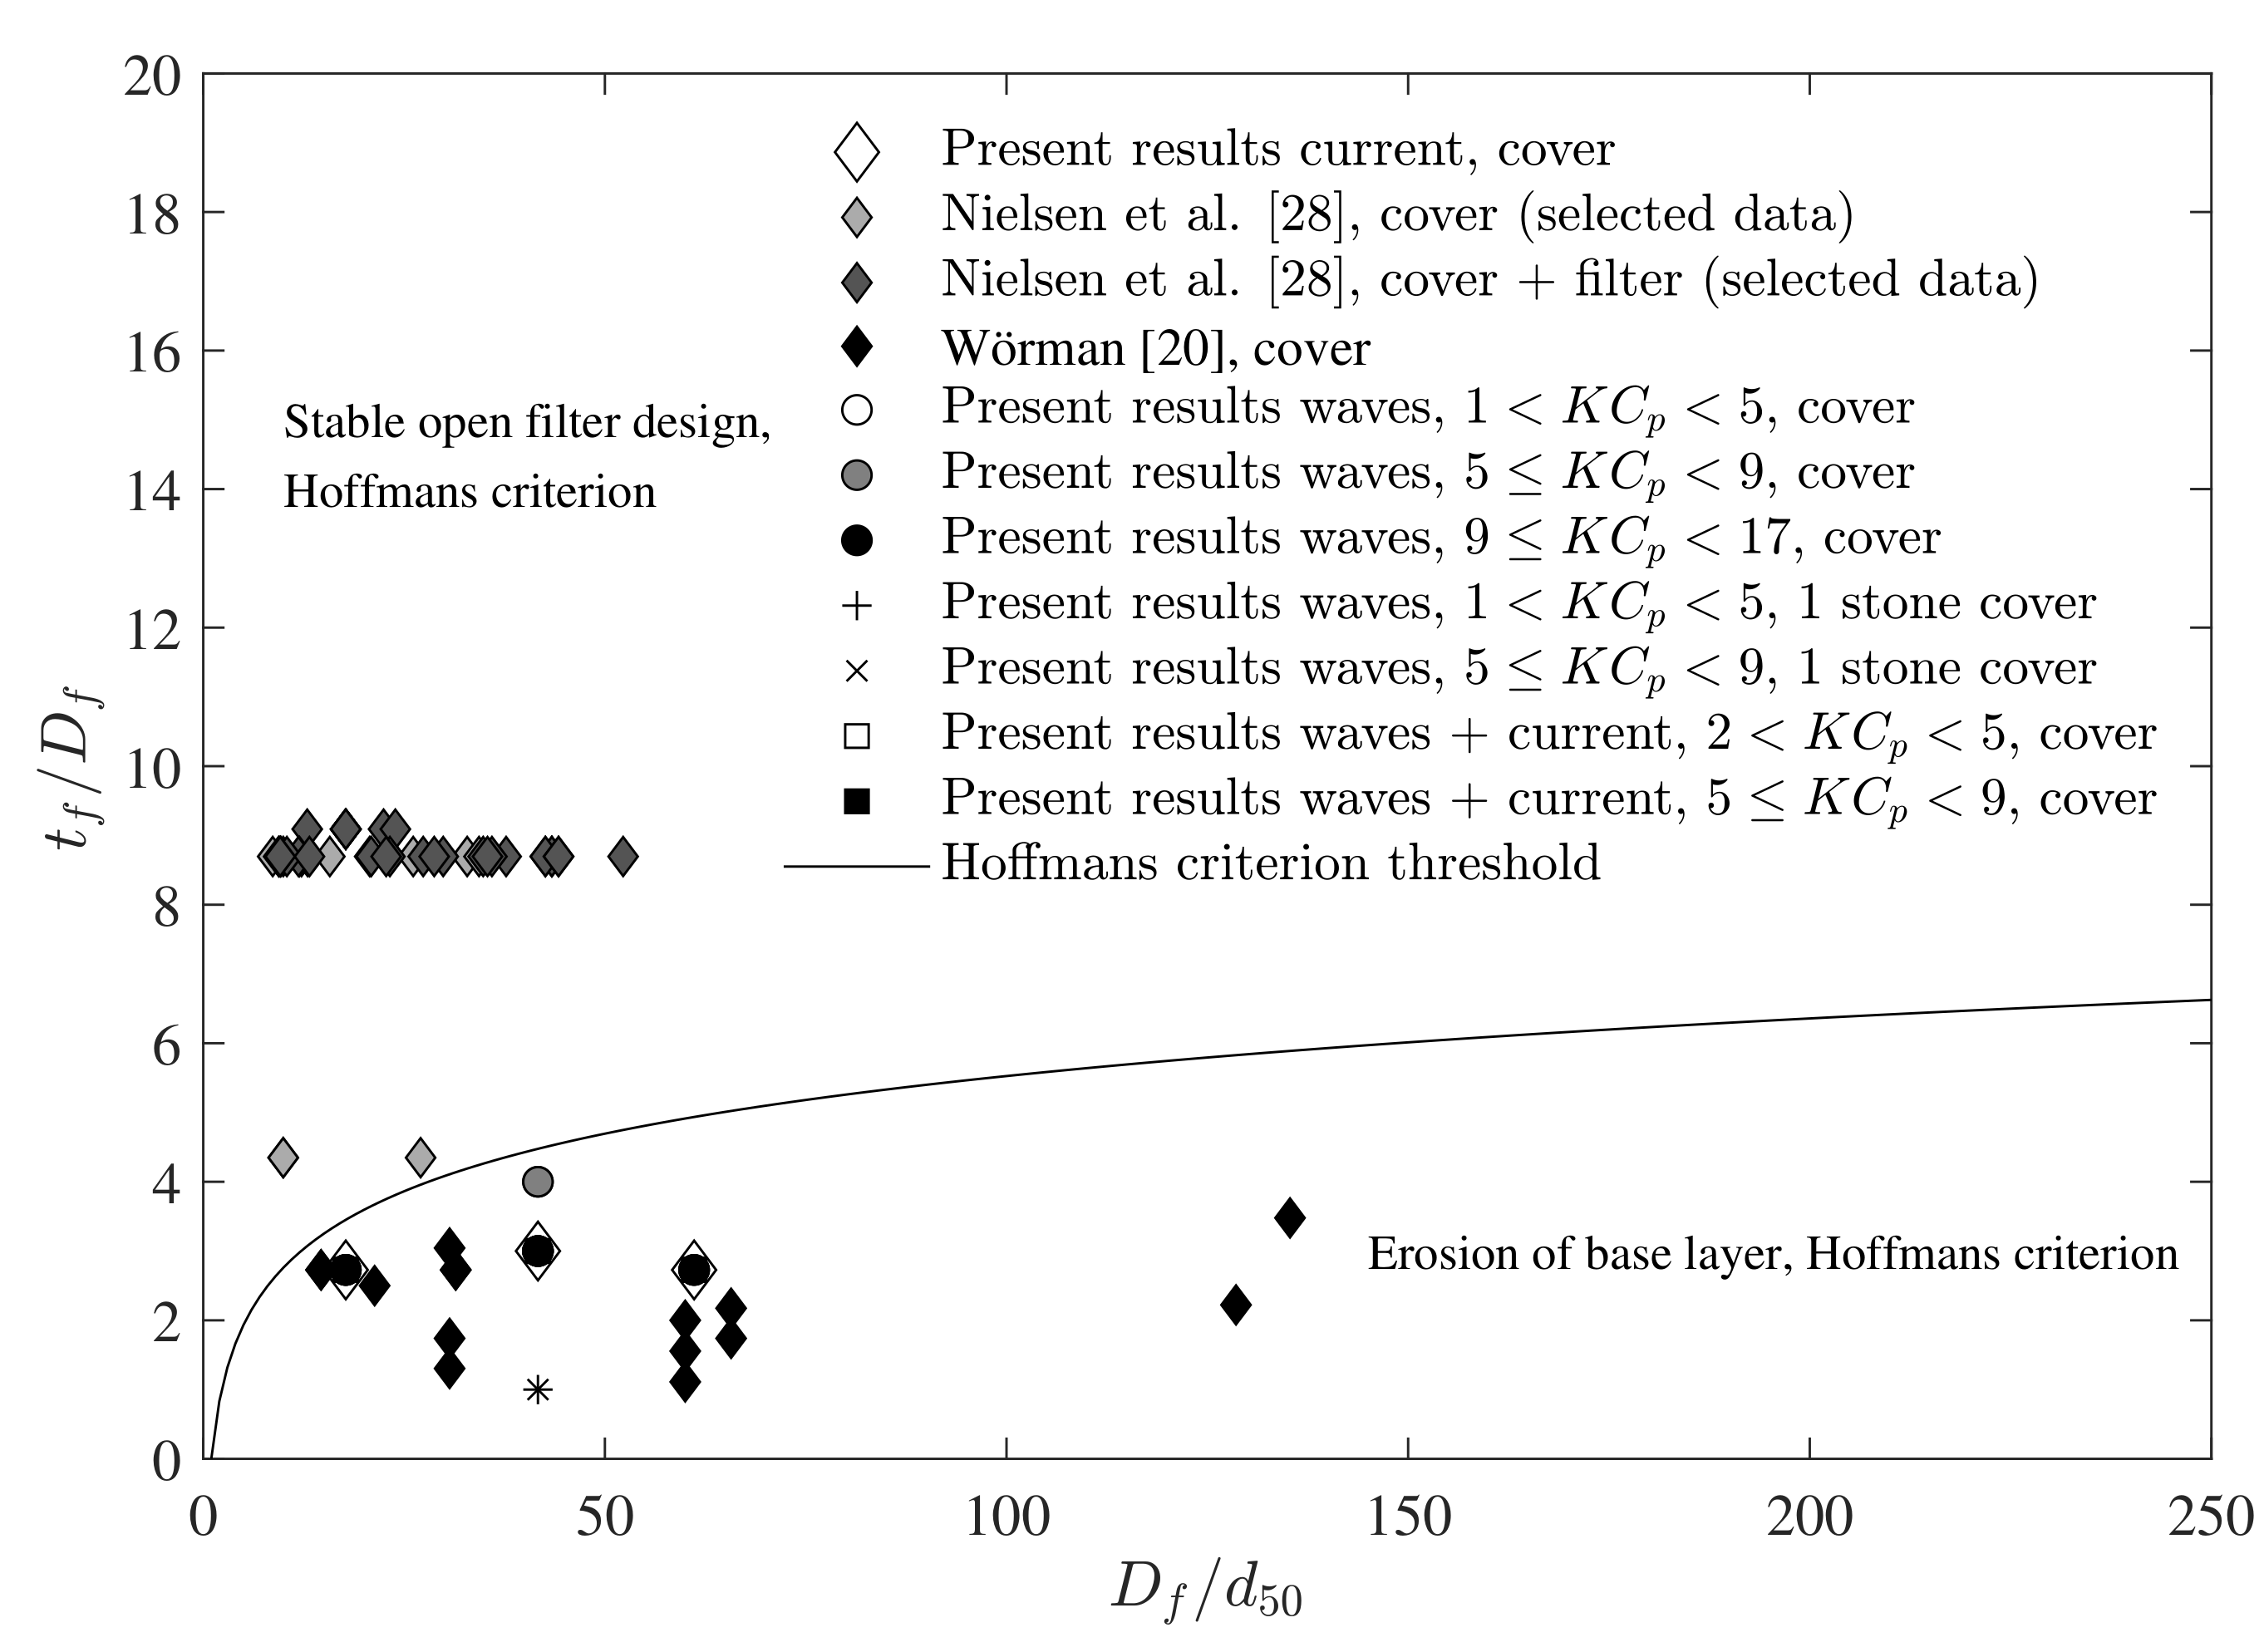
The amount of data on the stability of sediment under open filters around monopiles was very limited. The limited access to relevant data resulted in the use of alternative data for the design of open filters around monopiles. An often-applied method is the method described by Hoffmans [36]. The method provides the stability threshold for a granular open filter exposed to a current and without a monopile or other structure. The method includes the effects of the size of the filter and base material, as well as the thickness of the filter layer. Figure 6 shows the stability data from this and some previous studies (Wörman [20] and Nielsen et al. [28]) together with the Hoffmans criterion. It is seen that the criterion suits the data from the Wörman study, as well as the present study (including results from waves and combined waves and current conditions). Opposite these studies, the data from the Nielsen et al. study [28] were within the stable conditions according to the Hoffmans criterion; however, a few data points were close to the threshold. The main difference between the studies was the size of the monopile; the present study used a pile of 5 cm in diameter; Wörman applied 15- and 28-cm piles; and Nielsen et al. 55- and 100-cm piles. The larger piles applied by Nielsen et al. allowed a more realistic scaling of the stone size of the filter layer relative to the pile size (smaller stones relative to the pile). Nielsen et al. (2011) [27] showed that the stability of the sediment underneath a scour protection around a monopile exposed to a current was controlled by the horseshoe vortex penetrating into the scour protection; furthermore, Nielsen et al. (2011), [27] showed that the near-bed velocities were increased by a factor of ten or more when the pile was present compared to the situation without a pile. This, and the data shown in Figure 6, showed that the Hoffmans criterion cannot be directly applied for a filter layer around a structure like a monopile as the important effect of the structure was not included in the Hoffmans criterion.
6. Conclusions
The following conclusions can be drawn:
- The critical mobility number for the onset of the motion of sediment underneath a scour protection around a monopile was determined for current, waves and combined waves and current.
- The onset of motion of the sediment underneath the scour protection was found to depend on: (a) hydrodynamic forcing; (b) base sediment properties; (c) the stone sizes of the lower most layer of stones in the scour protection; (d) pile diameter; and (e) the thickness of the scour protection.
- The lowest critical mobilities were found for waves with low -numbers, followed by waves with increasing -numbers and current alone. The highest critical mobility numbers were found for combined waves and current.
- Open filter rules like that of Hoffmans (2012) [36] cannot be applied directly as they do not take the effect of the pile into account.
Author Contributions
Both authors designed the model tests and experimental setup. T.U.P. supervised the execution of the model tests. Both authors analyzed and interpreted the data. A.W.N. wrote first draft of the paper. both authors contributed to the final version.
Funding
The research was carried out as a part of the ForskEL Project 2013-1-68012: “Management of seabed and wind farm interaction” and partly funded by DHI through a grant from the Danish Agency for Technology and Innovation.
Acknowledgments
Stefan Carstensen from the Technical University of Denmark, Section for Fluid Mechanics, Coastal and Maritime Engineering, is acknowledge for providing access to the experimental facilities and Jørgen Fredsøe for commenting on the draft of the manuscript.
Conflicts of Interest
The authors declare no conflict of interest. The funding sponsors had no role in the design of the study; in the collection, analyses or interpretation of data; in the writing of the manuscript; nor in the decision to publish the results.
References
- Breusers, H.N.C.; Raudkivi, A.J. Scouring Hydraulic Structures Design Manual; Balkema: Rotterdam, The Netherlands, 1991. [Google Scholar]
- Hoffmans, G.J.C.M.; Verheij, H.J. Scour Manual; Balkema: Rotterdam, The Netherlands, 1997. [Google Scholar]
- Whitehouse, R. Scour at Marine Structures; Thomas Telford: London, UK, 1998. [Google Scholar]
- Melville, B.W.; Coleman, S.E. Bridge Scour; Water Resources Publications: Littleton CO, USA, 2000. [Google Scholar]
- Sumer, B.M.; Fredsøe, J. The Mechanics of Scour in the Marine Environment; Advanced Series on Ocean Engineering; World Scientific: Singapore, 2002. [Google Scholar]
- Sumer, B.M.; Petersen, T.U.; Locatelli, L.; Fredsøe, J.; Musumeci, R.E.; Foti, E. Backfilling of a scour hole around a pile in waves and current. J. Waterw. Port Coast. Ocean Eng. 2012, 139, 9–23. [Google Scholar] [CrossRef]
- Roulund, A.; Sumer, B.M.; Fredsøe, J.; Michelsen, J. Numerical and experimental investigation of flow and scour around a circular pile. J. Fluid Mech. 2005, 534, 351–401. [Google Scholar] [CrossRef]
- Liu, X.; García, M. A 3D Numerical Model with Free Water Surface and Mesh Deformation for Local Sediment Scour. J. Waterw. Port Coast. Ocean Eng. 2008, 134, 203–217. [Google Scholar] [CrossRef]
- Kirkil, G.; Constantinescu, S.; Ettema, R. Coherent structures in the flow field around a circular cylinder with scour hole. J. Hydraul. Eng. 2008, 134, 572–587. [Google Scholar] [CrossRef]
- Zhao, M.; Cheng, L.; Zang, Z. Experimental and numerical investigation of local scour around a submerged vertical circular cylinder in steady currents. Coast. Eng. 2010, 57, 709–721. [Google Scholar] [CrossRef]
- Khosronejad, A.; Kang, S.; Sotiropoulos, F. Experimental and computational investigation of local scour around bridge piers. Adv. Water Resour. 2012, 37, 73–85. [Google Scholar] [CrossRef]
- Baykal, C.; Sumer, B.M.; Fuhrman, D.R.; Jacobsen, N.G.; Fredsøe, J. Numerical investigation of flow and scour around a vertical circular cylinder. Philos. Trans. R. Soc. A 2015, 373, 20140104. [Google Scholar] [CrossRef] [PubMed]
- Hansen, E.A.; Simonsen, H.J.; Nielsen, A.W.; Pedersen, J.; Høgedal, M. Scour Protection around Offshore Wind Turbine Foundations, Full-Scale Measurements. In Proceedings of the European Wind Energy Conference 2007 (EWEC 2007), Milan, Italy, 7–10 May 2007; pp. 132–138. [Google Scholar]
- Raaijmakers, T.C.; Rudolph, D.; Bergen, M.R.J.V.; Lieshout, H.V. Offshore windpark Egmond aan Zee—Performance of scour protection and edge scour development. In Proceedings of the European Offshore Wind Conference and Exhibition 2007 (EOW 2007), Berlin, Germany, 4–6 December 2007; European Wind Energy Association (EWEA): Brussels, Belgium, 2007. [Google Scholar]
- Raaijmakers, T.C.; Van Oeveren, M.C.; Rudolph, D.; Leenders, V.; Sinjou, W.C.P. Field performance of scour protection around offshore monopiles. In Proceedings of the fifth International Conference on Scour and Erosion 2010 (ICSE-5), San Francisco, CA, USA, 7–10 November 2010; pp. 428–439. [Google Scholar]
- Bolle, A.; Mercelis, P.; Goossens, W.; Haerens, P. Scour monitoring and scour protection solution for offshore gravity based foundations. In Proceedings of the fifth International Conference on Scour and Erosion 2010 (ICSE-5), San Francisco, CA, USA, 7–10 November 2010; pp. 491–500. [Google Scholar]
- Whitehouse, R.J.; Harris, J.M.; Sutherland, J.; Rees, J. The nature of scour development and scour protection at offshore windfarm foundations. Mar. Pollut. Bull. 2011, 62, 73–88. [Google Scholar] [CrossRef] [PubMed]
- Nielsen, A.W.; Sumer, B.M.; Petersen, T.U. Sinking of Scour Protections at HORNS REV 1 Offshore Wind Farm. Coast. Eng. Proc. 2014, 1, 67. [Google Scholar] [CrossRef]
- Petersen, T.U.; Sumer, B.M.; Fredsøe, J.; Raaijmakers, T.C.; Schouten, J.J. Edge scour at scour protections around piles in the marine environment—Laboratory and field investigation. Coast. Eng. 2015, 106, 42–72. [Google Scholar] [CrossRef]
- Wörman, A. Riprap protection without filter layers. J. Hydraul. Eng. 1989, 115, 1615–1630. [Google Scholar] [CrossRef]
- Chiew, Y.M. Mechanics of riprap failure at bridge piers. J. Hydraul. Eng. 1995, 121, 635–643. [Google Scholar] [CrossRef]
- May, R.; Ackers, J.; Kirby, A. Manual on Scour at Bridges and other Hydraulic Structures; CIRIA: London, UK, 2002; Volume 551. [Google Scholar]
- Chiew, Y.M.; Lim, F.H. Failure Behavior of Riprap Layer at Bridge Piers under Live-Bed Conditions. J. Hydraul. Eng. 2000, 126, 43. [Google Scholar] [CrossRef]
- Lauchlan, C.S.; Melville, B.W. Riprap protection at bridge piers. J. Hydraul. Eng. 2001, 127, 412–418. [Google Scholar] [CrossRef]
- Vos, L.D.; Rouck, J.D.; Troch, P.; Frigaard, P. Empirical design of scour protections around monopile foundations: Part 1: Static approach. Coast. Eng. 2011, 58, 540–553. [Google Scholar] [CrossRef]
- Vos, L.D.; Rouck, J.D.; Troch, P.; Frigaard, P. Empirical design of scour protections around monopile foundations. Part 2: Dynamic approach. Coast. Eng. 2012, 60, 286–298. [Google Scholar] [CrossRef]
- Nielsen, A.W.; Sumer, B.M.; Fredsøe, J.; Christensen, E.D. Sinking of armour layer around a cylinder exposed to a current. Proc. Inst. Civil Eng. Marit. Eng. 2011, 164, 159–172. [Google Scholar] [CrossRef]
- Nielsen, A.W.; Liu, X.; Sumer, B.M.; Fredsøe, J. Flow and bed shear stresses in scour protections around a pile in a current. Coast. Eng. 2013, 72, 20–38. [Google Scholar] [CrossRef]
- Nielsen, A.W.; Probst, T.; Petersen, T.U.; Sumer, B.M. Sinking of armour layer around a vertical cylinder exposed to waves and current. Coast. Eng. 2015, 100, 58–66. [Google Scholar] [CrossRef]
- Sumer, B.M.; Nielsen, A.W. Sinking failure of scour protection at wind turbine foundation. Proc. ICE-Energy 2013, 166, 170–188. [Google Scholar] [CrossRef]
- Petersen, T.U.; Sumer, B.M.; Fredsøe, J. Edge scour at scour protections around offshore wind turbine foundations. In Proceedings of the 7th International Conference on Scour Erosion, ICSE, Perth, Australia, 2–4 December 2014. [Google Scholar]
- Petersen, T.U.; Nielsen, A.W. Model prediction of the dynamics of scour protections around monopiles. In Proceedings of the EWEA Offshore 2015, Copenhagen, Denmark, 10–12 March 2015. [Google Scholar]
- Burcharth, H.; Andersen, O. On the one-dimensional steady and unsteady porous flow equations. Coast. Eng. 1995, 24, 233–257. [Google Scholar] [CrossRef]
- Dixen, F.H.; Sumer, B.M.; Fredsøe, J. Suction removal of sediment from between armour blocks. Part 2. Waves. J. Hydraul. Eng. 2008, 134, 1405–1420. [Google Scholar] [CrossRef]
- Fredsøe, J.; Andersen, K.H.; Sumer, B.M. Wave plus current over a ripple-covered bed. Coast. Eng. 1999, 38, 177–221. [Google Scholar] [CrossRef]
- Hoffmans, G.J.C.M. The Influence of Turbulence on Soil Erosion; Eburon Uitgeverij BV: Delft, The Netherlands, 2012; Volume 10. [Google Scholar]
Figure 1.
Sketch of the combined waves and current flume. Not to scale. Measures in meters. WG, Wave Gauge.
Figure 1.
Sketch of the combined waves and current flume. Not to scale. Measures in meters. WG, Wave Gauge.

Figure 2.
Sketch of the camera setup for monitoring the initiation of the motion of the sediment. (A) shows a longitudinal section of the setup, and (B) shows a plan view.
Figure 2.
Sketch of the camera setup for monitoring the initiation of the motion of the sediment. (A) shows a longitudinal section of the setup, and (B) shows a plan view.

Figure 3.
Stability of sediment underneath a scour protection around a monopile exposed to waves. The data are valid for .
Figure 3.
Stability of sediment underneath a scour protection around a monopile exposed to waves. The data are valid for .

Figure 4.
The critical mobility in the case of combined waves and current. The results are valid for . The dashed lines indicate the trends of the mobility. The data are valid for .
Figure 4.
The critical mobility in the case of combined waves and current. The results are valid for . The dashed lines indicate the trends of the mobility. The data are valid for .

Figure 5.
Critical mobility number as a function of . The trend lines are: (A) combined waves and current; (B) current; (C) waves ; (D) waves ; and waves . Data from Nielsen et al. [28] for very large stones in the scour protection have been omitted as these tests have a very large spreading due to the testing method and conditions; see [28], p. 30, for details. The data are valid for .

Figure 6.
The stability of the base sediment together with the Hoffmans criterion [36].
Figure 6.
The stability of the base sediment together with the Hoffmans criterion [36].


Table 1.
Test conditions and main results for the current tests.
| Test no | (mm) | (mm) | (cm) | (cm/s) | |||
|---|---|---|---|---|---|---|---|
| 1 | 7.5 | 0.18 | 2.3 | 29.3 | 125 | 4.4 | 53 |
| 2 | 11.0 | 0.18 | 3.0 | 16.4 | 167 | 2.0 | 30 |
| 3 | 11.0 | 0.62 | 3.0 | 25.6 | 48 | 1.4 | 159 |
Table 2.
Test conditions and main results of the wave tests.
| Test no | (mm) | (mm) | (cm) | (cm) | T (s) | ||||
|---|---|---|---|---|---|---|---|---|---|
| 4 | 7.5 | 0.18 | 3.0 | 5.3 | 2.5 | 167 | 0.76 | 6 | 22 |
| 5 | 7.5 | 0.18 | 3.0 | 5.4 | 3.5 | 167 | 0.85 | 9 | 23 |
| 6 | 7.5 | 0.18 | 0.75 | 4.9 | 1.5 | 42 | 0.44 | 3 | 17 |
| 7 | 7.5 | 0.18 | 0.75 | 4.9 | 2.5 | 42 | 0.63 | 6 | 20 |
| 8 | 11 | 0.18 | 3.0 | 4.4 | 1.5 | 167 | 0.51 | 2 | 15 |
| 9 | 11 | 0.18 | 3.0 | 4.8 | 2.5 | 167 | 0.90 | 6 | 20 |
| 10 | 11 | 0.18 | 3.0 | 5.6 | 3.5 | 167 | 1.34 | 9 | 24 |
| 11 | 11 | 0.62 | 3.0 | 4.2 | 1.5 | 48 | 0.14 | 2 | 49 |
| 12 | 11 | 0.62 | 3.0 | 6.7 | 2.5 | 48 | 0.51 | 8 | 94 |
| 13 | 11 | 0.62 | 3.0 | 9.8 | 3.5 | 48 | 1.18 | 16 | 144 |
| 14 | 11 | 0.62 | 3.0 | 6.7 | 1.0 | 48 | 0.14 | 2 | 49 |
| 15 | 7.5 | 0.18 | 2.3 | 4.5 | 1.5 | 125 | 0.37 | 3 | 15 |
| 16 | 7.5 | 0.18 | 2.3 | 6.0 | 2.5 | 125 | 0.97 | 7 | 25 |
| 17 | 7.5 | 0.18 | 2.3 | 6.7 | 3.5 | 125 | 1.31 | 11 | 29 |
| 18 | 7.5 | 0.18 | 2.3 | 6.2 | 1.0 | 125 | 0.27 | 1 | 13 |
Table 3.
Test conditions and main results of the combined waves and current tests.
| Test no | (mm) | (mm) | (cm) | (cm/s) | (cm) | T (s) | |||||
|---|---|---|---|---|---|---|---|---|---|---|---|
| 19 | 7.5 | 0.18 | 2.3 | 16.3 | 3.7 | 1.5 | 125 | 2.8 | 0.70 | 2 | 12 |
| 20 | 7.5 | 0.18 | 2.3 | 16.3 | 6.0 | 2.5 | 125 | 4.6 | 0.54 | 7 | 25 |
| 21 | 7.5 | 0.18 | 2.3 | 12.1 | 5.8 | 1.5 | 125 | 2.7 | 0.52 | 3 | 20 |
| 22 | 7.5 | 0.18 | 2.3 | 12.1 | 8.7 | 2.5 | 125 | 5.2 | 0.38 | 10 | 35 |
| 23 | 11 | 0.18 | 3.0 | 16.1 | 7.6 | 1.5 | 167 | 7.0 | 0.53 | 4 | 26 |
| 24 | 11 | 0.18 | 3.0 | 16.1 | 4.5 | 2.5 | 167 | 5.2 | 0.61 | 5 | 18 |
| 25 | 11 | 0.18 | 3.0 | 11.9 | 4.3 | 1.5 | 167 | 3.0 | 0.59 | 2 | 15 |
| 26 | 11 | 0.18 | 3.0 | 11.9 | 5.5 | 2.5 | 167 | 4.5 | 0.49 | 6 | 22 |
| 27 | 11 | 0.62 | 3.0 | 16.4 | 5.0 | 1.5 | 48 | 1.5 | 0.63 | 3 | 59 |
| 28 | 11 | 0.62 | 3.0 | 16.4 | 6.2 | 2.5 | 48 | 2.0 | 0.54 | 7 | 88 |
| 29 | 11 | 0.62 | 3.0 | 10.0 | 7.4 | 1.5 | 48 | 1.3 | 0.42 | 4 | 86 |
| 30 | 11 | 0.62 | 3.0 | 10.0 | 7.3 | 2.5 | 48 | 1.5 | 0.38 | 8 | 102 |
© 2018 by the authors. Licensee MDPI, Basel, Switzerland. This article is an open access article distributed under the terms and conditions of the Creative Commons Attribution (CC BY) license (http://creativecommons.org/licenses/by/4.0/).
Share and Cite
MDPI and ACS Style
Nielsen, A.W.; Petersen, T.U. Onset of Motion of Sediment underneath Scour Protection around a Monopile. J. Mar. Sci. Eng. 2018, 6, 100. https://doi.org/10.3390/jmse6030100
AMA Style
Nielsen AW, Petersen TU. Onset of Motion of Sediment underneath Scour Protection around a Monopile. Journal of Marine Science and Engineering. 2018; 6(3):100. https://doi.org/10.3390/jmse6030100
Chicago/Turabian StyleNielsen, Anders Wedel, and Thor Ugelvig Petersen. 2018. "Onset of Motion of Sediment underneath Scour Protection around a Monopile" Journal of Marine Science and Engineering 6, no. 3: 100. https://doi.org/10.3390/jmse6030100
Note that from the first issue of 2016, this journal uses article numbers instead of page numbers. See further details here.