1. Introduction
During recent decades, the quest for alternative forms of producing energy has included the double aim of satisfying the increasing energy demand and lowering the pollutant emissions on the environment. Renewable energies seem to satisfy both these requirements and are becoming progressively more important in the global energy mix. Among them, wave energy, could play an important role in the future electricity supply from renewable sources [
1]. However, due to the high costs related to the deployment of wave energy devices, the cost of energy (CoE) associated to wave power is still too high to be competitive with that of conventional fossil fuel power plants. On one hand, the technology still needs to be improved; producing enhanced devices, capable of harvesting more of the energy contained in the waves and with a better chance of surviving in extreme conditions, is pivotal [
1,
2]. On the other hand, improvements in the reliability and availability of the devices, as well as advances in their operation and maintenance (O&M) are required. Both these enhancements aim to increase the productivity and reduce the running costs of wave energy converters (WECs) which, in turn, will lead to an increase in their competitiveness in the electricity market [
3,
4]. To achieve this goal, among other tools, a number of computational models have been created in the last few years to simulate the lifecycle logistics of an offshore farm and assess performance.
Hofman [
5] presents a comprehensive review of these models, finding a total of 49 decision support models for offshore wind farms. Nielsen and Sørensen provide an overview of various approaches for the risk-based planning of the O&M of wind turbines [
6], highlighting the accuracy and flexibility of the Markov decision process. Teillant et al. [
7] present an example of techno-economical assessment of a wave farm, with important considerations on availability and operational costs of the power plant. Endrerud et al. [
8] focus on marine logistics, introducing a simulation model based on a combination of the agent-based and discrete event modelling paradigms to characterize the O&M of offshore wind parks. Martin et al. [
9] emphasize the importance of a sensitivity analysis in identifying the factors affecting operational costs and availability of an offshore wind farm, indicating access and repair costs as major contributors to the total O&M costs.
Most of these models permit the analysis of different aspects of the power plant, allowing the selection of the best combination of parameters in order to maximize the incomes of the electricity sale and minimise the expenses. Besides, they aim to overcome the lack of operational experience in this sector due to the novelty of the same, and obtain robust estimates on the effectiveness of the farm.
In this paper, a novel computational tool for the reliability-based assessment of an offshore farm is introduced. This tool, in addition to the characteristic features of generic reliability, availability and maintainability (RAM) models, is exclusively dedicated to marine renewables and adaptable to a range of technologies, namely WECs, offshore wind and tidal farms. Further, it aims to reduce the assumptions generally needed in the assessment of the optimal management and O&M procedures for offshore renewables, providing useful insights for farm owners and operators.
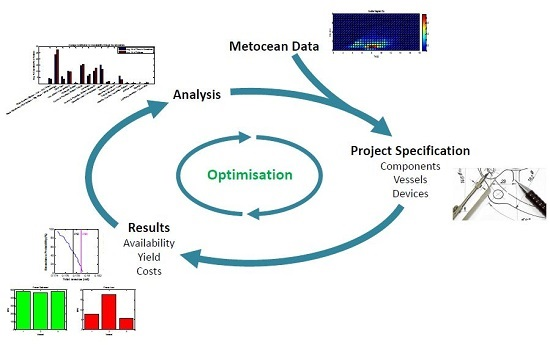
The input metrics for the characterization of the farm are presented together with the mechanisms and constraints that permit the performance assessment. A case study is hence proposed to show the modelling possibilities offered by the implemented tool, and the support this can provide in the decision-making process to improve the cost efficiency of an offshore farm. In order to do so, a number of optimization possibilities are suggested and assessed through an iterative analysis. This means that after each simulation the results obtained are analysed; then the initial set of parameters is changed and the simulation repeated in order to quantify the effects of the variations. Focus is given to the maximization of the electrical production and the availability of the farm. Key input parameters can be varied with regard to maintenance vessels, maintenance strategies and design characteristics of the device.
The specifics of the computational model are illustrated in
Section 2, while the base case study and the related optimization possibilities follow in
Section 3. Results of the proposed variations are summarised in
Section 4 and conclusions drawn in
Section 5.
2. Model
The computational tool used in this work belongs to the class of Monte Carlo models, which repeatedly perform a non-deterministic calculation in order to obtain the most probable result [
10]. The Monte Carlo method coupled with the computational simulation uses a pseudorandom number generator (PRNG) to generate numbers uniformly distributed between zero and one. The PRNG used in this work exploits the Mersenne Twister algorithm, which generates primes of the form 2
p − 1 where
p itself is prime.
The implemented tool uses this methodology and the related reliability data to perform the energetic and economic characterization of offshore farms, simulating the failures that limit their availability, and consequently, productivity.
A failure is simulated when the condition
is satisfied, where
NR is the pseudorandom number generated,
is the failure rate of the considered component of the system and
B is the shape parameter of the distribution.
B = 1 in the case of the exponential distribution. A logical 0 is then assigned to the status of the component if a failure has happened, while a logical 1 is assigned otherwise. Therefore, if
xi is the status of the generic component and
Y is the status of the complete system [
11]:
for components in series and
for components in parallel.
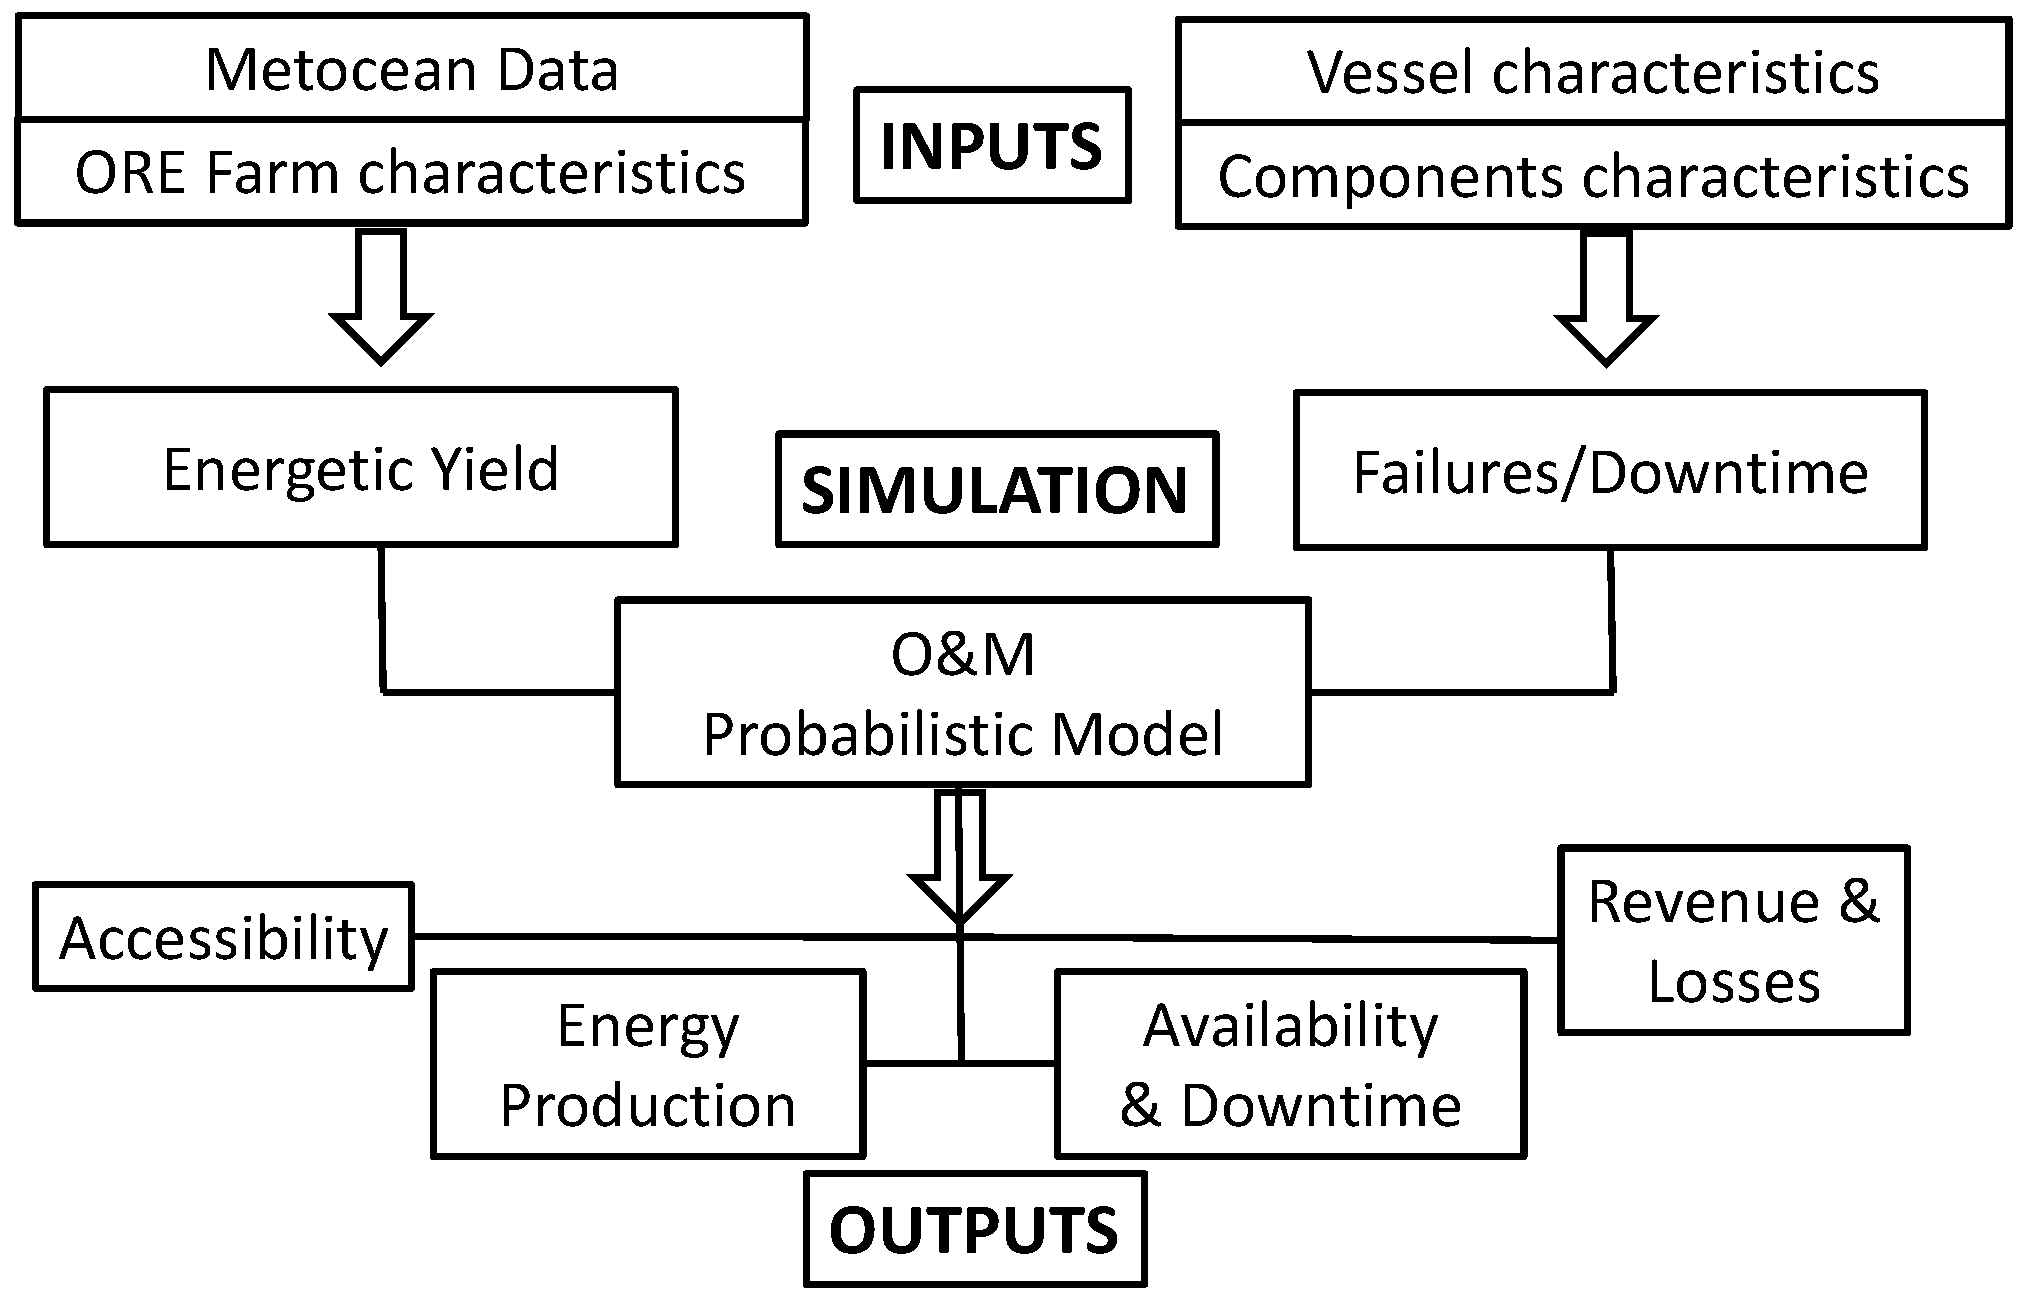
In order to obtain the necessary information for the assessment, a number of inputs have to be provided. These are, first of all, the metocean data and the device’s performance characteristics, together with the number of devices in the farm. These inputs permit the calculation of the energetic yield that would be obtained in ideal conditions, i.e., in the absence of faults or failures in any of the constituents of the device. In addition, indicators of the farm’s efficiency can be calculated in terms of capacity factor and equivalent hours.
Furthermore, details on the reliability structure of the devices are needed to simulate the operation of the farm. These specifics include information on the taxonomy of the device, i.e., its composition in terms of systems, subsystems and single components, and related information for the repair processes. A Reliability Block Diagram (RBD) [
12] of the device is automatically created to visualize the results of the implementation. For each component, the failure rate (in failures/hour) has to be specified together with its failure distribution (Weibull or exponential), eventual adjustment factors due to external loads, maintenance and fault categories, procurement and repair time, eventual redundancies and cost of the spare parts. All this information is used to simulate eventual failures and consequent downtimes of the devices, as well as effects on the economic valuation. Inputs in terms of maintenance vessels’ capabilities are then used to simulate the repair or replacement processes and bring back the devices to their operating state. Times related to the return to operational conditions are established through the proprietary offshore operations planning software Mermaid (
http://mojomermaid.com/). Eventual preventive maintenance operations can be scheduled and taken into account by the model in order to reset the failure distribution of the components.
The working diagram of the model is schematically described in
Figure 1.
Outputs are provided in the form of key performance indicators illustrating and comparing the various options in terms of reliability, availability and maintainability of the farm. These comprehend, but are not limited to:
Reliability and failure rate distributions of the single components and the entire system;
Power delivered to the grid and lost due to failures;
Energy-based and time-based availability of the farm;
Number of failures, contribution to unavailability and total number of failures for each component;
Risk Priority Number (RPN) [
13] and Occurrence/Severity matrix, to quantify the importance of a failure;
Monthly and annual analysis, convergence of the results over the total number of simulations and probability exceedances of: power produced, power lost, revenue and losses.
3. Case Study
This section describes the case study provided to illustrate the most pertinent optimization practices available for wave energy deployments. The first sub-section introduces the simulated power farm, with specifics on location and devices, and results of the simulation considering this base case scenario. The following four sub-sections show a selection of the same number of optimization processes, and their correspondent effects on the productivity of the farm. The results of the simulations obtained for the base case scenarios, as well as those obtained for the proposed variations, are all summarised at the end of this section, in Table 3.
3.1. Base Case
As previously mentioned, the proposed case study is a wave farm constituted by an array of five identical WECs. The location chosen for this study is the North Cornwall Demonstration Zone of Wave Hub, in Cornwall, SW England [
14]. This is a fully consented region located 4 km off the English coast, in proximity to a variety of ports and associated infrastructure. The one selected for the maintenance operations is in Hayle, 4 km distant from the offshore farm location.
The wave energy device is given the properties of the WEC Pelamis P1 [
15,
16], with a rated capacity of 750 kW, Although the company had to file administration, the device is modelled here, as information on its power performance and reliability data is readily available in the public domain [
17]. Previous studies [
18] tried to estimate its reliability using base values collected from a variety of databases for offshore structures. These have then been adjusted, applying proper corrective factors, to the considered case of a WEC. Hence, this set of exponential failure distributions has been adopted for this work. Main parameters and device capabilities are stated in the following
Table 1. A reliability block diagram representing schematically the results of this implementation is illustrated in the
Appendix.
Procurement time is used to indicate the amount of time needed to procure the spare part if this is not in stock. Similarly, repair time is the time needed to perform the repair or replacement operation in case of a failure. These values have been assumed using engineering judgement for the sole purpose of this work, and are not to be taken as a reference for future studies. The failure rate, assumed constant for this work, indicates the average number of failures per year. The fourth column indicates whether maintenance operations on the component can be performed during the night or not, since this distinction will have repercussions on the final downtime in case of failure. The criticality data is used to specify if the functioning of the considered component is indispensable for the functioning of the device or not; in the first situation, the device will cease to work in case of a failure. The number of elements is used to indicate the number of items of the same kind in the device. A further “k-out-of-n” parameter can then be considered to assess how many of these elements are needed for the effective functioning of the device.
The first maintenance vessel selected for the O&M of the wave farm is inspired to the Windcat workboat (
http://www.windcatworkboats.com/), a category of offshore utility vessels providing specialist crew and cargo transfer in the offshore renewables and oil and gas industries. A set of parameters concerning the capabilities of the vessel, has been used to assess the vessel response time for each day of the simulation period using Mermaid. This permits avoiding one of the main assumptions usually required in the simulation tools for offshore farms [
19].
The economic values, related to gross income and lost revenue for the whole considered lifecycle of the farm (10 years), have been calculated establishing a strike price for the generated electricity according to the package of measures approved in 2012 by the UK Department of Energy and Climate Change [
20]. This establishes a price of 305 £/MWh for the electricity produced by wave devices for the year 2015/2016.
3.2. Variation 1: Maintenance Vessel
The first proposed variation consists in changing the vessel selected for the repairs and replacements of the farm. This is a determining choice for the O&M strategies, since a vessel with higher capabilities can exploit a higher number of weather windows being decisive on the availability of the devices and, consequently, on their annual production. The vessel chosen for this variation is inspired to the dynamic positioning vessel HF4, suitable for a range of offshore services and capable of operating in higher sea states and tidal flows [
21]. Respect to the previous vessel, having higher specifics for wind and wave limits, this can deal with harsher metocean conditions. This implies larger vessel weather windows which subsequently allows the reduction of the time needed to perform a maintenance operation and restore a failed device to the operating state. The results obtained with this first variation in the inputs of the model are shown in at the end of the section, in Table 3.
With respect to the base case, higher values of production and availability are obtained, maintaining the expectation of using a more capable vessel. However, a technical choice should always be accompanied by an economic one, including for instance considerations on the vessel daily rate and its running costs. Hence, before of an eventual final choice, a balance should be made between higher revenues due to greater availability of the farm and additional expenses due to higher vessel’s rates.
3.3. Variation 2: Planned Maintenance
A “scheduled maintenance” module is provided with the implemented tool. This can be used in order to introduce planned or periodic maintenance activities on any component of the devices which, as a consequence, will reset the failure distribution of the maintained component during the simulation. This action will have a positive impact provided that the failure distribution is variable, thus a scheduled maintenance operation results in a reduction of the instantaneous failure rate. As previously stated, the failure distributions used in this work are exponential, i.e., constant with time. Nevertheless, this variation is worth to be exemplified in order to illustrate the process to obtain support on the decision-making process in this area.
Therefore, a suggested practice consists of the following. First, a simulation of the lifecycle of the farm is run without any planned maintenance. This, among other information, permits the identification of the most sensitive components, or in other words, those that most contribute to the unavailability of the devices. Once these components have been identified, a scheduled maintenance plan can be devised for them. Repeating the simulation subsequently reveals how the maintenance planning affects the final results.
For this reason, the first step consists in using the capabilities of the computational model to identify those components of the device that most often have failed during the simulation, or, for reasons related to their repair time, constitute the majority of farm downtime.
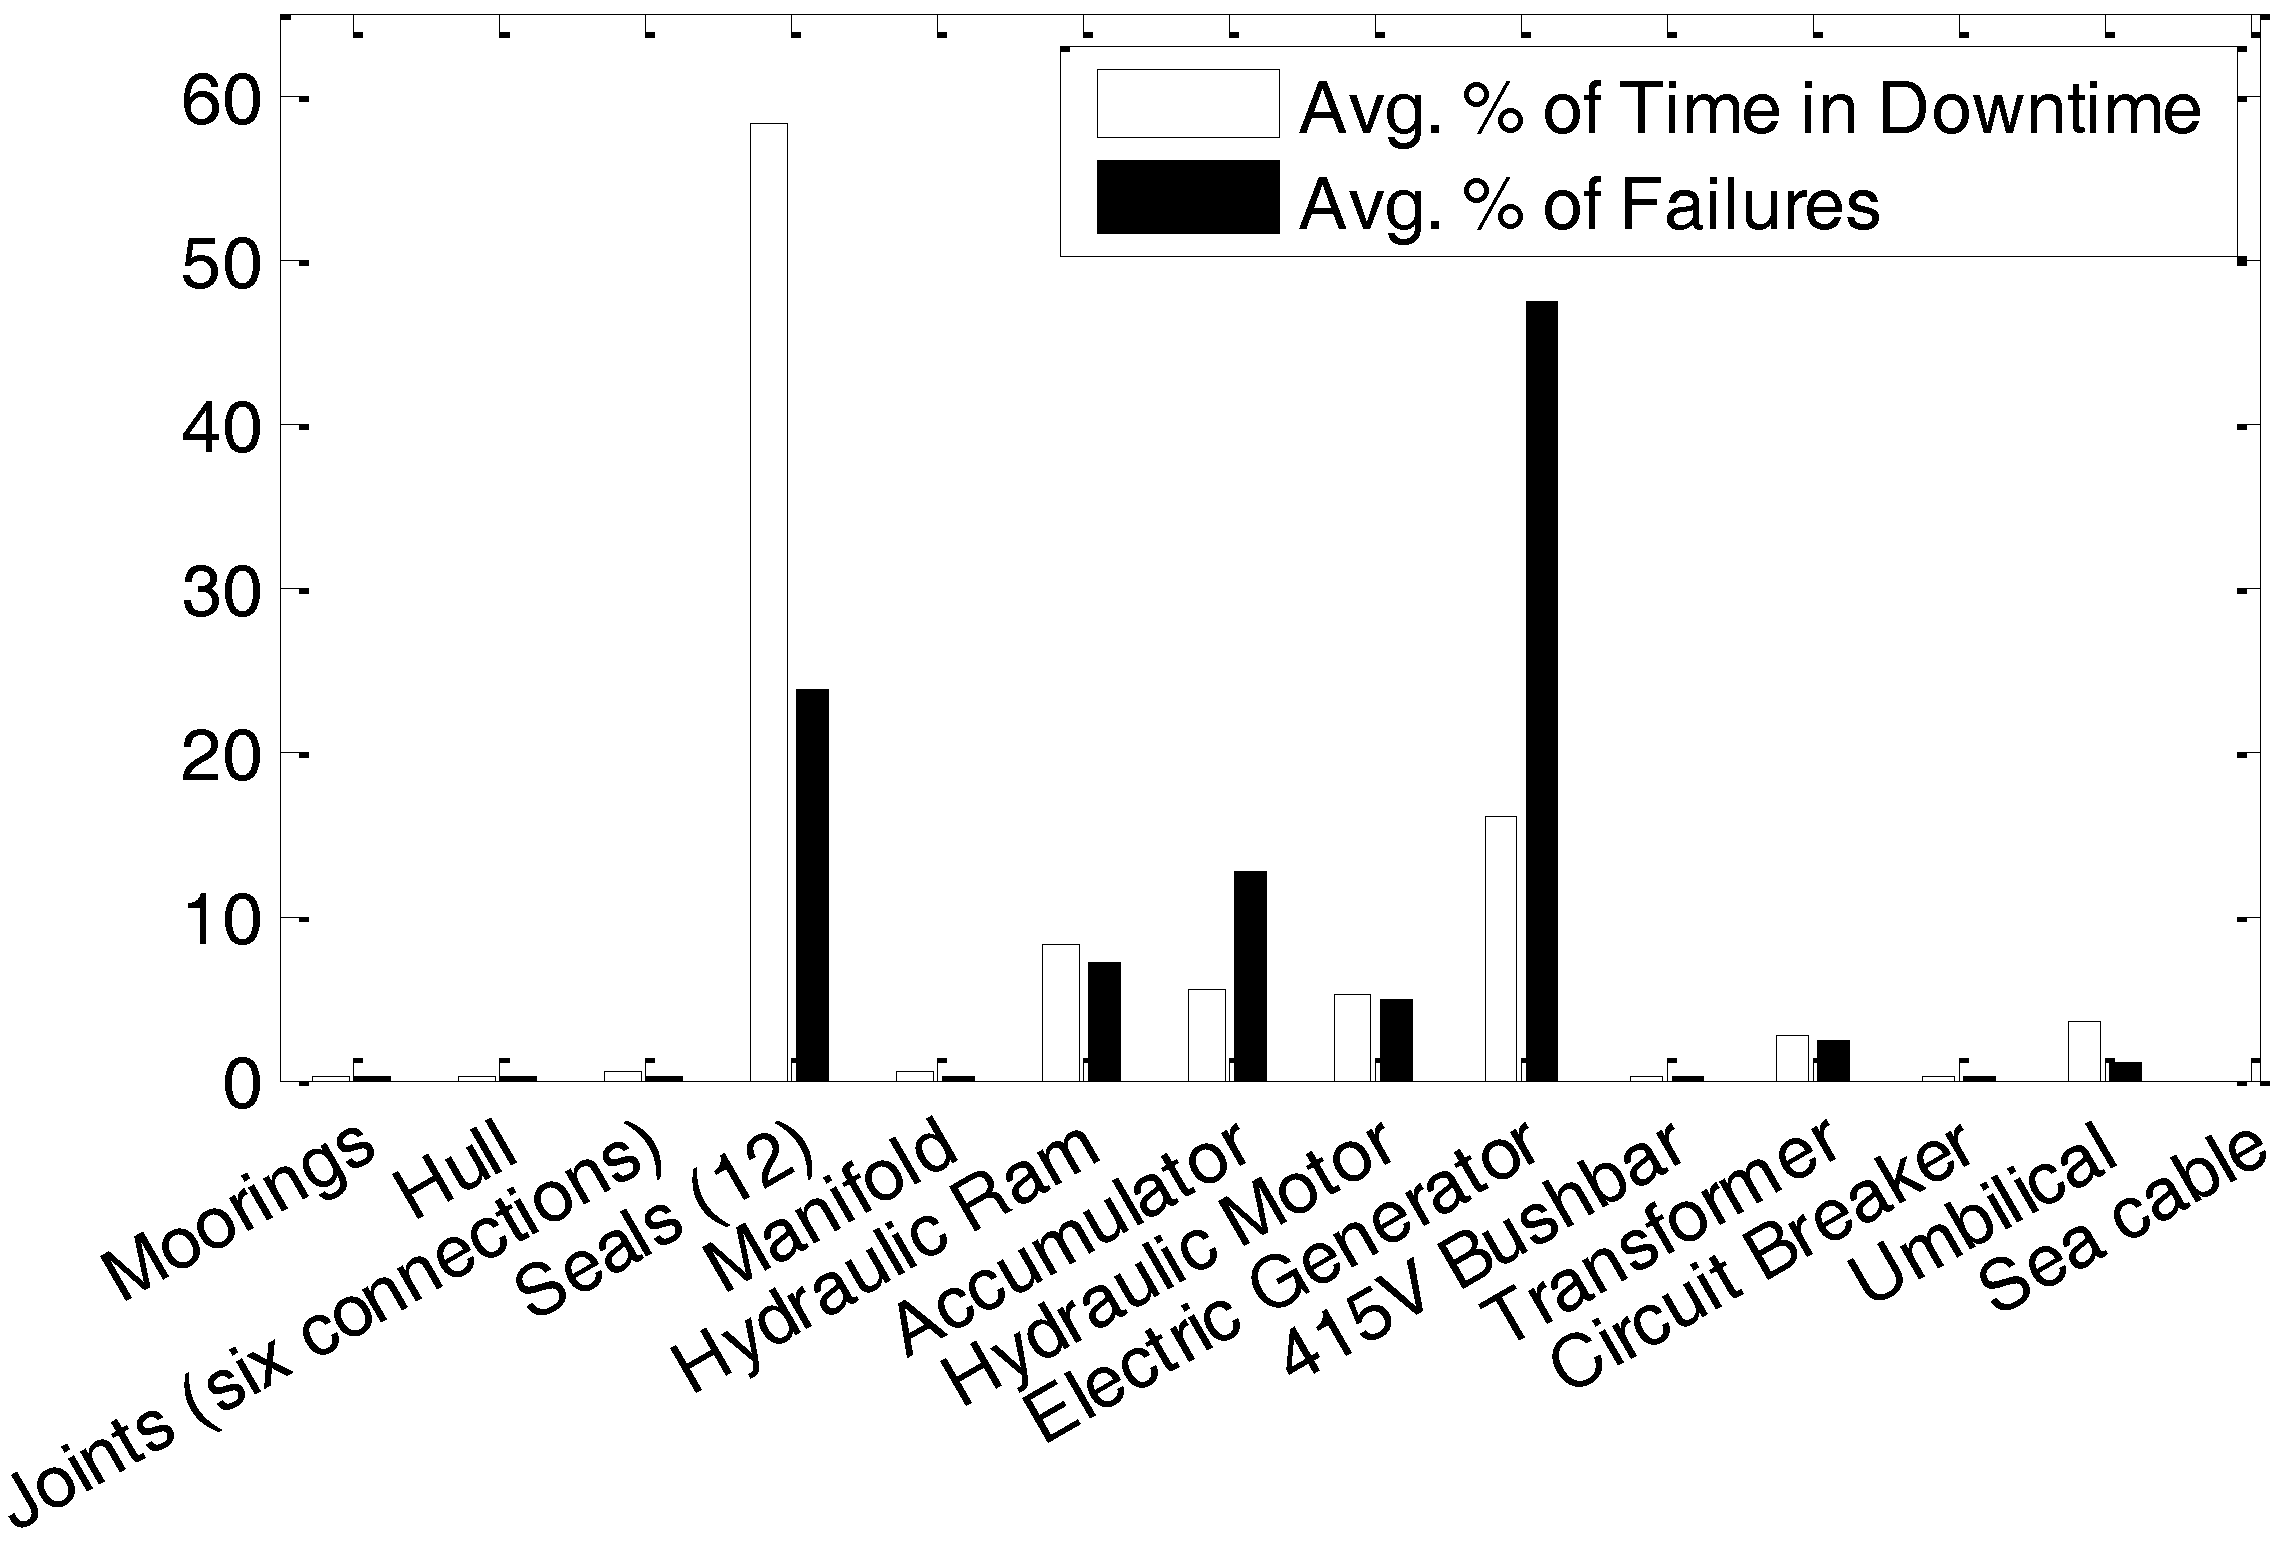
The chart in
Figure 2, relative to the base case scenario, permits to recognize both the aforementioned components and perform this distinction. The percentage contribution to the total number of failures and to the respective downtime caused is shown for each component.
From
Figure 2, the components that caused most downtime to the wave farm were, in descending order, the seals, the electric generator, the hydraulic ram, the accumulator and the hydraulic motor. Other contributions are less significant. A similar trend can be verified for the contribution to the total number of failures. Therefore, considering 10 years for the total simulated lifetime of the farm, the proposed planned maintenance strategy has been assumed as follows:
Every 2 years on the electric generator
Every 3 years on the seals
Every 5 years on accumulator and hydraulic ram
This maintenance strategy is further illustrated in
Table 2. In this case, even if the model allows the option of performing scheduled maintenance while the device is in operation, it has been assumed that the device requiring maintenance has to be shut down during the O&M procedures. Subsequently, this choice adds extra downtime with respect to the corrective maintenance regime alone, but a gain in availability may be obtained thanks to the reduction of the unpredicted failures. In addition, in this case the electricity lost due to the planned maintenance can be quantified, which resulted to be 0.5% of the ideal average annual generation.
However, from the results obtained, it can be seen that the planned maintenance activities did not have the desired effect of further improving energetic production and availability. As mentioned, this outcome was expected due to the choice of using exponential failure distributions, which do not take into account the effects of aging. While it is difficult to foresee the outcomes of this variation when the failure distributions variable has been chosen, attention must be paid to the planned number and duration of scheduled maintenance operations, ensuring that these do not outweigh the additional yield that can be achieved through the additional maintenance. In this case, if this strategy wants to be further applied, assumptions on maintenance intervals or number of maintained components have to be reduced. In addition, similar to the vessel’s choice, even a possible improvement in production values should be weighed with economic considerations in a final cost/benefits balance, e.g., possible increase in maintenance costs due to the introduction of planned activities.
3.4. Variation 3: Failure Rates
The third proposed variation is an improvement in the reliability of the WECs. This represents the eventual developers’ choice of using more reliable components in the design of the devices, with the goal of obtaining a decrease in the total number of faults or failures. When the inputs for the model are considered, this variation translates into the reduction of the failure rates of one or more selected components. As the most sensitive components have been identified in
Figure 2, it is recommendable to focus the efforts on these components. Therefore, for this variation of the base case scenario, a decrease of 20% in the failure rate of the two most delicate components (seals and electric generator) has been assumed due to improvements in the design of the device or the selection of better manufacturers for these assemblies. Major values might have been chosen for this variation, e.g., 40%–50%, supposing substantial improvements in the sizing and selection or the development of aging-aware designs [
22,
23,
24] for lifetime improvement of these components. However, a more conservative hypothesis has been preferred for this variation.
It should be noted that the scheduled maintenance operations have now been removed as they were not found to be advantageous to increasing the productivity. Conversely, the choice of the second vessel selected for the corrective maintenance is preserved.
In this case, the variation has resulted in the desired increase to productivity of the power plant. Analogously to previous variations, a definitive choice should take into account the cost necessary to include more reliable components in future designs of the device. A detailed yield optimization model allows the decision-maker to conduct a robust cost–benefit analysis on a sub-system or component level.
3.5. Variation 4: Redundancy
Once decisions on the positive impacts of a more capable vessel and a decrease in the failure rate of some of the device’s components have been ascertained, a last variation to the original inputs set is proposed. One of the modelling possibilities offered by the tool consists in selecting the number of redundant elements for each component. This allows to take into account the redundancy elements that permit an increase in the reliability of the device, since the system availability is still ensured in case of a component’s failure. This approach models the redundant elements of the device as connected in parallel, so that these can share the required load for the functioning of the whole system [
25]. A k-out-of-n scheme is also permitted, considering a system in which at least k out of n units of that kind are needed for the successful operation of the system.
In this variation, the total number of redundant elements for three components has been modified. According again to the previous indications of
Figure 2 on components that most contribute to device downtime, redundant elements have been introduced regarding seals, electrical generators and accumulators. The assumed variants are:
24 seals instead of 12 (only 12 needed for the functioning of the device)
2 accumulators instead of 1 (only 1 needed for the functioning of the device)
2 electric generators instead of 1 (only 1 needed for the functioning of the device)
Also this last variation has positive effects on the productivity of the wave farm, which now is close to that of an ideal case. However, the considerable change of design that would occur with the redundancy of important components of the device should be carefully kept in mind before any attempt at improvement based on this choice. Also the introduction of redundant elements has a cost which would need to be taken into account in a complete economic assessment of the improvements on the reliability of the farm.
4. Results
In order to obtain an immediate comparison of the effects of the four suggested optimization practices on the base case scenario, all the results of the variations are summarised in
Table 3.
As can be seen in
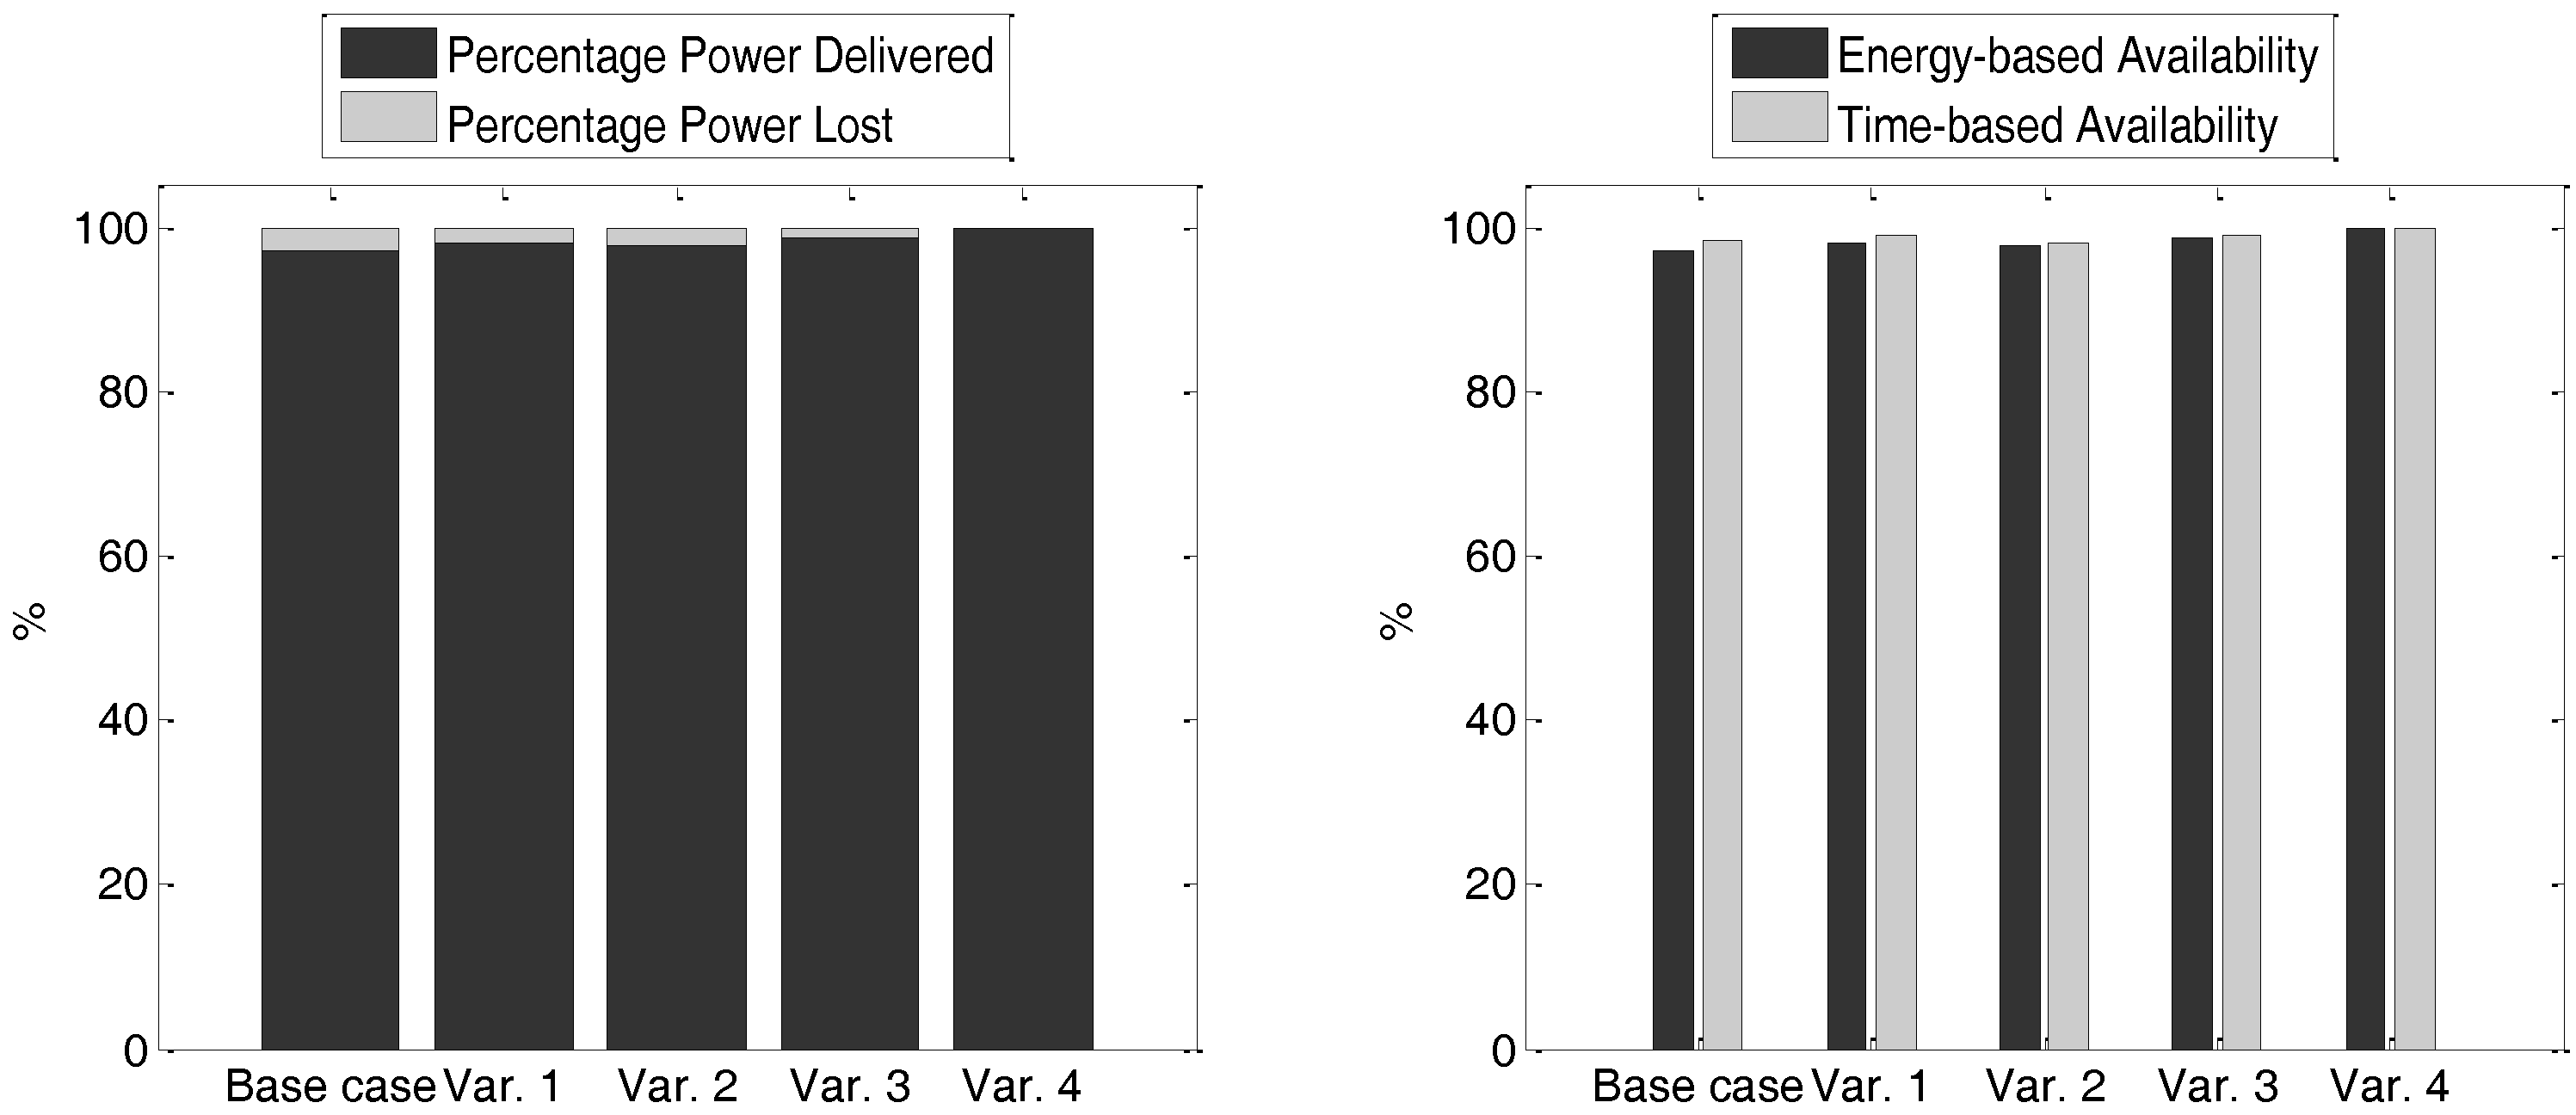
Table 3, all the variations proposed in this work have the intended effect of increasing the productivity of the farm, except for Variation 2 which consisted in the creation of a scheduled maintenance plan. This can be further visualized in
Figure 3, where the percentages of power delivered and lost with respect to the ideal production on one side, and the energy-based and time-based availability on the other side, are graphically analyzed for the different scenarios. In comparing the relative increase in production of Variation 2 with respect to the base case, even though it is positive, it must be remembered that the choice of a different vessel made in Variation 1 had been kept, therefore there actually is a decrease in relative production. As mentioned earlier, this is due to the choice of exponential failure distributions and a possible overemphasis on preventive undertakings; use of variable distributions and less conservative maintenance strategies may be considered for further optimization.
5. Conclusions
In this paper, a methodology for the optimization of the productivity of a marine farm is presented. A reliability-based computational tool that has been used for the simulations and both the energetic and economic assessment of the farm is introduced, and a case study to exemplify the modelling possibilities for the optimization procedure is illustrated.
The sample case study simulates the deployment of an array of five wave energy devices off the coast of the UK during a period of 10 years. Simulations have delivered estimations on the energetic production and availability of the farms, providing a base case scenario with no optimization procedures and taking corrective maintenance only into account.
Under these circumstances, the projected energetic values differ from the ideal ones due to the simulated failures and consequent repair processes, leaving room for improvement in productivity. As a consequence, four optimization procedures are proposed to illustrate how a reliability centered optimization model can be used to increase production and availability values. The model allows for the convenient variation of key designs and operational parameters that can subsequently be evaluated with regard to their effectiveness.
By performing an iterative simulation of the farm operation, we show that it is possible to identify criticalities in the setup and management of the wave farm. Consequently, acting on these areas, it is possible to improve the productivity of the farm and obtain valuable information for the decision-making process that involves both device developers and project managers in the pursuit of optimal asset use.
The results and the optimization procedures proposed can be further improved once more specific reliability data and operational experience with marine renewables is acquired. Likewise, further options for the optimization of the farm using this computational tool can arise as practice is gained with the management of a project. Future work includes the integration of a complete cost assessment for the different options in order to have a complete picture of the effects of each optimization procedure. The presented work will be useful to device developers, asset owners and contractors to estimate the effectiveness of design decisions and to identify suitable maintenance regimes.
Acknowledgements
The work in this paper has been conducted within the multinational Initial Training Network (ITN) OceaNET, funded under the PEOPLE Programme (Marie Curie Actions) of European Union’s FP7. Mojo Maritime have provided access to Mermaid to support, and for integration with, this research.
Author contributions
Giovanni Rinaldi has jointly conceived the study with other co-authors, developed and implemented the modelling tool proposed, and prepared the manuscript. Philipp Thies has developed the original reliability assessment approach that forms part of the presented model, suggested the case study and provided advice and reviews throughout the manuscript preparation. Rich Walker performed the research which lead to the creation of Mermaid and provided support in the simulation of offshore operations, the results of which are integral to the proposed tool. Prof Lars Johanning is directing the research activities and guiding the co-author as principal supervisor. He advised in the generation of the manuscript and contributed to contents presented.
Conflicts of Interest
The authors declare no conflict of interest.
Appendix
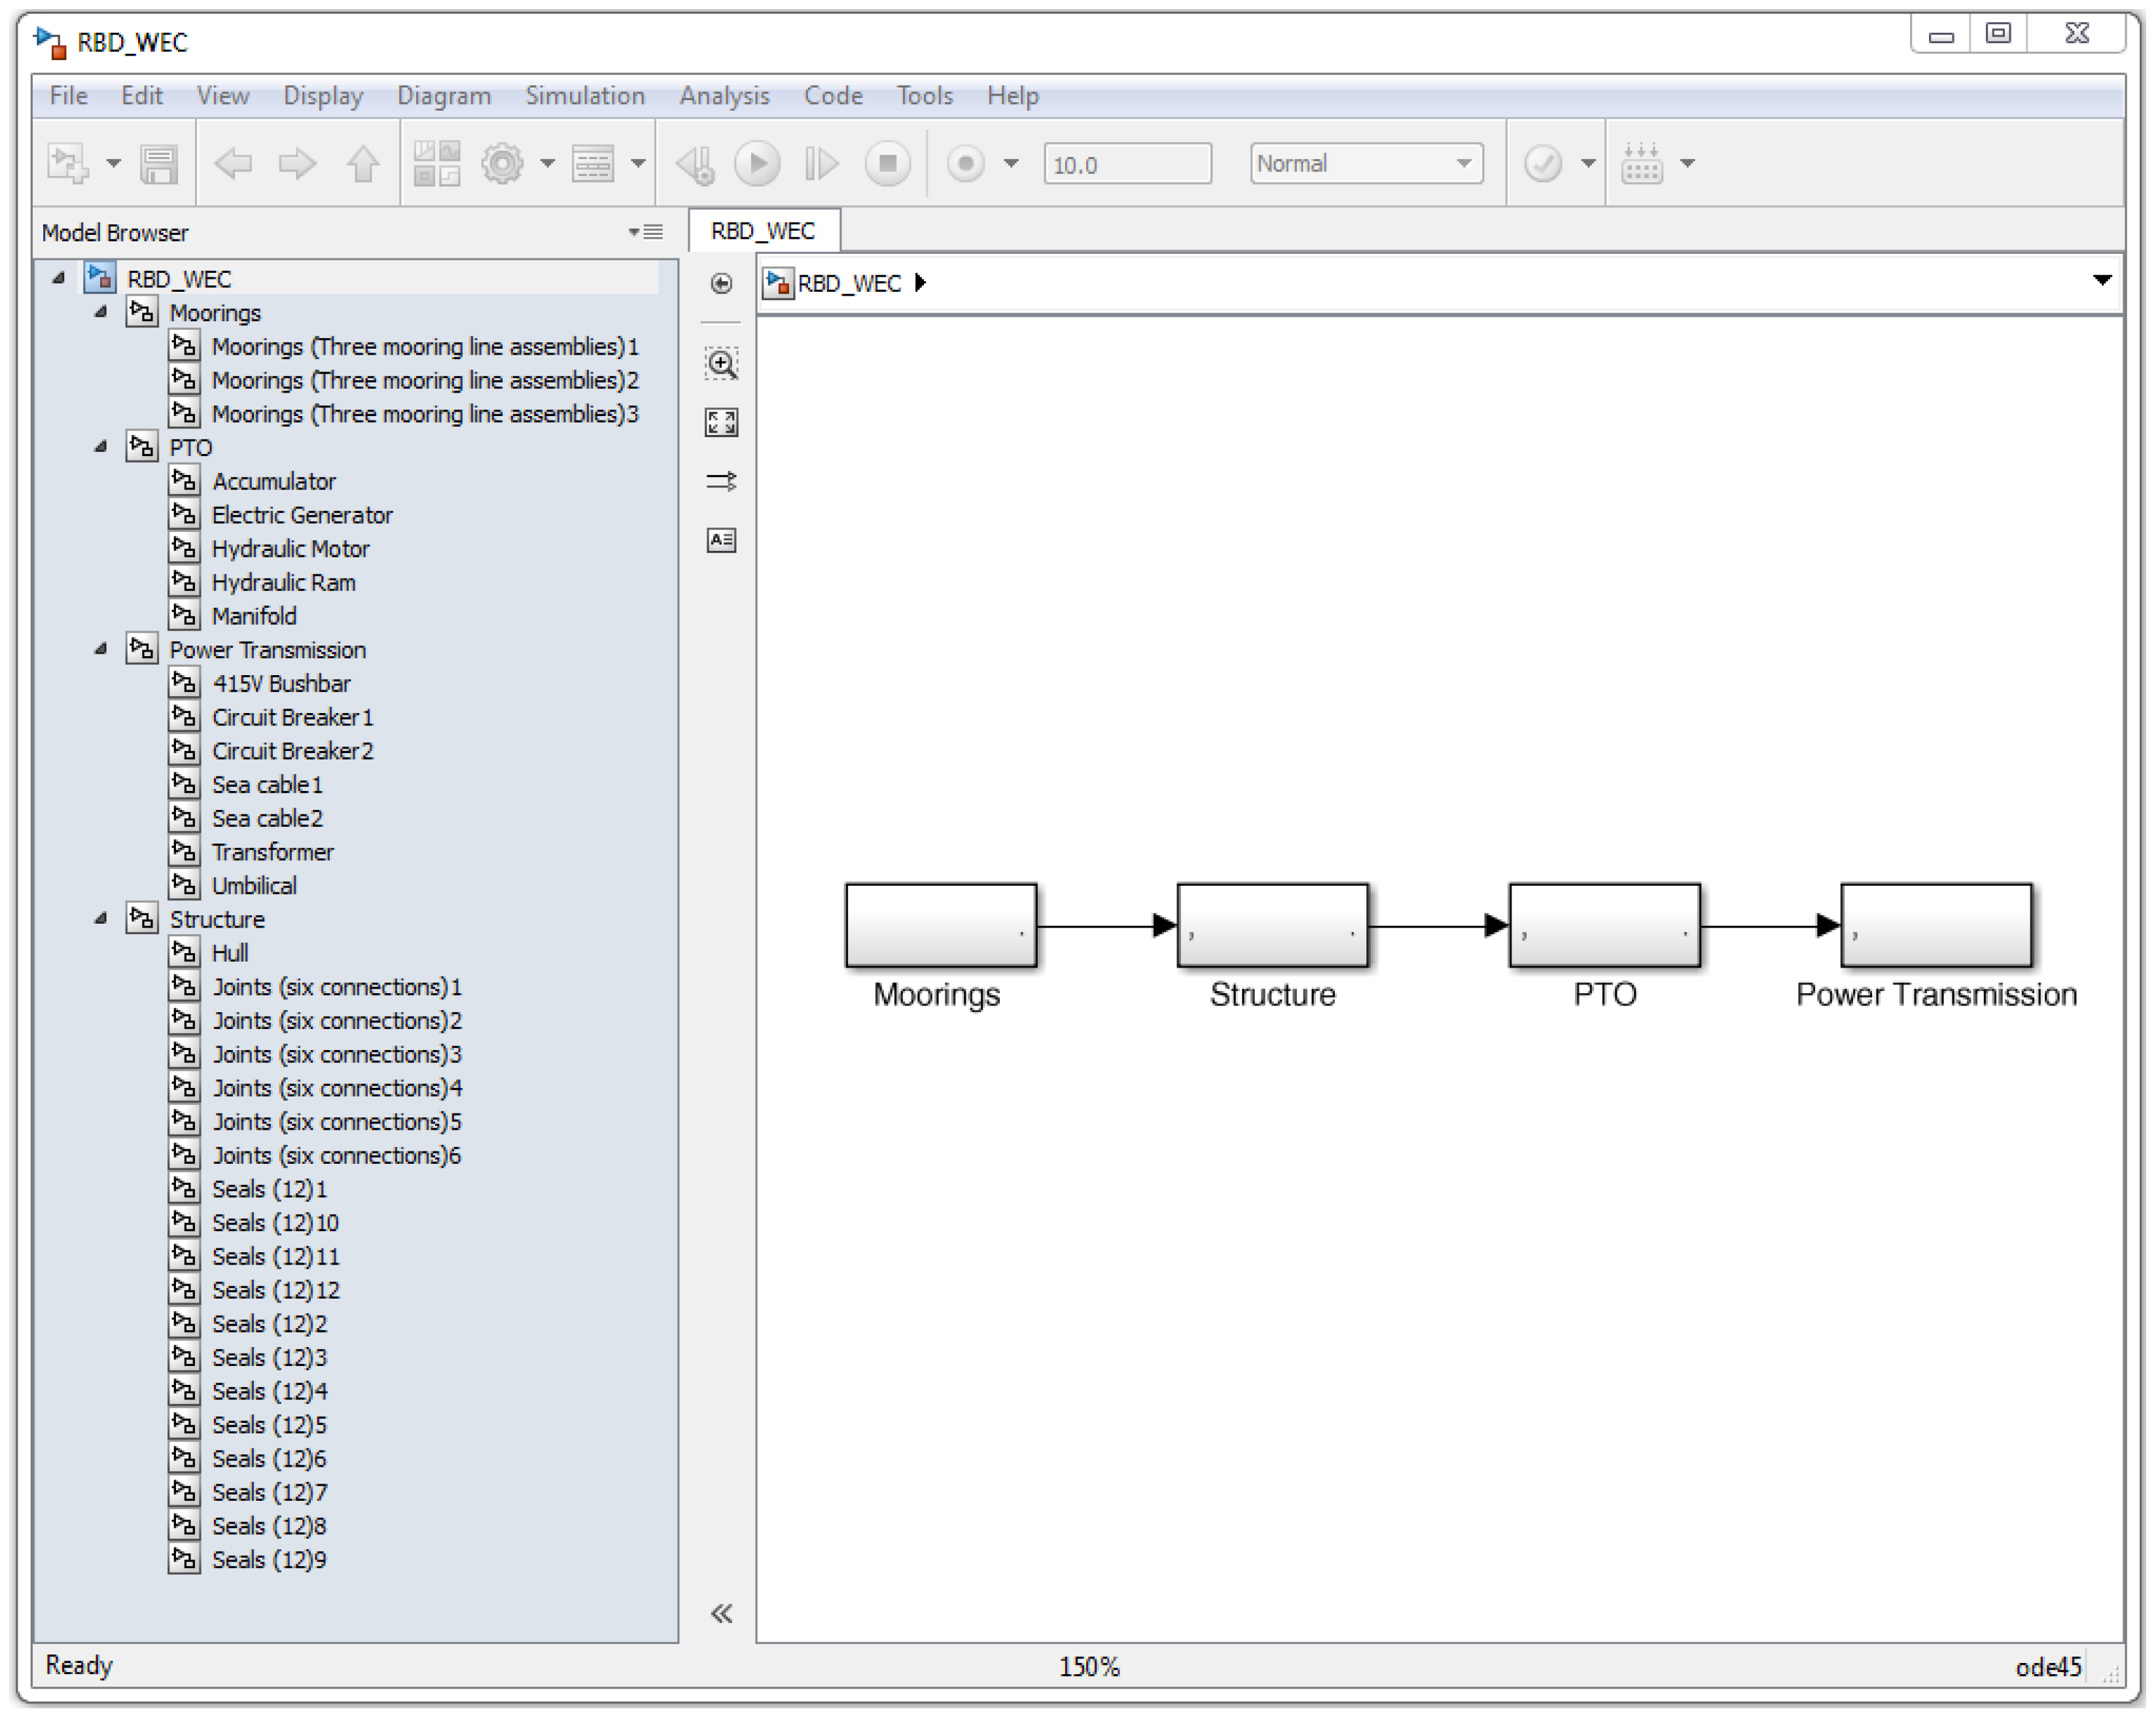
In
Figure A1 the RBD of the device selected for the case study is illustrated. It has been created using the block diagram environment provided with Simulink (
http://cn.mathworks.com/products/simulink/index.html), and shows the main subsystem of the device. The components within each subsystem are listed on the left. Original Simulink file is available on request.
Figure A1.
Reliability Block Diagram (RBD) in Simulink® showing the considered subsystems of the device.
Figure A1.
Reliability Block Diagram (RBD) in Simulink® showing the considered subsystems of the device.
References
- Esteban, M.; Leary, D. Current developments and future prospects of offshore wind and ocean energy. Appl. Energy 2012, 90, 128–136. [Google Scholar] [CrossRef]
- Falcão, A.F.D.O. Wave energy utilization: A review of the technologies. Renew. Sustain. Energy Rev. 2010, 14, 899–918. [Google Scholar] [CrossRef]
- Newman, M.; Murphy, O.; Lewin, A. Cost Reduction Monitoring Framework 2015. 2016. Available online: https://ore.catapult.org.uk/wp-content/uploads/2016/05/Cost-Reduction-Monitoring-Framework-2015.-Qualitative-report.pdf (accessed on 29 June 2016).
- Uihlein, A.; Magagna, D. Wave and tidal current energy—A review of the current state of research beyond technology. Renew. Sustain. Energy Rev. 2016, 58, 1070–1081. [Google Scholar] [CrossRef]
- Hofmann, M. A review of decision support models for offshore wind farms with an emphasis on operation and maintenance strategies. Wind Eng. 2011, 35. [Google Scholar] [CrossRef]
- Nielsen, J.S.; Sorensen, J.D. Methods for risk-based planning of O&M of wind turbines. Energies 2014, 7, 6645–6664. [Google Scholar]
- Teillant, B.; Costello, R.; Weber, J.; Ringwood, J. Productivity and economic assessment of wave energy projects through operational simulations. Renew. Energy 2012, 48, 220–230. [Google Scholar] [CrossRef]
- Endrerud, O.V.; Liyanage, J.P.; Keseric, N. Marine Logistics Decision Support for Operation and Maintenance of Offshore Wind Parks with A Multimethod Simulation Model. In Proceedings of the Winter Simulation Conference, Savannah, GA, USA, 7–10 December 2014.
- Martin, R.; Lazakis, I.; Barbouchi, S.; Johanning, L. Sensitivity analysis of offshore wind farm operation and maintenance cost and availability. Renew. Energy 2016, 85, 1226–1236. [Google Scholar] [CrossRef] [Green Version]
- Takeshi, M. A Monte Carlo simulation method for system reliability analysis. Nucl. Saf. Simul. 2013, 4, 44–52. [Google Scholar]
- Korver, B. The Monte Carlo Method and Software Reliability Theory. Available online: http://www.mirabilisdesign.com/new/software/demo/Others/Reliability/BrianKorverMonteCarlo.pdf (accessed on 29 June 2016).
- Reliability Block Diagram (RBD). Available online: http://www.reliabilityeducation.com/rbd.pdf (accessed on 29 June 2016).
- Nune Ravi, S.; Bantwal, S.P. Modified approach for prioritization of failures in a system failure mode and effects analysis. Int. J. Qual. Reliab. Manag. 2001, 18. [Google Scholar] [CrossRef]
- van Nieuwkoop, J.C.C.; Smith, H.C.M.; Smith, G.H.; Johanning, L. Wave resource assessment along the Cornish coast (UK) from a 23-year hindcast dataset validated against buoy measurements. Renew. Energy 2013, 58. [Google Scholar] [CrossRef]
- Yemm, R.; Pizer, D.; Retzler, C.; Henderson, R. Pelamis: Experience from concept to connection. Philosofical Trans. R. Soc. 2012, 370, 365–380. [Google Scholar] [CrossRef] [PubMed]
- Henderson, R. Design, simulation, and testing of a novel hydraulic power take-off system for the Pelamis wave energy converter. Renew. Energy 2006, 31, 271–283. [Google Scholar] [CrossRef]
- Pelamis Wave Power. Available online: http://ctp.lns.mit.edu/energy/files/pelamisbrochure.pdf (accessed on 29 June 2016).
- Thies, P.R.; Flinn, J.; Smith, G.H. Is it a showstopper? Reliability assessment and criticality analysis for Wave Energy Converters. In Proceedings of the 8th European Wave and Tidal Energy Conference, Uppsala, Sweden, 7–10 September 2009.
- Mcauliffe, F.D.; Macadre, L.; Donovan, M.H.; Murphy, J.; Lynch, K. Economic and Reliability Assessment of a Combined Marine Renewable Energy Platform. In Proceedings of the 11th European Wave and Tidal Energy Conference, Nantes, France, 6–11 September 2015.
- Department of Energy & Climate Change. Investing in Renewable Technologies—CfD Contract Terms and Strike Prices. Available online: https://www.gov.uk/government/publications/investing-in-renewable-technologies-cfd-contract-terms-and-strike-prices (accessed on 29 June 2016).
- Mojomaritime Reducing Risk-Reducing Cost. Available online: http://mojomaritime.com/en/rd/hf4/ (accessed on 29 June 2016).
- Thibaut, K.; Judicael, A.; Bernard, M.; Hamid, B.A. Influence of IGBT Current Rating on the Thermal Cycling Lifetime of a Power Electronic Active Rectifier in a Direct Wave Energy Converter. In Proceedings of Power Electronics and Applications (EPE), 15th European Conference, Lille, France, 2–6 September 2013; pp. 1–10.
- Ambühl, S.; Ferri, F.; Kofoed, J.P.; Sørensen, J.D. Fatigue reliability and calibration of fatigue design factors of wave energy converters. Int. J. Mar. Energy 2015, 10, 17–38. [Google Scholar] [CrossRef]
- Murray, B.; Hayes, J.G.; Egan, M.G.; Sullivan, D.L.O. Supercapacitor testing for power smoothing in a variable speed offshore wave energy converter. J. Ocean. Eng. 2012, 37, 301–308. [Google Scholar] [CrossRef]
- Mustafa, A. Reliability equivalence factors for some systems with mixture weibull failure rates. Am. J. Math. Stat. 2012, 2. [Google Scholar] [CrossRef]
© 2016 by the authors; licensee MDPI, Basel, Switzerland. This article is an open access article distributed under the terms and conditions of the Creative Commons Attribution license ( http://creativecommons.org/licenses/by/4.0/).


