Article

Analysis of Sharp Eagle Oscillating Surge Wave Energy Converter Based on a Two-Dimensional Numerical Wave Flume Model

1
Key Laboratory of High Performance Ship Technology (Wuhan University of Technology), Ministry of Education, Wuhan 430063, China
2
School of Naval Architecture, Ocean and Energy Power Engineering, Wuhan University of Technology, Wuhan 430063, China
3
Sanya Science and Education Innovation Park of Wuhan University of Technology, Sanya 572019, China
4
Central South Architectural Design Institute, Wuhan 430071, China
*
Author to whom correspondence should be addressed.
J. Mar. Sci. Eng. 2023, 11(8), 1607; https://doi.org/10.3390/jmse11081607
Submission received: 21 June 2023 / Revised: 10 August 2023 / Accepted: 14 August 2023 / Published: 17 August 2023
(This article belongs to the Topic Wind, Wave and Tidal Energy Technologies in China)

Abstract

:
To investigate the overtopping and slamming phenomena that occur in the interactions between waves and oscillating surge wave energy converters (OSWECs), a two-dimensional numerical wave flume was established using computational fluid dynamics (CFD) software Fluent by adding the momentum source terms into the original Navier–Stokes equation. Numerical convergence studies of the mesh sizes and time steps were firstly performed to ensure the sufficient accuracy of the numerical model. The variations in the wave heights along the wave propagation direction in the wave-generating area, working area, and wave-absorbing area were analyzed. The dynamics of the flap-type OSWEC were simulated using the overset mesh function embedded in Fluent. In addition, the numerical results were compared with the experimental data, and good agreements were achieved. External torque was applied to the hinge joint of the OSWEC to simulate the forces due to the power take-off (PTO) system, and the identified optimal PTO damping was compared with the numerical results based on the potential flow theory, which verified the correctness of the numerical PTO system. On this basis, nonlinear wave slamming by the sharp-eagle OSWEC was analyzed. The results show that under certain incident wave conditions, the sharp-eagle OSWEC can effectively reduce the maximum rotation angle and angular velocity compared with those of the flap-type OSWEC, and there is no overtopping that occurring for the sharp-eagle OSWEC. Furthermore, the sharp-eagle OSWEC performs better than the flap-type OSWEC.

1. Introduction

As a renewable, pollution-free, and sustainable energy source, wave energy has attracted more attention in recent years, and how to improve conversion efficiency has become a key issue in this field [1,2,3]. Although a wide range of wave energy convertor (WEC) devices has been proposed, these devices can be generally categorized into three groups, namely, overtopping devices, oscillating water column devices, and oscillating bodies [4,5]. Among the various WEC concepts, the oscillating surge wave energy converters (OSWECs) in the oscillating bodies group has attracted much attention due to their ease of fabrication and maintenance compared with other floating WECs, as well as the elimination of the mooring system. Unlike the heaving oscillating devices, such as the point absorber WECs [6], OSWECs are bottom-hinged surface-piercing flaps, which operate in pitch mode to convert wave energy into electricity [3,4]. One typical example of such device is the well-known Oyster [4,5], which was particularly designed to deploy in relatively shallow water.
At present, laboratory tests are still the most reliable way to study the hydrodynamic response and power generation efficiency of OSWECs under wave excitations. Henry et al. [7,8] carried out model tests in a water flume to study the responses of a bottom-hinged flap under wave excitations. Wei et al. [9,10] studied the influence of viscosity on the performance of OSWECs and slamming phenomena in a wave tank at Queen’s University Belfast. Furthermore, experimental studies were carried out to investigate the effects of hydraulic PTO on the energy conversion efficiency of OSWECs [11,12]. Ning et al. [13] studied the hydrodynamic performance of OSWECs under both regular and irregular waves through experiments. In addition, many scholars have optimized the geometries of OSWECs to improve their efficiency. Sell et al. [14] studied a strongly asymmetric OSWEC CCell with a self-zeroing position controller at the Kelvin Hydrodynamics Laboratory. Ruehl et al. [15] studied a dual-flap floating OSWEC in regular waves and compared the experimental data results with the numerical results obtained using the WEC-Sim program. Choiniere et al. [16] studied the load shedding characteristics of OSWECs with variable geometries. In addition, the adjustable flap provides another control and adjustment capability for OSWECs, which has been studied by many researchers (see, for example, Tom et al. [17,18]).
Linear theory in the potential flow frame is the most popular method used to analyze the interactions between OSWECs and waves in the evaluations of energy conversion efficiency. Chow et al. [19] investigated the influence of inertia parameters on the energy conversion efficiency of a bottom-hinged OSWEC based on linear potential flow theory. Sun et al. [20] performed fully nonlinear time domain analyses to investigate the influence of wave frequency and wave height on the energy conversion efficiency of an OSWEC. Some scholars have also studied the influence of PTO systems on energy conversion efficiency using the high-order boundary element method (HOBEM) [21,22,23]. Based on potential flow theory, the performance of multiple OSWECs can also be studied (see, for example, Cheng et al. [24] and Renzi et al. [25]). Recently, Zou et al. [26] established an efficient constant parameter time-domain model for a multibody system, which can be applied in the investigation of multiple OSWECs.
Although numerical approaches based on potential theories can provide insight into the hydrodynamics of OSWECs, they are unable to capture viscous and other nonlinear effects, such as overtopping and slamming. Advanced CFD methods, such as the smoothed particle hydrodynamics (SPH) method, which is a meshless Lagrangian method using the particle interpolation method to compute smooth field variables, have been applied to further study the performance of OSWECs. For this method, each particle has independent physical information (mass, density, pressure, position, velocity, and internal energy). Thus, it can be easily applied to simulate free-surface flows, especially for water wave splashing and fragmentation [27]. Liu et al. [28,29] applied the SPH method to investigate the performance of a bottom-hinged OSWEC, and their numerical results were in good agreement with the experimental results. By using the SPH method, Zhang et al. [30] found that the power generation of bottom-hinged OSWECs largely depends on the mechanical damping coefficient of the PTO and wave period. Zhang et al. [31] developed an efficient fully Lagrangian solver for modeling wave interactions with OSWECs, which couples SPHinXsys with Simbody, presenting an object-oriented application programming interface for multibody dynamics. This model can accurately simulate the wave elevation, flap rotation, and wave loading on the flap, with the computational cost of the CPU being significantly lower. In addition to the SPH method, the open-source software OpenFOAM 5.0 has been widely used to analyze wave interactions with OSWECs, which can consider the effects of the fluid viscosity by solving the Navier–Stokes equations using the alternative mesh morphing method. The analyses using OpenFOAM showed good agreement with the experimental results [32]. In addition, Lin et al. [33] studied the influences of the geometrical and inertial parameters of OSWECs on the conversion efficiency using FLOW-3D V9.2 software.
In this study, a two-dimensional numerical wave flume model was established based on the professional CFD software Fluent 6.3 by adding the momentum source term into Navier–Stokes equations to investigate the dynamics and power generation performance of OSWECs under regular wave excitations. The established numerical model was verified with published experimental data of a bottom-hinged OSWEC. By adding external torque at the hinge point to simulate the PTO system, the optimum mechanical damping obtained via numerical calculation was found to be in good agreement with the theory. On this basis, the established model was applied to study the slamming phenomena and energy conversion efficiency of a sharp-eagle-shaped section OSWEC. This paper is arranged as follows: Section 2 briefly describes the mathematical background of the established model. Validations of the numerical model with experimental dada and discussions are shown in Section 3. Numerical results and a discussion for the sharp-eagle OSWEC are given in Section 4. Finally, some concluding remarks are provided in Section 5.

2. Mathematical Background of the Numerical Model

2.1. Governing Equations

In the present research, a fully functional two-dimensional numerical wave flume was considered, as shown in Figure 1, which can accurately generate waves and avoid unphysical reflections. In the direction of wave prorogation (from left to right), the numerical wave flume can be divided into 4 partitions according to function: partition P1-wave-generating source area, partition P2-wave-absorbing source area in front of the OSWEC, partition P3 working area, and partition P4-wave-absorbing source area behind the OSWEC. Partition P1 was set in the left part of flume to generate the required waves. Partition P2 was next to Partition P1 to absorb the reflected waves due to the presence of the OSWEC and to let the incident waves pass through. Partition P3 was next to Partition P2 to simulate the required wave–structure interactions. Partition P4 was in front of the right boundary to absorb the transmitted waves and avoid the reflections from the right boundary of the flume.
The governing equation of the two-dimensional numerical wave flume model is based on the Navier–Stokes equations with additional momentum source terms, which can be expressed as follows [34]:
ρ t + ( ρ u ) x + ( ρ v ) y = 0
( ρ u ) t + u ( ρ u ) x + v ( ρ u ) y = μ ( 2 u x 2 + 2 u y 2 ) p x i + S x
( ρ v ) t + u ( ρ v ) x + v ( ρ v ) y = μ ( 2 v x 2 + 2 v y 2 ) p y ρ g + S y
where u and v are the velocity components in the x and y directions; ρ is the fluid density; p is the fluid pressure; μ is the dynamic viscosity coefficient; g is acceleration due to gravity; Sx and Sy are the additional momentum source terms in the x and y directions.

2.2. Momentum Source Terms for Wave Generation and Absoption

In Equations (2) and (3), the additional momentum source terms in the generating region (Partition P1 in Figure 1) at time step n can be expressed as:
S x = ( 1 C ) ( p j x ρ u j n Δ t ) + ρ ( 1 C 2 ) ( u j u j x + v j u j y )
S y = ( 1 C ) ( p j y ρ v j n Δ t ) + ρ ( 1 C 2 ) ( u j v j x + v j v j y ) + ρ g
where C is the weighting function of the smooth transition related to the spatial position; subscript j indicates the calculated value; Δt represents the size of the time step.
In Equations (2) and (3), the additional momentum source terms in Partition P2 in Figure 1 at time step n can be expressed as:
S x = ρ Δ t ( C 1 ) ( u j n u l n ) + ρ ( 1 C ) ( 1 ρ p j x + u l t + u l u l x + v l v l y ) ρ ( C 2 1 ) ( u j u j x + v j u j y ) ρ ( 1 C 2 ) ( u l u l x + v l u l y ) ρ C ( 1 C ) [ u j ( u l x + v j u j y ) + ( u l u j x + v j u j y ) ]
S y = ρ Δ t ( C 1 ) ( v j n v l n ) + ρ ( 1 C ) ( 1 ρ p j y + v l t + u l u l x + v l v l y + g ) ρ ( C 2 1 ) ( u j v j x + v j v j y ) ρ ( 1 C 2 ) ( u l v l x + v l v l y ) ρ C ( 1 C ) [ ( u j v l x + v j v l y ) + ( u l v j x + v l v j y ) ]
In Equations (2) and (3), the additional momentum source terms in Partition P4 in Figure 1 at time step n can be expressed as:
S x = ( 1 C ) ( p l x ρ u l n Δ t ) + ρ ( 1 C 2 ) ( u l u l x + v l u l y )
S y = ( 1 C ) ( p l y ρ u l n Δ t ) + ρ ( 1 C 2 ) ( u l v l x + v l v l y ) + ρ g
The aforementioned additional momentum sources in Equations (2)–(9) were implemented using the DEFINE_SOURCE macro in the user-defined function (UDF) of Fluent.

2.3. The Volume of Fluids Method

The volume of fluids (VOF) method was used to track the free surface. Therefore, the volume fraction α was introduced. When α = 0, there is air in the cell. When α = 1, all the cells are full of water. When 0 < α < 1, there is mixture of water and air in the cell. The volume fraction α needs to satisfy the following equation:
α t + ( u α ) x + ( v α ) y = 0

2.4. Equation of Motion of OSWECs

OSWECs are in oscillatory rotation under the excitation of waves, and their hydrodynamic behavior was investigated through the time-stepping method. It was expected that the rotation of the OSWEC would be resisted by the forces exerted by the power take-off system and generator. Thus, the equation of motion of an OSWEC can be expressed as [20]:
( I + a p t o ) γ ¨ + b p t o γ ˙ + c p t o γ = M
where the dot denotes the temporal derivative, I is the rotational inertia of the OSWEC about the hinge; αpto and cpto represent the inertia and elastic characteristics of the power take-off system and generator, respectively; bpto denotes the mechanical damping due to the power take-off and generator which is simulated by the user-defined function (UDF) in Fluent; M is the moment due to the fluid as well as gravity; γ denotes the angular displacement of the OSWEC.
The power per unit length E P extracted by the converter over each motion cycle is the average of the work performed to the converter by the fluid over several periods, which can be obtained by:
E P = b p t o N T t t + N T γ ˙ 2 d t
where T is the period of the body motion; N is an integer denoting the number of motion cycles considered.
When the wave amplitude and motion amplitude are small, the problem can be linearized in the potential flow frame. Equation (12) can be simplified as:
E P = 1 2 b p t o | M ¨ | 2 [ ( I + a p t o + a z ) ω ( c p t o + c z ) / ω ] 2 + ( b p t o + b z ) 2
where az and bz are the effectively linear added mass and radiation damping coefficients, which are both functions of the wave frequency ω; cz is the restoring force coefficient due to the difference in the contributions from the hydrostatic term and the weight of the flap.
When the incident wave frequency ω is given, the optimized damping coefficients to achieve the maximum power output can be expressed as [20]:
b p t o = b o p t = [ ( I + a p t o + a z ) ω 2 ( c p t o + c z ) ] 2 ω 2 + b z 2

3. Validations of the Established 2D Numerical Wave Flume

3.1. Convergence Study

A numerical wave flume, as shown in Figure 1, was established in Fluent. A typical wave with period T = 1.9 s and H = 0.1 m was selected [7] in the present study, with wave length λ = 3.2 m in water depth dw = 0.305 m. The total length of the numerical flume L was 5λ, and the total height of numerical flume d was 0.8 m. The length of the wave-generating area Lg was λ; the length of the wave-absorbing area in front of the OSWEC Lqx was 2λ; the length of the working area Lw was λ; the length of the wave-absorbing area behind the OSWEC Lhx was λ. The distance between the OSWEC and the left boundary of the numerical flume Lf was 11.0 m. The upper boundary of the numerical wave flume was set as ‘Pressure outlet’, and all other boundaries were set as ‘wall’.
To minimize the attenuation of the wave height along the propagating direction, meshes in the vertical direction of the wave flume were much denser than those in horizontal direction, as shown in Table 1. The convergence analysis was carried out in the flume without structures to eliminate the influence of mesh size and time step on the accuracy of the numerical results. There were three cases considered in the present study, which are summarized in Table 1. For cases a and b, the same time steps were adopted, but denser meshes were used in case b. For cases a and c, the mesh sizes were the same, but a smaller time step was set in case a. The time histories of the surface elevation at x = 11.0 m (an OSWEC will be considered here in further studies) in the three cases are shown in Figure 2. It can be observed that convergence was achieved in the three cases. The settings of the mesh size and time step in case a were used in the following analysis.
In addition, the ratio between the monitored and target wave heights over the propagating direction is shown as black solid line in Figure 3 (Red dot line presents incident wave height). It can be seen that wave heights dramatically fluctuated in Partitions P1 and P2, then gradually reached the target wave heights and remained stable within the working area (Partition P3). This indicated that the generated wave could be used in the analysis of wave–OSWEC interactions. In addition, as shown in Figure 3, the wave height was observed to drastically decrease in the wave-absorbing area behind the OSWEC (Partition P4), which implied that the reflected waves from the right boundary of the flume could be ignored in further analyses.

3.2. Geometry and Meshes of OSWEC

Referring to the experiment reported by Henry et al. [7], the model of the OSWEC in our further analysis is shown in Figure 4, which was hinged on the seabed. The particulars of the flap are summarized in Table 2. In the present study, overset meshes were used to bring together different parts of the computational domain and move them relative to one another without having to remesh multiple time (as shown in Figure 5). The overset meshes consisted of component mesh and background mesh. The component mesh is shown in Figure 5a, where there is a hole representing the flap profile. The boundary condition of the hole was set as the wall, and the outer boundary condition of the component mesh was set as the overset. The background mesh was used for wave generation and absorption, which remained stationary, as mentioned in Section 3.1. The compositions of the component mesh and background mesh are shown in Figure 5b. All numerical simulations were completed on a workstation with an Intel E5-2623 v3. CPU (4 cores and 8 threads), which required 7~9 h depending on the total number of meshes and time steps.

3.3. Verification of the Estblished Numerical Wave Flume

Figure 6 and Figure 7 show comparisons of the angular displacements and velocities of the flap between the present results and the experimental data [7]. Good agreements were achieved, which validated the accuracy of the present numerical model.
The numerical predictions of the pressure distribution and the corresponding streamlines around the flap are provided in the right column in Figure 8, and the experimental observations at the same time instants are provided in the left column in Figure 8. It can be observed that the flap motions and flow fields obtained with the present model generally agreed well with the experimental observations. In particular, as shown in Figure 8a,b, the “wave overtopping” phenomenon was observed, which corresponded to the instant when the flap reached its maximum angular rotation. For this situation, two distinct characteristics of water particle movement could be observed: (1) the water particles of the whole water body moved toward the back of the flap, namely, from the left to the right side, as shown in Figure 8b; (2) the water body moved along the flap and the bottom of the numerical flume. The pressure of the water body was closely related to the water depth, and the pressure near the bottom of the water body was close to 3 kPa. Under the action of waves, there was a strong variation in the dynamic pressure between the water body in the overtopping part and under the hinge point of the flap. Figure 8c,d show the flow field at the time instant of 333 ms, when the flap rotated toward the left side, and the overtopping water on top of the flap was separated. The movement of the water body in the whole flow field could be divided into three parts, as shown in Figure 8d: the front water body far away from the flap, the water body moving to the left side, and the water body moving along the bottom of the flume. The pressure at the bottom of the flume was close to 2.8 kPa, which is relatively lower than that shown in Figure 8b. Figure 8g,h show the flow field at the instant when the flap moved back to the vertical direction with zero angular displacement and maximum angular velocity. A significant difference in the water level could be observed on the two sides of the flap. When the flap crossed the vertical position to the position shown in Figure 8i,j, the water in front of the flap was compressed. At the time instant shown in Figure 8m,n, the water body flowed over the top of the flap. At the time instant shown in Figure 8o,p, the water body was rapidly squeezed, and the angular displacement of the flap reached its maximum value.

3.4. Verification of the Numerical PTO

In order to verify whether the proposed method (mentioned in Section 2.4) can correctly simulate the mechanical characteristics of a PTO system, the following verification tests were performed: In order to ensure the incident wave was a linear wave, the parameters of the incident wave were set as follows: wave period T = 2.0 s, wave height H = 0.05 m, and water depth d = 1.4878 m. Under these wave conditions, the added mass and damping coefficients az and bz were approximately 0.739 kg∙m2 and 0.336 Ns∙m/rad, which were obtained from potential flow theory. As shown in Equation (14), when bpto was set to bopt, the rate of the extracted power Ep reached its maximum value. Here, in order to verify the correctness of the applied numerical PTO in Fluent, the variation in the rotational angle amplitude ϒ and the rate of the extracted power Ep were studied by changing the damping bpto, as shown in Figure 9. It can be observed in Figure 9a that the motion amplitude decreased with the increasing of the PTO damping. The wave energy conversion rate Ep, as shown in Figure 9b, was determined by Equation (12). When bpto/bopt = 1, the wave energy conversion rate Ep reaches the maximum value, which is consistent with the findings obtained using linear potential flow theory. Hence, the correctness of the numerical PTO system using UDF in Fluent was verified.

4. Analysis of Sharp-Eagle OSWEC

Sharp-eagle devices [35] generally include three parts: an eagle head wave absorber, a semisubmersible carrier, and a hydraulic PTO system. To investigate the hydrodynamic characteristics of sharp-eagle OSWECs, a model similar to that analyzed by Ye et al. [35] was used in the present study. Schematic diagrams of the sharp-eagle OSWEC and similar flap-type OSWEC are shown in Figure 10. The origin of the coordinate system was set at the hinge of the OSWEC, and the hinge height was 0.1 m. It can be observed in Figure 10 that the sharp-eagle section consisted of four arcs, and their corresponding coordinates of centers and radiuses are summarized in Table 3. The mass, gravity center, and moment of inertia of the sharp-eagle OSWEC were kept the same as those shown in Table 2 [7]. In the following analyses, the incident wave condition remained the same as those in the case of the flap-type OSWEC: wave period T = 1.9 s and wave height H = 0.1 m.

4.1. Nonlinear Wave Slamming Forces on Sharp-Eagle OSWEC

Due to its special geometrical features, sharp-eagle OSWECs experience wave slamming, which may result in different dynamic characteristics compared with the conventional flap-type OSWECs. The time histories of the angular displacements and the velocities of sharp-eagle and flap-type OSWECs are shown in Figure 11. It can be observed in Figure 11a that positive rotations of the sharp-eagle OSWEC are similar to those of the flap-type OSWEC, and its negative rotation is significantly lower. This is due to the asymmetry of the cross-section, as shown in Figure 10. It can be found in Figure 11b that the amplitudes of the angular velocities of the sharp-eagle OSWEC are much smaller than those of the flap-type OSWEC.
To study the wave slamming characteristics of the sharp-eagle OSWEC, the time histories of the wave forces and moments about the hinge have been plotted and compared with those of the flap-type OSWEC, as shown in Figure 12. As shown in Figure 12a, the horizontal wave force on the sharp-eagle OSWEC is found to be much larger than that on the flap-type OSWEC. In addition, the horizontal wave force acting on the sharp-eagle OSWEC is significantly asymmetrical. Due to the smaller part of the sharp-eagle OSWEC under water, the minimum value of the vertical wave force on the sharp-eagle OSWEC is smaller than that of the flap-type OSWEC, while the maximum vertical wave force on the sharp-eagle OSWEC is much larger than that of the flap-type OSWEC. In addition, the vertical wave forces on the sharp-eagle OSWEC showed slamming force featured, which dramatically increased and decreased, as also shown in references [36,37]. As shown in Figure 12c, the external torque on the sharp-eagle OSWEC about the hinged point is much smaller than that of the flap-type OSWEC. In summary, based on the comparisons shown in Figure 11 and Figure 12, the sharp-eagle OSWEC generally has smaller motion and wave forces/moments, except for the vertical wave forces under present conditions, which show significant slamming features.
Furthermore, the streamline and pressure distribution around the sharp-eagle OSWEC are plotted in Figure 13 to clearly show the slamming event, which shows the variation process for the OSWEC moving from the leftmost to the rightmost side under wave excitation. Blue lines in left column of Figure 13 present free surface of water and black lines are streamlines. As shown in Figure 13a,b, when the OSWEC was on the leftmost side at time instant t = 0 ms, its angular velocity was zero, but its angular acceleration reached the maximum. At this time instant, the water particles under the eagle head move toward the opposite direction of the incident wave, and a counterclockwise eddy formed behind the OSWEC. In addition, as shown in Figure 13a,b, a significant water level difference can be observed between the left and right sides of the OSWEC. As shown in Figure 13c,d, when the OSWEC rotate toward the right side after 133 ms passes, its angular velocity was 18 deg/s, and air bubbles appeared under the eagle head. As shown in Figure 13e,f corresponding to t = 247 ms, the angular velocity of the OSWEC was 15.15 deg/s, and there as a small deceleration process of the angular velocity, which lasted for a short time. As shown in Figure 13g,h, corresponding to t = 380 ms, the OSWEC began to accelerate to the right side, and its angular velocity reached 31.34 deg/s. At this moment, the air bubbles under the eagle head continue to develop, and the left eddy continue to expand. When the OSWEC is further accelerated to the position shown in Figure 13i,j, its angular velocity is 68.51 deg/s. At this moment, the water level as almost flat; the air bubbles are further expanded; the left water body move toward the sharp-eagle OSWEC; and the water body behind the OSWEC is further squeezed to the right side. When t = 627 ms, as shown in Figure 13k,l, the water level at the left side is higher than that at the right side of the OSWEC, and a much larger air bubble is found at the left side. At this moment, the angular velocity was 119.36 deg/s; the OSWEC continue to rotate to the right; and the two eddies originally adjacent to each other in the left part shown in Figure 13i merge into one big eddy. When the OSWEC rotated to the position shown in Figure 13m,n, its angular velocity reaches the maximum, with a value of 129.21 deg/s, and the flow field of the water body changes dramatically. In the left water body, the air bubbles under the eagle head irregularly extend. When the OSWEC reaches the position shown in Figure 13o,p, its angular velocity is 92.43 deg/s, and the air bubbles moved toward the water surface. When the OSWEC move to the position shown in Figure 13q,r, the air bubbles move to the water surface and burst. At this moment, the angular velocity was 52.57 deg/s; the water body on the left swells up along the arc due to the inertia effect; and the water level in front of the eagle head significantly raises. At this moment, the right water body is not supplemented in time, which forms eddies and bubbles. As shown in Figure 13s,t, the OSWEC moves to the rightmost side; the water body on the left start falling back; the restoring force reaches the maximum; and the OSWEC tends to rotate to the left.
According to the flow field at different time instants shown in Figure 13, it can be observed that the sharp-eagle OSWEC will not experience overtopping. However, the flap-type OSWEC, as shown in Figure 8, experiences significant overtopping, even if the height of the flap and inertia parameters are the same.

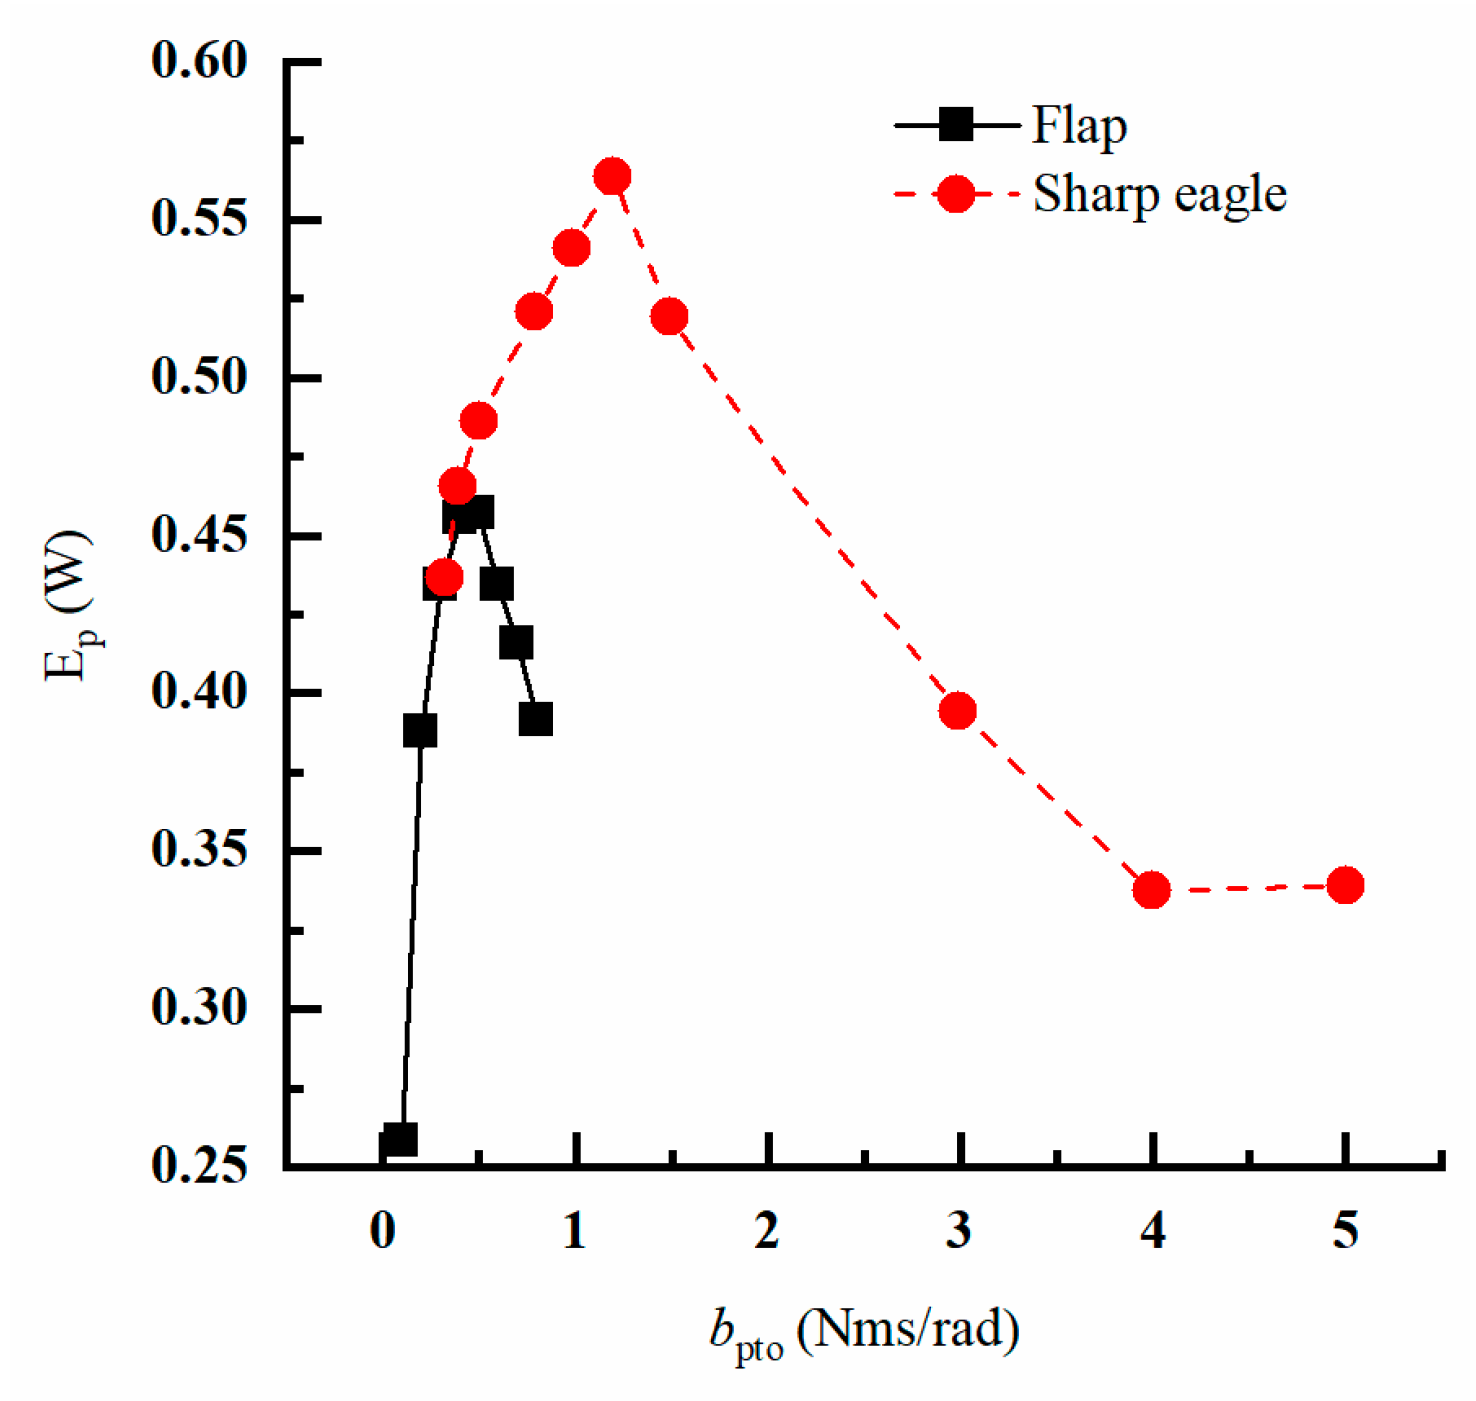
4.2. Power Output of the Sharp-Eagle OSWEC

To study the power output of present sharp-eagle OSWEC, the incident wave condition in the experiment by Henry et al. [7] is considered: wave height H = 0.1 m, wave period T = 1.9 s, and water depth dw = 0.305 m. The influence of the PTO damping coefficients on the power output is shown in Figure 14. As shown in Figure 14a, the instantaneous power output of the flap-type OSWEC within one wave period experiences two peaks, and the maximum peak reaches 1.4 W when bpto = 0.1 Nms/rad. As shown in Figure 14b, the instantaneous power output of the sharp-eagle OSWEC also experiences two peaks, and the maximum peak reaches 1.6 W when bpto = 1.2 Nms/rad. Based on the instantaneous power generation, mean power output is calculated using Equation (12), which is plotted in Figure 15. The maximum mean power output of the sharp-eagle OSWEC reaches 0.56 W when bpto = 1.2 Nms/rad, while the maximum mean power of the flap-type OSWEC is only 0.46 W when bpto = 0.336 Nms/rad. Compared with the flap-type OSWEC, the maximum mean power output of the sharp-eagle OSWEC is increased by 21.74%.

5. Concluding Remarks

By adding additional momentum sources to the N–S equations in the CFD software Fluent, a two-dimensional numerical wave flume with wave-generating and wave-absorbing functions is established in this study. It can be concluded that the established wave flume can generate the required waves in the working area. Compared with traditional deformed mesh, overset meshes are adopted to simulate large rigid body motions. The rotations of the bottom hinged flap are simulated successfully, and the numerical results are in good agreements with the published experimental data.
Furthermore, the PTO system is simulated by applying numerical torque about the hinge, which shows good agreements with the theoretical predictions, and the feasibility of applying numerical PTO is confirmed. The flow field around the flap is analyzed to provide further insight into the overtopping phenomena in the interactions of waves and flap-type OSWECs.
On this basis, the slamming phenomena and power generation of a sharp-eagle OSWEC have been analyzed and compared with those of a flap-type OSWEC. It can be confirmed that sharp-eagle OSWEC will experience significant slamming forces, and the analysis of the flow field around OSWEC could provide insight into the physical process. The performance of the sharp-eagle OSWEC is much better than that of flap-type OSWEC.
However, present study only serves as a preliminary study on the hydrodynamic and performance evaluations of sharp-eagle OSWEC in two-dimensional wave flumes. More realistic analyses may have to rely on three-dimensional wave flumes and the diffraction effect can be investigated further. In addition, a wider range of wave conditions needs to be considered in future studies, especially for irregular waves. Integration of sharp-eagle OSWECs with offshore wind turbines with monopile foundation [38] can be studied to promote the application of wave energy convertors as large-scale offshore wind technology has been commercially utilized. In addition, research on arrays of sharp-eagle OSWECs may bring improvement of the conversion efficiency from the hydrodynamic interactions [39].

Author Contributions

Conceptualization, L.S. and Z.Y.; methodology, L.S. and Z.Y.; software, L.S. and Z.Y.; validation, L.S. and Z.Y.; formal analysis, L.S. and Z.Y.; investigation, L.S. and Z.Y.; resources, L.S. and Z.Y.; data curation, L.S. and Z.Y.; writing—original draft preparation, L.S., Z.Y. and M.C.; writing—review and editing, M.C. and F.L.; visualization, Z.Y.; supervision, L.S. and M.C.; project administration, L.S. and M.C.; funding acquisition, L.S. and M.C. All authors have read and agreed to the published version of the manuscript.

Funding

This work was financially supported by the National Natural Science Foundation of China (NSFC) under grant Nos. 51961125103 and 52171275, and the Sanya Science and Education Innovation Park of Wuhan University of Technology under grant No. 2020KF0036.

Institutional Review Board Statement

Not applicable.

Informed Consent Statement

Not applicable.

Data Availability Statement

Not applicable.

Conflicts of Interest

The authors declare no conflict of interest.

References

  1. Chen, M.; Wang, R.; Xiao, P.; Zhu, L.; Li, F.; Sun, L. Numerical analysis of a floating semi-submersible wind turbine integrated with a point absorber wave energy convertor. In Proceedings of the 30th International Ocean and Polar Engineering Conference. International Society of Offshore and Polar Engineers, Shanghai, China, 11–16 October 2020. [Google Scholar]
  2. Chen, M.; Xiao, P.; Zhou, H.; Li, C.B.; Zhang, X. Fully coupled analysis of an integrated floating wind-wave power generation platform in operational sea-states. Front. Energy Res. 2022, 10, 931057. [Google Scholar] [CrossRef]
  3. Jiao, P.; Matin Nazar, A.; Egbe, K.-J.L.; Barri, K.; Alavi, A.H. Magnetic capsulate triboelectric nanogenerators. Sci. Rep. 2022, 12, 89. [Google Scholar] [CrossRef]
  4. Curto, D.; Franzitta, V.; Guercio, A. Sea Wave Energy. A review of the current technologies and perspectives. Energies 2021, 14, 6604. [Google Scholar] [CrossRef]
  5. Khan, M.Z.A.; Khan, H.A.; Aziz, M. Harvesting energy from ocean: Technologies and perspectives. Energies 2022, 15, 3456. [Google Scholar] [CrossRef]
  6. Chen, M.; Xiao, P.; Zhang, Z.; Sun, L.; Li, F. Effects of the end-stop mechanism on the nonlinear dynamics and power generation of a point absorber in regular waves. Ocean Eng. 2021, 242, 110123. [Google Scholar] [CrossRef]
  7. Henry, A.; Kimmoun, O.; Nicholson, J.; Dupont, G.; Wei, Y.; Dias, F. A two dimensional experimental investigation of slamming of an oscillating wave surge converter. In Proceedings of the 24th International Ocean and Polar Engineering Conference, Busan, Republic of Korea, 15–20 June 2014. [Google Scholar]
  8. Henry, A.; Schmitt, P.; Whittaker, T.; Rafiee, A.; Dias, F. The characteristics of wave impacts on an oscillating wave surge converter. In Proceedings of the 23rd International Offshore and Polar Engineering Conference, Anchorage, AK, USA, 30 June–4 July 2013. [Google Scholar]
  9. Wei, Y.; Rafiee, A.; Henry, A.; Dias, F. Wave interaction with an oscillating wave surge converter, Part I: Viscous effects. Ocean Eng. 2015, 104, 185–203. [Google Scholar] [CrossRef]
  10. Wei, Y.; Abadie, T.; Henry, A.; Dias, F. Wave interaction with an oscillating wave surge converter. Part II: Slamming. Ocean Eng. 2015, 113, 319–334. [Google Scholar] [CrossRef]
  11. Brito, M.; Ferreira, R.M.L.; Teixeira, L.; Neves, M.G.; Canelas, R.B. Experimental investigation on the power capture of an oscillating wave surge converter in unidirectional waves. Renew. Energy 2019, 151, 975–992. [Google Scholar] [CrossRef]
  12. Brito, M.; Ferreira, R.M.L.; Teixeira, L.; Neves, M.G.; Gil, L. Experimental investigation of the flow field in the vicinity of an oscillating wave surge converter. J. Mar. Sci. Eng. 2020, 8, 976. [Google Scholar] [CrossRef]
  13. Ning, D.; Liu, C.; Zhang, C.; Göteman, M.; Zhao, H.; Teng, B. Hydrodynamic performance of an oscillating wave surge converter in regular and irregular waves: An experimental study. J. Mar. Sci. Technol. 2018, 25, 520–530. [Google Scholar]
  14. Sell, N.P.; Plummer, A.R.; Hillis, A.J. A Self-zeroing position controller for oscillating surge wave energy converters with strong asymmetry. J. Ocean Eng. Mar. Energy 2018, 4, 137–151. [Google Scholar] [CrossRef]
  15. Ruehl, K.; Forbush, D.D.; Yu, Y.-H.; Tom, N. Experimental and numerical comparisons of a dual-flap floating oscillating surge wave energy converter in regular waves. Ocean Eng. 2019, 196, 106575. [Google Scholar] [CrossRef]
  16. Choiniere, M.A.; Tom, N.M.; Thiagarajan, K.P. Load shedding characteristics of an oscillating surge wave energy converter with variable geometry. Ocean Eng. 2019, 186, 105982. [Google Scholar] [CrossRef]
  17. Tom, N.; Lawson, M.; Yu, Y.-H.; Wright, A. Spectral modeling of an oscillating surge wave energy converter with control surfaces. Appl. Ocean Res. 2016, 56, 143–156. [Google Scholar] [CrossRef]
  18. Tom, N.M.; Yu, Y.H.; Wright, A.D.; Lawson, M.J. Pseudo-spectral control of a novel oscillating surge wave energy converter in regular waves for power optimization including load reduction. Ocean Eng. 2017, 137, 352–366. [Google Scholar] [CrossRef]
  19. Chow, Y.-C.; Tzang, S.-Y.; Chen, J.-H.; Lin, C.-C. Inertial effects on the performance of a bottom-hinged oscillating wave surge converter. J. Offshore Mech. Arct. Eng. 2019, 141, 012902. [Google Scholar] [CrossRef]
  20. Sun, S.-Y.; Sun, S.-L.; Wu, G.-X. Fully nonlinear time domain analysis for hydrodynamic performance of an oscillating wave surge converter. China Ocean Eng. 2018, 32, 582–592. [Google Scholar] [CrossRef]
  21. Cheng, Y.; Ji, C.; Zhai, G. Fully nonlinear analysis incorporating viscous effects for hydrodynamics of an oscillating wave surge converter with nonlinear power take-off system. Energy 2019, 179, 1067–1081. [Google Scholar] [CrossRef]
  22. Cheng, Y.; Ji, C.; Zhai, G.; Ma, Z. Fully nonlinear simulation of wave–current interaction with an oscillating wave surge converter. J. Mar. Sci. Technol. 2020, 25, 93–110. [Google Scholar] [CrossRef]
  23. Cheng, Y.; Li, G.; Ji, C.; Zhai, G.; Oleg, G. Current effects on nonlinear wave slamming by an oscillating wave surge converter. Eng. Anal. Bound. Elem. 2018, 96, 150–168. [Google Scholar] [CrossRef]
  24. Cheng, Y.; Xi, C.; Dai, S.; Ji, C.; Cocard, M. Wave energy extraction for an array of dual-oscillating wave surge converter with different layouts. Appl. Energy 2021, 292, 116899. [Google Scholar] [CrossRef]
  25. Renzi, E.; Abdolali, A.; Bellotti, G.; Dias, F. Wave-power absorption from a finite array of oscillating wave surge converters. Renew. Energy 2013, 63, 55–68. [Google Scholar] [CrossRef]
  26. Zou, M.; Chen, M.S.; Zhu, L.; Li, L.; Zhao, W. A constant parameter time domain model for dynamic modelling of multi-body system with strong hydrodynamic interactions. Ocean Eng. 2023, 268, 113376. [Google Scholar] [CrossRef]
  27. Liu, M.B.; Liu, G.R. Smoothed Particle Hydrodynamics (SPH): An overview and recent developments. Arch. Comput. Methods Eng. 2010, 17, 25–76. [Google Scholar] [CrossRef]
  28. Liu, Z.; Wang, Y.; Hua, X. Numerical studies and proposal of design equations on cylindrical oscillating wave surge converters under regular waves using SPH. Energy Convers. Manag. 2020, 203, 112242. [Google Scholar] [CrossRef]
  29. Liu, Z.; Wang, Y.; Hua, X. Prediction and optimization of oscillating wave surge converter using machine learning techniques. Energy Convers. Manag. 2020, 210, 112677. [Google Scholar] [CrossRef]
  30. Zhang, D.H.; Shi, Y.X.; Huang, C.; Si, Y.L.; Huang, B.; Li, W. SPH method with applications of oscillating wave surge converter. Ocean Eng. 2018, 152, 273–285. [Google Scholar] [CrossRef]
  31. Zhang, C.; Wei, Y.; Dias, F.; Hu, X. An efficient fully Lagrangian solver for modeling wave interaction with oscillating wave surge converter. Ocean Eng. 2012, 236, 109540. [Google Scholar] [CrossRef]
  32. Schmitt, P.; Elsaesser, B. On the use of OpenFOAM to model oscillating wave surge converters. Ocean Eng. 2015, 108, 98–104. [Google Scholar] [CrossRef]
  33. Lin, C.-C.; Chow, Y.-C.; Tzang, S.-Y.; Chiou, C.-Y.; Huang, Y.-Y. Numerical study on the geometric and inertial parameters for oscillating wave surge converters. In Proceedings of the ASME 2018 37th International Conference on Ocean, Offshore and Arctic Engineering, Madrid, Spain, 17–22 June 2018. [Google Scholar]
  34. Li, L.; Lin, Z.W.; You, Y.X. The numerical wave flume of the viscous fluid based on the momentum source method. J. Hydrodyn. Ser. A 2007, 22, 76–82. (In Chinese) [Google Scholar]
  35. Ye, Y.; Wang, K.L.; You, Y.G.; Sheng, S.W. Research of power take-off system for sharp eagle II wave energy converter. China Ocean Eng. 2019, 33, 618–627. [Google Scholar] [CrossRef]
  36. Zhu, L.; Duan, L.; Chen, M.; Yu, T.X.; Pedersen, P.T. Equivalent design pressure for ship plates subjected to moving slamming impact loads. Mar. Struct. 2020, 71, 102741. [Google Scholar] [CrossRef]
  37. Duan, L.; Zhu, L.; Chen, M.; Pedersen, P.T. Experimental study on the propagation characteristics of the slamming pressures. Ocean Eng. 2020, 217, 107868. [Google Scholar] [CrossRef]
  38. Li, F.; Tian, P.; Wang, L.; Chen, M. Investigation on lateral bearing capacity of monopile under combined vertical-lateral loads and scouring condition. Mar. Georesour. Geotechnol. 2021, 39, 505–514. [Google Scholar] [CrossRef]
  39. Chen, M.; Guo, H.; Wang, R.; Tao, R.; Cheng, N. Effects of gap resonance on the hydrodynamics and dynamics of a multi-module floating system with narrow gaps. J. Mar. Sci. Eng. 2021, 9, 1256. [Google Scholar] [CrossRef]
Figure 1. Layout of fully functional numerical wave flume with internal wave-maker.
Jmse 11 01607 g001
Figure 2. Wave heights along the propagation direction.
Jmse 11 01607 g002
Figure 3. Ratio of wave heights along the propagation direction.
Jmse 11 01607 g003
Figure 4. Schematic of the analyzed OSWEC.
Jmse 11 01607 g004
Figure 5. Meshes around OSWEC.
Jmse 11 01607 g005
Figure 6. Angular displacements of flap.
Jmse 11 01607 g006
Figure 7. Angular velocities of flap.
Jmse 11 01607 g007
Figure 8. A sequence of frames showing the process of the slam event.
Jmse 11 01607 g008aJmse 11 01607 g008bJmse 11 01607 g008c
Figure 9. Influence of PTO damping on the rotation amplitude and wave energy conversion rate.
Jmse 11 01607 g009
Figure 10. Schematic of the sharp-eagle OSWEC.
Jmse 11 01607 g010
Figure 11. Time histories of the angular displacement and velocity of sharp-eagle and flap-type OSWEC [7].
Jmse 11 01607 g011
Figure 12. Wave forces and moments on sharp-eagle and flap-type OSWECs.
Jmse 11 01607 g012
Figure 13. Streamline and pressure distribution around sharp-eagle OSWEC.
Jmse 11 01607 g013aJmse 11 01607 g013bJmse 11 01607 g013c
Figure 14. Power output of OSWEC within one wave period. (a) Flap-type OSWEC [7]. (b) Sharp-eagle OSWEC.
Jmse 11 01607 g014
Figure 15. Influence of damping of PTO on mean power output.
Jmse 11 01607 g015
Table 1. Cases for convergence study of the mesh size and time step.
Case No.RegionMesh Size (m)Time Step (s)
aHorizontal directionx = λ/80 = 0.04t = T/1000 = 0.0019
Vertical directiony = H/16 = 0.00625
bHorizontal directionx = λ/100 = 0.032t = T/1000 = 0.0019
Vertical directiony = H/20 = 0.005
cHorizontal directionx = λ/80 = 0.04t = T/800 = 0.002375
Vertical directiony = H/16 = 0.00625
Table 2. Particulars of the analyzed OSWEC model [7].
ItemUnitValue
Height of flap: hm0.31
Height of the hinge from seabed: hsm0.1
Width of flap: wm0.0875
Mass of flap: mkg6.27
Rotational inertia about the hinge: Ikg·m20.1147
Height of the center of gravity: ycm0.1324
Table 3. Coordinates of centers and radius of the arcs (unit: m).
x Coordinate of Centery Coordinate of CenterRadius
Arc R1−0.3551−0.06260.3575
Arc R20.1717−0.37950.6895
Arc R30.21530.01950.2132
Arc R40.27870.26300.0383
Disclaimer/Publisher’s Note: The statements, opinions and data contained in all publications are solely those of the individual author(s) and contributor(s) and not of MDPI and/or the editor(s). MDPI and/or the editor(s) disclaim responsibility for any injury to people or property resulting from any ideas, methods, instructions or products referred to in the content.

