Article

A Method for Multi-Beam Bathymetric Surveys in Unfamiliar Waters Based on the AUV Constant-Depth Mode

1
Department of Oceanography and Hydrography, Dalian Naval Academy, Dalian 116018, China
2
College of Electrical Engineering, Naval University of Engineering, Wuhan 430033, China
*
Author to whom correspondence should be addressed.
These authors contributed equally to this work.
J. Mar. Sci. Eng. 2023, 11(7), 1466; https://doi.org/10.3390/jmse11071466
Submission received: 13 June 2023 / Revised: 19 July 2023 / Accepted: 20 July 2023 / Published: 23 July 2023
(This article belongs to the Section Ocean Engineering)

Abstract

:
Given the lack of systematic research on bathymetric surveys with multi-beam sonar carried by autonomous underwater vehicles (AUVs) in unfamiliar waters, this paper proposes a method for multi-beam bathymetric surveys based on the constant-depth mode of AUVs, considering equipment safety, operational efficiency, and data quality. Firstly, basic principles for multi-beam bathymetric surveys under the constant-depth mode are proposed based on multi-beam operational standards and AUV constant-depth mode characteristics. Secondly, a vertical effective height model for the vehicle is established, providing vertical constraints and a basis for determining fixed depth in constant-depth missions. Subsequently, according to these basic principles and the vertical effective height model, the operational process for multi-beam bathymetric surveys in unfamiliar waters under the AUV constant-depth mode is outlined. Finally, we validate the proposed method through sea trials in the Xisha Sea of the South China Sea. The test results show that the method proposed in this paper not only ensures the vehicle safety operation and multi-beam data quality, but also improves the operation efficiency by about 68%, demonstrating the reliability of the proposed method and its significant engineering value and guidance implications.

1. Introduction

A seafloor topographic survey is a fundamental task to ensure navigation safety and ocean resource development [1]. Currently, multi-beam bathymetric systems have become the primary technique for obtaining topography under water due to their high accuracy and efficiency [2,3,4]. Traditional shipborne multi-beam systems works\by side-hanging installation and bottom-fixed installation [5,6], but these methods have problems such as poor attitude stability in complex sea conditions and low data resolution in middle-deep sea areas [7,8]. More importantly, traditional shipborne multi-beam operations cannot conduct bathymetric surveys in sensitive, remote, and unfamiliar waters, and the scope of operation is greatly limited [9].
In recent years, with the rapid development of underwater navigation technology, underwater platforms represented by AUVs have been widely used in military and scientific research [10]. AUVs undertake tasks in sensitive and remote areas due to their long endurance and strong autonomy. Moreover, due to their large submersible depth and strong attitude control, AUVs can provide a stable platform for multi-beam sonar and shorten the distance between the multi-beam transducer and the seafloor, thereby improving the resolution of topographic mapping. Therefore, AUVs equipped with multi-beam sonar have shown broad application prospects in deep-sea resource exploration, underwater terrain mapping, and underwater cruising surveillance [11,12].
Researchers from various countries have conducted tests and research on bathymetric surveys with multi-beam sonar carried by AUVs. The National Institute for Undersea Science and Technology in the United States tested the multi-beam system carried by the “Eagle Ray” AUV in 2006 and conducted multi-beam bathymetric survey experiments [13]. The Japan Marine Technology and Engineering Center used the “Jinbei” to carry side-scan sonar and a multi-beam system to conduct investigations on ocean carbon dioxide and obtained corresponding experimental data in 2012 [14]. However, these experiments mainly focused on debugging the vehicle’s task control system, and systematic research on the operation methods of AUVs with multi-beam sonar is still lacking. The Helmholtz Research Center in Germany used the AUV Abyss carrying multi-beam sonar to achieve lawn-mower pattern scanning of the sea area and used the MB-system software and Python programs for post-processing of multi-beam bathymetric data. Although this involved various aspects of multi-beam sonar operation carried out by the AUV, including survey line layout, task planning, operation mode, and data post-processing, the description was not sufficient. It failed to give detailed operation methods and procedures of AUVs carrying multi-beam sonar in actual operation, which limited the practicability and referentiality of operation experience [15]. Chinese scholars have studied the time-sharing strategy model of multi-beam system DVL and propose a wide–narrow alternating operation method [16], which has certain practical application value. Still, they have not given a complete operation method combining the AUV’s motion characteristics, instruments limitations, and data accuracy. Furthermore, all previous studies on AUVs carrying multi-beam sonar were carried out in familiar waters. Studies in unfamiliar waters are related to the safety of AUV navigation and directly determine the success or failure of the mission. Therefore, there is an urgent need to carry out research on the method of bathymetric survey by AUVs carrying multi-beam sonar in unfamiliar waters.
Ensuring the safety of AUV equipment is the prerequisite for the success of the mission and also the difficulty of AUV operations in unfamiliar waters. The operation method of AUV carrying multi-beam sonar depends on the altitude mode of the vehicle. AUV have two altitude modes: constant-depth and constant-height [15]. The constant-depth mode maintains a fixed distance from the water surface and the attitude is relatively stable during the carrier’s movement, so it provides a better choice to obtain higher quality data in unfamiliar waters with unknown seafloor terrain, as a multi-beam system is sensitive to altitude changes. So far, few scholars have compared and analyzed the impact of the two altitude modes on bathymetric surveys with multi-beam bathymetric systems. Some scholars have discussed the advantages and disadvantages of the underwater constant-depth mode and constant-height mode from the perspective of multi-beam measurement data resolution and adopted the constant-height mode for multi-beam operation. However, this discussion did not consider factors such as terrain slope change, vehicle attitude change, and instruments performance [15]. Considering equipment safety and data quality, this article discusses the operation method of bathymetric surveys by multi-beam sonar carried by AUVs in the constant-depth mode. In this mode, the determined constant-depth of the vehicle determines the vehicle’s distance from the bottom, and the distance from the bottom affects the system’s navigation accuracy, whether the task can be successful, the resolution of multi-beam measurement, the measurement efficiency, and the width of multi-beam strip overlap. Therefore, a systematic study of the multi-beam bathymetric survey method based on AUVs in the constant-depth mode is needed.
The structure of this article is as follows: Section 2 focuses on the method of this article, including the operation principle of the carrier constant-depth mode carrying multi-beam sonar, the vertical effective height model, and the operation process in the constant-depth mode in unfamiliar waters; Section 3 focuses on describing the sea trials in the South China Sea, including the introduction of the equipment used and the test situation, and two tests; Section 4 discusses the advantages and disadvantages of the method of this article; and Section 5 is a summary and suggestion of this experiment.

2. A Method for Multi-Beam Bathymetric Surveys in Unfamiliar Waters Based on the AUV Constant-Depth Mode

2.1. Principles of AUV Carrying Multi-Beam Sonar in Constant-Depth Mode Operation

The main purpose of the principle of an AUV carrying multi-beam sonar in constant-depth mode operation is to balance the efficiency of maritime operations and the quality of multi-beam data while ensuring the safety of equipment. The principle of the continuous bottom track of DVL and the minimum carrier bottom distance are mainly to ensure the safety of the equipment and the implementation of the planned tasks, thereby improving the efficiency of maritime operations. At the same time, the continuous effective DVL bottom principle can ensure navigation accuracy and improve data quality; and the near-bottom principle of the carrier and the constant-depth principle of the main survey line are to ensure the quality of multi-beam data. The four operational principles are described below.
Positioning accuracy is essential for data quality when an AUV carries multi-beam sonar for operations. Due to the attenuation of electro-magnetic signals in the underwater environment, underwater acoustic-assisted positioning becomes an alternative solution [17]. Long baseline, ultra-short baseline, and other underwater acoustic-assisted positioning devices increase the cost of operations and reduce the efficiency of maritime operations [18,19,20]. The navigation system of the AUV is shown in Figure 1. The initial position of the inertial navigation system needs to be calibrated with the position information provided by GNSS. When the carrier is on the surface and the DVL is effective at the bottom, the positioning information is provided by GNSS/INS/DVL integrated navigation, and when the carrier lacks DVL bottom information, the GNSS/INS combined navigation provides positional information. After the carrier dives, the equipment relies on INS/DVL for combined navigation when there is a lack of GNSS positional information and the DVL is effective at the bottom. When DVL loses bottom track, it relies solely on INS navigation. The position calculated by the device relying solely on INS navigation has a large offset, while the speed measured by DVL can limit the error accumulation of the INS system. Therefore, when the carrier is executing tasks underwater, it is required that the DVL be continuously effective at the bottom, that is, the height from the bottom after the AUV is at a constant-depth should be less than the effective bottom height of DVL.
During AUV diving and surfacing periods, the attitude angle changes significantly, so the bathymetry data during the depth change period are generally not adopted. In the operation route of the AUV, the attitude and the speed are stable in long straight line areas and the quality of multi-beam bathymetry data can be guaranteed [15]. In the constant-depth mode, in order to ensure the quality of bathymetry data and the completion rate of the survey line, the depth of the vehicle generally does not change on the main survey line. Therefore, the determined vehicle depth needs to fully consider the terrain changes in the entire main survey line.
The appropriate fixed depth is the key to ensuring the quality and efficiency of multi-beam bathymetric data. Compared with traditional shipborne multi-beam systems, after the carrier dives, the distance between the multi-beam transducer and the seafloor decreases and the beam footprint coverage area decreases, so the vertical resolution along the course of the seafloor topography improves; the sound wave is transmitted from the transducer to the seafloor, and the time for propagation in the water shortens, as a result that the ping rate of the multi-beam transducer increases, and the resolution along the course of the seafloor topography improves under fixed sailing speed [8]. Therefore, keeping the carrier as close as possible to the seabed can fully utilize the diving depth advantage of the AUV and improve the resolution of multi-beam bathymetric data.
However, as the diving depth of the carrier increases, the height of the multi-beam system from the seabed decreases, the width of the multi-beam strip coverage narrows, and the unreasonable fixed depth and the distance between the survey lines affects the strip coverage rate of adjacent survey line. This affects subsequent strip stitching and navigation correction through terrain-matching methods [15]. The strip coverage rate determines the spacing between survey lines. If the spacing between survey lines is too narrow, although the resolution requirements of the seabed topography are met, it increases overwork and reduces operation efficiency; if the spacing between survey lines is too wide, it greatly reduces the resolution of the seabed topography and cannot guarantee the quality of the measurement results.
Therefore, the method of determining the AUV fixed depth is the most core technology in the entire AUV constant-depth mode carrying multi-beam operation methods, and it is also the most significant difference between AUVs carrying out multi-beam bathymetric surveys and traditional shipborne multi-beam bathymetric surveys. AUV survey line deployment also follows the basic principle of being parallel to the contour line deployment. It can reduce the large changes in seabed topography, which is conducive to determining the working depth of AUV. The basic principles for determining the vehicle fixed depth are:
(1)
Continuously effective DVL ensures the accuracy and safety of carrier navigation;
(2)
The height of the carrier from the bottom cannot be too low, in order to avoid triggering the carrier’s own protection mechanism and ending the mission;
(3)
Being as close to the seabed as possible under possible conditions to improve the resolution of bathymetric survey;
(4)
The fixed depth on the main survey line remains unchanged to ensure the relative stability of the carrier’s altitude.
Under the guidance of the above four principles, this article establishes a vertical effective height model under the influence of attitude and proposes a constant-depth mode operation process in unfamiliar waters. It should be noted that the minimum bottom height of the carrier is usually set by the mission personnel and cannot be modified during the mission. The vertical effective height model established in this article is detailed below.

2.2. Vertical Effective Height Model

For underwater operations in unfamiliar waters, the autonomous navigation system for AUVs is a superior choice. The position error of a pure inertial navigation system (INS) accumulates over time. Currently, the use of INS and Doppler velocity log (DVL) integrated navigation is seen as the mature solution to underwater navigation. The INS, usually installed at the center of the vehicle, provides position and attitude control information by collecting output information from inertial devices and calculating navigation parameters such as attitude, velocity, and position through numerical integration. Installed at the bottom of the vehicle, the DVL measures velocity in three directions using multiple beams (typically four). After calibration, the speed measured by the DVL can constrain the cumulative error of the INS, enhancing the precision of navigation positioning.
During a bathymetric survey mission in a constant-depth mode with a multi-beam system, determining the AUV’s height to the bottom is crucial. The depth of the vehicle, which determines the height to seafloor, affects the DVL’s bottom track and the measurement resolution and swath coverage of the multi-beam system. The issue with INS and DVL integrated navigation is that the DVL must be within a valid height range from the seafloor [21].
Influenced by the marine environment and the seabed sediment, the actual range of the DVL differs from the calibrated range. Some scholars have proposed DVL speed measurement methods under conditions of fewer than four beams and conducted comparative analysis [22]. However, the lack of sufficient beams still increases the speed measurement error, reducing the precision of navigation [22]. During experiments, if there are fewer than three valid beams of the DVL, the INS will not use the data provided by the DVL and will navigate based on its output values (also called dead-reckoning). Hence, it is desirable for the AUV to be closer to the bottom during operations, ensuring that at least three DVL beams are effective even if the marine environment changes. Therefore, analyzing the impact of attitudes on the DVL’s height to the bottom is critical for determining the AUV’s fixed depth.
There are two spatial distributions of four beams of the DVL, one is in a “+” pattern and another is a “×” pattern. In this experiment, the four beams mounted were distributed in the latter pattern. In practical operations, affected by the vehicle’s attitude, the four DVL beams point in different directions, resulting in varying effective heights to the bottom. Analysis of the vehicle’s attitudes’ impact on the DVL’s four beams provides deeper insights into the changes in the range of the DVL’s four beams. Hence, it is necessary to analyze the influence of the vehicle’s attitude on the DVL.
Subsequently, the impact of the vehicle’s attitudes on the range of the DVL’s four beams was established, as depicted in Figure 2.
Assuming that the effective beam length (calibrated range) of the DVL is M, according to Figure 2b, the respective emission directions of the four beams can be represented as T i , i = 1 , 2 , 3 , 4 .
T = [ T 1 T 2 T 3 T 4 ] = 3 2 M 0 3 2 M 0 0 3 2 M 0 3 2 M 1 2 M 1 2 M 1 2 M 1 2 M
Assuming at a certain moment that the roll, pitch, and yaw of the vehicle are r, p, and h, respectively, with corresponding rotation matrices R ( r ) , R ( p ) , and R ( h ) , then the influence of the vehicle’s attitudes on the DVL beams is:
T A = R ( h ) × R ( p ) × R ( r ) × T
By expanding Equation (2), we can obtain the effect of the vehicle’s attitudes on the four beams. In operations, at least three beams need to be effective to the seabed so that the INS considers the DVL data valid. However, considering that some models of DVL require all four beams to be effective to the bottom, this study focuses on the minimum height of the vehicle to the seabed, which is the effective height of the DVL( H D V L ):
H D V L = min 3 2 M × sin ( p ) + 1 2 M × cos ( p ) × cos ( r ) 3 2 M × cos ( p ) × sin ( r ) + 1 2 M × cos ( p ) × cos ( r ) 3 2 M × sin ( p ) + 1 2 M × cos ( p ) × cos ( r ) 3 2 M × cos ( p ) × sin ( r ) + 1 2 M × cos ( p ) × cos ( r )
The range of the DVL may change due to factors such as marine environment and seabed sediment. The impact of the change is unpredictable. To ensure that at least three beams of the DVL are continually effective during mission execution, our strategy is to make sure that the vehicle’s bottom height does not hover near the effective bottom height of the DVL. However, the complex terrain of the survey area presents challenges to this strategy. For a main survey line with large bathymetric variations, the vehicle’s height in shallow areas is already approaching the alarm-triggering minimum height, but in deeper areas, the vehicle’s height is nearing the DVL’s limitation for effective bottom height. This puts higher demands on determining the fixed depth of each survey line.
Determining the fixed depth of the vehicle is a core part of the operation process. Assuming a main survey line where the AUV’s depth is H D , if the instrument’s off-bottom depth is less than H D M I N , it triggers an alarm. The deepest and shallowest depths along the direction of this main survey line are H M a x and H M i n , respectively; the DVL’s vertical effective height is H D V L , and this parameter is limited by the performance of the DVL instrument itself. According to operational experience, Δh is set as the change in vertical effective height of the DVL due to the impact of the marine environment and seabed sediment. Therefore, the method for determining the vehicle’s fixed depth in this paper is expressed as follows:
H M a x H D < H D V L Δ h H M i n H D > H D M i n
Simplifying Formula (4), we derive the formula for determining the carrier fixed depth in constant-depth mode:
H M a x H D V L + Δ h < H D < H M i n H D M i n
If the following occurs:
H M a x H D H D V L Δ h H M i n H D > H D M i n
It indicates that the AUV’s fixed depth is too small, and it cannot be ensured that the DVL remains effective to the bottom throughout the entire mission.
If the following occurs:
H M a x H D < H D V L Δ h H M i n H D H D M i n
This situation suggests that the AUV’s fixed depth is too large, which will trigger the vehicle’s safety protection mechanism and cause mission failure.
If the following occurs:
H M a x H D < H D V L Δ h H M i n H D H D M i n
This situation means that the survey line cannot complete the relevant work tasks under the four basic principles and existing instrument performance limits.
Based on the topography of the water depth profile along the direction of the survey line, a suitable H D can usually be found. Then, the reasonable AUV fixed depth can be determined, and the height change of the multi-beam from the seabed can be calculated, which facilitates the estimation of the coverage range and overlap range of the multi-beam swaths. The following uses the triangle model of the multi-beam beams to estimate the swath coverage. Assuming the half opening angle of the multi-beam beam is φ , the range of the multi-beam is L, the AUV’s fixed depth on a certain survey line is H D 1 , and the shallowest depth along the direction of this main survey line is H M i n 1 . The AUV’s fixed depth on an adjacent survey line is H D 2 , the distance between the two main survey lines is D, and the shallowest depth along the direction of this survey line is H M i n 2 . Without considering the change in the AUV’s attitude during the movement process, the swath coverage width H C 1 , H C 2 can be obtained according to the multi-beam beam angle:
H C 1 = 2 min { L sin φ , ( H M i n 1 H D 1 ) tan φ } H C 2 = 2 min { L sin φ , ( H M i n 2 H D 2 ) tan φ }
The overlap coverage rate C between the main survey line swaths can be calculated as follows:
C = 1 2 ( H C 1 + H C 2 ) D D
The overlap rate of the main survey line swaths that are calculated satisfies the expected swath overlap rate. The vertical effective height model provides constraint conditions for constant-depth mode operations in unfamiliar waters, and the following elaborates on this process.

2.3. Workflow of Constant-Depth Mode in Unfamiliar Waters

The workflow of constant-depth mode in unknown waters primarily includes underwater terrain pre-estimation, deployment of plane survey lines, determination of vehicle’s fixed-depth, calculation of multi-beam swaths’ overlap rate, and method for adjusting unreasonable fixed depth of the vehicle. The specific operation process is illustrated in Figure 3.
  • Initially, an estimate of the overall water depth of the survey area is made, relying on data collected prior to the operation or surface scanning of the carrier. In relatively flat survey areas, a fairly accurate estimate of the water depth can be made by relying on related water depth data collected before trials. However, in regions with complex seafloor terrain, the water depth varies significantly along the survey line. Without sufficient resolution of water depth data, it is challenging to accurately estimate the deepest H M a x and shallowest H M i n points along the course, complicating the determination of the carrier’s fixed depth. To address this, we propose a method for pre-estimating topography using multi-beam sonar mounted on AUVs in unfamiliar water surface. This method has the following features:
    (1)
    The AUV carries a multi-beam sonar for surface scanning. The multi-beam control system can be remotely accessed via WIFI to view real-time depth data, allowing estimation of the deepest and shallowest points along the course more accurately;
    (2)
    The vehicle is on the surface, and the multi-beam is at a high distance from the seafloor, covering a large width. Typically, one scan can cover three to four adjacent survey lines, thus, improving operational efficiency.
  • The survey lines are laid out according to the anticipated overlap rate of the multi-beam swaths, and the carrier’s fixed depth is determined for each line. If the carrier’s fixed depth does not meet the operational requirements, it must be adjusted. If the situation described in Formula (8) arises, the mission plan needs to be adjusted, which can increase the difficulty of AUV mission planning and reduce efficiency;
  • Given reasonable fixed depth, the width of the multi-beam swath overlaps and the coverage width can be calculated based on the estimated terrain and the multi-beam’s range and opening angle. If the overlap width is appropriate, the operation can proceed smoothly. If not, there are several potential solutions:
    (1)
    Adjust the spacing of the survey lines so that the overlap rate of the multi-beam swath meets the operational requirements;
    (2)
    Adjust the fixed depths of two adjacent survey lines H D 1 and H D 2 ;
    (3)
    If the above methods are ineffective, reconsider the plan for the survey lines’ layout.
  • If none of the above works, it suggests that the area cannot be surveyed with the current equipment, and a DVL and multi-beam depth measurement system with a larger range should be considered.
A sea trial was conducted under the guidance of the method proposed in this paper. The basic conditions of the trial, the equipment involved, and the results of the experiment are introduced subsequently.

3. Experimental Verification

3.1. Brief Introduction of Equipment and Operations

The AUV used in this experiment is the “Haijing-4000”, as shown in Figure 4a. The vehicle is approximately 5.5 m in length, with a barrel diameter of 0.45 m, a maximum speed of about 4 knots, a cruising speed of around 2 knots, and a maximum operating depth of 4000 m. The AUV is equipped with a variety of payloads, including multi-beam sonar, side-scan sonar, magnetometer, conductivity–temperature–depth profiler (CTD), etc. It also carries auxiliary sensors such as an inertial navigation system (INS), forward-looking sonar (single-beam), depth and altimeter, and a Doppler velocity log (DVL) to provide control data.
The multi-beam sonar used is the Seabat T-20P from Reason Company. The transducer operates at a frequency of 400 kHz with 256 beams per ping. The footprint angle of the beam is 1° × 1°, the maximum opening angle for equidistant beams is 140°, and the maximum opening angle for equiangular beams is 160°. The maximum range is 300 m, and the highest ping rate achieved is 50 pings/second.
The DVL used in the experiment is the 300 kHz DVLII, with an operating frequency of 300 kHz. The calibrated effective beam length is 300 m, which is related to the marine environment and seafloor sediment. The INS is a GC25-7A triaxial fiber-optic gyroscope inertial navigation system, and its combined navigation system accuracy with the DVL is 0.3% of the range.
The experiment site is located near a reef in the South China Sea, as shown in Figure 5. The water depth in this area is around 100–400 m. There are no fishing nets or navigational obstacles, providing favorable external conditions for the experiment. Before the sea operation, the experimental site was chosen, and the operators collected the public terrain data for the test area and analyzed the seafloor topography. The collected data include:
  • General Bathymetric Chart of the Oceans (GEBCO) seafloor bathymetric data for a 500 m × 500 m grid;
  • Nautical charts on a 1:1 million scale;
  • Hydrological information such as sea conditions, swells, and currents viewed through the Windy website [23].
Figure 5. Schematic diagram of the survey area. This area located in South China Sea. The eastern part of the survey area near the reef has relatively shallow water, and the topographic changes are more obvious. The western part of the survey area, further away from the reef, has deeper water, and the topography changes more gradually.
Jmse 11 01466 g005
Due to the small scale of the collected reference charts and the outdated data, which were measured in 1974 by single-beam echo sounder, the chart data were only used as supplementary material for task planning. The planned survey lines before operation mainly referred to the bathymetric grid data publicly available on the GEBCO website. The seafloor topography color rendering map of the survey area can be seen in Figure 5, with data sourced from the GEBCO website [24]. GEBCO data are a fusion of satellite altimetry data and shipborne multi-beam data, and its grid resolution is relatively low [25].
Given that the operators only understand the overall trend of the underwater topography of the survey area, and that the eastern part near the reef has significant topographic undulations, unfamiliar waters pose a considerable challenge for experimental operations. Therefore, after the AUV completed the surface multi-beam scan as shown in Figure 4c,d, more underwater topographic data for the survey area were obtained. This allowed the operators to make more accurate estimates of the underwater topography, which was of great assistance to the smooth progression of subsequent experiments.
There were two experiments in this study. The first one did not follow the method described in the text. The vehicle triggered its own protection mechanism and surfaced, failing to complete the measurement task. The second one followed the method outlined in this paper. The vehicle successfully completed the measurement task, acquired multi-beam bathymetric data, and improved operational efficiency, all while ensuring equipment safety. Although the two experimental areas are different (experiment 1 is on the guide line and experiment 2 is on the main survey line), the principles, models, and methods proposed in this paper apply to both. Therefore, a comparative experiment can be conducted.

3.2. Experiment 1

3.2.1. Introduction to the Experimental Situation

Regardless of the many factors, the valid vertical distance of DVL is about 150 m. As can be seen from Figure 5, in most survey areas when the vehicle is released on the water surface, the depth exceeds the DVL’s bottom tracking height. During the experiment, the operators laid out guide lines for entering the survey area. The mother ship is anchored near the reef where the water is relatively shallow, which can guarantee that the DVL is consistently valid during the whole task. The vehicle detaches from the mother ship at the anchoring point, adjusts its fixed depth constantly following the terrain changes, and reaches the predetermined depth in the survey line work area. The AUV’s fixed depth on the guide line is determined according to Formula (5) and does not consider the multi-beam coverage situation.

3.2.2. Data Analysis

Control data from the AUV during navigation are an important means of understanding the underwater navigation status of the AUV. To understand the execution of the vehicle’s tasks, the first thing is the time the vehicle spends underwater executing tasks. More information needs to be checked after the equipment is recovered, such as its trajectory, depth, height, DVL bottom tracking status, etc., to ultimately confirm the success of the task. In this experiment, we extracted the depth and height data recorded by the vehicle’s depth altimeter. The standard range of the altimeter is 100 m. When the vehicle is more than this distance from the bottom, the height data of the depth altimeter is invalid. The altimeter data recorded are all invalid values when the vehicle’s height exceeds the altimeter range, as seen from the oscillating sections of the depth altimeter data in Figure 6a. To understand the change in height under the vehicle during the operation, the depth data of beam 128 from the multi-beam depth measurement is extracted. As the sampling frequencies of the two are different, the cubic spline interpolation algorithm is used to interpolate the depth provided by the multi-beam, so that it matches the sampling time of the depth altimeter data, and the change in height under the vehicle during the survey line operation is obtained.
The vehicle’s control data only record the DVL bottom tracking status. When the DVL bottom tracking is effective, its status is displayed as 1, and when it is ineffective, it is 0. The DVL’s standard range is 300 m, but this value is obtained through laboratory testing. In actual operations, due to factors such as the marine environment and seabed sediment, the actual range of the DVL changes.
However, the effect of the marine environment on the DVL is relatively complex, and the impact factor Δh is difficult to determine. We may as well assume that the effective beam length (standard range) M of the DVL is 300 m. Although there is a difference from the actual situation, it does not affect the analysis of the DVL bottom tracking height and the vehicle’s underwater status under attitude influence.
According to the attitude change of the vehicle on the guide line, the model of the DVL bottom tracking height under attitude influence is used to calculate the changes in the vertical effective height of the four beams of the DVL throughout the motion process. This experiment involves large changes in attitude, and we can summarize the law of changes in the vertical effective height of the four beams with attitude changes. The changes in attitude and the vertical effective height of the four DVL beams are shown in Figure 6f, and the following laws can be concluded:
  • Beams 1 and 3 are mainly affected by pitch, and beams 2 and 4 are mainly affected by roll. This is related to the spatial position distribution of the beams and the vehicle;
  • The magnitudes of the effects of attitude on beams 1 and 3 are the same, but the signs are opposite. The same rule applies to beams 2 and 4.
Combining Figure 6b,d, we can see the attitude changes when the vehicle dives. The front of the vehicle quickly descends, leading to a rapid increase in pitch. Although the roll angle shown in Figure 6c does not change much, it is still affected by the same pitch change. During the vehicle’s descent (or ascent), the vertical effective height of DVL beam 3 drops sharply, while the vertical effective height of DVL beam 1 increases correspondingly. The vertical effective heights of beams 2 and 4 remain relatively stable. At this time, the DVL can still maintain three effective bottom-tracking beams, so the DVL data read by the INS system are still effective.
As seen from Figure 6a,b, when the DVL fails, the depth of the carrier continues to deepen, and the height of the carrier also increases, reflecting the large change in terrain slope here and a dramatic change in water depth. Affected by the pitch angle, at point ① in Figure 6f, DVL beam 1 has already failed, but the DVL can still maintain three effective bottom-tracking beams at this time. As the height of the carrier continues to increase, the situation where beams 1 and 4 fail at the same time appears at point ② in Figure 6f. At this time, only two beams of the DVL are effective. The INS system identifies this problem in real-time, and the DVL bottom state changes from 1 to 0 in Figure 6e. After this time, the DVL continuously fails to bottom track, the location calculated by the navigation system drifts, and the vehicle control system obtains incorrect position information, indicating that it has not reached the planned location (it may have actually arrived). At this time, the vehicle still dives to the planned depth of 225 m and maintains the depth of 225 m. During this time, the vehicle continues to move towards the task location according to the real-time erroneous position information, and, eventually, the vehicle triggers its own protection mechanism in the shallow water area (the vehicle has no way to determine whether it has reached the shallow water area), and the vehicle’s emergency ascent causes the mission to fail.

3.2.3. Experiment Summary

The main reason for the failure of this experiment is that the depth of the carrier determined by the operator is too small, and the depth of the vehicle on the survey line is not strictly determined according to the operation method of this paper, and the effective beam length of the DVL is affected by the marine environment. The timestamp when the INS system identifies the DVL failure is 1,675,815,430,000, and according to the DVL bottom tracking height model under the influence of attitude in this paper, the DVL beams 1 and 4 have already failed at timestamp 1,675,815,402,000, with a gap of 28 s between the two. From the data point of view, sometimes the DVL’s two beams have been invalid to the bottom, but the INS system still shows that the DVL data is valid, as show in following Task (5) and Task (7). The possible reason is that the area near the survey area is a reef bottom, its hard reflection characteristics make the backscattered intensity larger, and the effective beam length of the DVL has increased by about 5 m to around 305 m. When the effective beam length M of the DVL is 305 m, the time when the DVL fails according to the DVL bottom tracking height model under the influence of attitude is only 2 s away from the time when the INS records the DVL failure. The vertical effective heights of the four DVL beams under the influence of attitude shown in Figure 7f are ideal and can still explain what happened to the vehicle underwater. However, the impact of the marine environment cannot be ignored, and its impact on the effective beam length of the DVL has a large uncertainty, so the operation method of this paper adopts a conservative attitude, assuming that the marine environment weakens the effective beam length of the DVL.
Being affected by failed tasks, the first 24 h work time of the experiment only obtained 21.3 km of valid survey lines. After the failure of the vehicle’s mission, a lot of time was spent returning to the anchor point near the surface, downloading data, and analyzing the reasons for the problem, which affected the operators’ planning of subsequent tasks. The operators promptly summarized their experience:
  • For guide lines that guide the vehicle to successfully complete the mission, the depth and bottom height of the vehicle should be checked in time;
  • There should be no change in depth on the guide line under normal circumstances, and the depth should be strictly determined according to the operation method proposed in this paper.
This paper’s model and method consider the impact of the marine environment, making it closer to the actual situation; the model and method can analyze and explain the reasons for the problems encountered by the vehicle underwater, proving the effectiveness and feasibility of the model in this paper; it can guide AUVs equipped with multi-beam to perform bathymetric survey tasks, ensure the smooth execution of tasks, and improve work efficiency. Experiment 2 shows the flight control data of the vehicle performing the task underwater strictly according to the operation method of this paper and the analysis of the data.

3.3. Experiment 2

3.3.1. Introduction of the Experimental Situation

In experiment 2, a multi-beam operation was carried out according to the operation method proposed in this paper. Figure 7 presents a three-dimensional underwater track map of a task execution during the experiment, with position information provided by the INS/DVL integrated navigation system. Tasks (1) to (4) are the guide lines set up in the survey area to guide the vehicle to smoothly pass the terrain with a larger slope in the eastern part of the survey area while ensuring the DVL is effective. Tasks (5), (7), (9), (11), (13), (15), (17), and (19) are the main survey lines, and tasks (6), (8), (10), (12), (14), (16), and (18) are the main survey line spacing lines, used to adjust the fixed depth of the vehicle, to ensure the multi-beam measurement tasks are completed at the same fixed depth on the main survey line. In this experiment, all main survey lines were laid out according to IHO standards for hydrographic surveys special order, which needs bathymetric coverage to be up to 100% [26]. Task (20) is after the end of the vehicle task, the vehicle ascends. Table 1 shows the depth change situation of the survey line layout and AUV task execution. From Figure 7, it can be clearly seen that according to the change in terrain slope, the operators gradually increase the fixed depth of the vehicle on each main survey line to ensure the successful implementation of the operation task.
After the carrier is launched from the mother ship, it conducts sensor tests in the water. During this period, the carrier is pushed away by the current, so the trajectories of tasks (1) and (2) overlap somewhat. During the ascent after the task is completed, the height below gradually increases, and the water depth exceeds the vertical effective height of the DVL, making it ineffective at bottom tracking, so the position estimated by the INS has a certain error. This can be seen in Figure 7 in the carrier’s ascent trajectory for task (20). After the carrier floats out of the water and receives a GNSS signal, the navigation system provides more accurate positional information. A single position point appears at the end of the task ascent in Figure 7. This position point information is provided by the GNSS/INS combined navigation system.

3.3.2. Data Analysis

The change in roll and pitch angles in the constant depth mode is relatively small, and the posture of the carrier is relatively stable. According to Equation (3), the range of the four beams of the DVL changes with the attitude angle of the carrier during the execution of the task. To prove the effectiveness of the model proposed in this paper, the central beam height extracted from the multi-beam data is overlaid with the effective vertical height of the DVL, proving that the DVL is consistently effective at bottom tracking throughout the process. This proves the feasibility of the constant depth determined by the operation method proposed in this paper during task execution.
The fixed depth of task (5) is 135 m. As can be seen from Figure 8b, the carrier maintains a steady position at around 135 m, and the height below the carrier continuously changes. Figure 8a shows a good consistency between the valid data from the depth altimeter and the central beam from the multi-beam data. The central beam data can be used to replace the altimeter data to understand the changes in height below the carrier. The depth data and height data can reflect the terrain changes at the navigation trajectory of task (5). The water depths on the north and south sides of the survey line are deeper, while the northern part in the middle is shallower. The attitude in constant depth mode is relatively stable, and Figure 8c,d show that the carrier’s attitude is relatively stable. Figure 8d shows that the carrier suddenly adjusted its pitch angle during the task execution, and then the control system self-corrected this error. The cause of this error has not yet been found; it seems like a brief system glitch, its occurrence time is very brief, and it does not affect the execution of the task, because Figure 8e shows that the DVL is constantly bottom tracking, therefore, the accuracy of underwater navigation can be guaranteed. Figure 8f shows the relationship between the vertical effective height of the four beams of the DVL and the height of the carrier during motion. The height of the carrier is constantly within the vertical effective height of the DVL for bottom tracking (except for one error that occurred during the process, but the INS still read the DVL three beams effectively at bottom), which demonstrates the effectiveness of the dynamic change model of DVL range proposed in this paper. By merging the data of the central beam in the multi-beam and the depth data, we obtain the water depth data. During operation, the alarm mechanism is triggered if the carrier’s height from the bottom is less than 20 m for a continuous 10 s. The maximum water depth on the survey line of task (5) is 272.88 m, and the minimum is 161.23 m. The depth of 135 m can ensure that the DVL is constantly effective at bottom tracking, and it will not trigger an alarm for the carrier being too close to the bottom. On the survey line of task (5), the maximum distance of the carrier from the bottom reaches 137.88 m, which is close to the effective vertical height of the DVL; the closest distance from the bottom is 26.23 m, which is close to triggering the carrier’s safety protection mechanism. This shows that the terrain slope on this survey line changes greatly, approaching the limit situation under the performance limit of the carrier, which brings great difficulty to the layout of the survey line, especially in determining the fixed depth of the carrier. This situation should be avoided as much as possible when planning tasks, and the operation method proposed in this paper should be strictly followed when it is unavoidable. The smooth execution of the task shows that the operation method proposed in this paper reasonably determined the fixed depth of the carrier in task (5).
The fixed depth of task (7) is 150 m. From Figure 9b, it can be seen that the carrier maintains a steady position at 150 m, and the height below the carrier continuously changes. Figure 9a also shows a good consistency between the valid data from the depth altimeter and the central beam from the multi-beam data. The central beam data can replace the depth altimeter data to understand the changes in height below the carrier. The survey lines of tasks (7) and (5) are relatively close, and the terrain of the survey area is deeper on the north and south sides of the survey line, and the northern part in the middle is shallower. Figure 9c,d show that the carrier’s attitude is relatively stable when performing tasks in constant-depth mode. Figure 9e shows that during the actual underwater operation, there was one occasion when the INS thought the DVL data were invalid, which might have been a random error, because the DVL’s bottom tracking failure lasted less than 0.5 s, it did not affect the execution of the task, and the DVL was consistent at bottom tracking throughout the process, so the accuracy of underwater navigation was ensured. Figure 9f shows the relationship between the vertical effective height of the four beams of the DVL and the height of the carrier during motion. The height of the carrier is constantly within the vertical effective height of the DVL for bottom tracking, which demonstrates the effectiveness of the dynamic change model of DVL range proposed in this paper. The maximum water depth on the survey line of task (7) is 287.73 m, and the minimum is 194.42 m. The depth of 150 m can ensure that the DVL is constantly effective at bottom tracking, and it will not trigger an alarm for the carrier being too close to the bottom, ensuring the smooth execution of the task. This shows that the operation method proposed in this paper reasonably determined the depth of the carrier in task (7). Next, we calculated whether the two survey lines reached the expected overlap rate. The survey line spacing is set to 130 m and the beam angle during operation is 130°, so, according to Equation (8), the maximum range of the multi-beam is 300 m. Therefore, the minimum coverage width of the multi-beam in task (5) is 112.5 m, and, similarly, the minimum coverage width of the multi-beam in task (5) is 190.52 m. Therefore, the overlapping area of the two survey lines reaches 16% in the shallowest area, and the overall overlap rate of the survey line exceeds 50%, meeting the expected overlap rate of at least 10%. Figure 10 gives a three-dimensional terrain map measured by two multi-beam survey lines. From Figure 10, it can be seen that the degree of overlap in the stitched bands is good. As the INS\DVL navigation error accumulates over time, there is a small offset between the same depth contour lines between the two surfaces, but the overall trend is consistent. The discrepancies in the overlapping area of the two surfaces are counted and shown in Figure 11, and the number of depth points, the maximum, minimum, average, and standard deviation of discrepancies are calculated and shown in Table 2.
From Figure 11, it can be seen that the water depth discrepancies calculated from the two survey lines present a fairly standard normal distribution, that is, the vast majority of discrepancies are distributed around 0. Combined with Table 2, it can be seen that the average of the water depth discrepancies is 0.02 m, and the standard deviation is 0.2 m, which also corroborates the data presented in Figure 10. The maximum discrepancy in the water depth values of the two survey lines is 1.72 m, the minimum is −3.46 m, and the average is −0.03 m. For a survey area with a water depth greater than 200 m, it is considered that there is no difference in the overlapping area of the two survey lines.

3.3.3. Experiment Summary

Under the guidance of this method, subsequent experiments were carried out successfully, and approximately 69.6 km of valid survey lines were acquired during the following 36 h of operation. Compared to experiment 1, the operational efficiency increases by approximately 68%. This improvement is mainly attributed to the successful execution of the AUV underwater without any emergency incidents.

4. Discussion

4.1. Advantages of the Proposed Method

4.1.1. Safety and Efficiency of AUV Carrying Multi-Beam in Unfamiliar Waters

The key to conducting multi-beam terrain surveys with an AUV in unfamiliar waters lies in ensuring the safety of the equipment. Once the AUV submerges, it operates independently of the mother ship, which introduces risks to its use. Therefore, ensuring the underwater safety of the vehicle becomes a major concern in the experiment. While many researchers have studied collision avoidance algorithms for AUVs, most of these studies are based on simulated scenarios under ideal conditions and have not been combined with actual application scenarios [27,28,29]. In the context of multi-beam terrain surveys conducted by an AUV in a constant-depth mode, the existing autonomous collision avoidance methods are not applicable for the following reasons:
(1)
Multi-beam surveys aim to measure obstacles that fall within the measurement target range;
(2)
The vehicle should follow the planned survey lines, and deviations from the predetermined trajectory are not allowed by the collision avoidance algorithm.
In this experiment, the “Haijing-2000” AUV employed a collision-avoidance method that combined the vehicle’s self-protection mechanism with forward-looking sonar to ensure equipment safety. The most important aspect of the vehicle’s self-protection mechanism is to avoid getting too close to the seabed. In the experiment, a minimum distance from the seabed was set for the vehicle. When passing over obstacles, the depth data obtained from the depth sensor onboard the vehicle decreased. When the distance from the obstacle (seabed) was less than the minimum distance from the seabed, the vehicle’s self-protection mechanism was triggered, and the vehicle stopped ascending. The operational method proposed in this paper fully considers the vehicle’s self-protection mechanism and imposes effective constraints on the minimum distance from the seabed when determining the fixed depth for the vehicle. This effectively ensures the safety of the AUV’s underwater operations.
The failure of the Doppler velocity log (DVL) to maintain bottom lock also poses a threat to equipment safety. After the DVL loses bottom lock, the positioning error introduced by the inertial navigation system (INS) accumulates over time. For a vehicle that relies on positional information to execute tasks, inaccuracies in the position information can lead to task failures. For example, if the INS indicates that the vehicle is in deepwater, and the control system maintains the fixed depth for deepwater, the vehicle may have drifted into shallow water, triggering the vehicle’s self-protection mechanism and causing the mission to terminate. The DVL vertical effective height model, considering the influence of vehicle attitude, takes into account the impact of changes in vehicle attitude on DVL beams. When determining the fixed depth for the vehicle in the operational method, the maximum distance from the seabed is effectively limited, ensuring continuous bottom lock of the DVL during multi-beam operations. This ensures both the accuracy of vehicle navigation and its safety.
Failure of a mission resulting in the vehicle surfacing significantly reduces the efficiency of offshore operations, especially in areas with greater water depth. The surfacing point of the vehicle is usually in deepwater, and the water depth often exceeds the vertical effective height of the DVL. As a result, the vehicle needs to return to shallow water to restart the mission. In cautionary practice, after a mission failure, the operators need to spend time downloading vehicle control data, analyzing the data, and identifying the reasons for the mission failure. These factors significantly increase the workload of operations and reduce their efficiency. The method proposed in this paper aims to ensure the successful completion of missions while guaranteeing the safety of the vehicle. Therefore, it has significant practical value and provides important guidance for AUV with multi-beam surveys in unfamiliar waters.

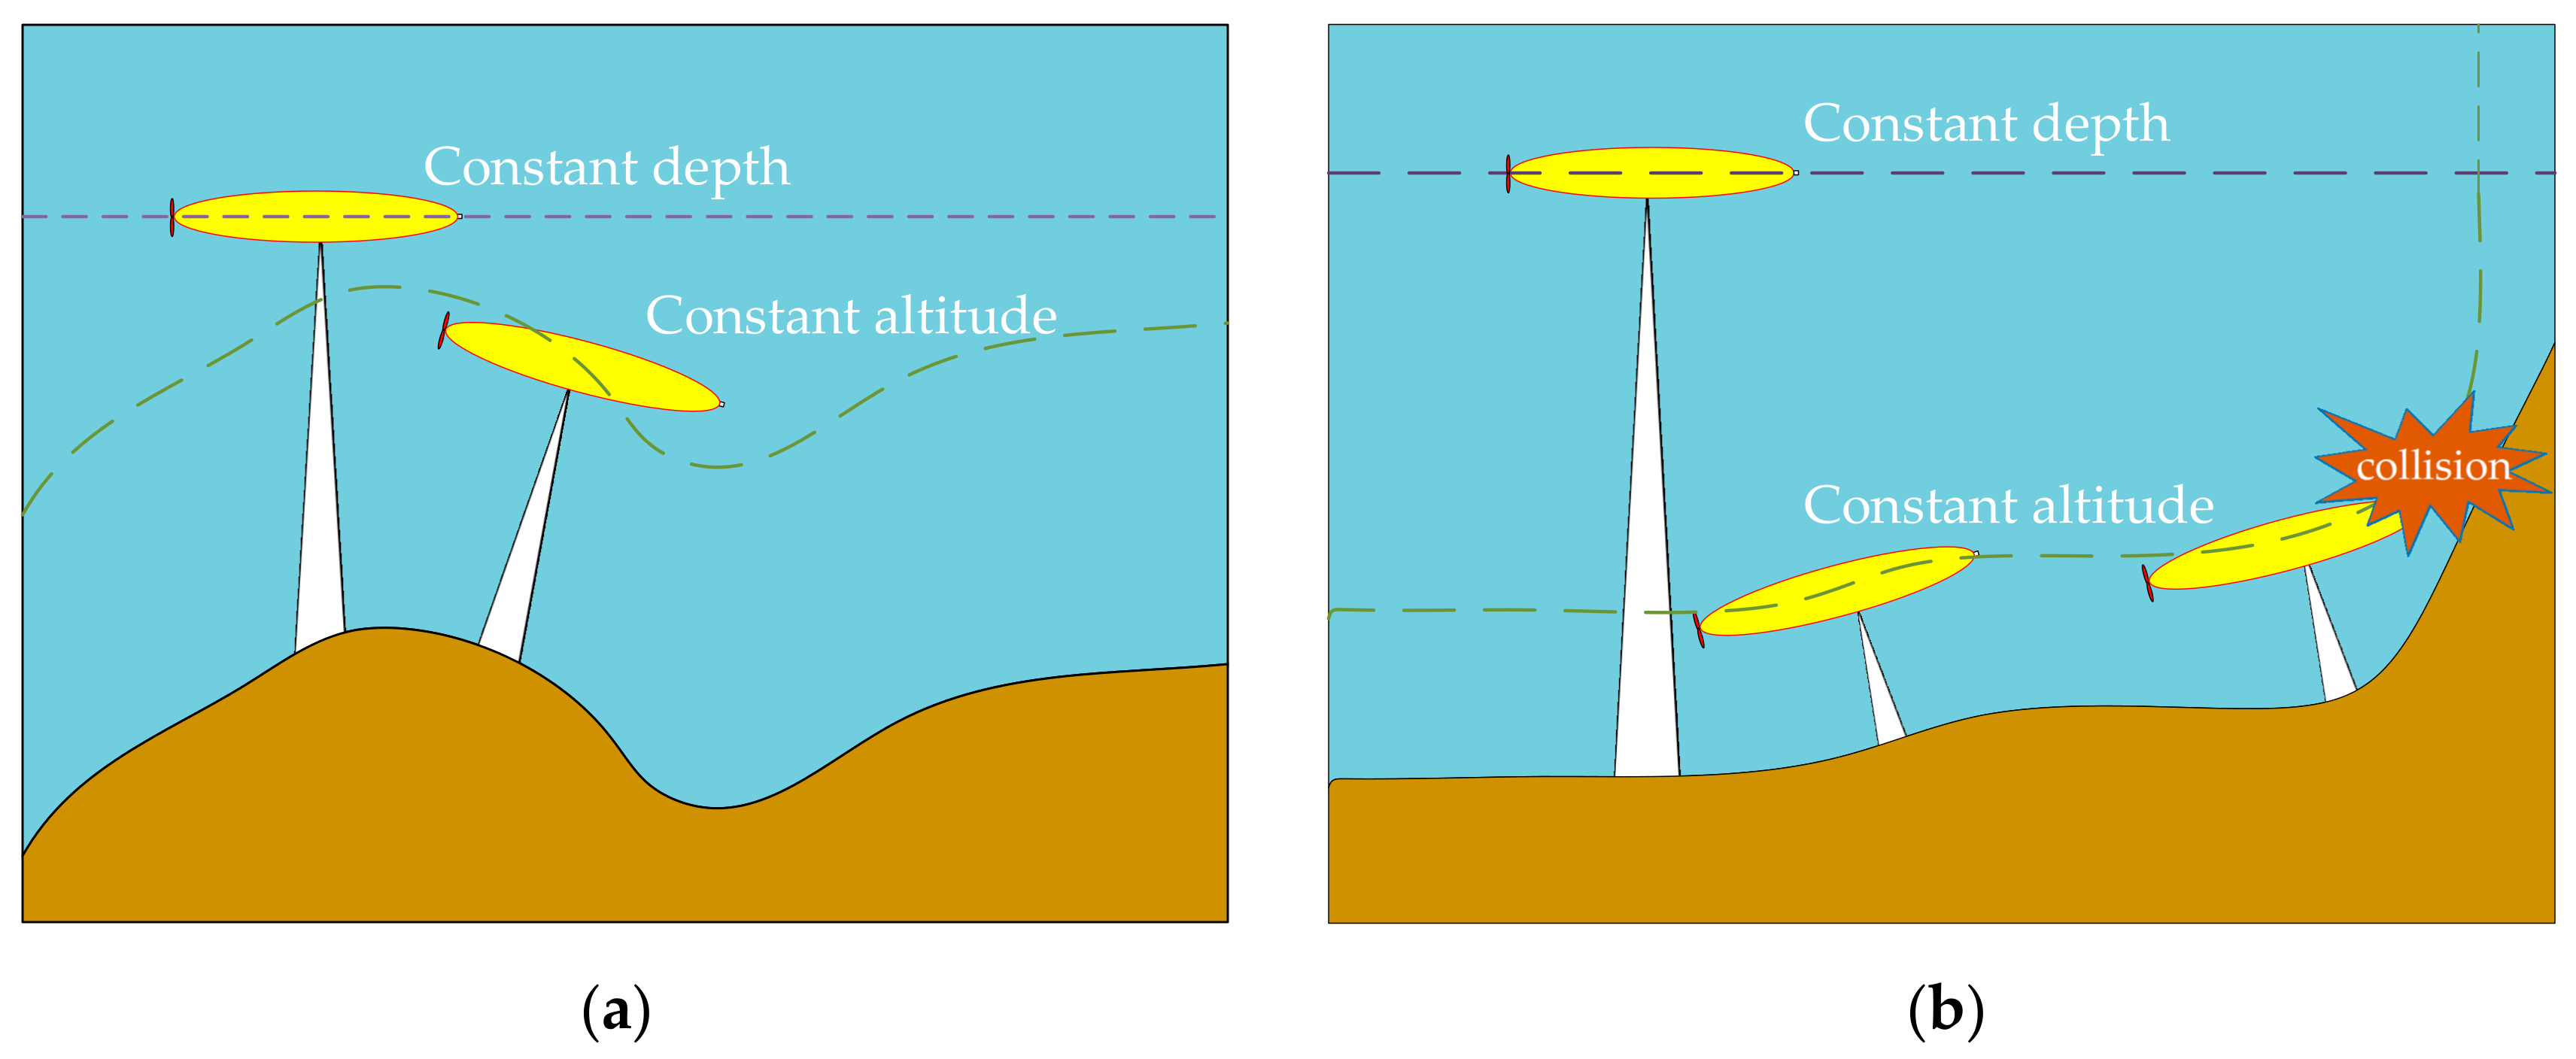
4.1.2. Constant-Height Mode and Constant-Depth Mode

The typical strategy for AUV-multi-beam surveys is to maintain a relatively constant speed and pass over the seafloor at a certain height based on a pre-defined survey plan [8]. According to the distance from the seafloor, the AUV can operate in two modes: constant-height mode, where the distance from the sea surface remains constant, and changes in the terrain are reflected in the depth beneath the vehicle; and constant-depth mode, where the distance from the seafloor remains constant, and changes in the terrain are reflected in the depth beneath the vehicle. Multi-beam surveys conducted by an AUV using these two modes have their advantages and limitations, and to date, no systematic study has been conducted on the impact of these two motion modes on multi-beam terrain surveys [15]. The two survey modes are illustrated in Figure 12a.
In the constant-height mode, the vehicle primarily maintains a constant height above the seafloor based on the height data obtained from the depth sensor. During the process, the vehicle continuously adjusts its rudder and buoyancy, resulting in significant changes in vehicle attitude. These attitude changes exceed the predefined limits for multi-beam surveys, thereby reducing the quality of the multi-beam data and posing challenges for data processing. The advantage of the constant-height mode lies in maintaining a constant height above the seafloor, resulting in a more uniform distribution of multi-beam footprint coverage. The resolution in both the along-track and across-track directions remains relatively stable. When the terrain has a certain slope, within the instrument’s range limitations, this mode exhibits better adaptability to the terrain. However, in areas where the terrain slope exceeds the vehicle’s maximum pitch angle limit, the vehicle’s adaptability to the terrain is compromised. As a precautionary measure, to prevent excessive pitch oscillation of the vehicle, the vehicle’s maximum pitch angle is usually limited. This protection mechanism limits the speed at which the vehicle descends or ascends. When the terrain slope changes are too large for the vehicle to adjust its attitude accordingly, the vehicle cannot maintain a constant height above the seafloor. The height beneath the vehicle either decreases or increases, depending on the direction of the slope change relative to the vehicle’s forward direction. If the height beneath the vehicle decreases, the vehicle eventually triggers its self-protection mechanism to stop ascending due to being too close to the seafloor. If the height beneath the vehicle increases, it causes the DVL to lose bottom lock, leading to inaccurate positional information from the INS. Figure 12b shows an area with significant terrain slope changes where the constant-height mode fails.
In the constant-depth mode, the AUV’s control system maintains a depth relative to the sea surface by utilizing the pressure values obtained by fusing the CTD and depth sensor data. After reaching the predetermined depth, the AUV maintains this depth during the entire operation. The vehicle’s attitude remains relatively stable, requiring only minor adjustments by the control system to maintain the desired attitude. This mode is more suitable for multi-beam terrain systems that are sensitive to vehicle attitude requirements. Moreover, in areas where the terrain slope changes exceed the vehicle’s limitations in the constant-height mode, the proposed operational method allows for successful operations in those areas, as shown in Figure 12b. However, fixed-depth mode operations primarily reflect changes in the height beneath the vehicle, resulting in continuous changes in the depth measurement from the multi-beam system and variations in the resolution of the multi-beam terrain data. In addition, as discussed in the operational method of this paper, inappropriate selection of the fixed depth can lead to problems such as DVL losing bottom lock and triggering the vehicle’s self-protection mechanism.
In this experiment, the constant-depth mode was selected for the operational method, mainly because the terrain changes in the eastern part of the survey area had significant slope variations that caused the vehicle to experience substantial attitude changes in the constant-height mode, rendering some areas unsuitable for the mode. The operational method proposed in this paper aims to overcome the issues associated with the constant-depth mode, such as DVL losing bottom lock and triggering the vehicle’s self-protection mechanism. By conducting proper underwater terrain detection, the difficulties of estimating underwater terrain in unfamiliar waters are overcome. By planning survey lines appropriately, determining the constant-depth for the vehicle, and subsequently defining the survey line spacing and multi-beam swath overlap, the issues of DVL losing bottom lock and triggering the vehicle’s self-protection mechanism can be avoided, ensuring the overlap of the multi-beam swaths and preparing the data for correcting the offset in INS/DVL navigation data over time. The offshore experiments demonstrate that the operational method proposed in this paper is applicable in unfamiliar waters. By implementing proper operational planning, the limitations of the constant-depth mode can be mitigated, guaranteeing the safety of the vehicle and controlling the quality of the multi-beam data. Therefore, it has significant engineering significance.
The two motion modes of the vehicle result in different characteristics in the acquired multi-beam data. In this experiment, the AUV conducted multi-beam surveys in the constant-depth mode, and data were also obtained in the constant-height mode. The next step will involve further comparative analysis of the data characteristics and accuracy between these two modes.

4.2. Limitations of the Proposed Method

The model established in this paper for the DVL vertical effective height under attitude influence still has limitations. In this experiment, the DVL beams were arranged in a “+” configuration, and the model was established based on this configuration. However, modeling and experimental validation of DVLs with an “×” beam configuration, which is not applicable to the model proposed in this paper, are still lacking.
The multi-beam data obtained using the method proposed in this paper, which involves an AUV carrying multi-beam systems in unfamiliar waters, were influenced by the vehicle’s position on the water surface, which is affected by sea waves and exhibits significant attitude changes. As a result, the quality of the multi-beam data is compromised. Additionally, the multi-beam data have not been corrected and may contain certain errors. However, real-time terrain data can still meet the requirements for estimating underwater terrain and are necessary for ensuring the success of subsequent operational tasks in areas with significant terrain changes.
Furthermore, the proposed method is limited by the performance of the instruments, such as the minimum height of the vehicle, the vertical effective height of the DVL, and the multi-beam range. In areas with complex terrain changes where existing instruments cannot meet the requirements, it is recommended to replace the DVL and multi-beam terrain systems with larger range capabilities to conduct operations.

5. Conclusions and Recommendations

In response to the lack of systematic research on AUV-based multi-beam terrain surveying in unfamiliar water areas, this study proposes a method for conducting multi-beam surveys using AUVs in unfamiliar water areas based on the constant-depth mode. By considering the aspects of equipment safety, operational efficiency, and data quality, the proposed method ensures the successful operation of AUV-based multi-beam surveys, guarantees the safety of the AUV, and improves operational efficiency. The results of the field experiment demonstrate that the operational efficiency increases by approximately 68% when following the proposed method. The innovations of this study are summarized as follows:
  • Four basic principles for conducting multi-beam terrain surveys using AUVs in the constant-depth mode in unfamiliar water areas are proposed. These principles fully consider the performance of the AUV’s sensors, the characteristics of the AUV’s constant-depth mode, and the data quality of the multi-beam surveys. They provide valuable guidance for conducting multi-beam terrain surveys in unfamiliar water areas using AUVs in the constant-depth mode:
  • A vertical effective height model is introduced to accurately constrain the fixed depth of the AUV, ensuring the continuous effectiveness of the Doppler velocity log (DVL) in seafloor measurements. The model also takes the overlap rate of the multi-beam swath and the data quality of the surveys into account, allowing for the determination of the AUV’s fixed depth and ensuring the successful implementation of the surveys;
  • A workflow for conducting multi-beam surveys in unfamiliar water areas using AUVs in the constant-depth mode is established. Based on the principles and the vertical effective height model, a complete workflow is developed, including underwater terrain estimation, layout of survey lines, determination of the AUV’s fixed depth, calculation of the multi-beam swath overlap rate, and adjustment of the AUV’s fixed depth if necessary.
The proposed method has been successfully validated through field experiments and provides reliable guidance for AUV-based multi-beam surveys in unfamiliar water areas, demonstrating its significant engineering value.

Author Contributions

Conceptualization, S.J. and G.B.; data curation, Y.T.; formal analysis, J.W. and G.B.; funding acquisition, S.J.; investigation, J.W., X.Z. and C.P.; methodology, J.W., X.Z. and C.P.; project administration, S.J.; validation, Y.T., S.J., G.B. and X.Z.; visualization, Y.T. and C.P.; writing—original draft, J.W.; writing—review and editing, Y.T. and S.J. All authors have read and agreed to the published version of the manuscript.

Funding

This research was funded by the National Natural Science Foundation of China, grant number 41876103.

Institutional Review Board Statement

Not applicable.

Informed Consent Statement

Not applicable.

Data Availability Statement

Access to the data will be considered upon request by the authors.

Conflicts of Interest

The authors declare no conflict of interest.

References

  1. Zhao, J.; Liu, J. Multi-Beam Sounding and Image Data Processing; Wuhan University Press: Wuhan, China, 2008. [Google Scholar]
  2. Wu, Z.; Yang, F.; Luo, X. High Resolution Submarine Geomorphology; Science Press: Beijing, China, 2017. [Google Scholar]
  3. Hughes Clarke, J.E. Multibeam Echosounders; Springer International Publishing: Cham, Switzerland, 2018. [Google Scholar]
  4. Wölfl, A.-C.; Snaith, H.; Amirebrahimi, S.; Devey, C.W. Seafloor Mapping—The Challenge of a Truly Global Ocean Bathymetry. Front. Mar. Sci. 2019, 6, 283. [Google Scholar] [CrossRef] [Green Version]
  5. Zhang, Y.; Xiao, F.; Jin, S. A Correction Method for Multi-Beam Roll Residual Based on L-M Algorithm; Geomatics and Information Science of Wuhan University: Wuhan, China, 2020. [Google Scholar]
  6. Jin, S.; Liu, G.; Sun, W. The Research on Depth Reduction Model of Multibeam Echosounding Considering Ship Attitude and Sound Ray Bending. Hydrogr. Surv. Charting 2019, 39, 1. [Google Scholar]
  7. Clarke, J.E.H.; Mayer, L.A.; Wells, D.E. Shallow-water imaging multibeam sonars: A new tool for investigating seafloor processes in the coastal zone and on the continental shelf. Mar. Geophys. Res. 1996, 18, 607–629. [Google Scholar] [CrossRef]
  8. Mohrmann, J.; Greinert, J. AUV Navigation Correction Based on Automated Multibeam Tile Matching. Sensors 2022, 22, 954. [Google Scholar] [CrossRef] [PubMed]
  9. Tang, Y.; Wang, L.; Jin, S. AUV-Based Side-Scan Sonar Real-Time Method for Underwater-Target Detection. J. Mar. Sci. Eng. 2023, 11, 690. [Google Scholar] [CrossRef]
  10. Suleiman, M.A.S.; Edwin, F.S.D. AUV Sensors for Marine Research LAWRE NCE C.LAN GEB RAKE. Technology and Applications of Autonomous Underwater Vehicle; CRC Press: Boca Raton, FL, USA, 2002. [Google Scholar]
  11. Li, Y.; Ma, T. Bathymetric Simultaneous Localization and Mapping for Autonomous Underwater Vehicle; Science Press: Beijing, China, 2021. [Google Scholar]
  12. Zhou, J.; Si, Y.; Chen, Y.A. Review of Subsea AUV Technology. J. Mar. Sci. Eng. 2023, 11, 1119. [Google Scholar] [CrossRef]
  13. Diercks, A.-R.; Asper, V.L.; Williams, J.L.; Woolsey, M. Advanced technology in motion: NIUST’s AUV fleet. In Proceedings of the OCEANS 2009, Biloxi, MS, USA, 26–29 October 2009; Volume 10, pp. 1–5. [Google Scholar] [CrossRef]
  14. Yoshida, H. Development of the cruising—AUV Jinbei. In Proceedings of the 2012 Oceans—Yeosu, Yeosu, Republic of Korea, 21–24 May 2012; Volume 5, pp. 1–4. [Google Scholar] [CrossRef]
  15. Klischies, M.; Rothenbeck, M.; Steinfuhrer, A.; Yeo, I.A.; Ferreira, C.D.S.; Mohrmann, J.; Faber, C.; Schirnick, C. AUV Abyss workflow: Autonomous deep sea exploration for ocean research. In Proceedings of the IEEE/OES Autonomous Underwater Vehicle Workshop (AUV), Porto, Portugal, 6–9 November 2018; Volume 11, pp. 1–6. [Google Scholar] [CrossRef]
  16. Ji, D.; Liu, J. Multi-Beam Sonar Application on Autonomous Underwater Robot. Mar. Geod. 2015, 38, 281–288. [Google Scholar] [CrossRef]
  17. Anonsen, K.B.; Hallingstad, O.; Hagen, O.K. Bayesian Terrain-Based Underwater Navigation Using an Improved State-Space Model. In Proceedings of the 2007 Symposium on Underwater Technology and Workshop on Scientific Use of Submarine Cables and Related Technologies, Tokyo, Japan, 17–20 April 2007; Volume 5, pp. 499–505. [Google Scholar]
  18. Maurelli, F.; Krupiński, S.; Xiang, X.; Petillot, Y. AUV localisation: A review of passive and active techniques. Int. J. Intell. Robot. Appl. 2022, 6, 246–269. [Google Scholar] [CrossRef]
  19. Kinsey, J.C.; Eustice, R.M.; Whitcomb, L.L. A Survey of Underwater Vehicle Navigation: Recent Advances and New Challenges. In Proceedings of the IFAC Conference of Manoeuvering and Control of Marine Craft, Lisbon, Portugal, 20–22 September 2006. [Google Scholar]
  20. Liu, P.; Wang, B.; Deng, Z.; Fu, M. INS/DVL/PS Tightly Coupled Underwater Navigation Method with Limited DVL Measurements. IEEE Sens. J. 2018, 7, 2994–3002. [Google Scholar] [CrossRef]
  21. Rigby, P.; Pizarro, O.; Williams, S.B. Towards Geo-Referenced AUV Navigation through Fusion of USBL and DVL Measurements. In Proceedings of the OCEANS 2006, Boston, MA, USA, 18–21 September 2006. [Google Scholar]
  22. Liu, P.; Hou, D.; Wang, K.; Wang, B. DVL Dead-Reckoning Navigation Method Based on Beam Measurements. In Advances in Guidance, Navigation and Control; Springer Nature: Berlin/Heidelberg, Germany, 2022; Volume 644, pp. 1253–1265. [Google Scholar]
  23. Windy. Available online: https://www.windy.com/?38.912,121.602,5 (accessed on 19 July 2023).
  24. GEBCO. Available online: https://www.gebco.net/ (accessed on 19 July 2023).
  25. Si, L. Development and implications of GECBO. J. Mar. Inf. Technol. Appl. 2015, 2, 1–5. [Google Scholar]
  26. Standards for Hydrographic Surveys. S-44 Edition, 6.0.0; International Hydrographic Organization: Monaco, 2020.
  27. Wang, Y.; Thanyamanta, W.; Bose, N. An Adaptive Mapping Strategy for Autonomous Underwater Vehicles. In Proceedings of the IEEE/OES Autonomous Underwater Vehicles Symposium, St. Johns, NL, Canada, 30 September–2 October 2020; Volume 9, pp. 1–2. [Google Scholar]
  28. Li, Y.; Ma, T.; Chen, P.; Jiang, Y.; Wang, R.; Zhang, Q. Autonomous underwater vehicle optimal path planning method for seabed terrain matching navigation. Ocean Eng. 2017, 133, 107–115. [Google Scholar] [CrossRef]
  29. Cheng, C.; Sha, Q.; He, B.; Li, G. Path planning and obstacle avoidance for AUV: A review. Ocean Eng. 2021, 235, 109–355. [Google Scholar] [CrossRef]
Figure 1. “Haijing-4000” navigation system.
Jmse 11 01466 g001
Figure 2. A schematic diagram of the DVL space. (a) shows the spatial location of the four DVL beams with the vehicle. (b) is the top view of (a), which give a clear illustration in plain view. (c) shows the side (rear) view of beams 1 and 3 (blue) (beams 2 and 4 (red)). The X-axis of the vehicle coordinate system points towards the front of the vehicle, the Y-axis points towards the right side of the vehicle, and the Z-axis is perpendicular to the X–Y plane and points downwards, forming a right-hand coordinate system. The coordinate system of the DVL is defined to be consistent with that of the vehicle.
Jmse 11 01466 g002
Figure 3. The workflow of constant-depth mode in unfamiliar waters.
Jmse 11 01466 g003
Figure 4. Sea operations. (a) depicts the AUV being deployed from the stern deck of the mother ship. (b) demonstrates the recovery of the AUV by dragging it with a small boat released from the mother ship. (c) shows the carrier performing multi-beam scanning operations on the surface of the water. (d) shows that the carrier conducts real-time depth measurement on the water surface, recorded via a remote desktop connection to the multi-beam collection software. The collection software used in the experiment is sonar user interface (UI), provided by the multi-beam manufacturer, used to set the parameters of the multi-beam system and view the real-time depth measured by the multi-beam system.
Jmse 11 01466 g004aJmse 11 01466 g004b
Figure 6. Vehicle control data. (af) show the navigation control data according to the timestamp, including the height, depth, roll, pitch of the vehicle, DVL bottom tracking state and the comparison between the effective height of the DVL and the height of the vehicle.
Jmse 11 01466 g006aJmse 11 01466 g006b
Figure 7. Underwater 3D trajectory map of the vehicle. The position information is provided by the INS/DVL integrated navigation system and the depth is provided by pressure sensor. The bottom green line is the projection of the three dimensional track line.
Jmse 11 01466 g007
Figure 8. Task (5) Vehicle control data. (af) show the navigation control data in Task (5), including the height, depth, roll, pitch of the vehicle, DVL bottom tracking state and the comparison between the effective height of the DVL and the height of the vehicle.
Jmse 11 01466 g008aJmse 11 01466 g008b
Figure 9. Task (7) vehicle control data. (af) show the navigation control data in Task (7), including the height, depth, roll, pitch of the vehicle, DVL bottom tracking state and the comparison between the effective height of the DVL and the height of the vehicle.
Jmse 11 01466 g009
Figure 10. Terrain map of Task (5) and Task (7).
Jmse 11 01466 g010
Figure 11. The discrepancies in the overlapping area of the two surfaces.
Jmse 11 01466 g011
Figure 12. AUV altitude modes. The characteristics of the two modes of movement were demonstrated in (a). (b) shows how the constant-attitude mode and the constant-depth mode adapt to large topographic changes.
Jmse 11 01466 g012
Table 1. AUV task conditions.
Task NumberExecution Task BriefTask NumberExecution Task Brief
(1)Guide line, from the surface to the dive point(11)Main survey line, set depth at 170 m
(2)Guide line, deepening to 10 m(12)Deepening to 180 m, maintain set depth at 180 m
(3)Guide line, deepening to 60 m, maintain set depth at 60 m(13)Main survey line, set depth at 180 m
(4)Guide line, deepening to 135 m, maintain set depth at 135 m(14)Deepening to 185 m, maintain set depth at 185 m
(5)Guide line, deepening to 135 m, maintain set depth at 135 m(15)Main survey line, set depth at 185 m
(6)Deepening to 150 m, maintain set depth at 150 m(16)Deepening to 190 m, maintain set depth at 190 m
(7)Main survey line, set depth at 150 m(17)Main survey line, set depth at 190 m
(8)Deepening to 160 m, maintain set depth at 160 m(18)Task ends, the carrier ascends
(9)Main survey line, set depth at 160 m(19)Main survey line, set depth at 170 m
(10)Deepening to 165 m, maintain set depth at 165 m(20)Deepening to 180 m, maintain set depth at 180 m
Table 2. Statistics of discrepancies between two surfaces.
ParametersNumber of PointsThe Maximum (m)The Minimum (m)The Average (m)Standard Deviation (m)
data32,0941.72−3.46−0.030.20
Disclaimer/Publisher’s Note: The statements, opinions and data contained in all publications are solely those of the individual author(s) and contributor(s) and not of MDPI and/or the editor(s). MDPI and/or the editor(s) disclaim responsibility for any injury to people or property resulting from any ideas, methods, instructions or products referred to in the content.

