Article

Computational Analysis of Cavitating Flows around a Marine Propeller Using Incompressible, Isothermal Compressible, and Fully Compressible Flow Solvers

by
Joseph Mwangi Ng’aru
1 and
Sunho Park
1,2,*
1
Department of Convergence Study on the Ocean Science and Technology, Korea Maritime and Ocean University, Busan 49112, Republic of Korea
2
Department of Ocean Engineering, Korea Maritime and Ocean University, Busan 49112, Republic of Korea
*
Author to whom correspondence should be addressed.
J. Mar. Sci. Eng. 2023, 11(11), 2199; https://doi.org/10.3390/jmse11112199
Submission received: 31 October 2023 / Revised: 14 November 2023 / Accepted: 17 November 2023 / Published: 19 November 2023
(This article belongs to the Section Ocean Engineering)

Abstract

:
This research investigates cavitation around a marine propeller, employing computational fluid dynamic (CFD) solvers, including an incompressible, isothermal compressible, and fully compressible flow. The investigation commenced with simulations utilizing an incompressible flow solver, subsequently extending to the two compressible flow solvers. In the compressible flow, there is a close interrelation between density, pressure, and temperature, which significantly influences cavitation dynamics. To verify computational methods, verification tests were conducted for leading-edge cavitating flows over a two-dimensional (2D)-modified NACA66 hydrofoil section at various cavitation numbers. The computational results were validated against the experimental data, with the solvers’ capability to predict cavitation forming the basis for comparison. The results demonstrate consistent predictions among the solvers; however, the fully compressible flow solver demonstrated a superior performance in capturing re-entrant jets and accurately modeling cavity closure regions. Furthermore, the fully compressible flow solver precisely estimated propeller hydrodynamic performance, yielding results closely aligned with experimental observations.

1. Introduction

Cavitation has numerous detrimental effects on marine propellers. These effects range from propeller performance degradation to erosion, vibration, and noise emission. The abrupt phase changes coupled with heat transfer, large pressure fluctuations and pressure peaks with time are the major characteristics of cavitation. As a result, large density fluctuations are induced for both the liquid and vapor densities in the flow fields. Marine propellers are prone to different types of cavitation such as tip vortex, hub vortex, leading edge sheet and mid-chord transient bubble streak cavitation. Thrust breakdown is caused by blade surface cavitation such as leading-edge cavitation and the mid-chord transient cavitation.
In the fluid flow, computational fluid dynamics (CFD) plays a vital role in complementing, and in some instances being a substitute for, physical experiments. The simulations of a multiphase fluid flow pose significant computational challenges and have consequently garnered considerable attention. In most cases, CFD packages (both commercial and open-source solvers) have been based for incompressible flow solvers, especially for cavitating flows. These solvers encounter a set of difficulties when applied to compressible cavitating flows, reminiscent of challenges associated with flows at low Mach numbers. These challenges include slower convergence, lower accuracy, stabilities, and other physical problems inherent to compressible characteristics [1].
Numerical modeling and simulation using CFD normally depends on the turbulence and cavitation models that have been used. To model most flows, especially considering that they are turbulent in nature, CFD uses different approaches such as Direct Numerical Simulation (DNS), Large Eddy Simulation (LES), Direct Eddy Simulations (DESs), and Reynold Averaged Navier–Stokes (RANS). The RANS model is the most widely preferred and used approach for most CFD applications since it is computationally economical. LES has been used for the prediction of cavitation and related flows in respective bodies [2,3,4,5]. Bensow [6] conducted a simulation on Delft Twist11 foil using LES, DES, and RANS models, demonstrating the capabilities of LES and DES to capture details of the cavitation dynamic behavior, especially the shedding frequency. LES and DES demonstrate superiority in the scale for resolving approaches; however, compared to RANS, they have disadvantages when it comes to computational capacity requirements [7]. Wang [8] noted that RANS is insufficient for capturing shedding on hydrofoil.
Numerical methods have successfully been used in the assessment of propeller hydrodynamic performance, which includes cavitation using CFD [9,10]. Gaggero et al. [11] investigated the prediction of tip vortex inception, while Yilmaz et al. [12] used an improved mesh adaptation and refinement approach to carry out cavitation simulations. Viitanen et al. [13] investigated propeller cavitation on model and full-scale marine propellers and in a more realistic propeller setup. Additionally, propeller performance in the presence of cavitation on oblique flows has been investigated, with a PPTC propeller being popular in this set up [14,15]. Vaz et al. [16] conducted an extensive study on marine propellers, especially behind a wake using RANS and RANS-BEMS (Boundary Element Methods) coupled approaches.
Open-source CFD tools have gained more attention and are becoming widely used in the numerical simulation of cavitation. Park et al. [17] studied an unsteady sheet cavity on three-dimensional twisted foil. Gaggero and Villa [18] used OpenFOAM to study the steady cavitation of a cavitating propeller. Park et al. [10] successfully used OpenFOAM for propeller cavitation and erosion prediction.
The compressibility effects on a cavitation flow have been addressed in previous research [1,19,20,21]. Wang et al. [1,19] concluded that a compressible approach predicted the cavity evolution and cavity frequency much better since a re-entrant jet using compressible approach was more accurate than that of the incompressible approach. Madabhushi and Mahesh [20] proposed a compressible multi-scale model that captured dynamics of both large vapor cavities and micro-bubbles and accounts for medium compressibility. Park and Rhee [21] studied the compressible effects on vapor phase and cavity interphase using pressure based isothermal compressible flow. The cavity shedding behavior, length of re-entrant jet, drag history, and Strouhal number were compared between the two solvers.
Numerous cavitation solvers have been developed and utilized; however, there has not been much research that compares them. The current research presents and compares the simulation results of propeller cavitation under incompressible, isothermal compressible, and fully compressible flow solvers. The two-dimensional (2D) modified NACA66 hydrofoil has been used for validation, and the results were compared with experimental data. The benchmark propeller INSEAN E779A has been utilized for marine propeller cavitation in this study, and three solvers were employed: incompressible flow solver, isothermal compressible flow solver, and fully compressible flow solver. A simulation was carried out first using an incompressible flow solver, which is a widely used numerical method to model cavitation, and then extended to an isothermal compressible flow and fully compressible flow solvers. The objective of this research was to study the cavitating flow characteristics around a marine propeller and assess the performance of each flow solver. For simulations of cavitating flow, the open-source CFD platform, OpenFOAM, was used [20,21,22,23]. OpenFOAM basic applications and interPhaseChangeFoam were used for the incompressible flow, and compressibleInterFoam were used for the isothermal compressible flow and fully compressible flow.

2. Computational Methods

Governing Equations

The governing continuity, momentum, and energy equations are:
( ρ U ) t + · ( ρ U U ) = p + · τ + S
( ρ e ) t + · ( ρ U e ) + ( ρ K ) t + · ( ρ U K ) = · q · ( p U )
where ρ is the density, U is the velocity vector, τ is the turbulence tensor stress, S is the source terms, K is the kinetic energy ( K = 0.5 | U | 2 ), q is the heat flux density, and e is the internal energy. The governing equations are closed by thermodynamic closure relations using a temperature-dependent equation of state for both liquids and vapor, where the compressibility effects of both water and vapor are considered [1].
The cavitation on the propeller blade was modeled using the Schnerr–Sauer cavitation model [24] and the volume of fluid (VOF) method [25] was used in describing the multiphase flow. The cavitation model is based on the reduced Rayleigh–Plesset equation and neglects the impact of bubble growth acceleration, viscous effects, and surface tension. The transport equation for the volume fraction is represented as follows:
α t + · ( α U ) = m ˙ ρ v
Here, α is the volume fraction and m   ˙ is the interphase mass transfer. The mass transfer equation between the phases is a function of the saturation pressure ( p s a t ). The interphase mass transfer is decomposed based on liquid mass growth due to vapor condensation and liquid evaporation as in Equation (4).
m ˙ = { C C ρ v ρ l ρ α ( 1 α ) 3 R B 2 3 p p s a t ρ l   ,       p > p s a t C V ρ v ρ l ρ α ( 1 α ) 3 R B 2 3 p p s a t ρ l ,         p < p s a t
where C C and C V are the condensation and evaporation coefficients, respectively. The subscripts v and l indicate the vapor and liquid phases, respectively. The values applied to the coefficients are C v   = 0.001 and C c = 0.001 . The model’s bubble radius is represented as follows:
R B = 3 ( 1 + α N u c α ) 4 π n 0 α 3
The nucleation fraction ( α N u c ) is obtained from α N u c = V N u c / ( 1 + V N u c ) and the nucleation volume ( V N u c ) is calculated as V N u c = π n 0 d N u c 3 / 6 . The input parameters for the model are the nucleus density n 0 = 1.6 × 10 9 and the initial nucleus diameter d N u c = 2.0 × 10 8     [23].
For an incompressible flow, the computations were carried out using the second-order Crank Nicolson scheme, while for the compressible flows, they were carried out using the implicit Euler scheme to perform the coupling between pressure and velocity. In order to close the RANS governing equations, the present simulation utilized the S S T   k ω turbulence model [26].

3. Problem Description and Numerical Conditions

The 2D cavitation used a modified NACA66 hydrofoil [27] as a geometric model with a chord length ( C ), while the angle of attack (AOA) was 4 ° . The cavitation numbers selected were 0.84, 0.91, 1.0, and 1.76. Then, 1.76 was represented as non-cavitating since no cavitation was observed [27]. The solution domain extended 3.5 x / C 6 and 1.5 y / C 1.5 as shown in Figure 1. The freestream velocity ( U ) was set as 2.01 m/s.
The mesh around a hydrofoil, as shown in Figure 1b, was refined using three levels of refinement with layers around the hydrofoil. The grid size was around 62,162 cells, which required a time step of around 0.0001 s to maintain a sufficiently low courant number.
The marine propeller used in this study is the well-studied INSEAN E779A model propeller by INSEAN, the Italian Ship Model Basin, Rome Italy. Detailed experimental test data for this propeller are readily accessible [28]. The INSEAN E779A propeller key parameters are summarized in Table 1.
The computation domain and the boundary conditions are shown in Figure 2. The inflow around the propeller is inherently periodical, allowing for the simulation of a single propeller blade through the utilization of periodic interface boundary conditions. The domain, as shown in Figure 2, illustrates the simulation domain setup of one propeller blade. The dimensions of the computational domain extend 3D toward the inlet boundary and 4.5D toward the outlet boundary from the center of the propeller. In the radial direction, perpendicular to the inflow, the domain spans 3D from the propeller center, with D representing the propeller’s diameter.
During the simulation, the accuracy of the results was dependent on the boundary conditions and the mesh resolution. The inlet boundary with Dirichlet condition applied to the velocity and Neumann condition applied to the pressure. A pressure condition was implemented at the outlet boundary. The no-slip boundary condition was applied to the propeller blade for the velocity, and fixedFluxPressure was applied for the pressure boundary condition. Additionally at the sides, the periodic boundary conditions were applied for both the velocity and pressure. Domain set-up and boundary conditions are illustrated in Figure 2. The corresponding value of the cavitation number ( σ = ( p r e f p s a t ) / 0.5 ρ U 2 ), where the outlet pressure was set as p o u t l e t = p r e f , determined the free stream pressure that was employed in the computation.
The simulation meshes for the propeller were created using OpenFOAM 10’s meshing utility, SnappyHexMesh [29]. Special attention was paid to the area around the propeller to provide a proper resolution. To cluster the cells, close to the propeller blade, four layers were used to control the y+ values of the propeller and hub, so that the coarse mesh had a y+ value around 1. The grids and mesh solution are shown in Figure 3.
Grid dependency tests were performed for the numerical verification of results using the grid resolution method. Three grids of increasing resolution were used as listed in Table 2. The grid dependency test simulations were carried out at J = 0.71 . The grid number increased by ( N i , N j , N k ) × 2 from the coarse grid to the medium grid and from the medium grid to the fine grid. The tests were carried out considering the propeller thrust coefficient.
The difference was based on the percentage difference between the experiment data [28] and simulated data. The difference between the coarse grid and medium grid showed an improvement in results with a finer grid. Therefore, when considering the computational resources, a medium grid was selected in the present simulations.

4. Results and Discussion

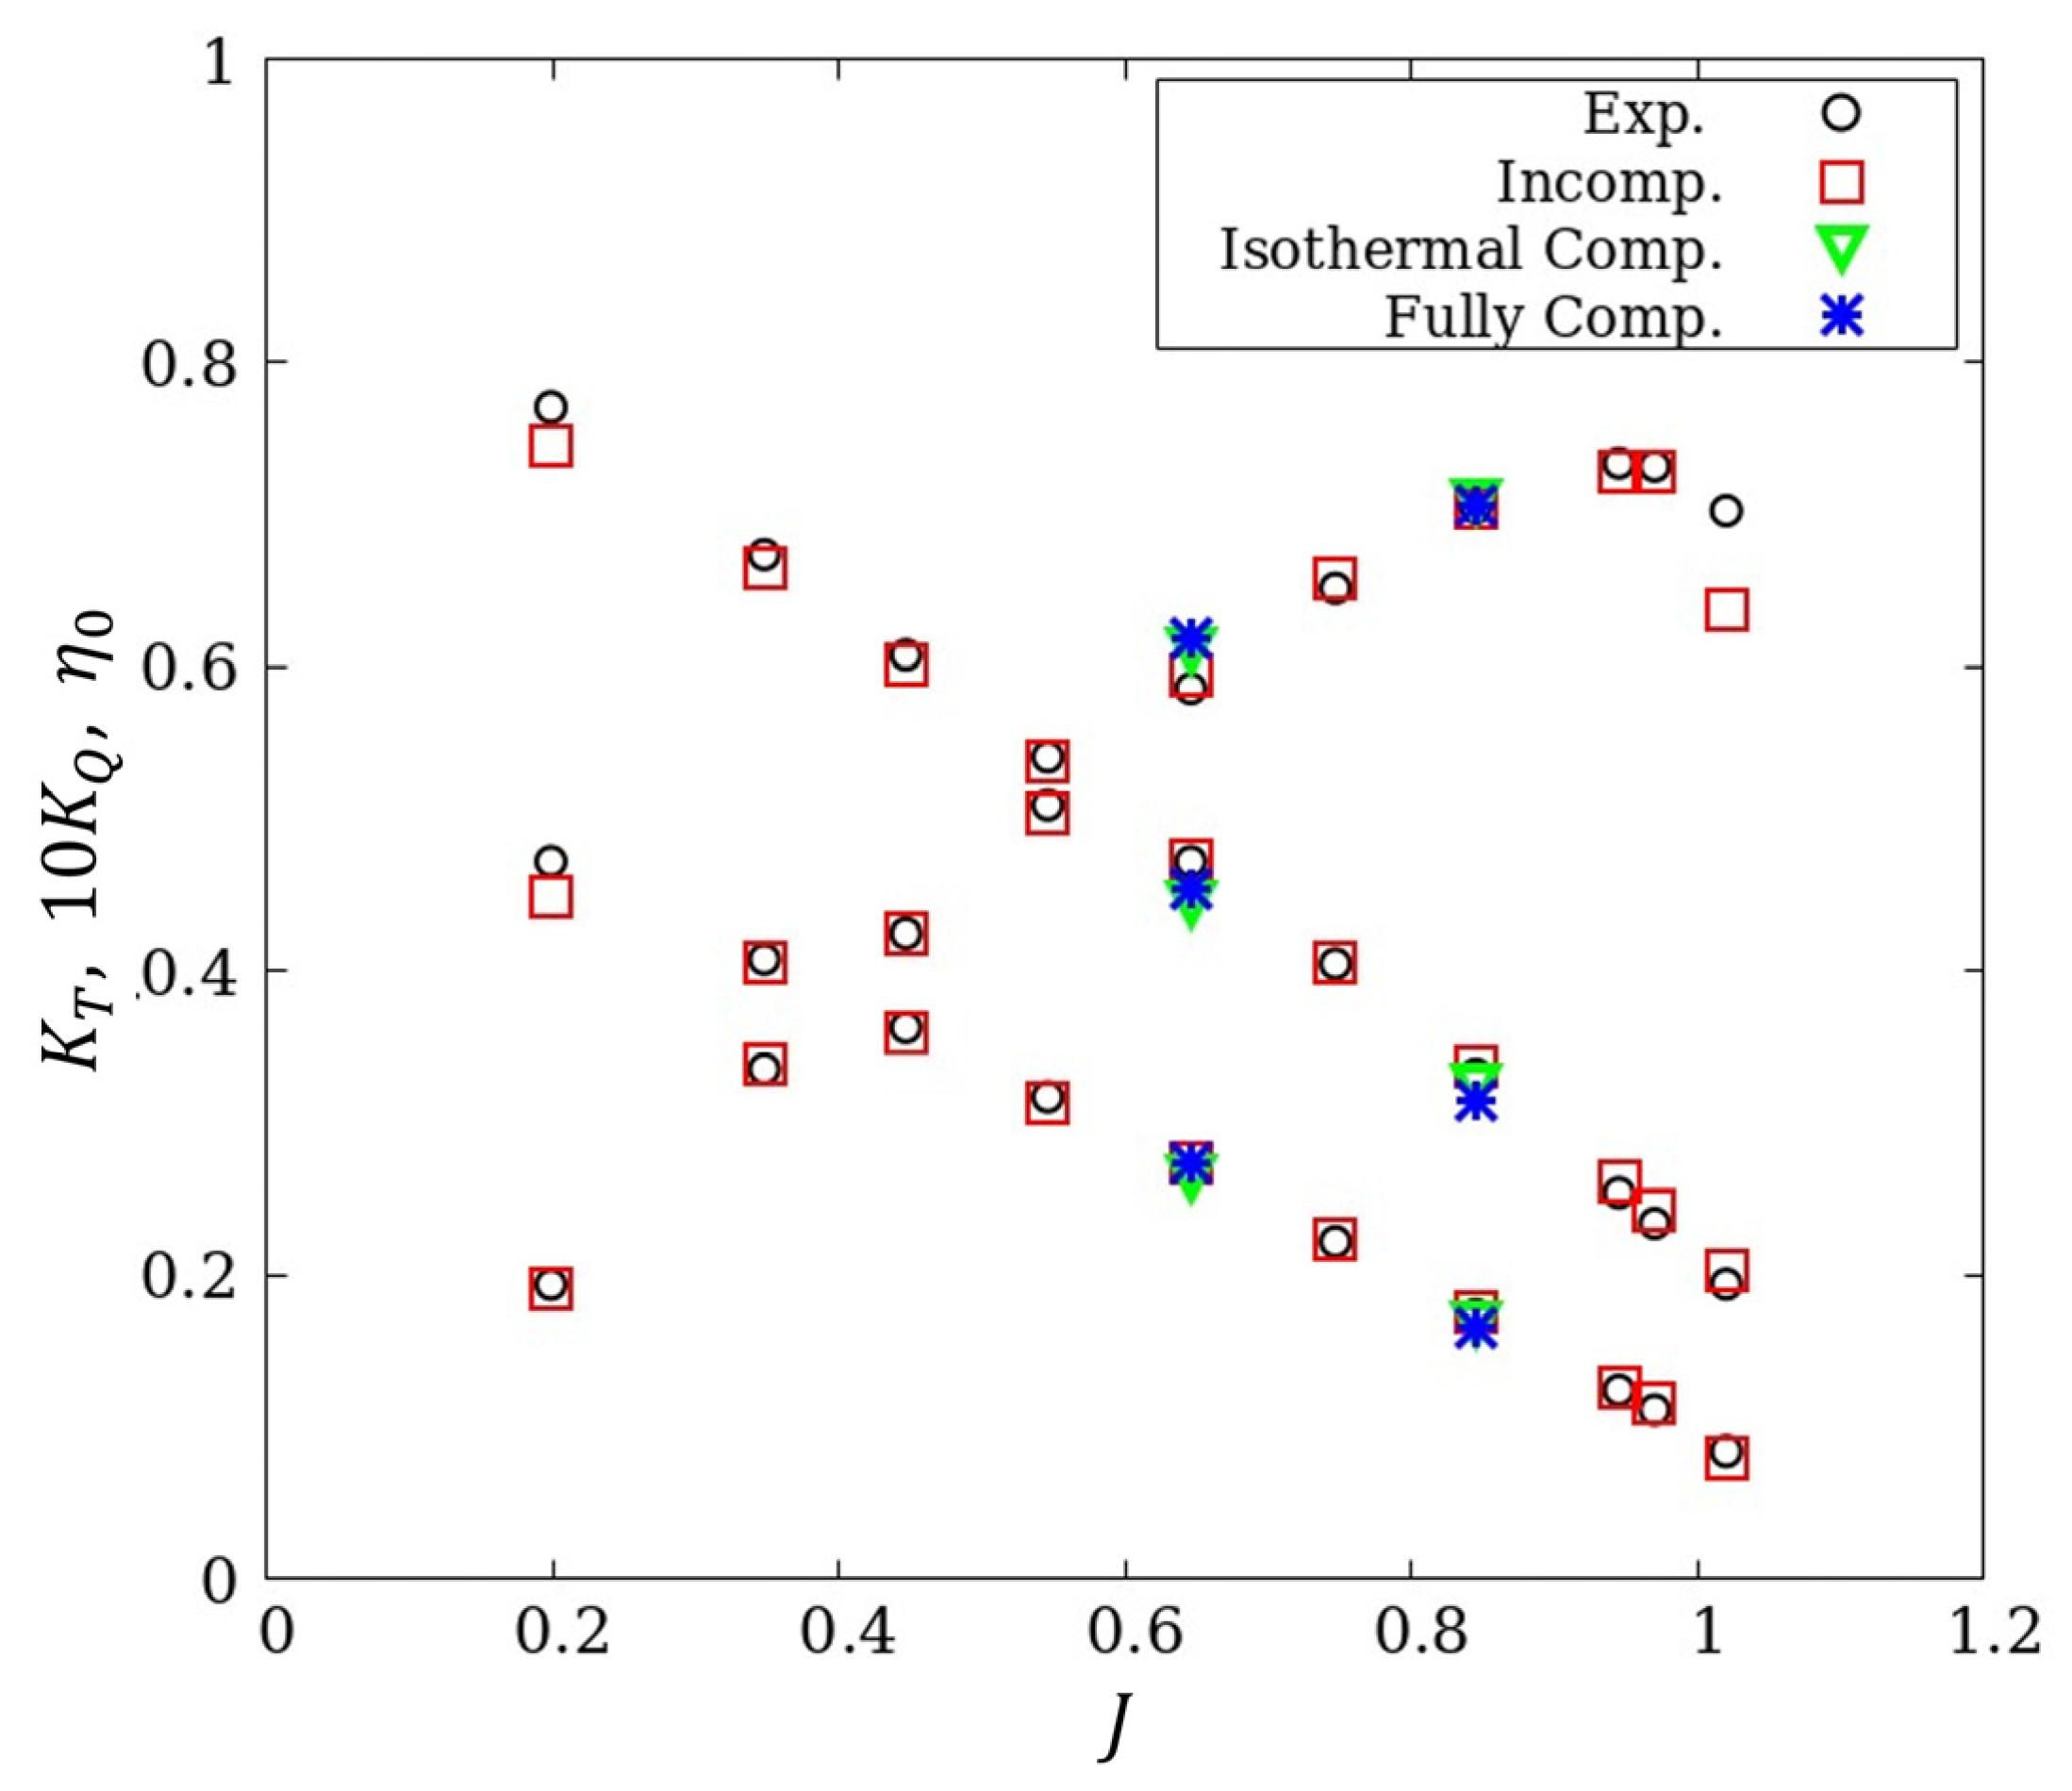
4.1. Non-Cavitating Flows

Since the propeller simulation for the cavitation utilizes a one-blade simulation setup, an open water simulation was conducted using incompressible, isothermal compressible, and fully compressible flow solvers. The propeller performance is defined by non-dimensional parameters, thrust coefficient ( K T ), torque coefficient ( K Q ), propeller efficiency ( η 0 ), and advance ratio ( J ).
K T = T ρ U 2 D 4  
  K Q = Q ρ U 2 D 5
η 0 = J 2 π K T K Q
    J = U n D
where T is the thrust, Q is the torque, η 0 is the overall efficiency, D is the propeller diameter, and n is the revolutions per second. The results obtained are depicted in Figure 4. The data are represented for values within the range of 0.099 J 1.02 . The computed values for the open water results were encouraging and the discrepancies compared to available experimental measurements [28] were within 5% for both the thrust and torque, except for higher values of the advance ratios, where the differences were underestimated by 6.9% for torque at J = 0.97. To test the compressible solvers for open water tests, two non-cavitating cases at J = 0.646 and J = 0.845 were simulated and the results show an agreement with experimental data as in Figure 4. Both the thrust and torque exhibit an impressive agreement with the experimental measurements. This demonstrated that a one-blade steady simulation can predict the open water performance of a propeller.

4.2. Cavitating Flows

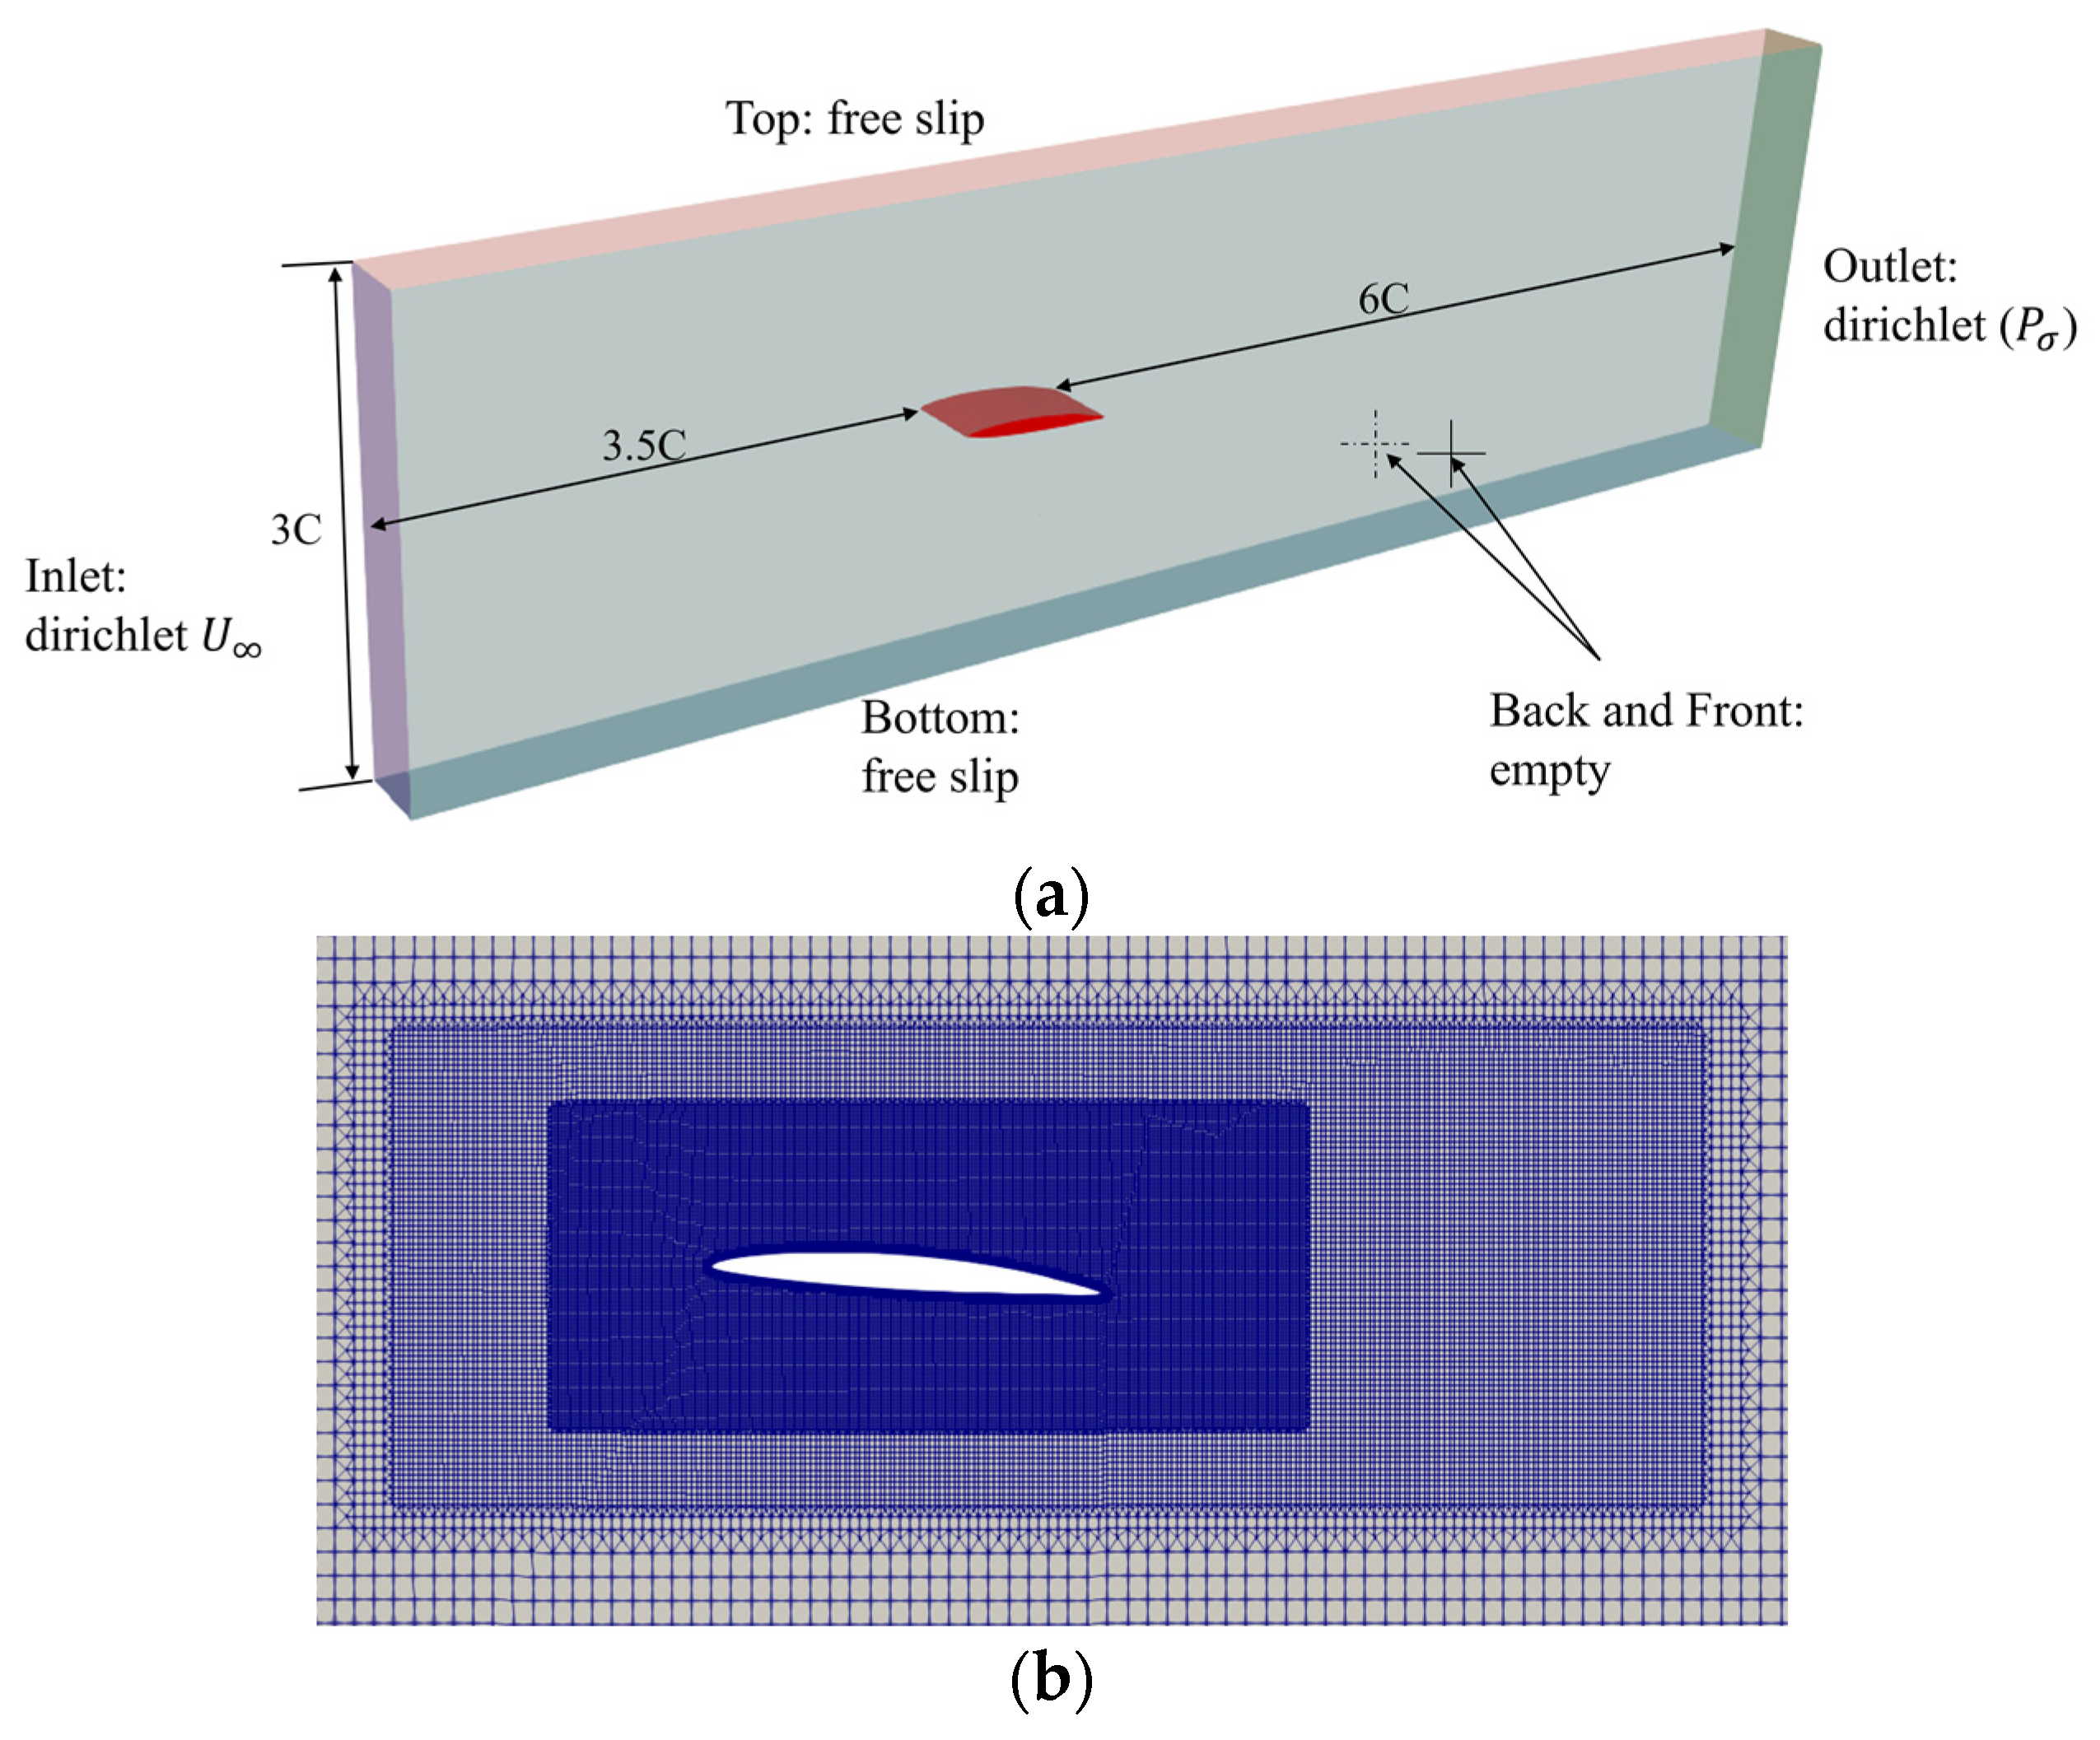
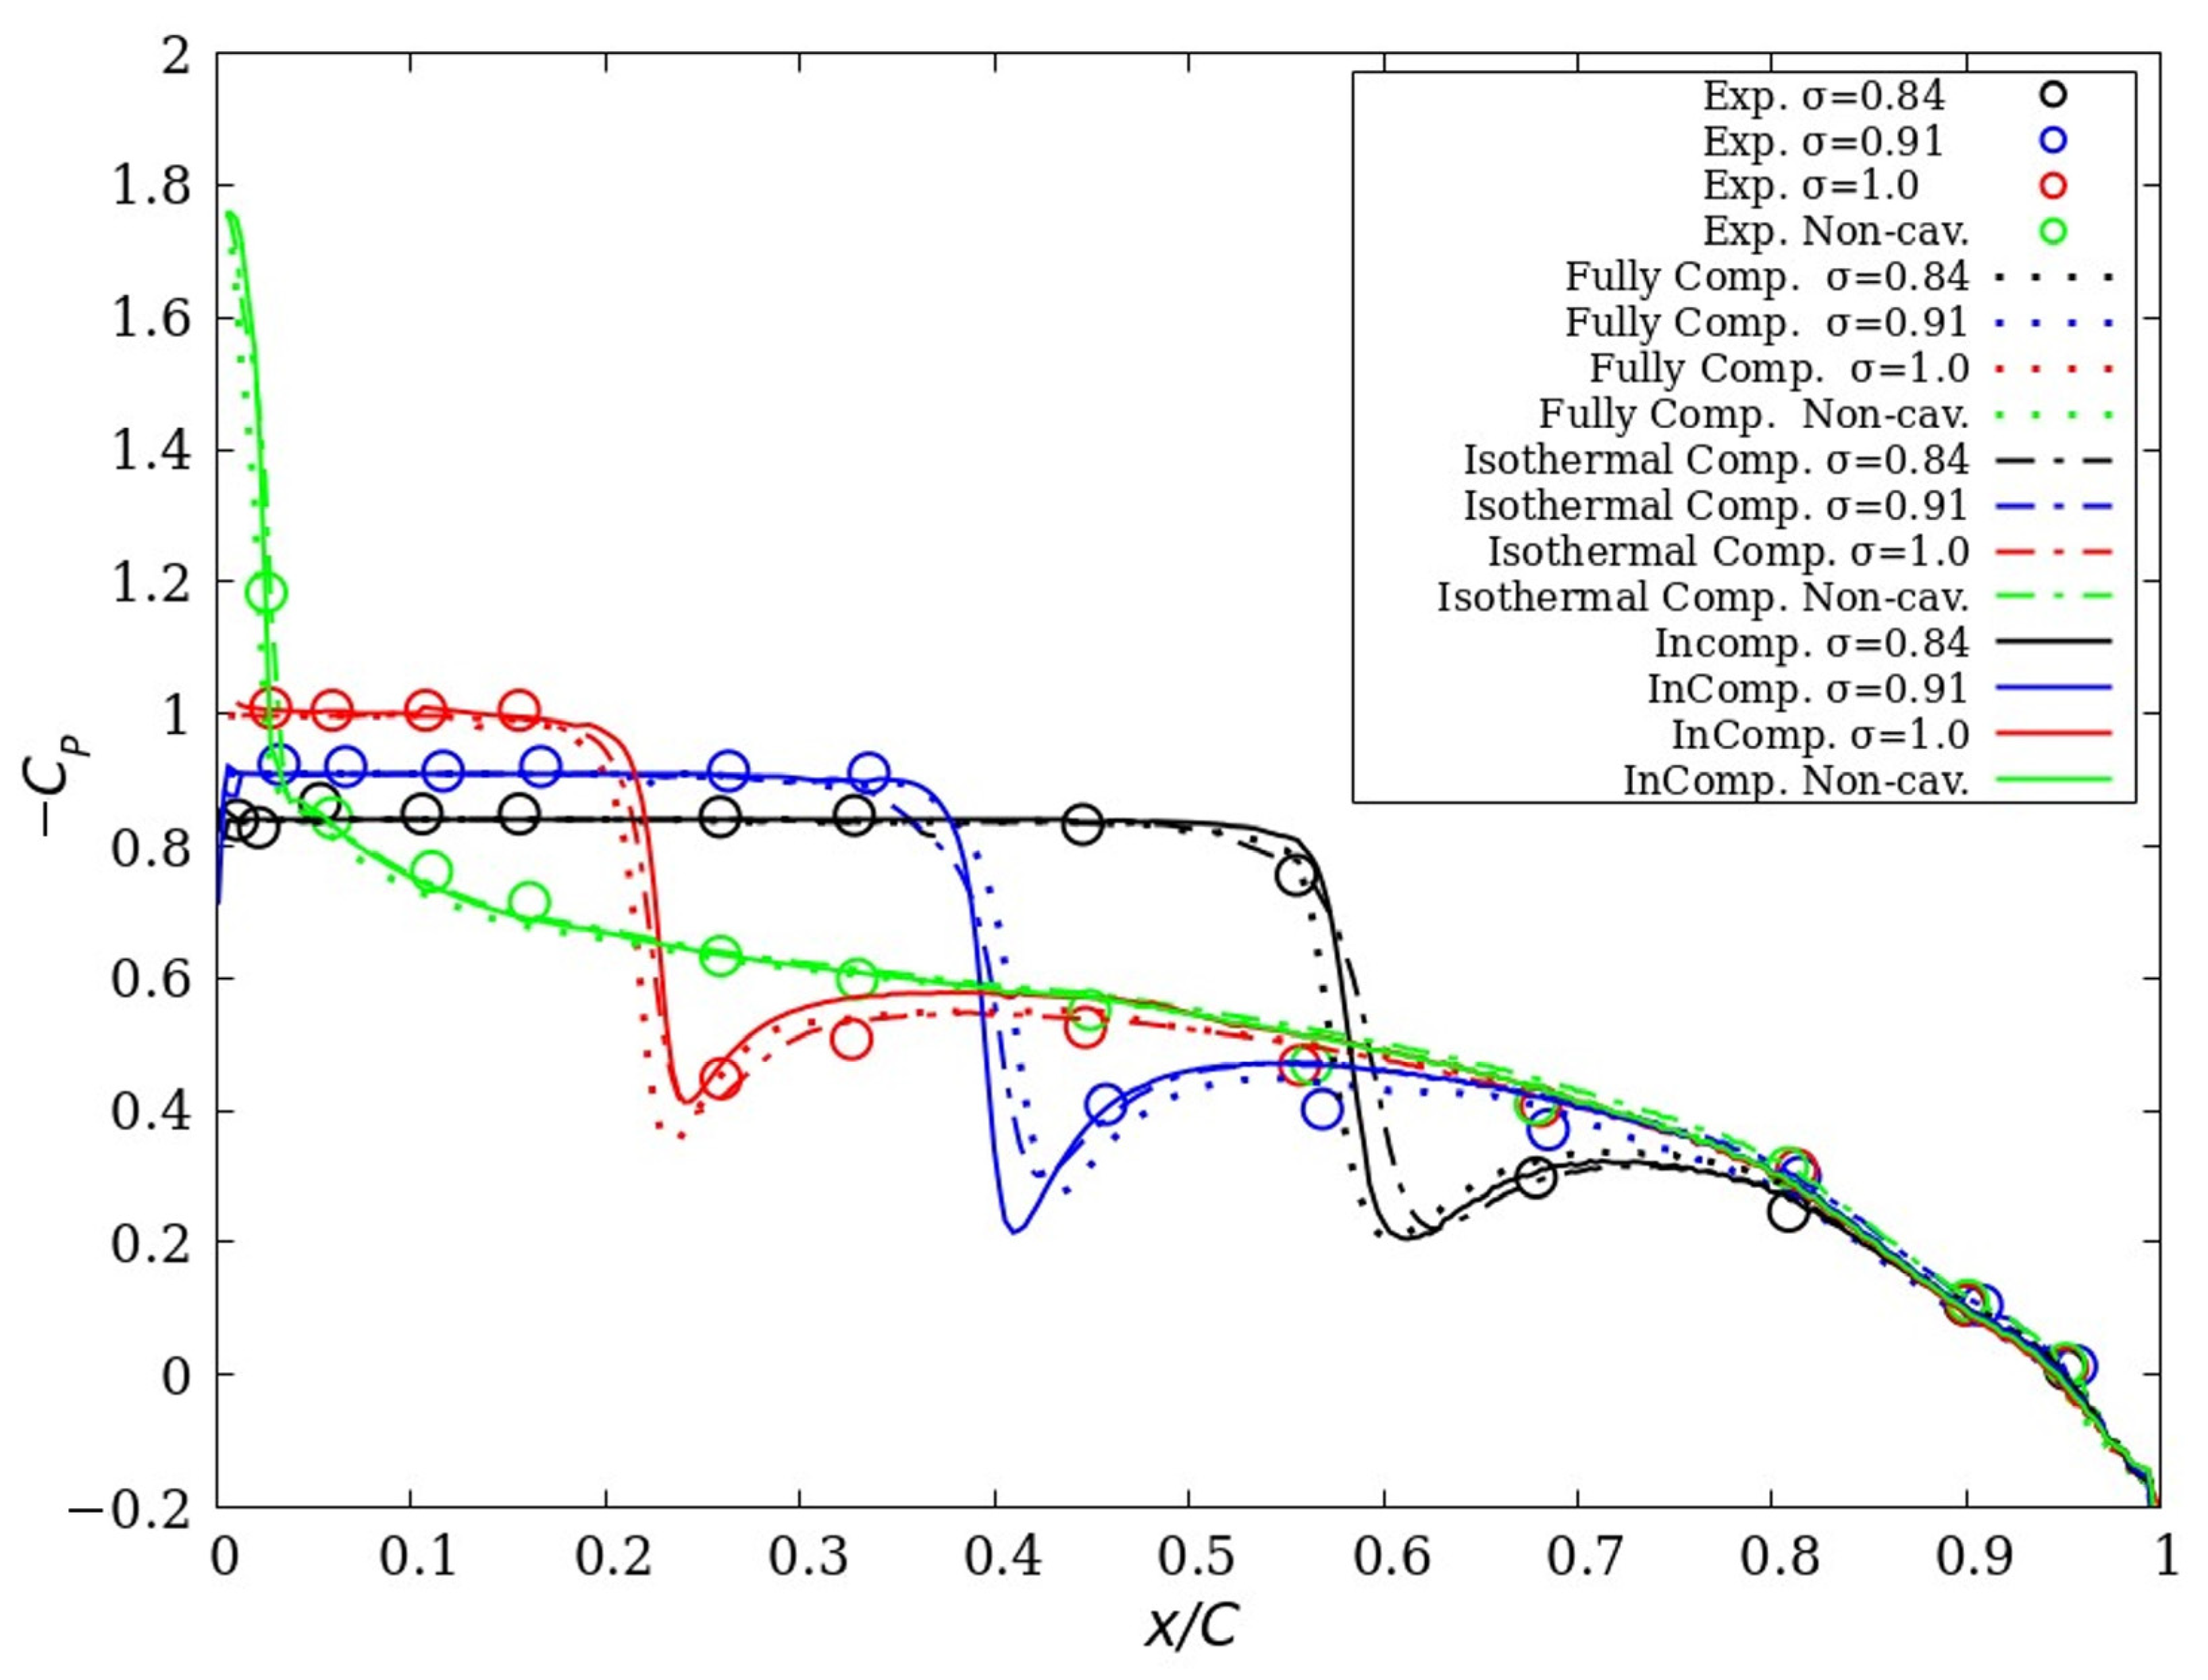
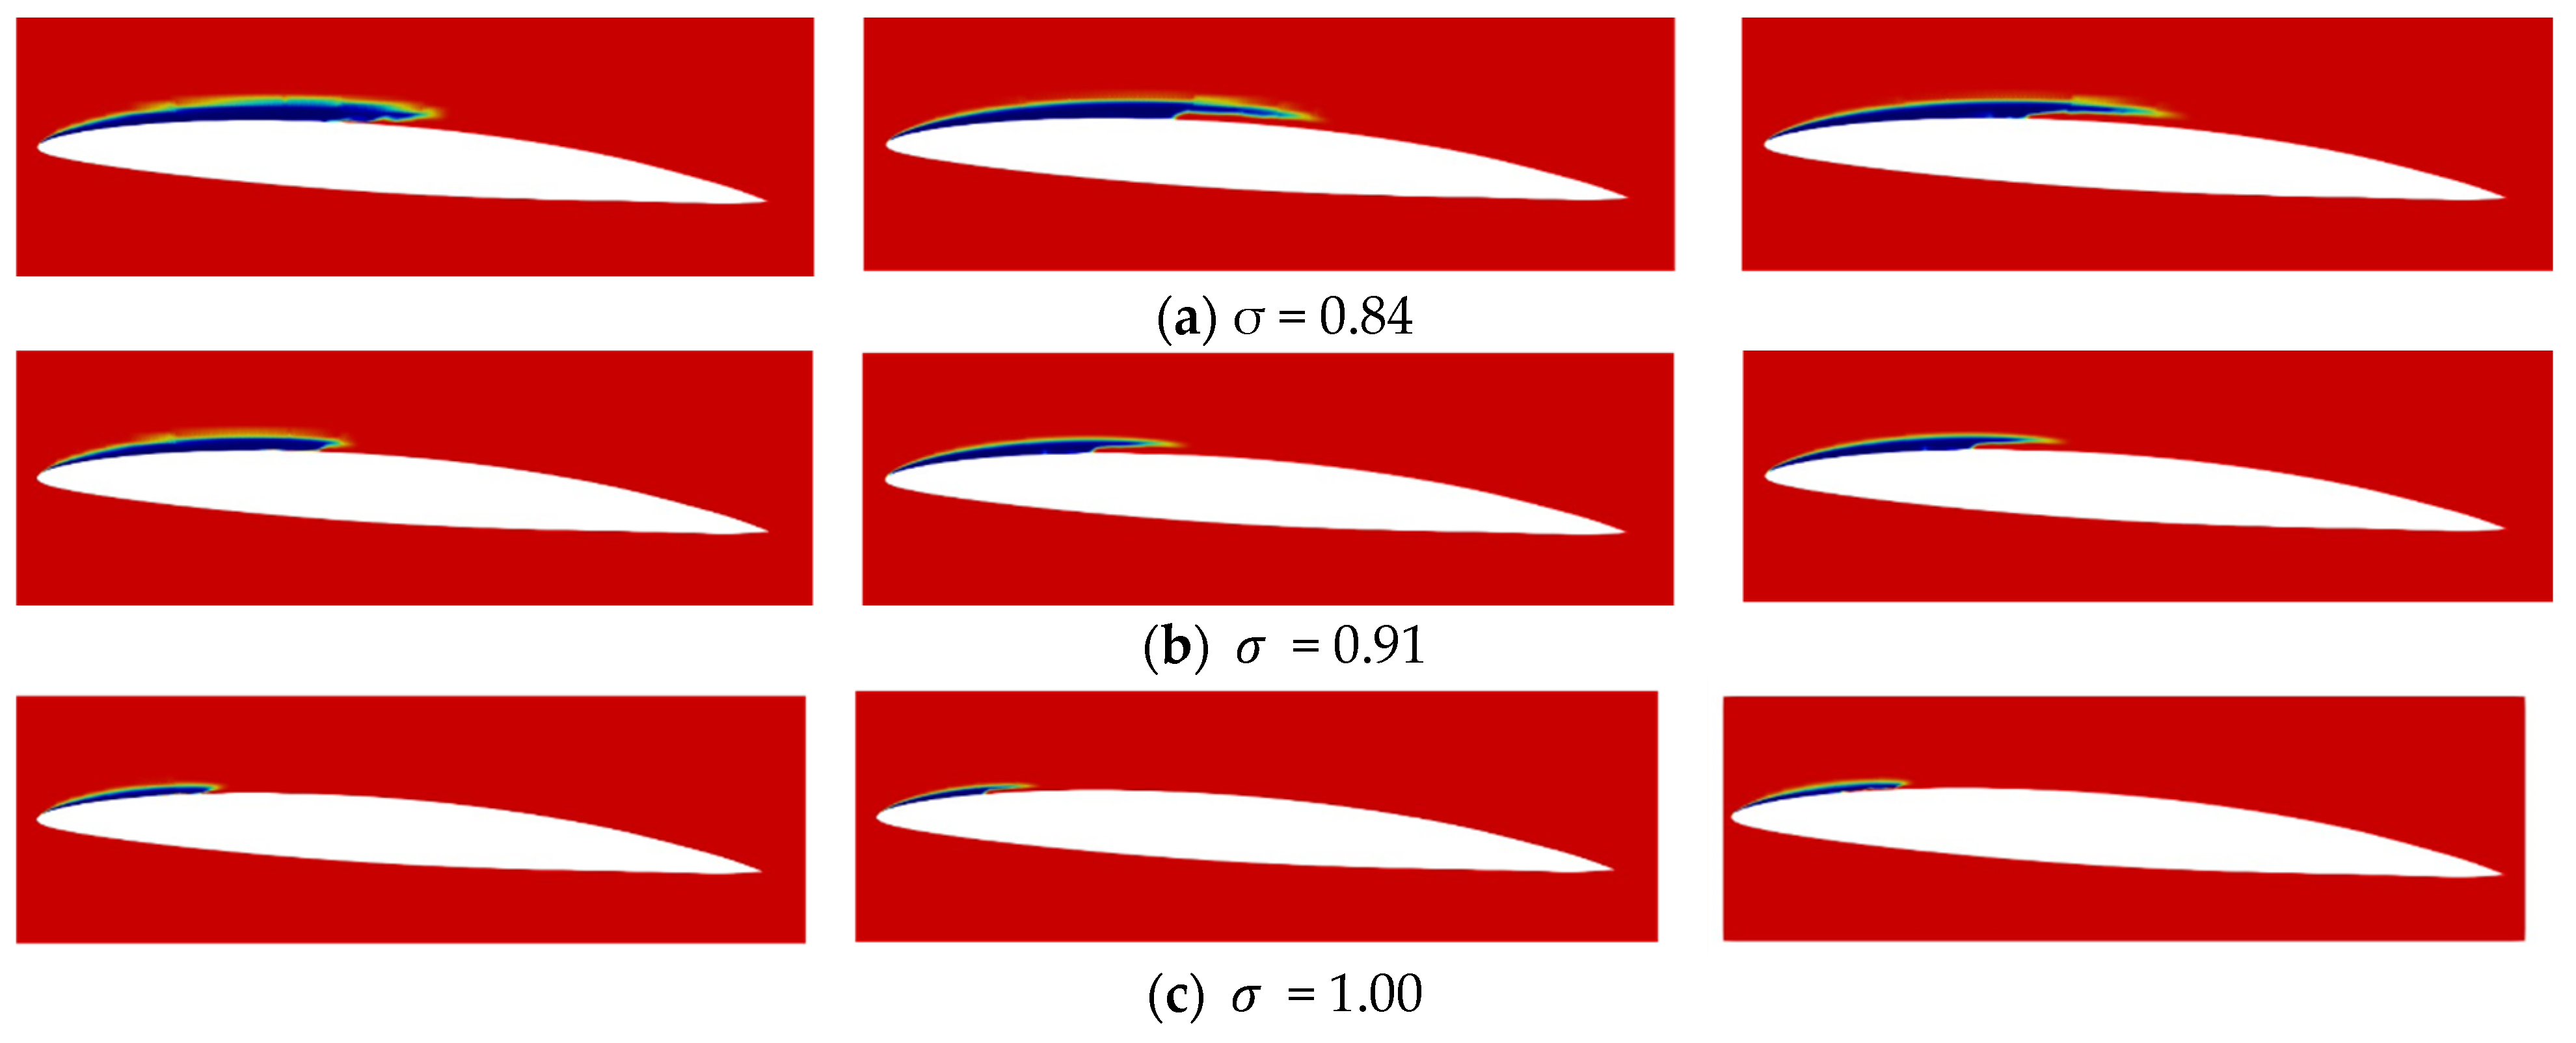
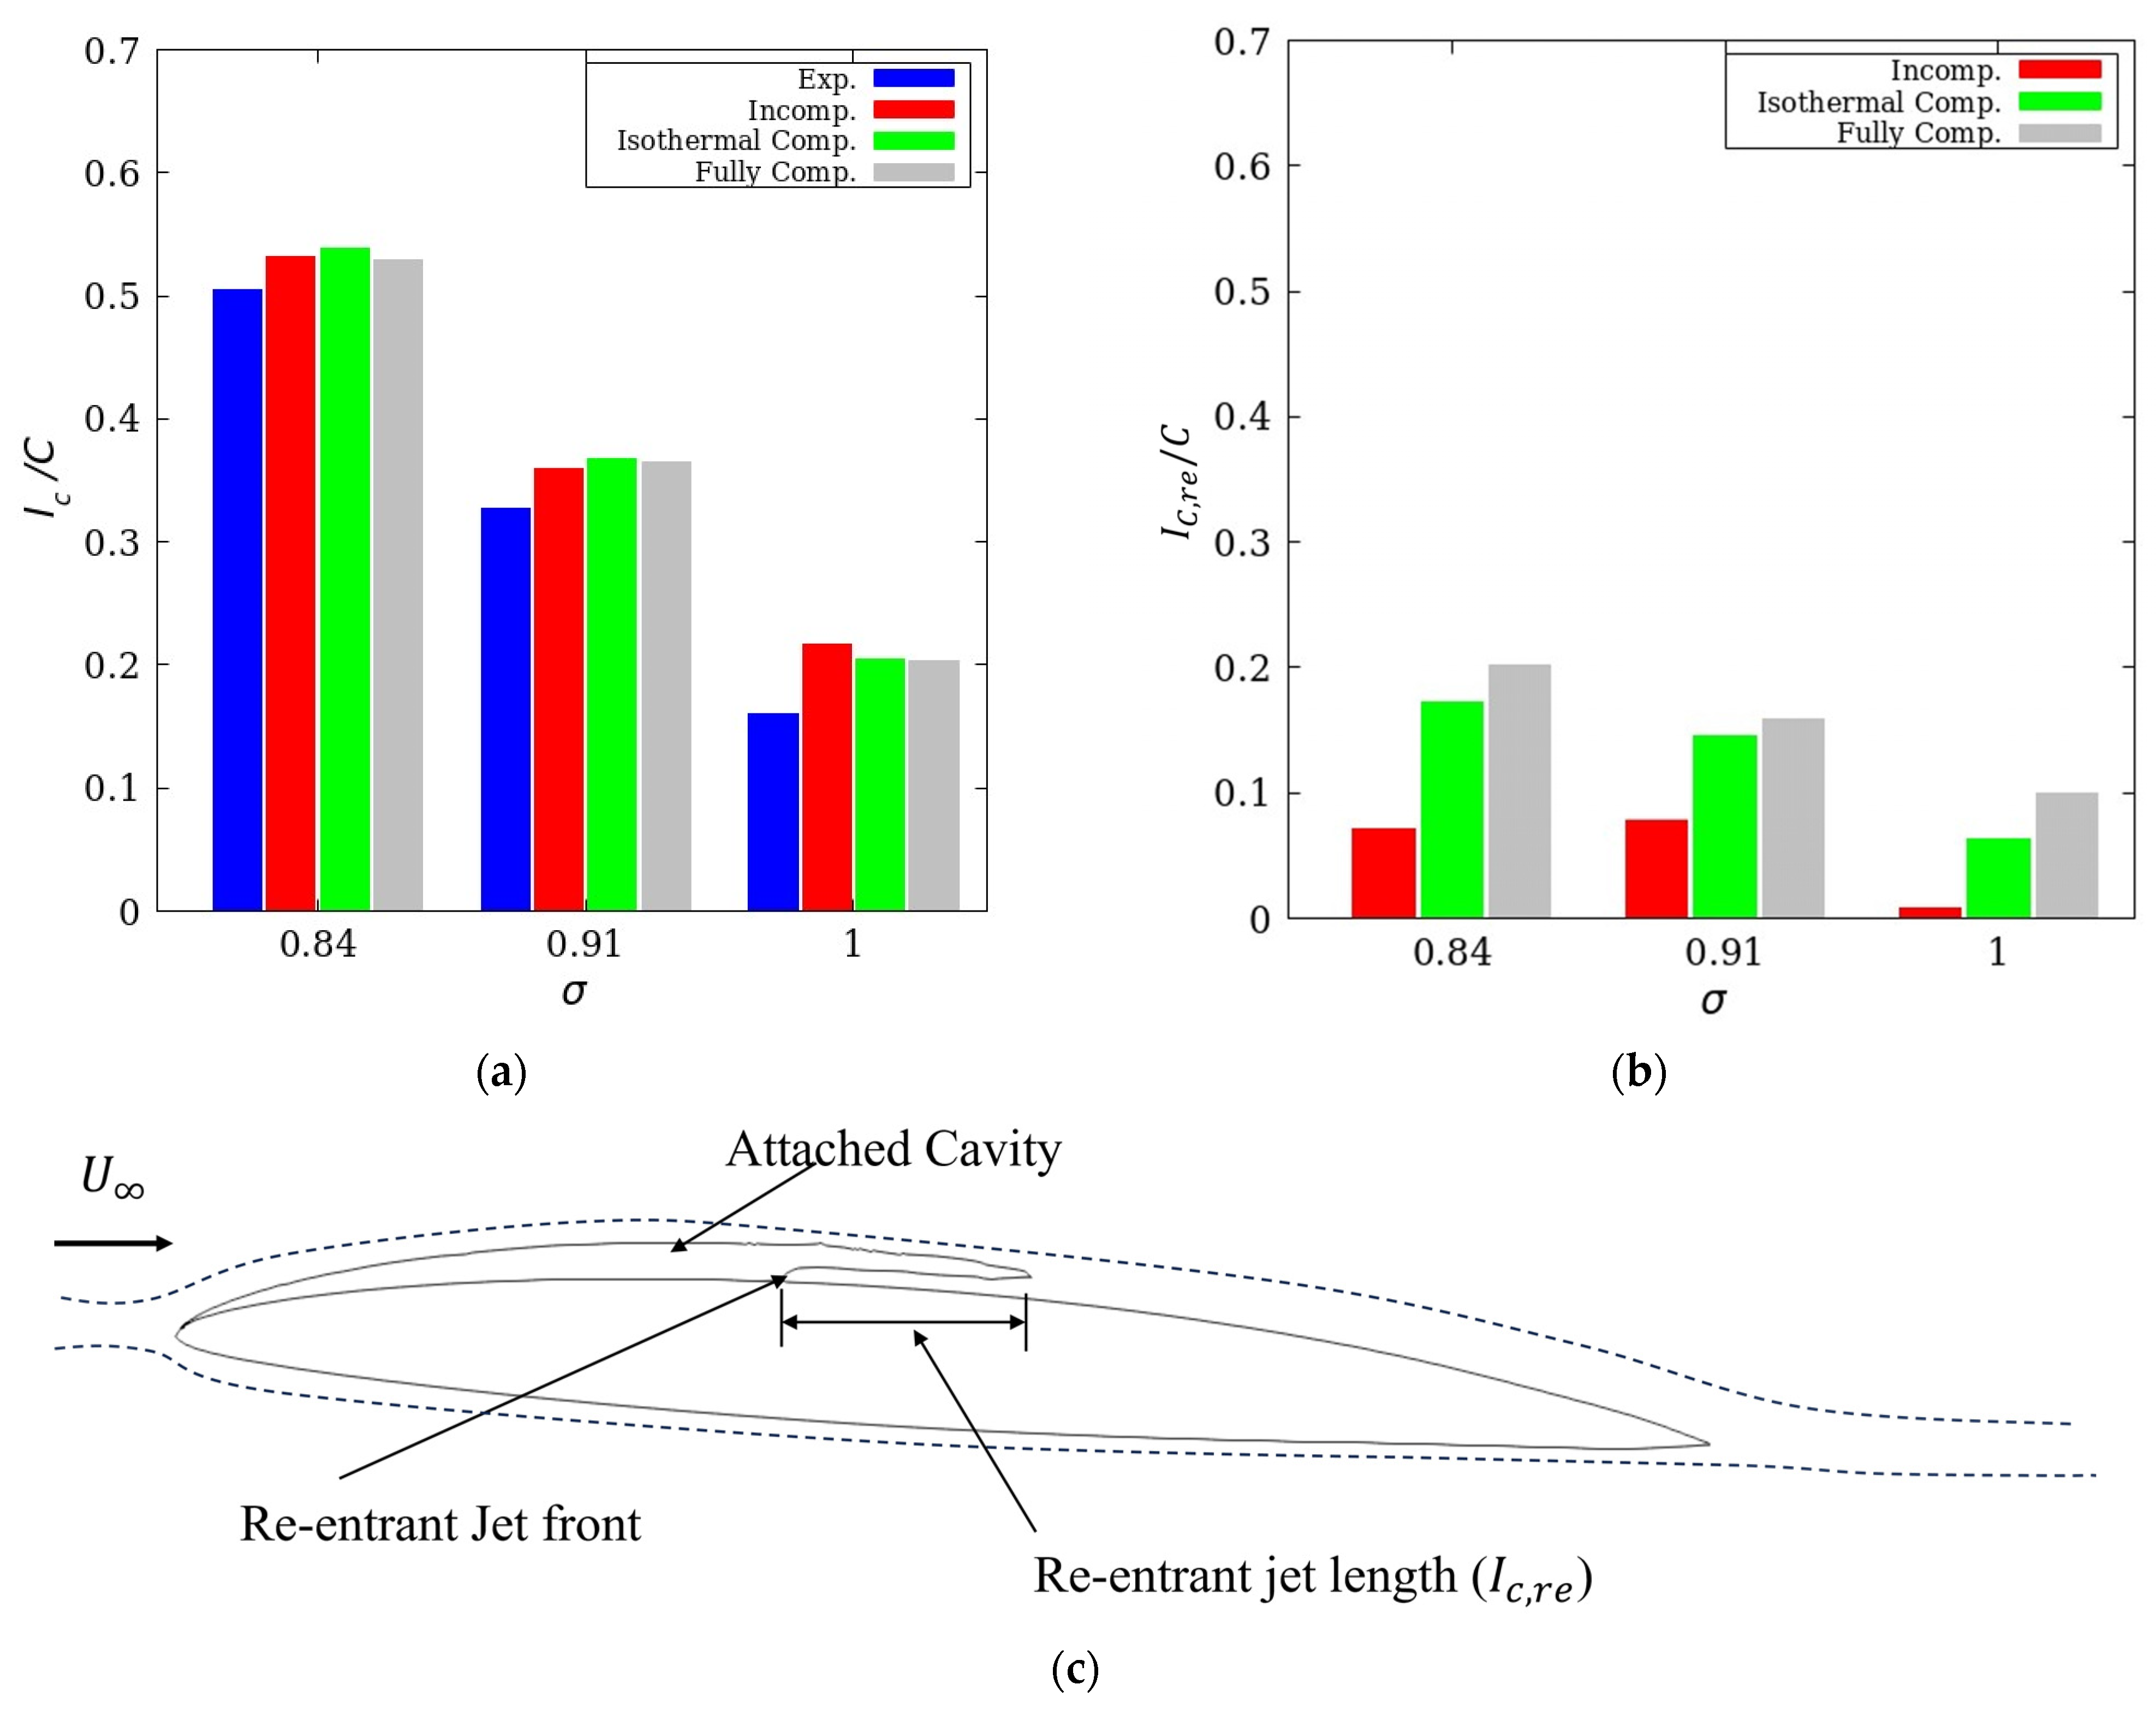
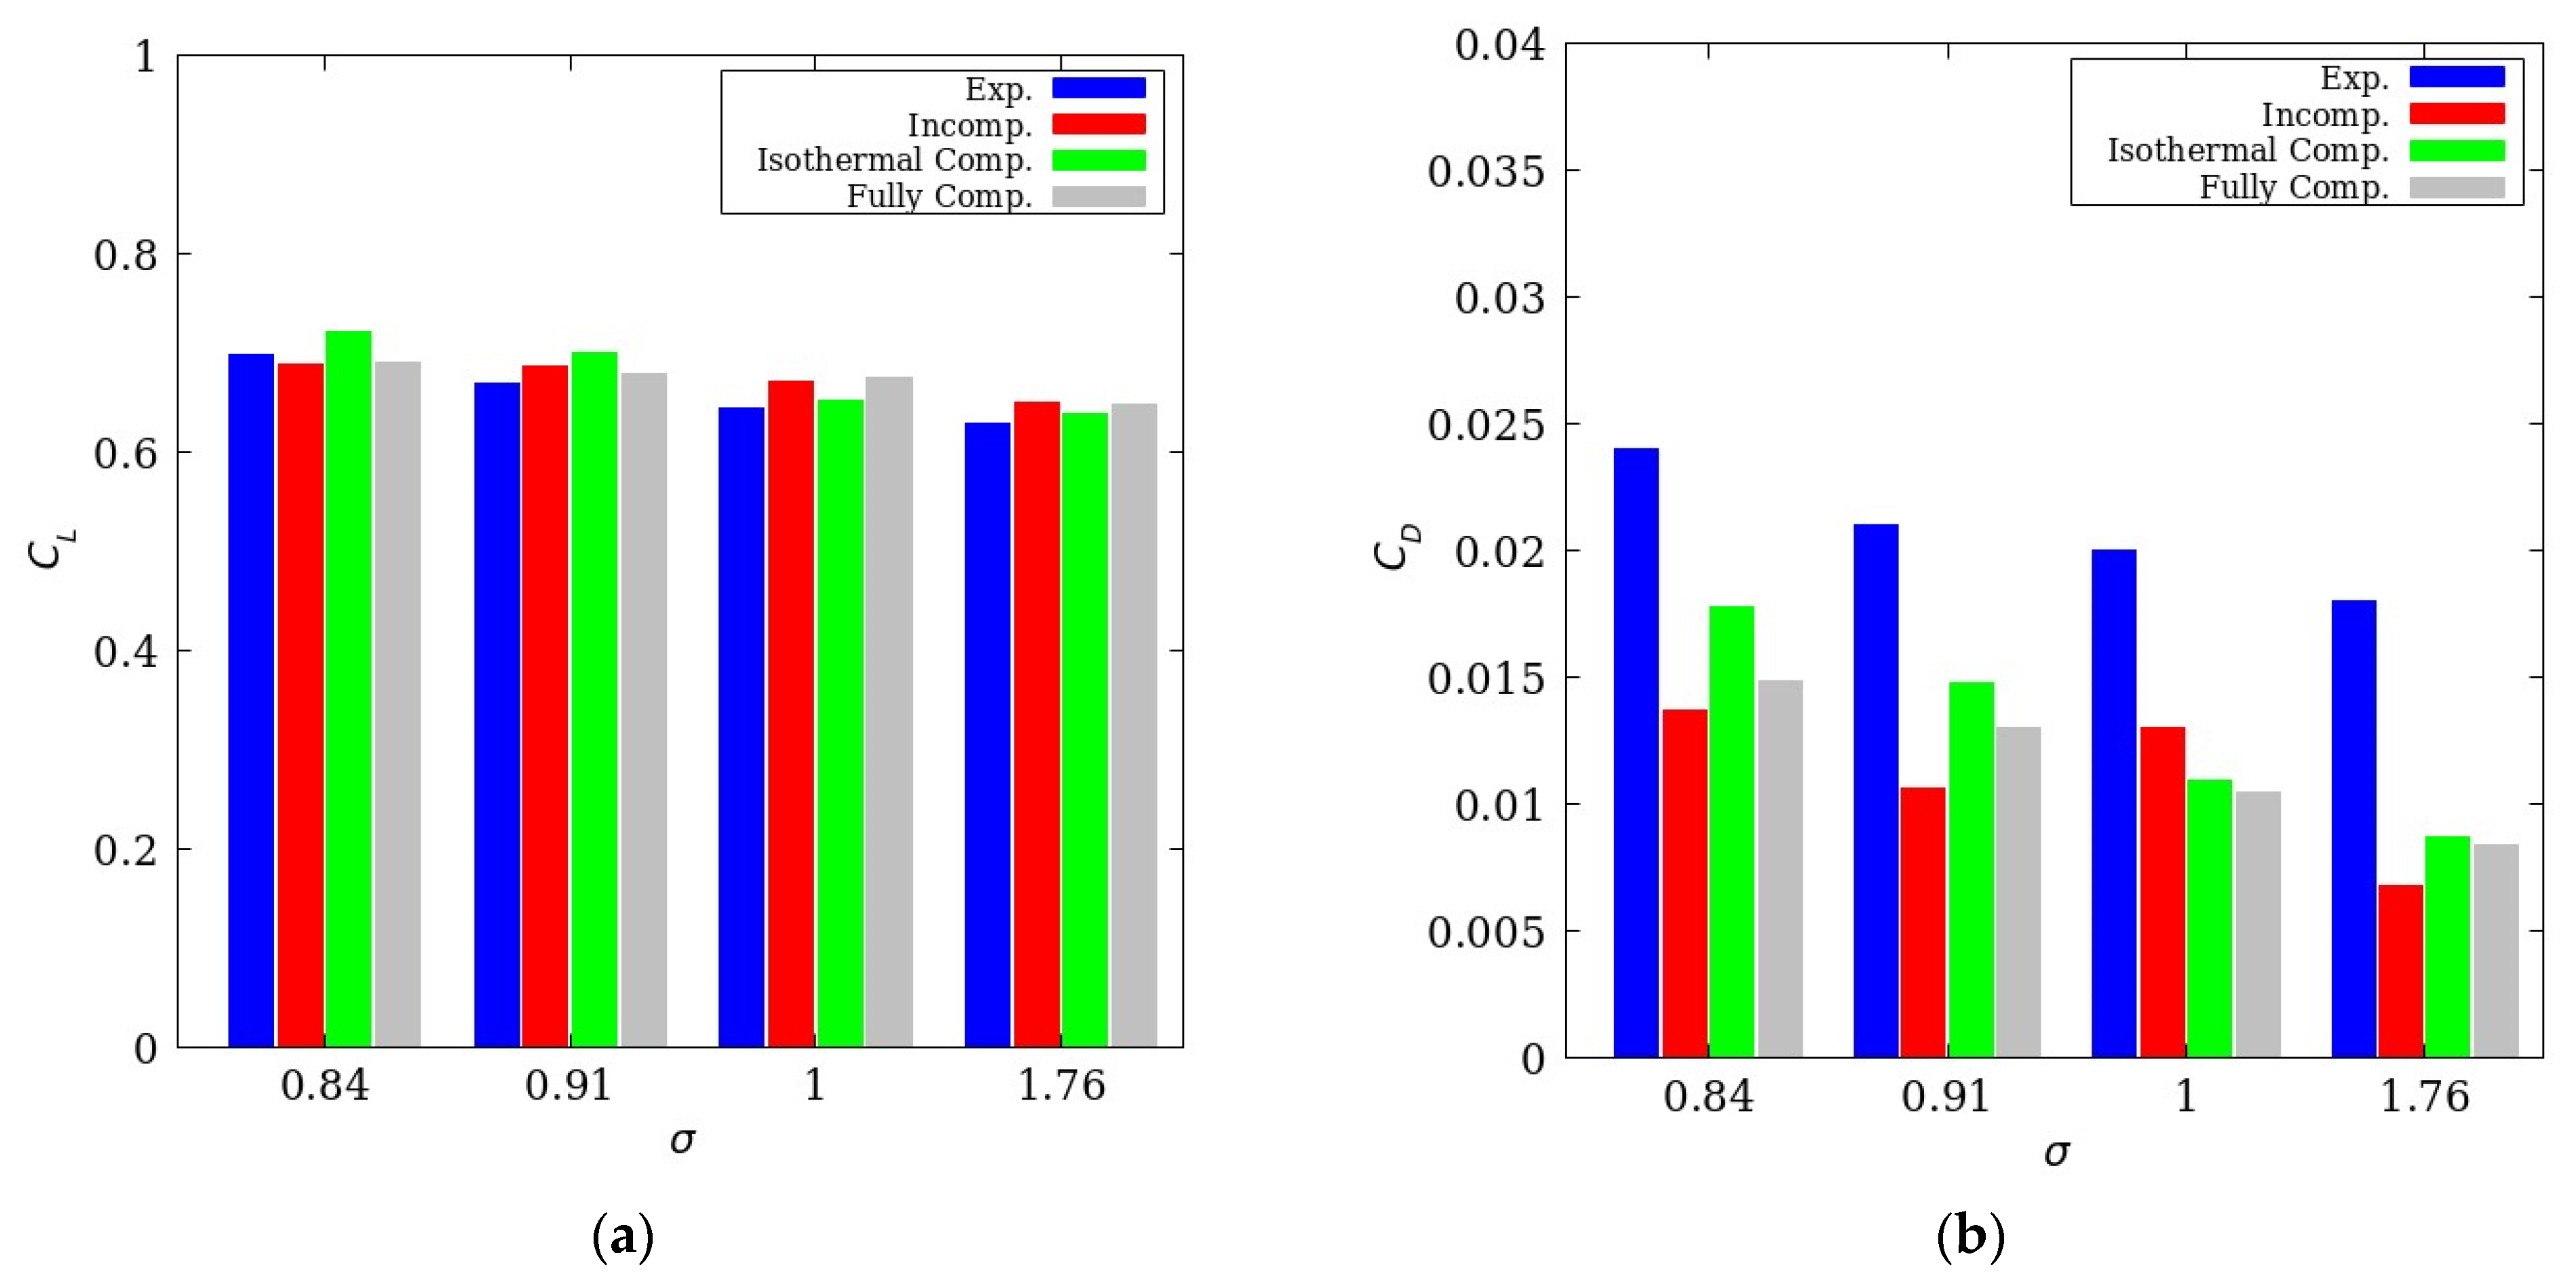
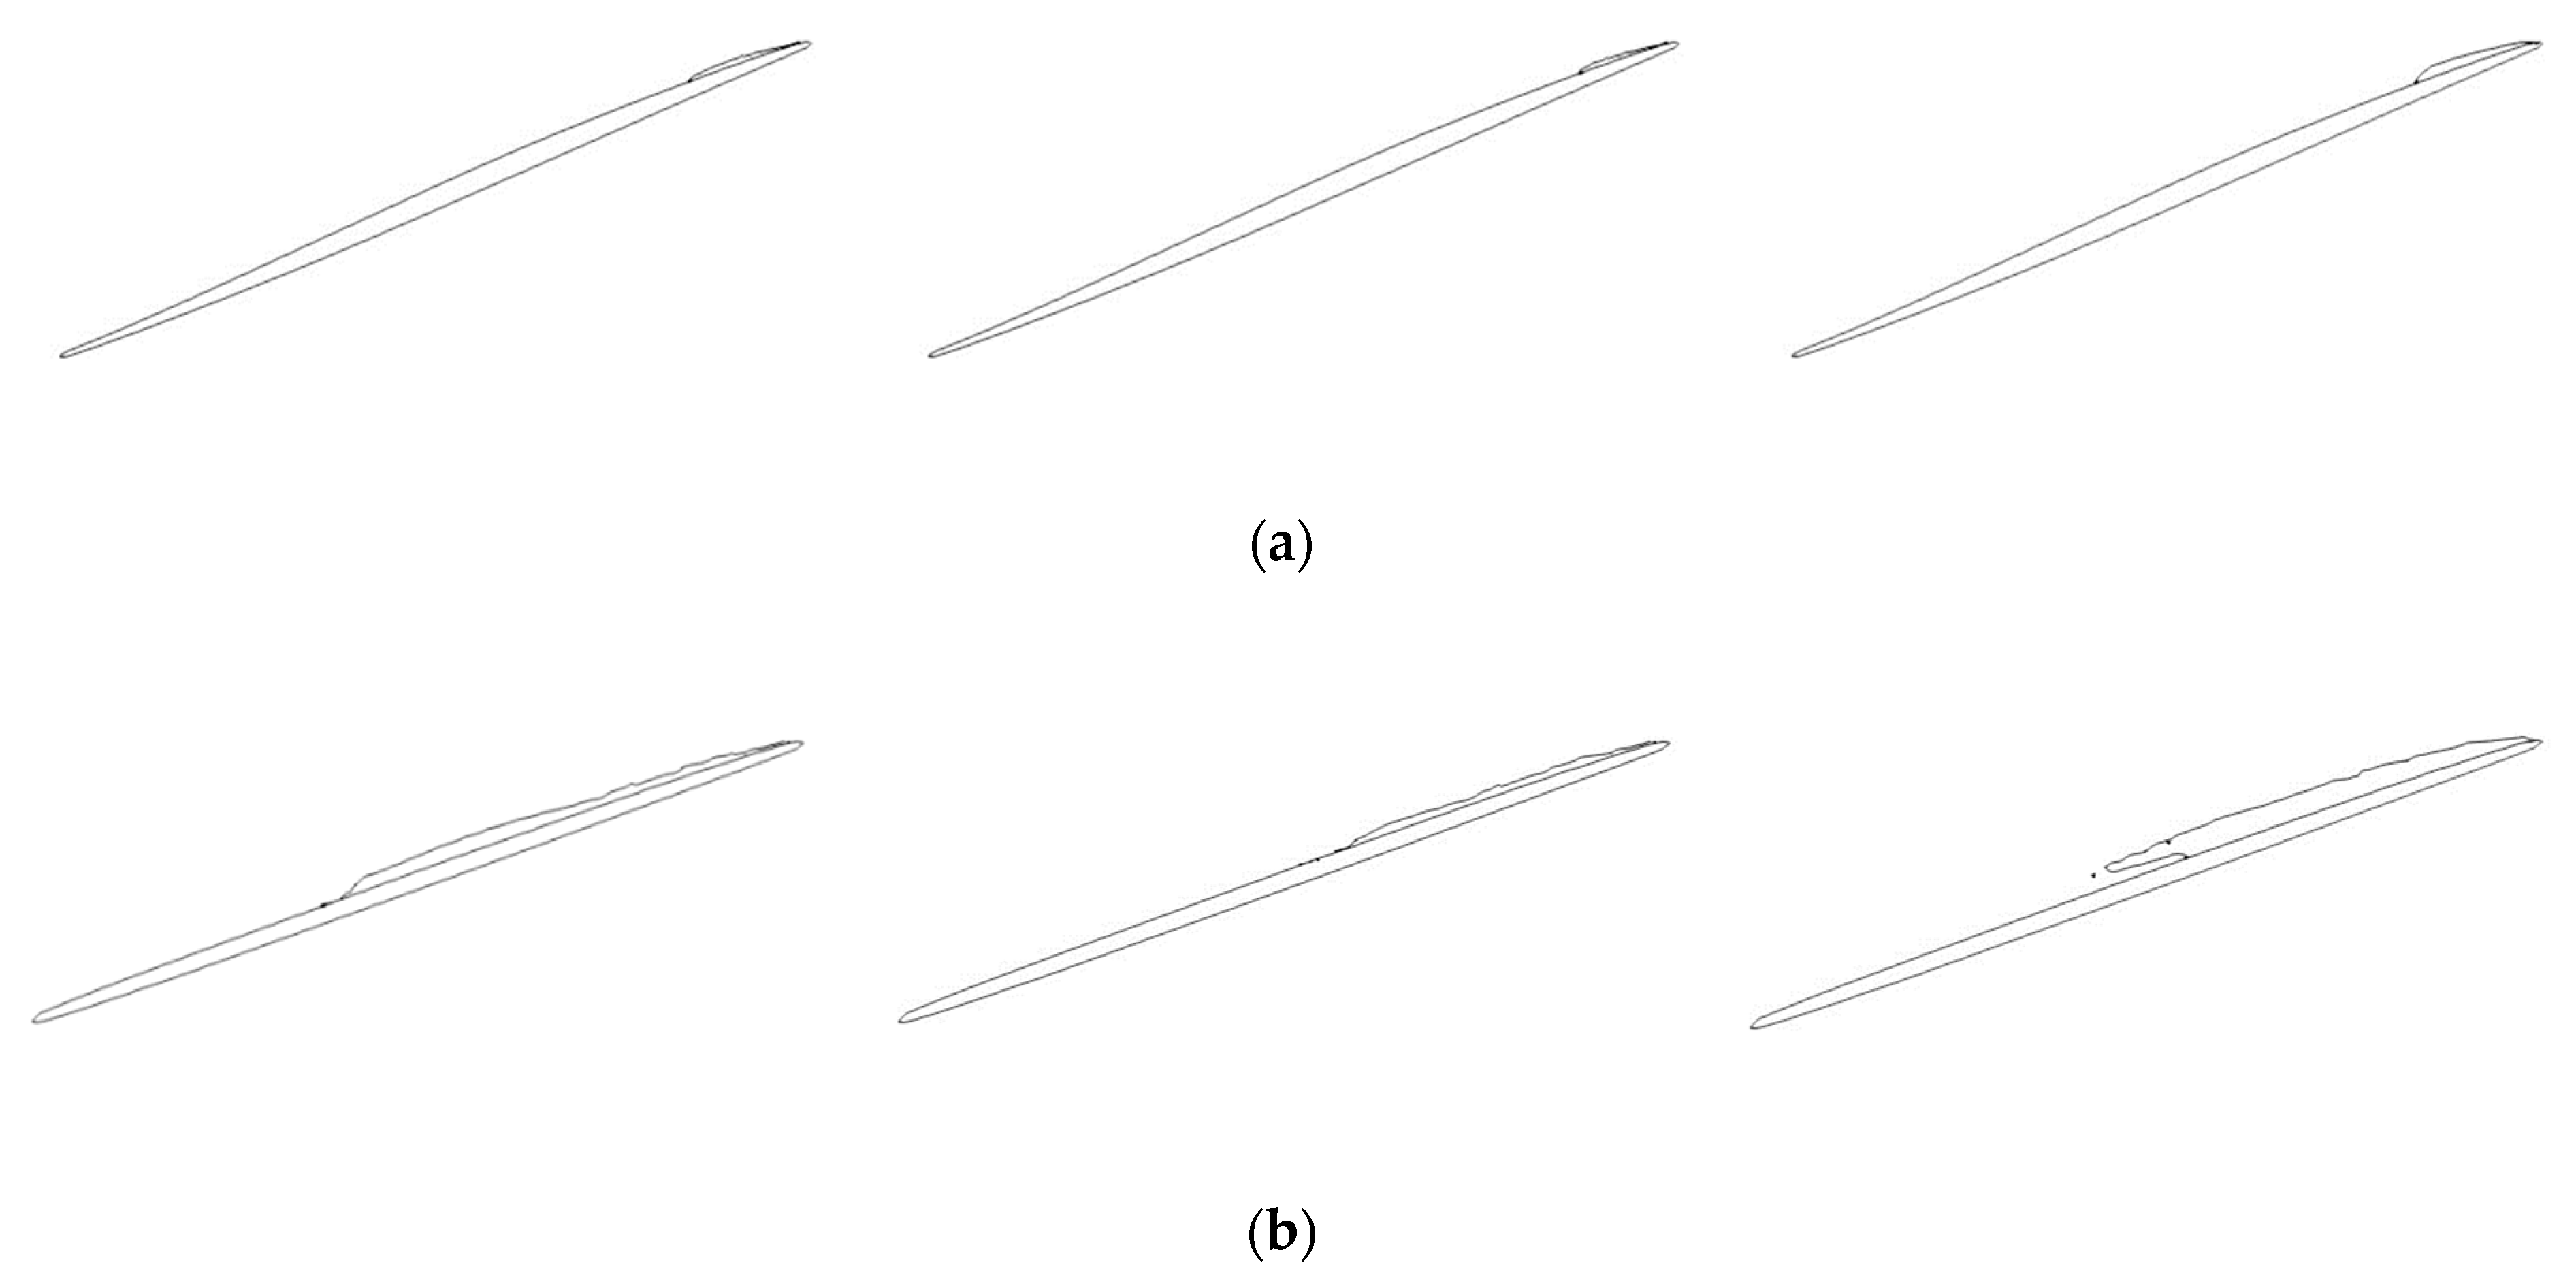
4.2.1. A 2D Hydrofoil

For the solver validation, a modified NACA66 hydrofoil, which has a wealth of data in the available simulations and experiments [22], was utilized. In order to analyze the differences in results from computations using different solvers, the time-averaged surface pressure distribution under cavitation numbers of 0.84, 0.91, 1.0 and 1.76 was nondimensionalized by C P = ( p p r e f ) / ( 0.5 ρ U 2 ) , and shown in Figure 5. The x-directional position is nondimensionalized by the chord length (C). Normally, the pressure distribution results for the cavities are usually identified as areas where C P = σ . All the computational approaches could be used to correctly estimate the pressure distribution ( C P ).
Figure 6 exhibits features of the cavitating flow around the modified NACA66 hydrofoil for a range of cavitation numbers using the different solvers. The figures demonstrate the volume fraction of the liquid phase. Each of the three approaches produced a stable cavity. In all results, cavitation inception was observed at the leading edge and cavitation closure was observed around the mid-chord for a low cavitation number. As the cavitation number increased, the cavity closure moved towards the leading edge of the hydrofoil. It is evident that both isothermal compressible and fully compressible flow approaches can be used to predict an adverse pressure gradient at the cavity closure. This adverse pressure gradient at the cavity closure is the primary cause of re-entrant jet formation; therefore, the compressible approach can predict a stronger re-entrant jet. Compared to the cavity inception, the compressibility effect was more prominent on the cavity closure.
The cavity is generated and grows from the leading edge to a point along the chord length of the hydrofoil depending on the cavitation number. The cavity length used in Figure 7 represents the total cavity, including the re-entrant jet length. The cavity length ( l c ) is affected by the cavitation number. Therefore, with a low cavitation number of 0.84, a long cavity length is observed, while with a high cavitation number of 1.0, a short cavity length is observed. This is clearly seen from Figure 7, which compares cavity length with cavitation number. The largest cavity was predicted using the isothermal compressible flow approach at l c / C = 0.539 for σ = 0.84 , which was 6.75% greater than the experimental data [27]. The length of the cavity among the solvers was similar with only a small difference. This indicates that all the solvers were capable of estimating the cavity length in comparison to the experiment.
Despite having almost equivalent cavity lengths, the re-entrant jets exhibited by the incompressible and compressible flow solvers were different. Figure 7b shows the re-entrant jet length ( l c , r e ) of computed cases against the cavitation number. From both Figure 6 and Figure 7, it could be noted that the incompressible flow solver showed a relatively insignificant re-entrant jet, but both the isothermal compressible and fully compressible flow solvers had similar behaviors in the produced re-entrant jet. Despite the isothermal compressible and fully compressible flow solvers having similar re-entrant jet behaviors, the re-entrant jet lengths were of different sizes. Notably, the fully compressible flow solver had a longer re-entrant jet length compared to the isothermal compressible flow solver, as shown in Figure 7b. This distinction can be explained by the solver’s ability to incorporate temperature changes during modelling of cavity dynamics. For both compressible flow solvers, as the cavitation number decreased, the cavity length was observed to increase, as was the re-entrant jet length.
Simulation results obtained from the incompressible, isothermal compressible, and fully compressible flow solvers confirmed that there was no cavity shedding and that the cavity was quite stable. This is because there no re-entrant jet developed on the leading edge; therefore, limiting interactions between the re-entrant jet and liquid–vapor interface which would have led to cavity sheet break-up. Normally, cavity sheet break-up causes cavity shedding downstream [1].
From the simulation data, the compressible flow solvers successfully captured the cavitation of 2D hydrofoil, where the compressibility effects would have resulted in a more clearly captured re-entrant jet. This condition was observed in a head-form body cavitation [21].
Figure 8 shows a compiled hydrofoil coefficient of lift ( C L ) and drag ( C D ) values. Comparing the lift forces data obtained from simulation of the incompressible, isothermal compressible and fully compressible flow solves shows a strong agreement with the experimental data, well within the allowable margin. It is observed that for low cavitation numbers of σ = 0.84 and σ = 0.91 , the fully compressible flow solver predicts data more accurately than both the incompressible flow solver and the isothermal compressible flow solver. This can be attributed to the fully compressible flow solver’s enhanced ability to capture cavitation dynamics better while considering temperature effects. Conversely, the isothermal compressible flow solver showed overestimated lift compared to the experimental results. From both the simulations and experiments, it is evident that lift increases with the cavity length, which is synonymous with the low cavitation number. Due to the two compressible flow solvers’ capability to capture the re-entrant jets, the fully compressible and isothermal compressible flows can be used to predict propeller cavitation. Comparisons of the predicted and measured drag coefficient ( C D ) are shown in Figure 8b. The three solvers underpredicted the drag coefficient but had similar trends within the experiment, where drag coefficient increased with the generated cavity length.

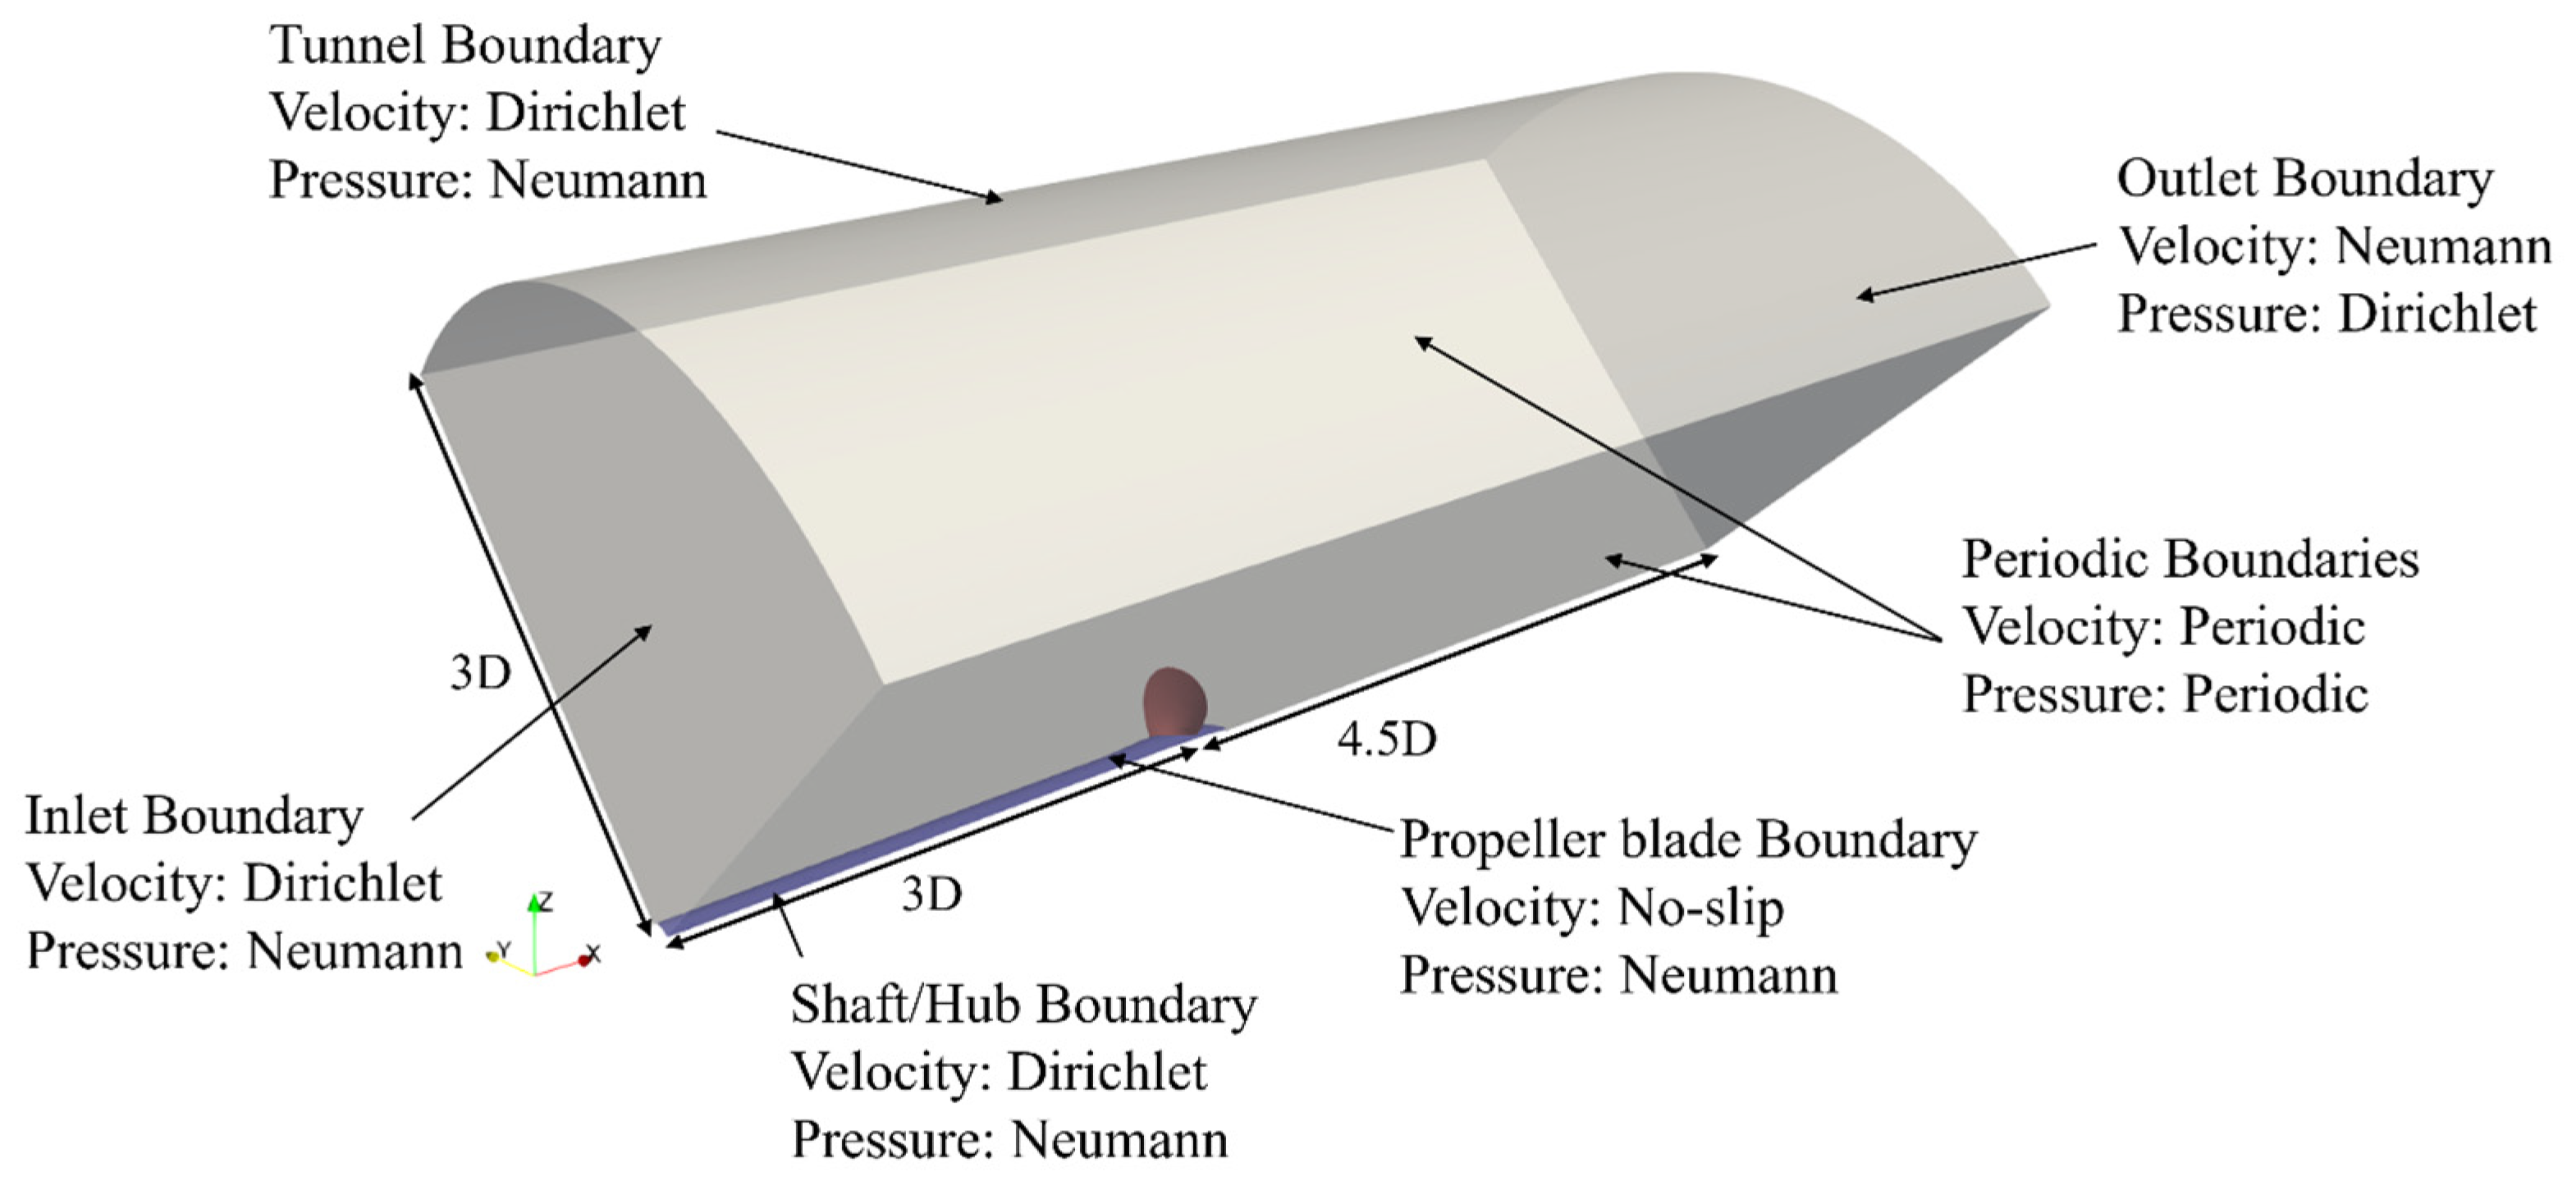
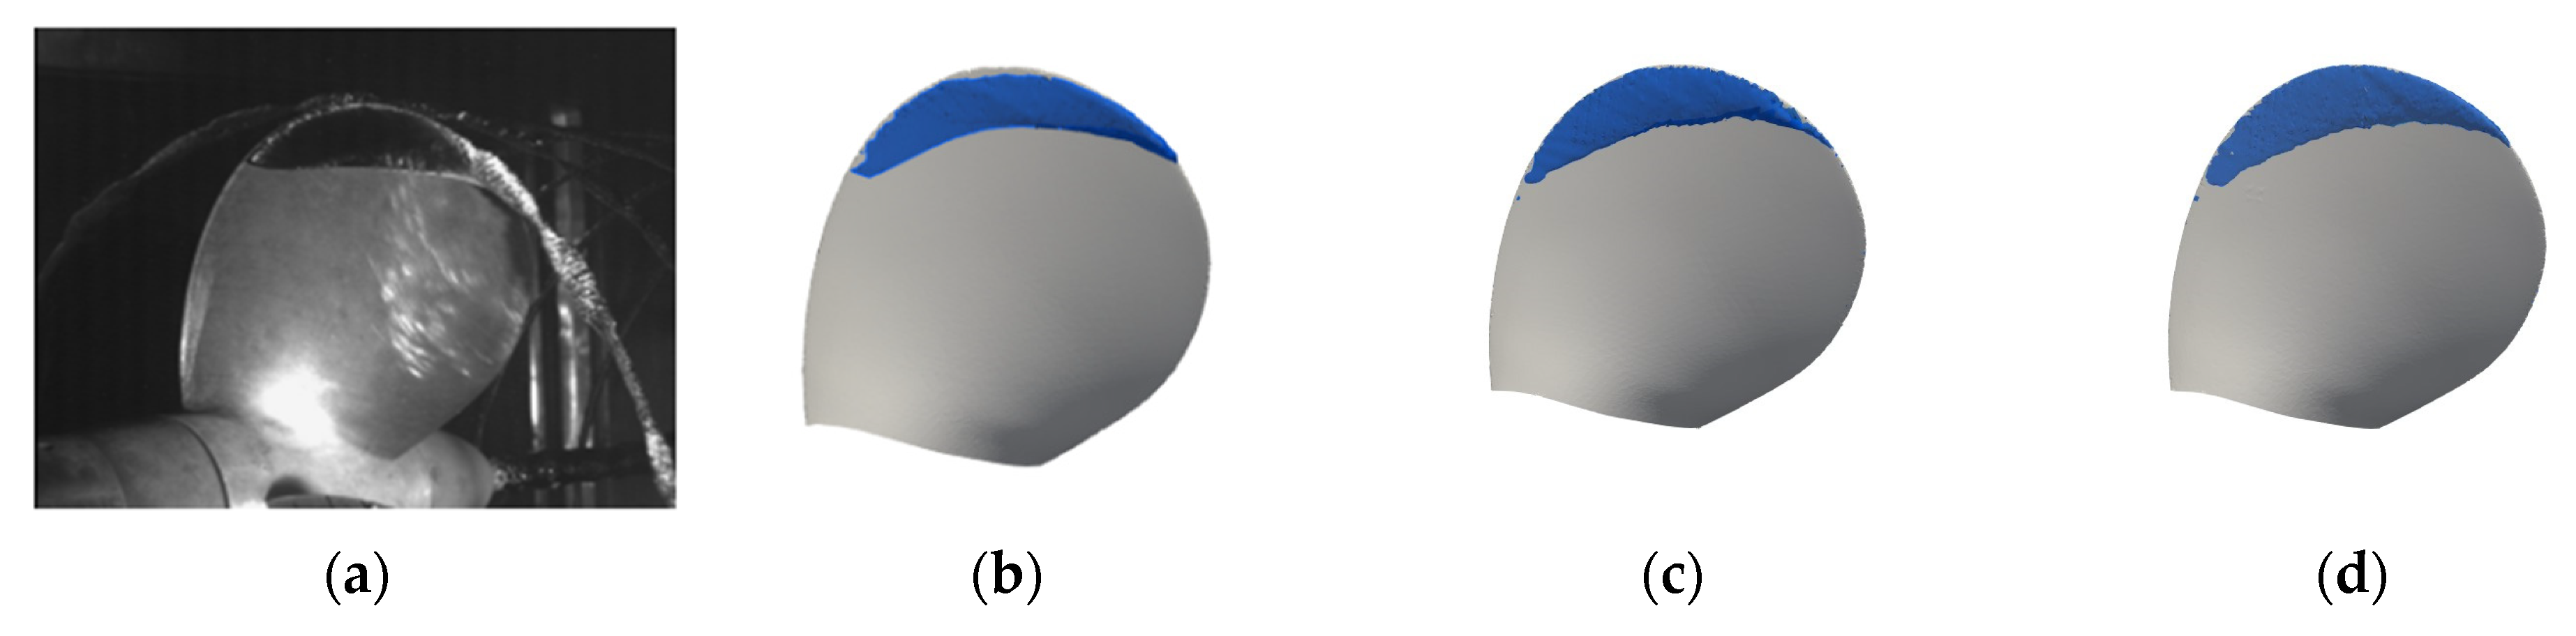
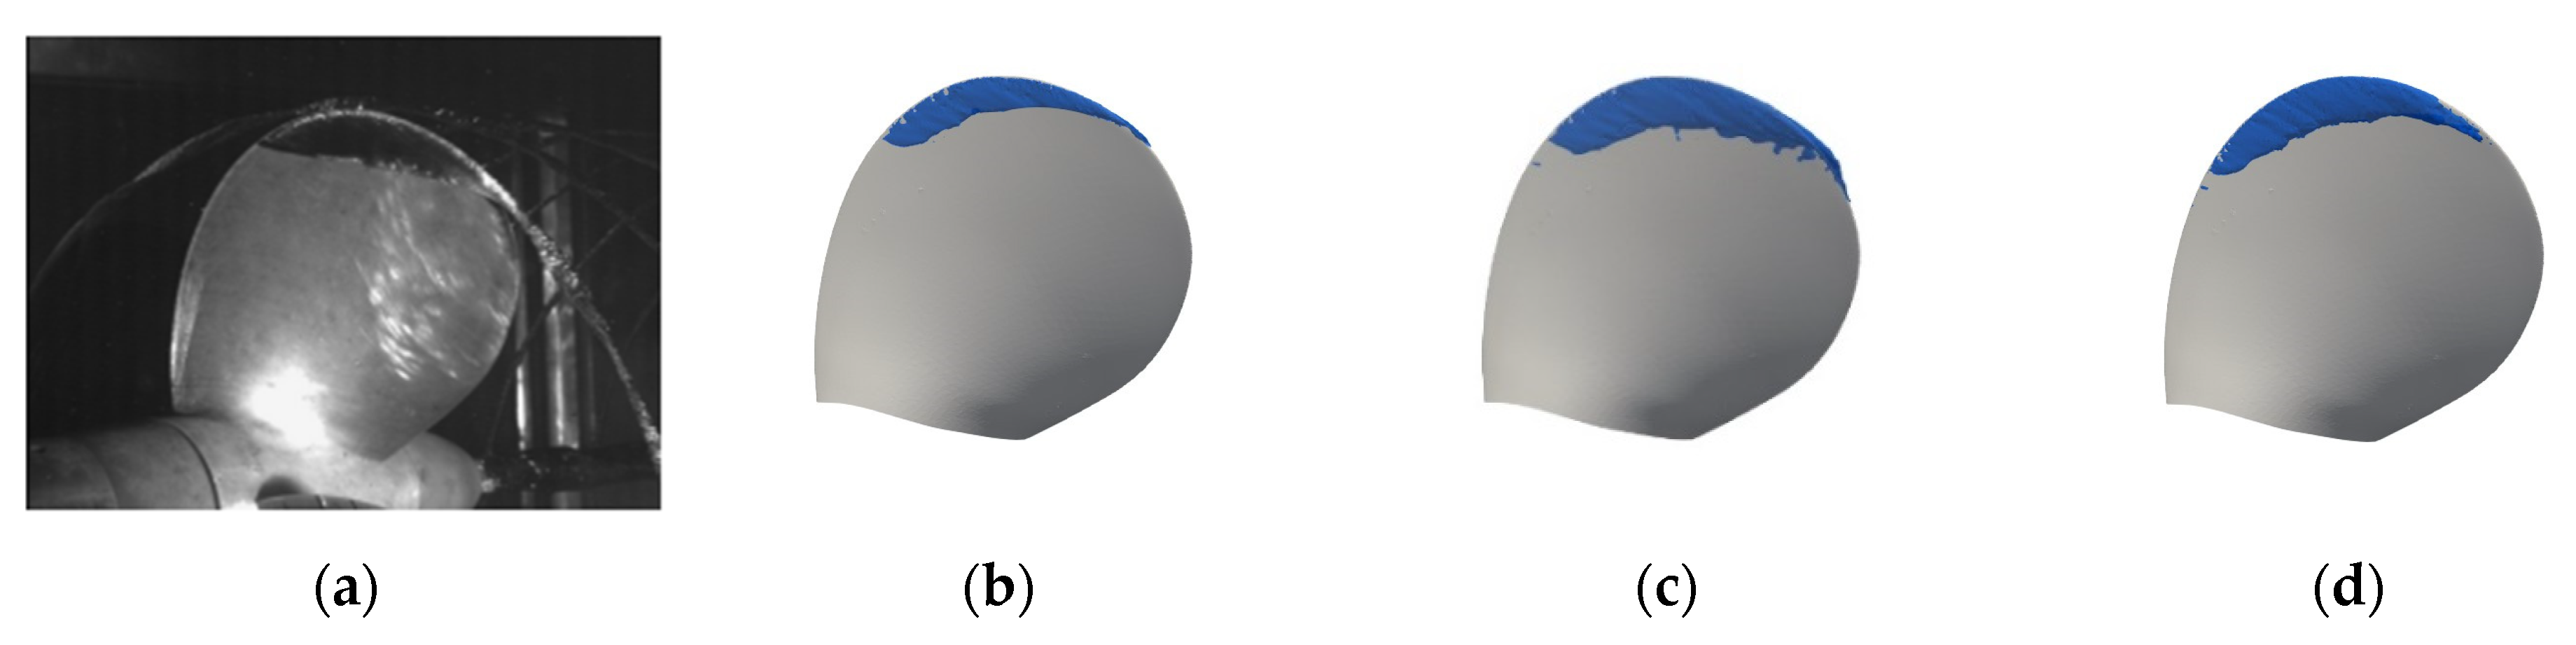
4.2.2. Propeller in Uniform Flow

The propeller rotation is simulated using the multiple reference frame (MRF) approach. For the stationary regions, the governing equations are solved in a fixed frame of reference, while for rotating regions, the centrifugal and Coriolis forces are added as the source term in the governing equations. The simulations were carried out with the thrust identity.
The numerical simulation was performed over two advance ratios, J = 0.71 and J = 0.83 , with cavitation numbers, σ = 1.763 and σ = 1.029 ,   respectively . The propeller rotation speed used was n = 36 rps, and the advanced velocity prescribed at the inlet. The cavitation number ( σ n ) is expressed as
σ n = p p s a t 0.5 ρ ( n D ) 2
The propeller torque and thrust coefficient are compared for different propeller loading of J = 0.71 and J = 0.83 are shown in Figure 9. The relative difference from the experimental value is written in the bar graph. The results show quite a satisfactory agreement between simulations and experiments. The values for the incompressible flow solver have overestimated thrust and torque values, while the two compressible flow solvers have underestimated values.
Overall, the fully compressible flow solver shows quite an impressive prediction with largest discrepancy being 4.126% for the torque coefficient and 3.256% for the thrust coefficient, compared with experimental data. This performance can be attributed to the compressible flow solver’s superior ability to capture the re-entrant jets much better than incompressible and isothermal compressible flow solvers. This can be attributed to the solver’s ability to use the change in densities in the function of the temperature and pressure to predict cavitation and especially re-entrant jet dynamics.
Cavitation analyses and setup, were carried out using the incompressible flow solver, as in [23]. Cavitation simulations at two propeller loadings, J = 0.71 and J = 0.83 , were carried out with cavitation numbers 1.763 and 1.029, respectively. This represented loadings with a similar propeller cavitation. As the norm, the vapor fraction of 0.5 was selected to visualize the computed cavity.
Figure 10 and Figure 11 show a comparison of the generated cavity results against the experiment results and leading edge sheet cavitation is clearly observed. The cavity in all cases was generated on the leading edge and propagated towards the blade tip. It was noted that the sheet fully developed without cavitating the tip vortex cavitation. To capture the tip vortex cavitation, more refined meshes are needed. During the simulation, the cavity behavior showed a steady cavity condition with some side-entrant jets visible.
Figure 12 represents the cavity on the propeller blade cross-section at r / R = 0.8 and 0.95. Notably, no re-entrant jets were observed for all other diameter points except r / R = 0.95 had. The re-entrant jet was primarily observed almost near the tip of the propeller blade. This underscores the fully compressible flow solver’s capability to predict and capture the re-entrant jet accurately, thus enhancing cavitation prediction. With the presence of strong cavitation action, this re-entrant jet would make it possible to view the tip vortex that is observed from the detachment of cavity at the tip of the blade.
In the fully compressible flows, density, pressure, and temperature are closely related, and temperature variance will certainly change the cavitation dynamics due to the evaporation effects, causing the absorption of heat and cooling the ambient fluid. Therefore, the cavitation region is characterized by low temperatures, especially along the reverse flow region boundary [1]. Due to these considerations, a fully compressible flow solver is recommended for cavitation computation. In 3D cavitation simulations, the fully compressible flow solver was observed to consistently produce better results than the isothermal compressible flow solver and incompressible flow solvers, therefore making it the preferred choice.

5. Conclusions

In summary, incompressible, isothermal compressible, and fully compressible flow solvers were used to simulate a cavitating flow on a 2D-modified NACA66 hydrofoil and the INSEAN E779A propeller in the present study.
The cavitating flow results around the hydrofoil showed close agreement. In both isothermal compressible and fully compressible flow solutions, the re-entrant jet appeared to have a relatively longer cavity length, and the cavity interface exhibited steady undulation compared to the incompressible flow solution. The re-entrant jet length for the fully compressible flow solver was much longer than the re-entrant jet length for the isothermal compressible flow solution. This can be attributed to a fully compressible flow solver ability to allow temperature change in the cavitating region.
When 3D cavitation simulations were considered, all solvers were able to accurately capture cavitation as compared to the experiment. However, in consideration of the hydrodynamic performance of the propeller, the fully compressible flow solver provided the best results compared to the other solvers used in this study.
Compressible flow solvers generally offer sufficient accuracy with computationally reasonable and affordable mesh configurations. The incompressible, isothermal compressible, and fully compressible flow solvers provided identical cavitation phenomena that were only limited to a much better resolution. The fully compressible flow solver proved to be more reliable compared to the isothermal compressible flow solver since the fully compressible flow solver combines density, pressure, and temperature, thereby influencing cavitation dynamics.

Author Contributions

Conceptualization, J.M.N. and S.P.; methodology, J.M.N. and S.P.; validation J.M.N. and S.P.; simulation, J.M.N.; formal analysis, J.M.N.; writing—original draft preparation, J.M.N.; writing—review and editing, J.M.N. and S.P.; visualization, J.M.N.; supervision S.P. All authors have read and agreed to the published version of the manuscript.

Funding

This research was supported by the National Research Foundation of Korea (NRF-2021R1I1A3044639).

Institutional Review Board Statement

Not applicable.

Informed Consent Statement

Not applicable.

Data Availability Statement

Conflicts of Interest

The authors declare no conflict of interest.

References

  1. Wang, C.; Wang, G.; Huang, B. Characteristics and dynamics of compressible cavitating flows with special emphasis on compressibility effects. Int. J. Multiph. Flow 2020, 130, 103357. [Google Scholar] [CrossRef]
  2. Ji, B.; Luo, X.W.; Arndt, R.E.; Peng, X.; Wu, Y. Large eddy simulation and theoretical investigations of the transient cavitating vortical flow structure around a NACA66 hydrofoil. Int. J. Multiph. Flow 2015, 68, 121–134. [Google Scholar] [CrossRef]
  3. Chen, Y.; Chen, X.; Li, J.; Gong, Z.; Lu, C. Large eddy simulation and investigation on the flow structure of the cascading cavitation shedding regime around 3D twisted hydrofoil. Ocean Eng. 2017, 129, 1–19. [Google Scholar] [CrossRef]
  4. Li, L.; Li, B.; Hu, Z.; Lin, Y.; Cheung, S.C. Large eddy simulation of unsteady shedding behavior in cavitating flows with time-average validation. Ocean Eng. 2016, 125, 1–11. [Google Scholar] [CrossRef]
  5. Ivashchenko, E.; Hrebtov, M.; Timoshevskiy, M.; Pervunin, K.; Mullyadzhanov, R. Systematic validation study of an unsteady cavitating flow over a hydrofoil using conditional averaging: LES and PIV. J. Mar. Sci. Eng. 2021, 9, 1193. [Google Scholar] [CrossRef]
  6. Bensow, R.E. Simulation of the unsteady cavitation on the Delft Twist11 foil using RANS, DES and LES. In Proceedings of the Second International Symposium on Marine Propulsors, Hamburg, Germany, 15–17 June 2011. [Google Scholar]
  7. Geng, L.; Escaler, X. Assessment of RANS turbulence models and Zwart cavitation model empirical coefficients for the simulation of unsteady cloud cavitation. Eng. Appl. Comput. Fluid Mech. 2020, 14, 151–167. [Google Scholar] [CrossRef]
  8. Wang, Y. On suitable CFD setups for cavitation dynamics. IOP Conf. Ser. Mater. Sci. Eng 2023, 1288, 012053. [Google Scholar] [CrossRef]
  9. Lloyd, T.; Vaz, G.; Rijpkema, D.; Reverberi, A. Computational fluid dynamics prediction of marine propeller cavitation including solution verification. In Proceedings of the Fifth International Symposium on Marine Propulsors, Espoo, Finland, 1–3 June 2017. [Google Scholar]
  10. Park, S.; Yeo, H.; Rhee, S.H. Isothermal compressible flow solver for prediction of cavitation erosion. Eng. Appl. Comput. Fluid Mech. 2019, 13, 683–697. [Google Scholar] [CrossRef]
  11. Gaggero, S.; Tani, G.; Viviani, M.; Conti, F. A study on the numerical prediction of propellers cavitating tip vortex. Ocean Eng. 2014, 92, 137–161. [Google Scholar] [CrossRef]
  12. Yilmaz, N.; Atlar, M.; Khorasanchi, M. An improved Mesh Adaption and Refinement approach to Cavitation Simulation (MARCS) of propellers. Ocean Eng. 2019, 171, 139–150. [Google Scholar] [CrossRef]
  13. Viitanen, V.; Siikonen, T.; Sánchez-Caja, A. Cavitation on model-and full-scale marine propellers: Steady and transient viscous flow simulations at different Reynolds numbers. J. Mar. Sci. Eng. 2020, 8, 141. [Google Scholar] [CrossRef]
  14. Morgut, M.; Jošt, D.; Škerlavaj, A.; Nobile, E.; Contento, G.; Pigazzini, R.; Martini, S. Numerical simulations of a cavitating propeller in uniform and oblique flow. Int. Shipbuild. Prog. 2019, 66, 77–90. [Google Scholar] [CrossRef]
  15. Viitanen, V.; Sipilä, T.; Sánchez-Caja, A.; Siikonen, T. CFD predictions of unsteady cavitation for a marine propeller in oblique inflow. Ocean Eng. 2022, 266, 112596. [Google Scholar] [CrossRef]
  16. Vaz, G.; Hally, D.; Huuva, T.; Bulten, N.; Muller, P.; Becchi, P.; Korsström, A. Cavitating flow calculations for the E779A propeller in open water and behind conditions: Code comparison and solution validation. In Proceedings of the Fourth International Symposium on Marine Propulsors, Austin, TX, USA, 31 May–4 June 2015. [Google Scholar]
  17. Park, S.; Rhee, S.H. Numerical analysis of the three-dimensional cloud cavitating flow around a twisted hydrofoil. Fluid Dyn. Res. 2012, 45, 015502. [Google Scholar] [CrossRef]
  18. Gaggero, S.; Villa, D. Cavitating propeller performance in inclined shaft conditions with OpenFOAM: PPTC 2015 test case. J. Mar. Sci. Appl. 2018, 17, 1–20. [Google Scholar] [CrossRef]
  19. Wang, C.C.; Huang, B.; Wang, G.Y.; Duan, Z.P.; Ji, B. Numerical simulation of transient turbulent cavitating flows with special emphasis on shock wave dynamics considering the water/vapor compressibility. J. Hydrodyn. 2018, 30, 573–591. [Google Scholar] [CrossRef]
  20. Madabhushi, A.; Mahesh, K. A compressible multi-scale model to simulate cavitating flows. J. Fluid Mech. 2023, 961, A6. [Google Scholar] [CrossRef]
  21. Park, S.; Rhee, S.H. Comparative study of incompressible and isothermal compressible flow solvers for cavitating flow dynamics. J. Mech. Sci. Technol. 2015, 29, 3287–3296. [Google Scholar] [CrossRef]
  22. Capurso, T.; Lopez, M.; Lorusso, M.; Torresi, M.; Pascazio, G.; Camporeale, S.M.; Fortunato, B. Numerical investigation of cavitation on a NACA0015 hydrofoil by means of OpenFOAM. Energy Procedia 2017, 126, 794–801. [Google Scholar] [CrossRef]
  23. Ng’aru, J.M.; Park, S. CFD simulations of the effect of equalizing duct configurations on cavitating flow around a propeller. J. Mar. Sci. Eng. 2022, 10, 1865. [Google Scholar] [CrossRef]
  24. Schnerr, G.H.; Sauer, J. Physical and numerical modeling of unsteady cavitation dynamics. In Proceedings of the Fourth International Conference on Multiphase Flow, New Orleans, LA, USA, 27 May–1 June 2001. [Google Scholar]
  25. Hirt, C.W.; Nichols, B.D. Volume of fluid (VOF) method for the dynamics of free boundaries. J. Comput. Phys. 1981, 39, 201–225. [Google Scholar] [CrossRef]
  26. Menter, F.R. Two-equation eddy-viscosity turbulence models for engineering applications. AIAA J. 1994, 32, 1598–1605. [Google Scholar] [CrossRef]
  27. Shen, Y.; Dimotakis, P. The influence of surface cavitation on hydrodynamic forces. In Proceedings of the SNAME American Towing Tank Conference, St. John’s, NL, Canada, 8–11 August 1989. [Google Scholar]
  28. Salvatore, F.; Pereira, F.; Felli, M.; Calcagni, D.; Di Felice, F. Description of the INSEAN E779A Propeller Experimental Dataset; Technical Report INSEAN 2006-085; INSEAN-Italian Ship Model Basin: Rome, Italy, 2006. [Google Scholar]
  29. OpenFOAM and The OpenFOAM Foundation. Available online: https://www.openfoam.org/ (accessed on 1 November 2023).
Figure 1. Computational conditions of modified NACA66 hydrofoil. (a) Computational domain; (b) computational mesh.
Jmse 11 02199 g001
Figure 2. Propeller simulation domain set up.
Jmse 11 02199 g002
Figure 3. Mesh resolution: (a) coarse mesh, (b) medium mesh, (c) fine mesh, and (d) medium mesh with layers around the blade.
Jmse 11 02199 g003
Figure 4. Open water test results.
Jmse 11 02199 g004
Figure 5. NACA66 hydrofoil pressure coefficient distribution for σ = 0.84, σ = 0.91, σ = 1.0 and σ = 1.76.
Jmse 11 02199 g005
Figure 6. Volume fraction contours around modified NACA66 hydrofoil (left: incompressible flow; middle: isothermal compressible flow; right: fully compressible flow) (a) σ = 0.84, (b) σ = 0.91, (c) σ = 1.00.
Jmse 11 02199 g006
Figure 7. Cavity length and re-entrant jet length: (a) cavity length, (b) re-entrant jet length, and (c) re-entrant jet length illustration.
Jmse 11 02199 g007
Figure 8. Hydrodynamics performance of hydrofoil: (a) Lift coefficient, (b) drag coefficient.
Jmse 11 02199 g008
Figure 9. Hydrodynamics performance of propeller in cavitating flow: (a) Thrust coefficient (b); torque coefficient.
Jmse 11 02199 g009
Figure 10. Propeller cavitation for case 1: (a) experiment, (b) incompressible flow, (c) isothermal compressible flow, and (d) fully compressible flow.
Jmse 11 02199 g010
Figure 11. Propeller cavitation for case 2: (a) experiment, (b) incompressible flow, (c) isothermal compressible flow, and (d) fully compressible flow.
Jmse 11 02199 g011
Figure 12. Re-entrant jets on the propeller blade for case 2 (left: incompressible flow; middle: isothermal compressible flow; right: fully compressible flow) (a) r/R = 0.8, (b) r/R = 0.95.
Jmse 11 02199 g012
Table 1. INSEAN E779A principal particulars.
No. of blades4
Diameter (m)0.227227
Pitch ratio (P/D) at r/R = 0.71.1
Pitch (P) (m)0.15225
Expanded area ratio [Ae/Ao]0.69
Table 2. Grid dependency test results.
Grid Count K T Difference   ( % )
Coarse grid697,8000.229010.196%
Medium grid1,234,5490.24972.078%
Fine grid2,786,3680.2511.569%
Disclaimer/Publisher’s Note: The statements, opinions and data contained in all publications are solely those of the individual author(s) and contributor(s) and not of MDPI and/or the editor(s). MDPI and/or the editor(s) disclaim responsibility for any injury to people or property resulting from any ideas, methods, instructions or products referred to in the content.

