
High Light Intensity and CO2 Enrichment Synergistically Mitigated the Stress Caused by Low Salinity in Pyropia yezoensis

Abstract
:1. Introduction
2. Materials and Methods
2.1. Collection and Culture Conditions
2.2. Experimental Design
2.3. Carbonate Chemistry System
2.4. Measurement of Growth Rate
2.5. Measurement of Chlorophyll Fluorescence
2.6. Measurement of Pigment Contents
2.7. Measurement of Soluble Carbohydrates Content
2.8. Data Analysis
3. Results
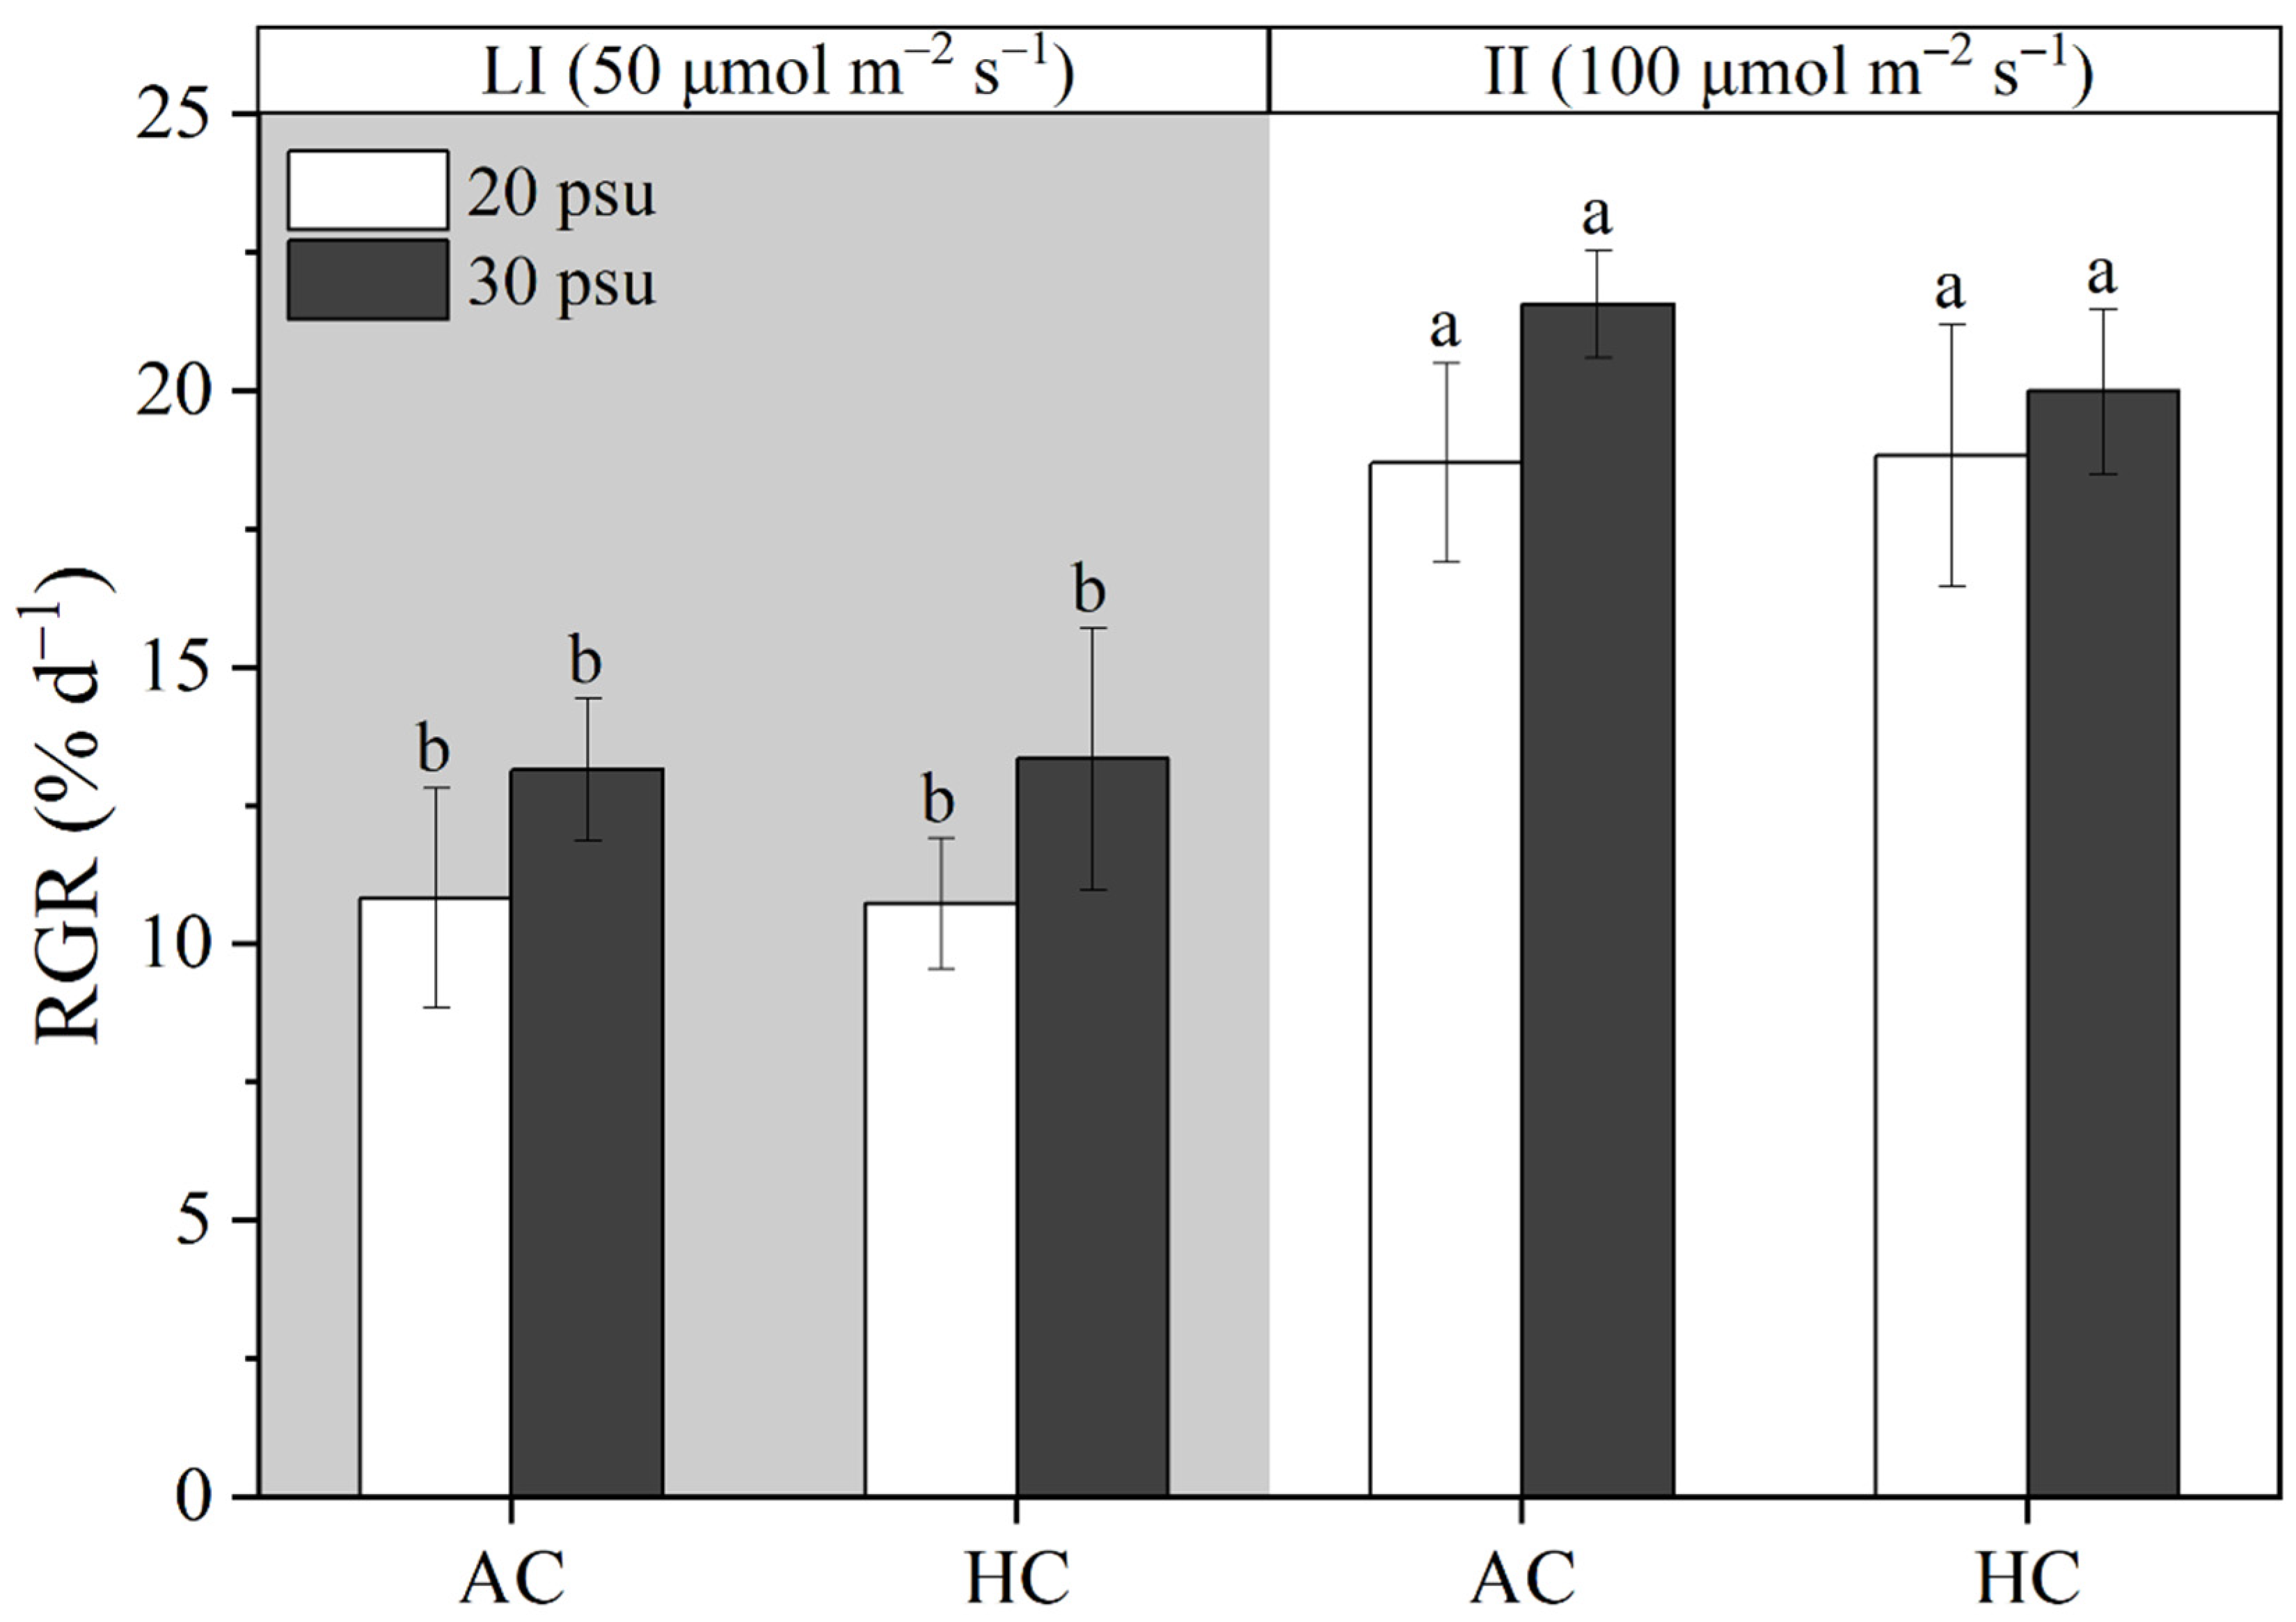
3.1. Growth Rate
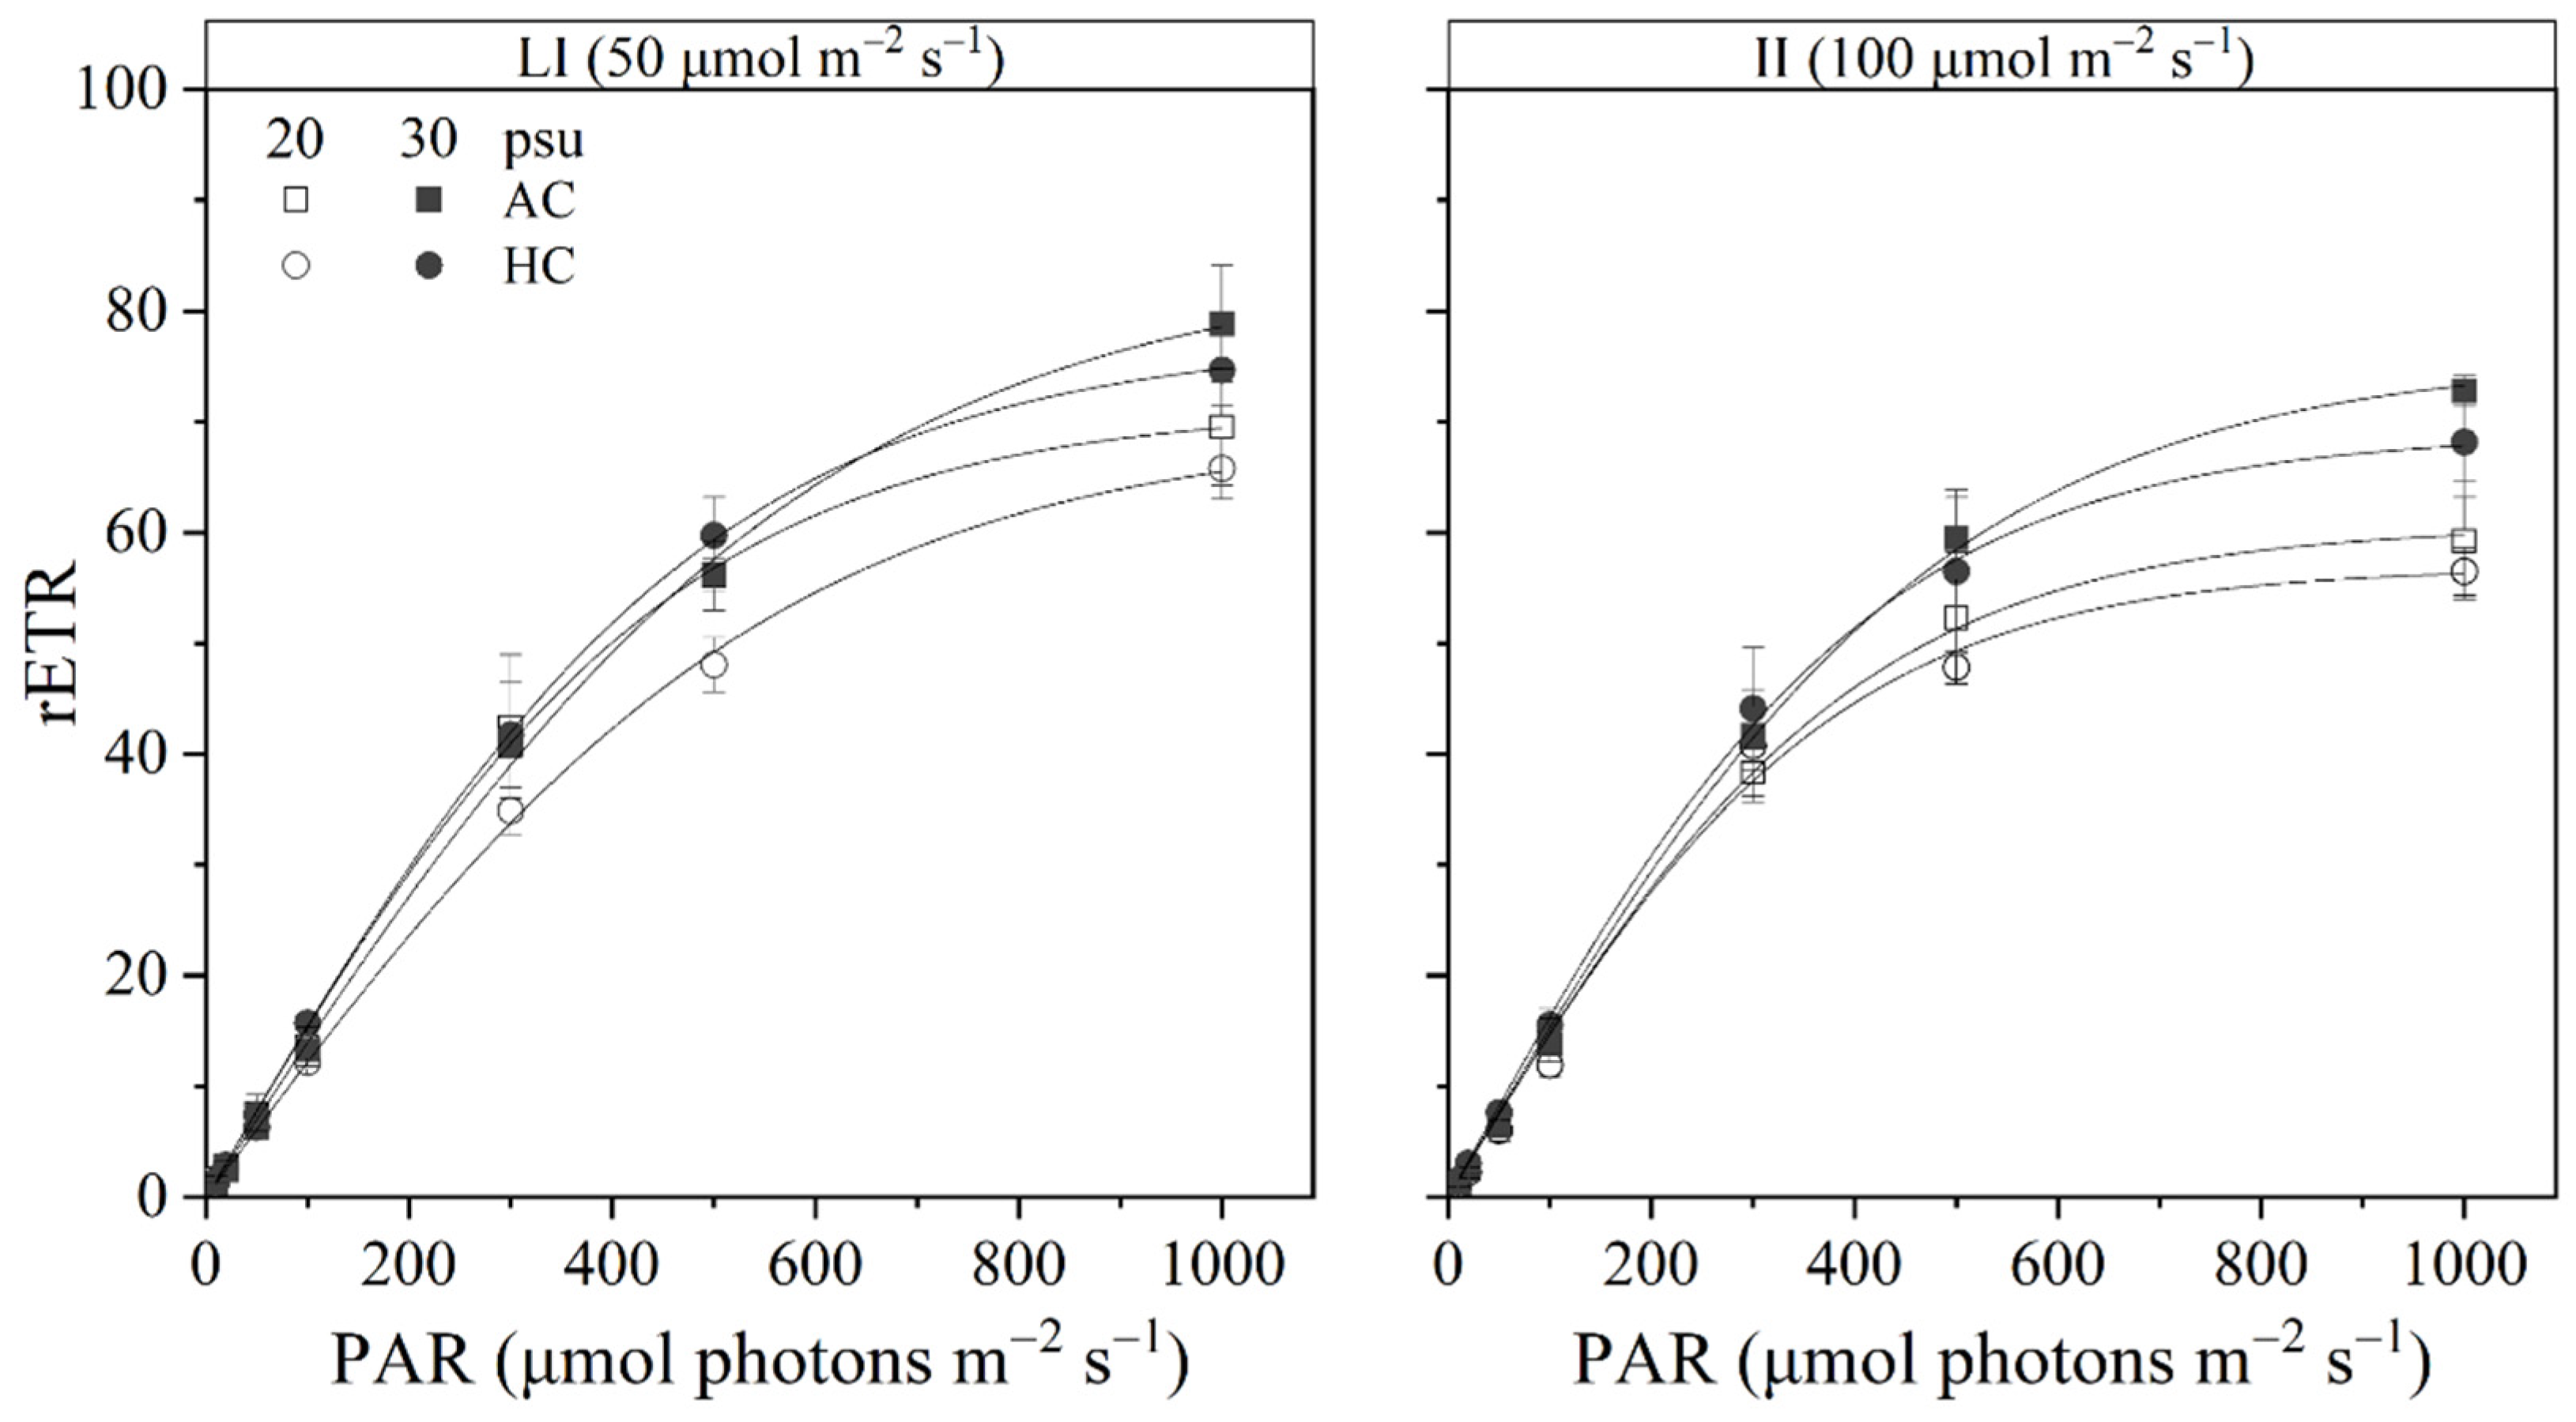
3.2. Chlorophyll a Fluorescence
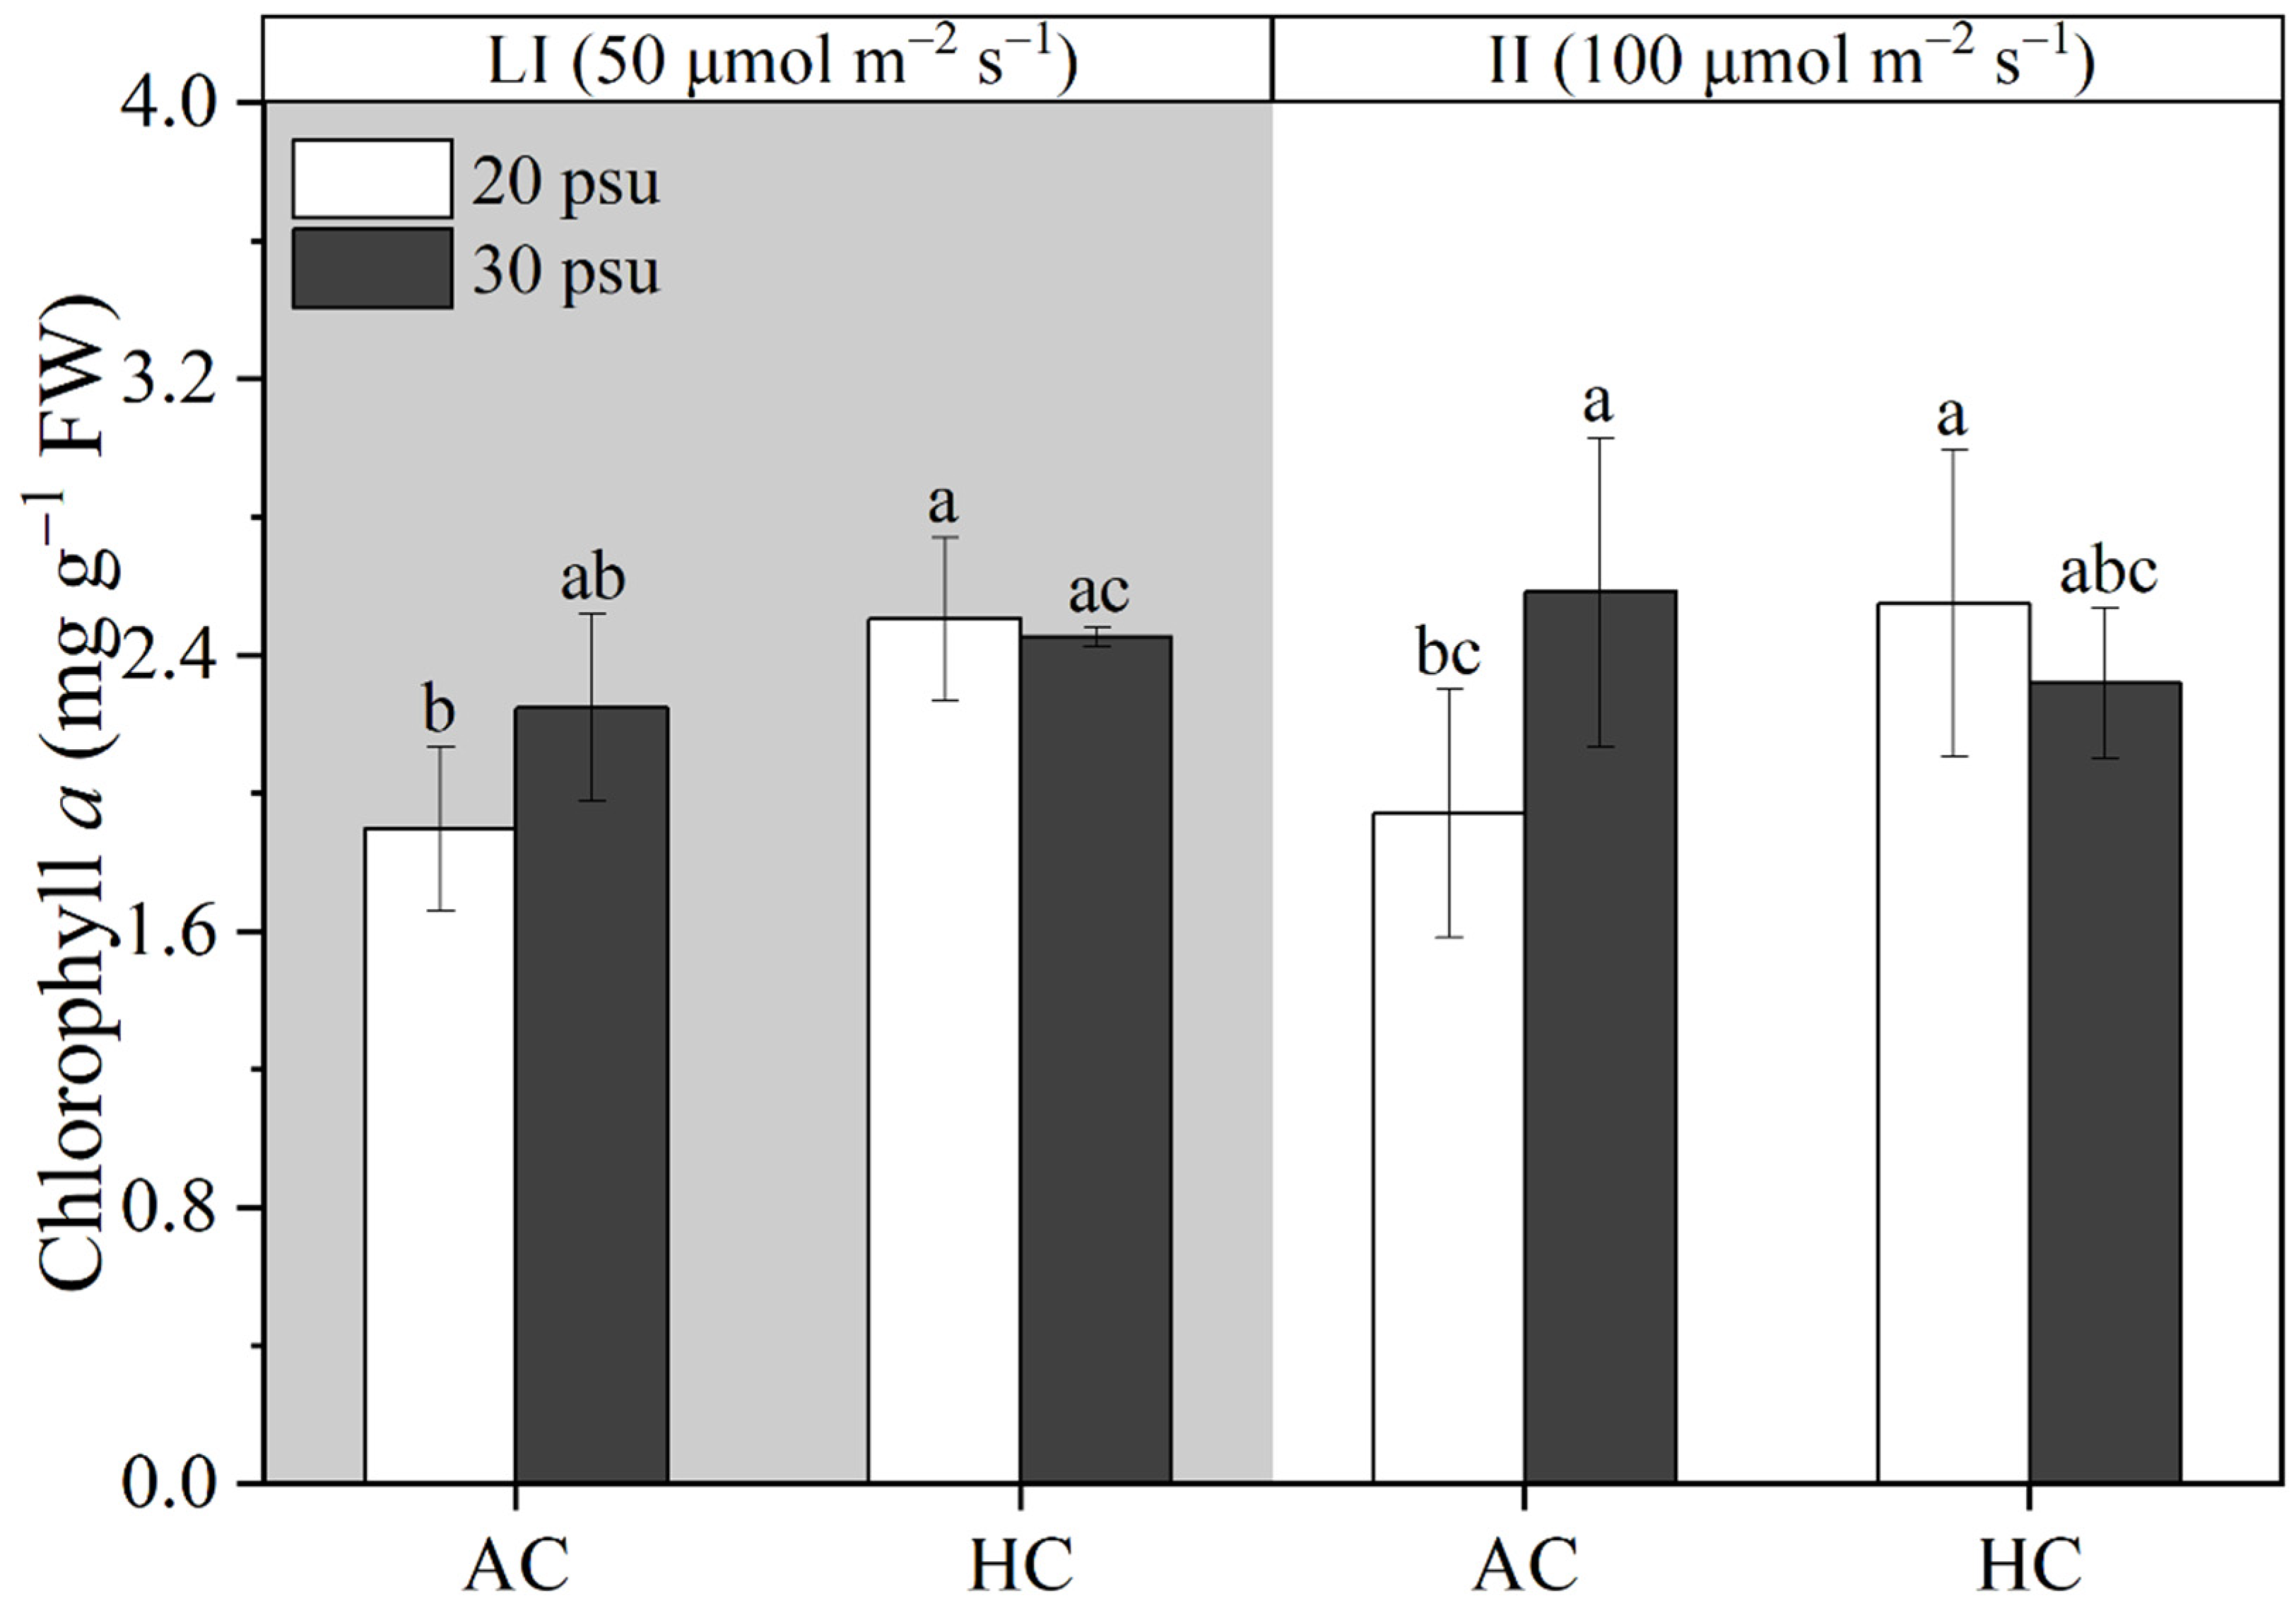
3.3. Pigment Contents
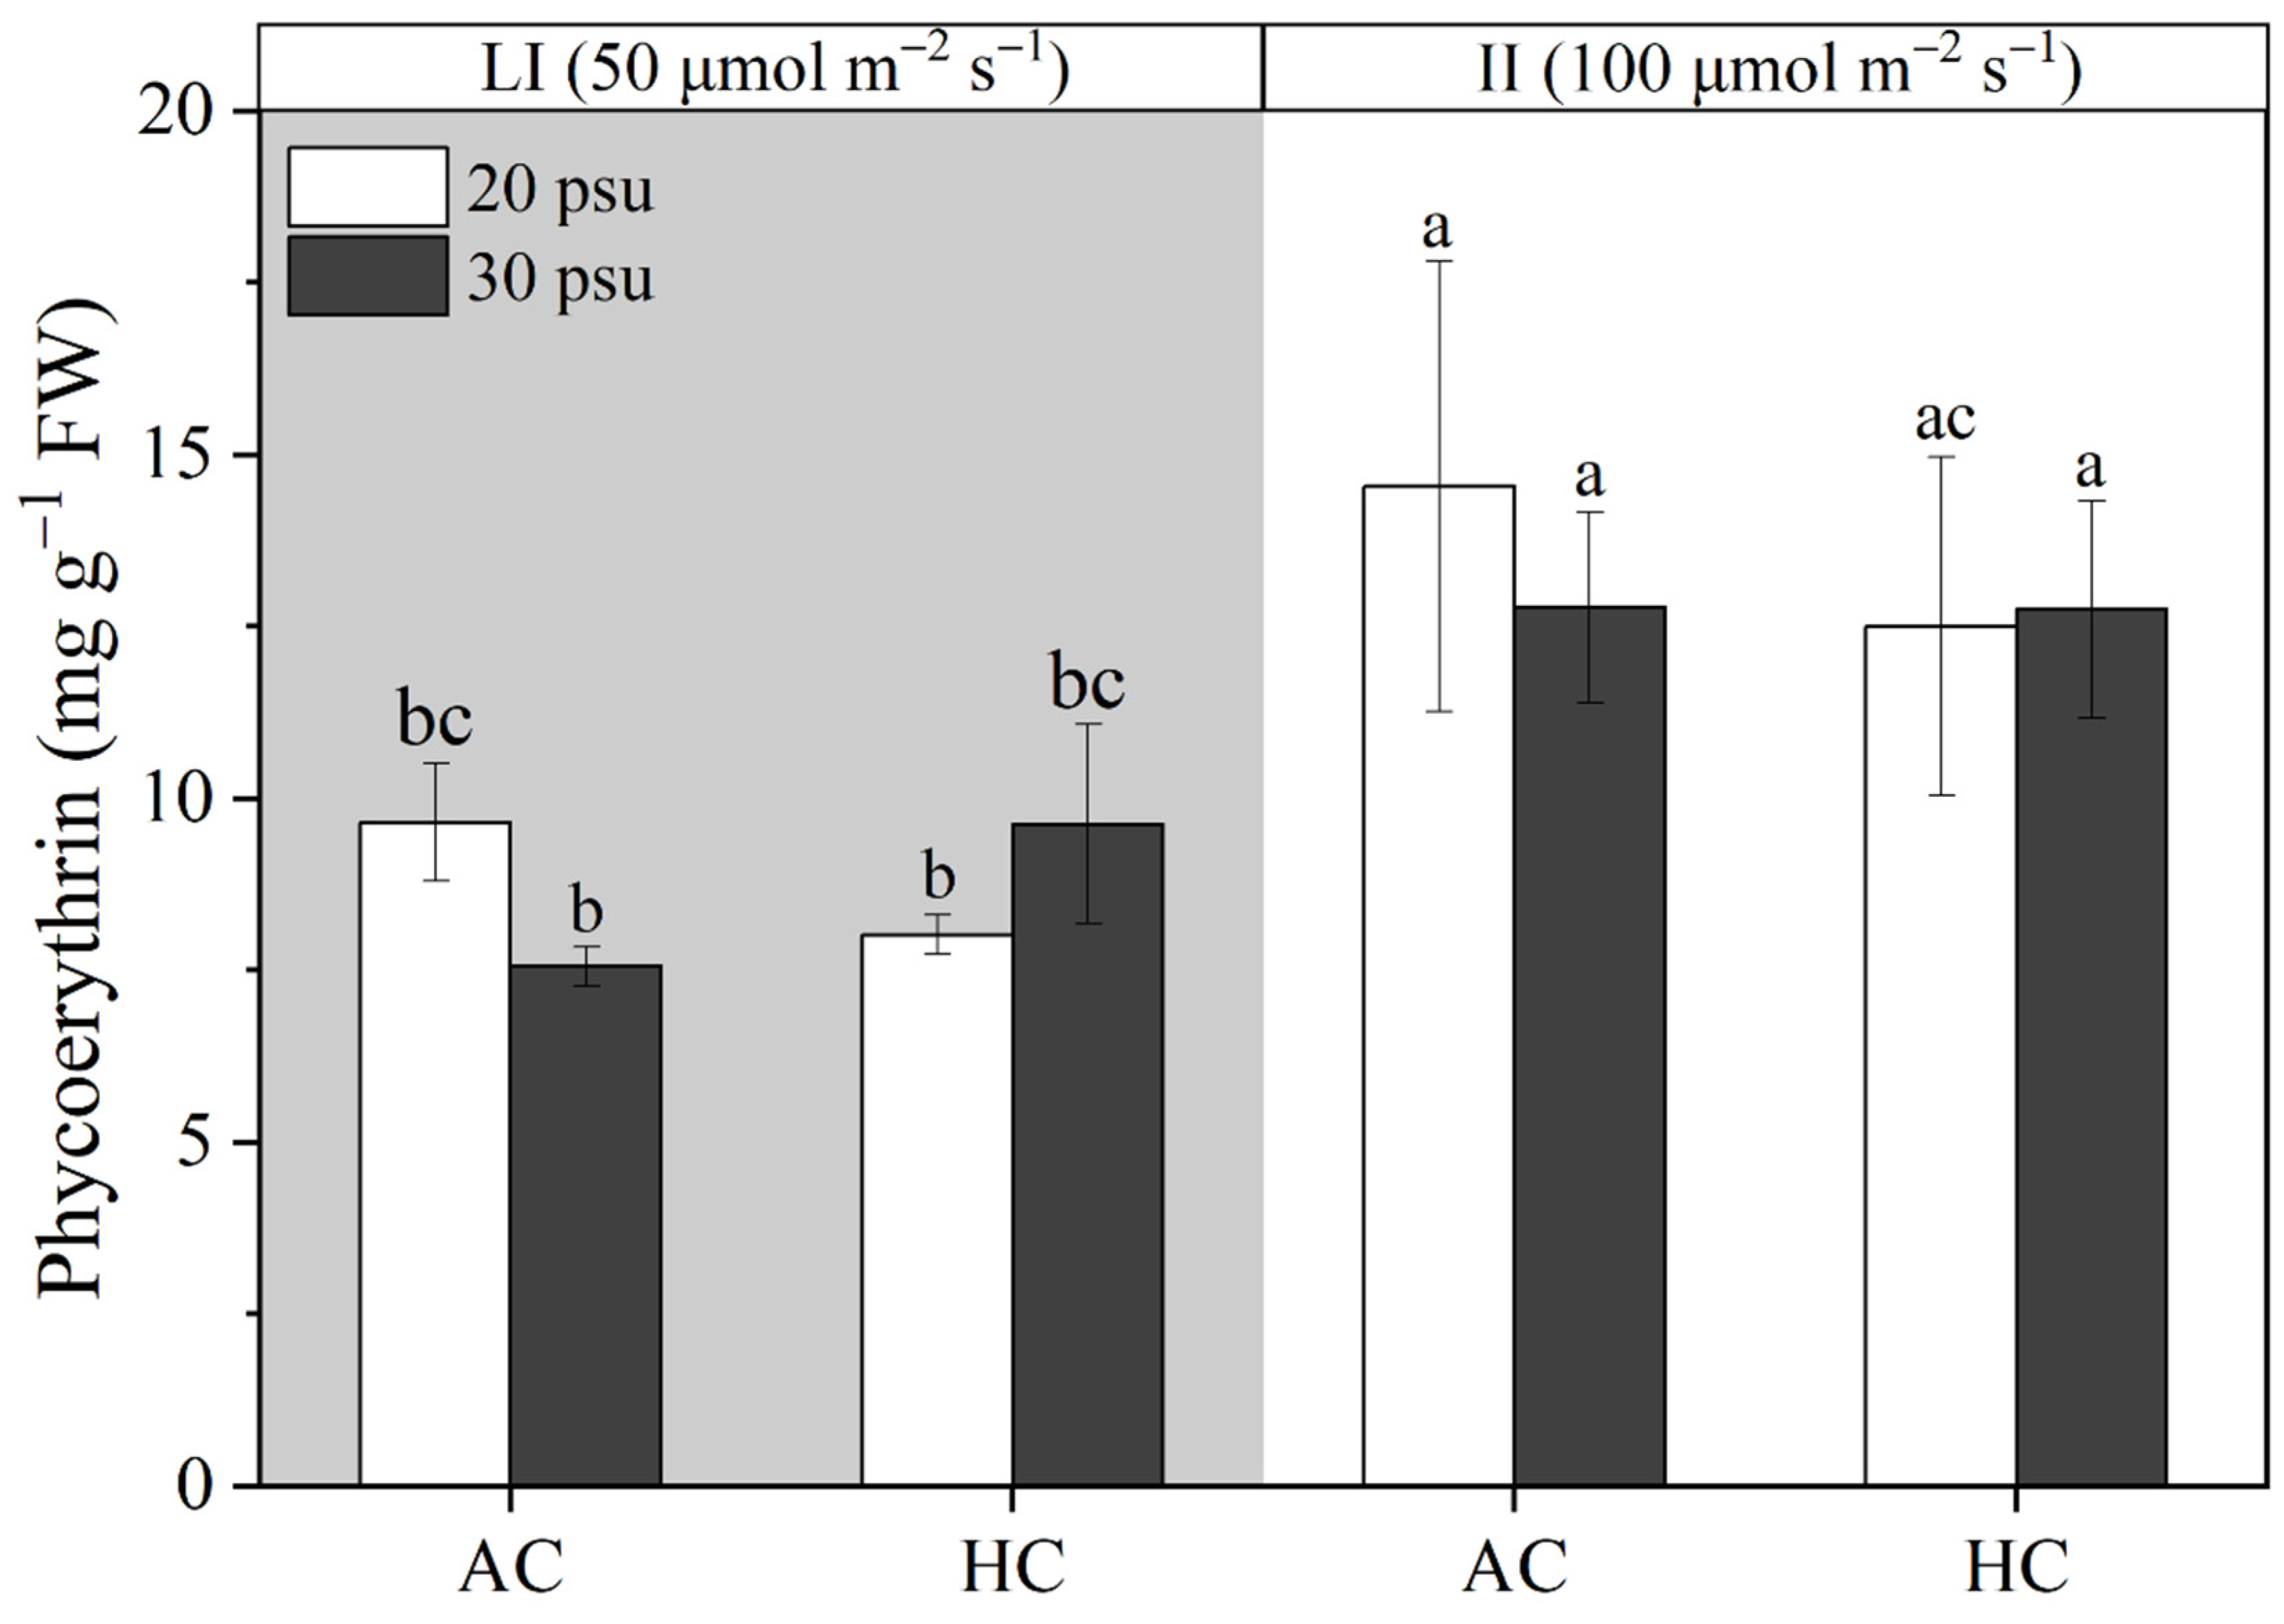
3.4. Phycoerythrin Contents
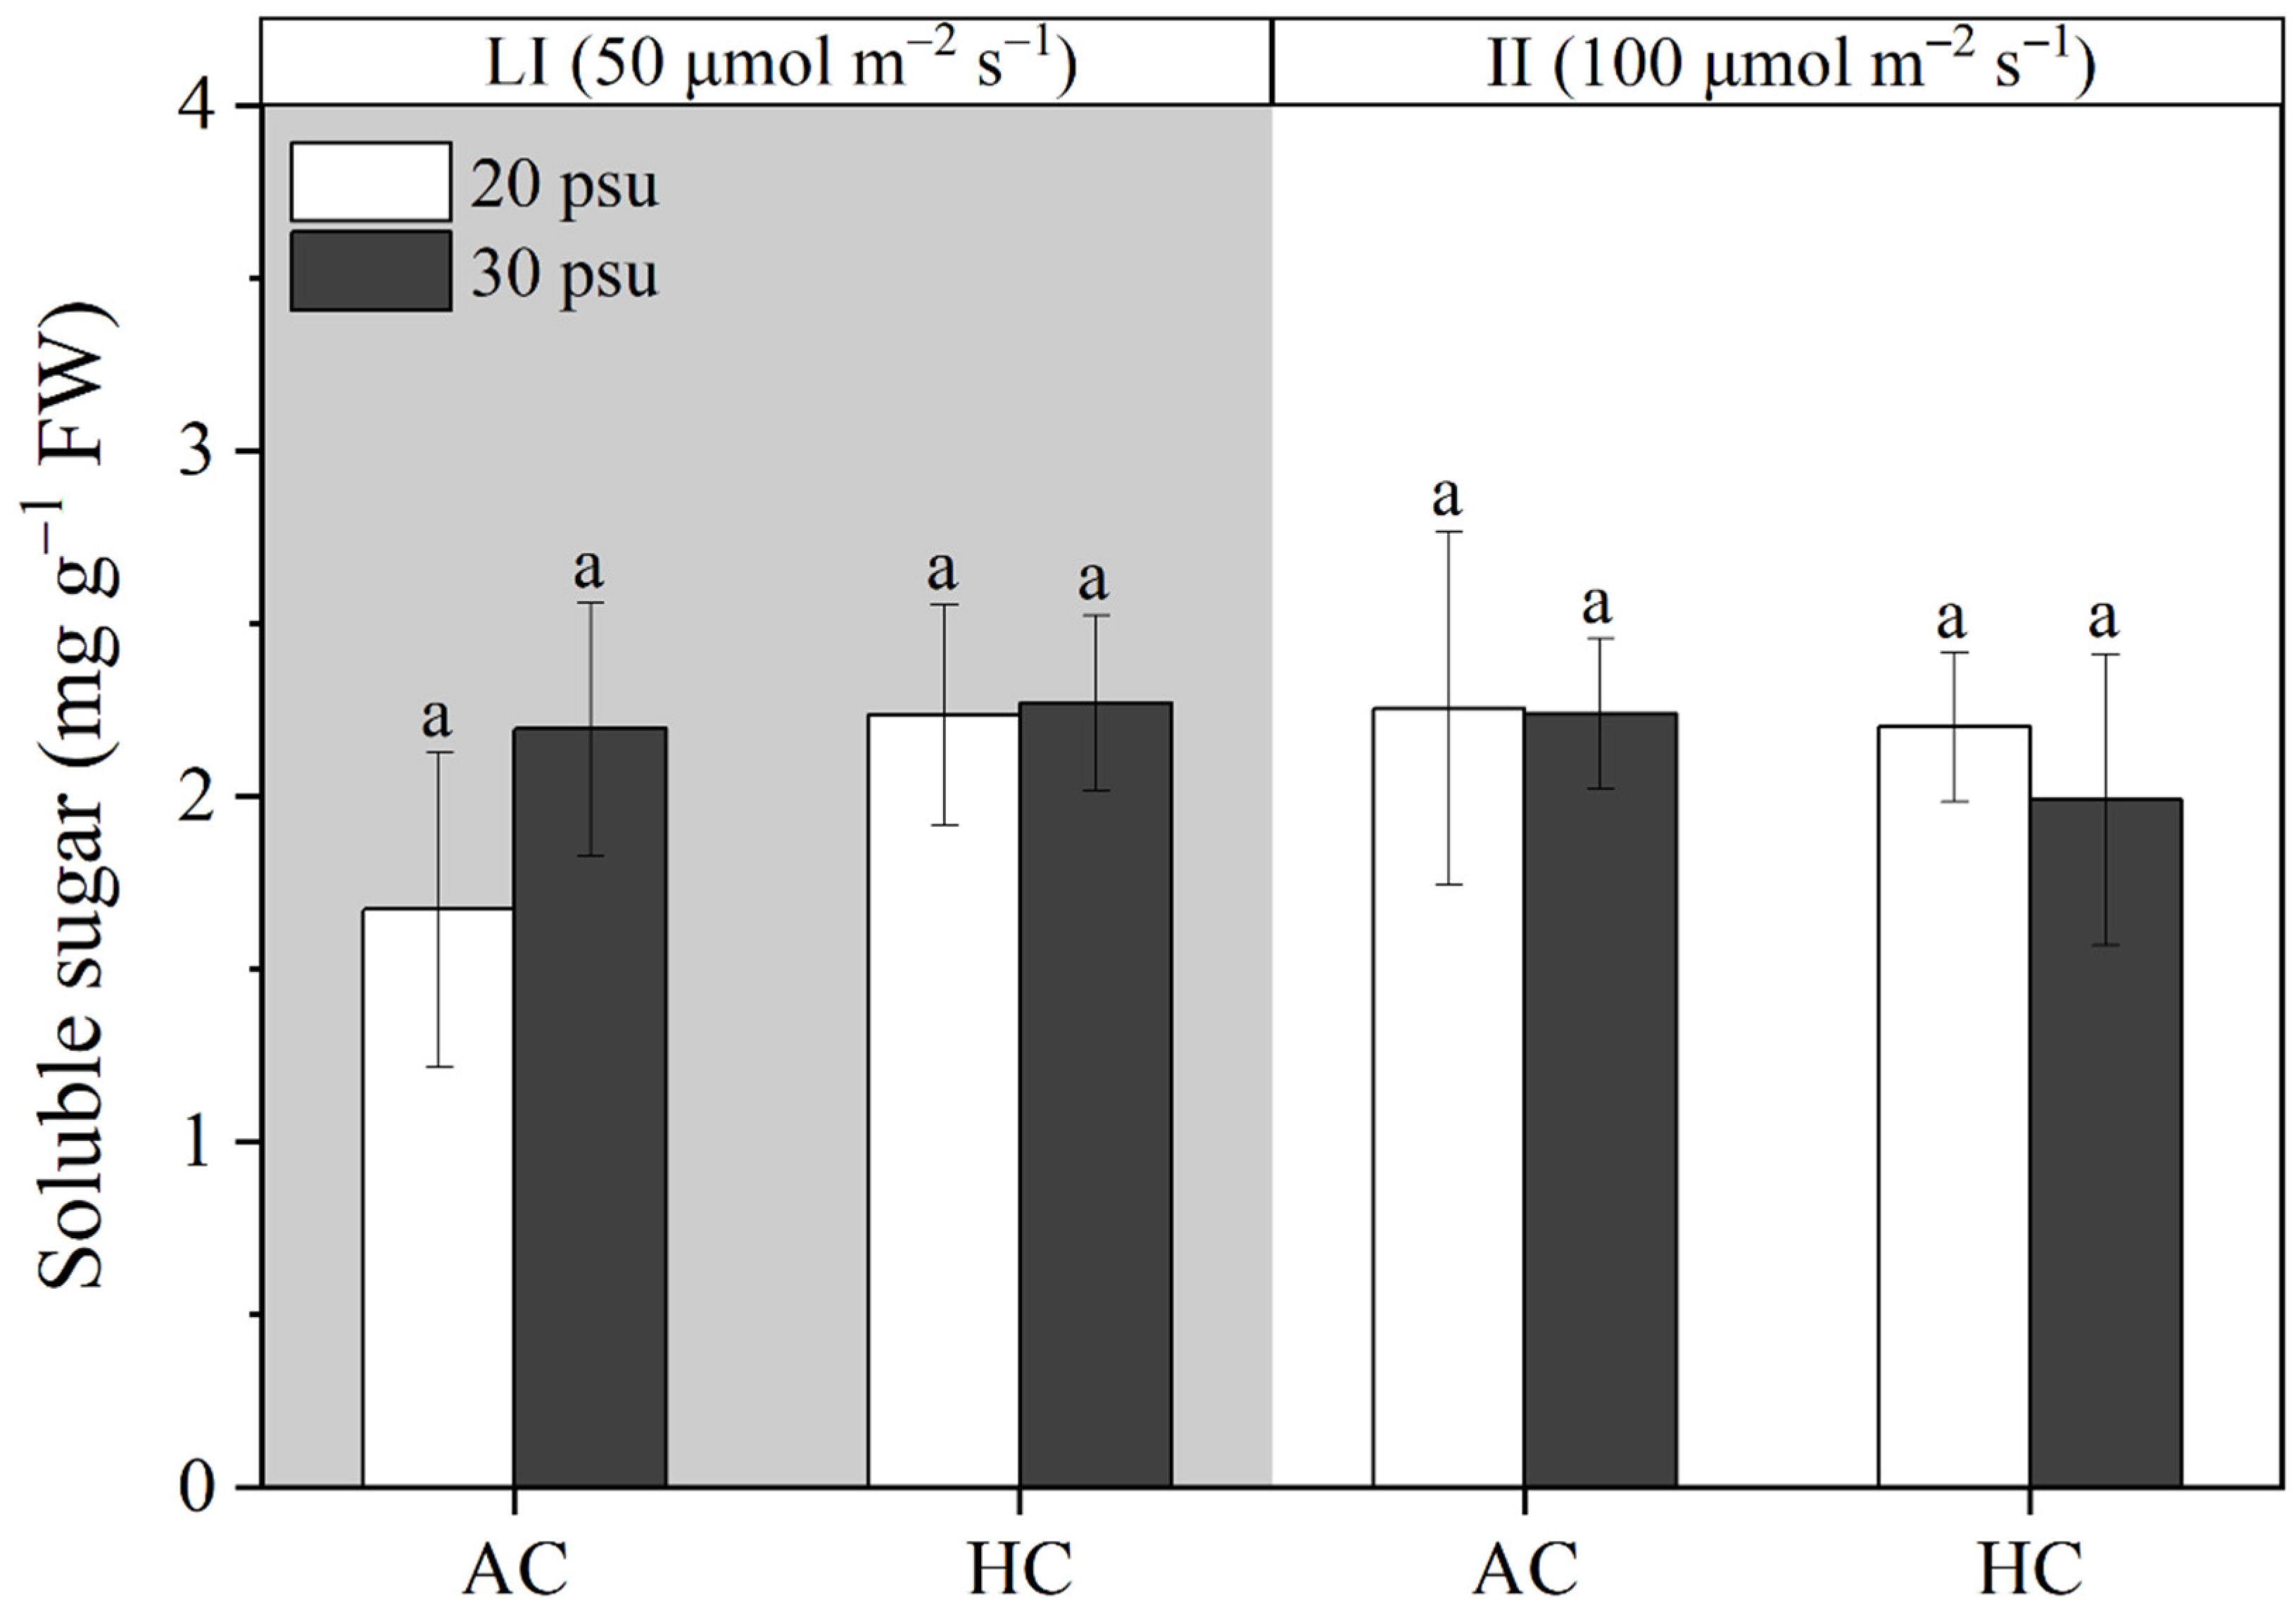
3.5. Soluble Sugar Content
4. Discussions
Supplementary Materials
Author Contributions
Funding
Data Availability Statement
Conflicts of Interest
References
- Wiencke, C.; Bischof, K. Seaweed Biology: Novel Insights into Ecophysiology, Ecology and Utilization; Springer Science & Business Media: Berlin, Germany, 2012; Volume 219. [Google Scholar]
- Krause-Jensen, D.; Duarte, C.M. Substantial role of macroalgae in marine carbon sequestration. Nat. Geosci. 2016, 9, 737–742. [Google Scholar] [CrossRef]
- Ortega, A.; Geraldi, N.R.; Alam, I.; Kamau, A.A.; Acinas, S.G.; Logares, R.; Gasol, J.M.; Massana, R.; Krause-Jensen, D.; Duarte, C.M. Important contribution of macroalgae to oceanic carbon sequestration. Nat. Geosci. 2019, 12, 748–754. [Google Scholar] [CrossRef]
- Gao, G.; Clare, A.S.; Rose, C.; Caldwell, G.S. Ulva rigida in the future ocean: Potential for carbon capture, bioremediation and biomethane production. Glob. Chang. Biol. Bioenergy 2018, 10, 39–51. [Google Scholar] [CrossRef]
- Li, X.; Sun, X.; Gao, L.; Xu, J.; Gao, G. Effects of periodical dehydration on biomass yield and biochemical composition of the edible red alga Pyropia yezoensis grown at different salinities. Algal Res. 2021, 56, 102315. [Google Scholar] [CrossRef]
- Sutherland, J.E.; Lindstrom, S.C.; Nelson, W.A.; Brodie, J.; Lynch, M.D.; Hwang, M.S.; Choi, H.G.; Miyata, M.; Kikuchi, N.; Oliveira, M.C. A new look at an ancient order: Generic revision of the Bangiales (Rhodophyta). J. Phycol. 2011, 47, 1131–1151. [Google Scholar] [CrossRef] [PubMed]
- FAO. The State of World Fisheries and Aquaculture 2020. Sustainability in Action; FAO: Rome, Italy, 2020. [Google Scholar] [CrossRef]
- Zhang, T.; Li, J.; Ma, F.; Lu, Q.; Shen, Z.; Zhu, J. Study of photosynthetic characteristics of the Pyropia yezoensis thallus during the cultivation process. J. Appl. Phycol. 2014, 26, 859–865. [Google Scholar] [CrossRef]
- Li, X.; Yang, L.; He, P.M. Formation and growth of free-living conchosporangia of Porphyra yezoensis: Effects of photoperiod, temperature and light intensity. Aquac. Res. 2011, 42, 1079–1086. [Google Scholar] [CrossRef]
- Zhang, T.; Shen, Z.; Xu, P.; Zhu, J.; Lu, Q.; Shen, Y.; Wang, Y.; Yao, C.; Li, J.; Wang, Y. Analysis of photosynthetic pigments and chlorophyll fluorescence characteristics of different strains of Porphyra yezoensis. J. Appl. Phycol. 2012, 24, 881–886. [Google Scholar] [CrossRef]
- Doney, S.C.; Busch, D.S.; Cooley, S.R.; Kroeker, K.J. The impacts of ocean acidification on marine ecosystems and reliant human communities. Annu. Rev. Environ. Resour. 2020, 45, 83–112. [Google Scholar] [CrossRef]
- Gattuso, J.-P.; Magnan, A.; Billé, R.; Cheung, W.W.; Howes, E.L.; Joos, F.; Allemand, D.; Bopp, L.; Cooley, S.R.; Eakin, C.M. Contrasting futures for ocean and society from different anthropogenic CO2 emissions scenarios. Science 2015, 349, aac4722. [Google Scholar] [CrossRef]
- Orr, J.C.; Fabry, V.J.; Aumont, O.; Bopp, L.; Doney, S.C.; Feely, R.A.; Gnanadesikan, A.; Gruber, N.; Ishida, A.; Joos, F. Anthropogenic ocean acidification over the twenty-first century and its impact on calcifying organisms. Nature 2005, 437, 681–686. [Google Scholar] [CrossRef] [PubMed]
- Cai, W.-J.; Hu, X.; Huang, W.-J.; Murrell, M.C.; Lehrter, J.C.; Lohrenz, S.E.; Chou, W.-C.; Zhai, W.; Hollibaugh, J.T.; Wang, Y. Acidification of subsurface coastal waters enhanced by eutrophication. Nat. Geosci. 2011, 4, 766–770. [Google Scholar] [CrossRef]
- Ji, Y.; Xu, Z.; Zou, D.; Gao, K. Ecophysiological responses of marine macroalgae to climate change factors. J. Appl. Phycol. 2016, 28, 2953–2967. [Google Scholar] [CrossRef]
- Sunday, J.M.; Fabricius, K.E.; Kroeker, K.J.; Anderson, K.M.; Brown, N.E.; Barry, J.P.; Connell, S.D.; Dupont, S.; Gaylord, B.; Hall-Spencer, J.M. Ocean acidification can mediate biodiversity shifts by changing biogenic habitat. Nat. Clim. Chang. 2017, 7, 81–85. [Google Scholar] [CrossRef]
- Albright, R.; Takeshita, Y.; Koweek, D.A.; Ninokawa, A.; Wolfe, K.; Rivlin, T.; Nebuchina, Y.; Young, J.; Caldeira, K. Carbon dioxide addition to coral reef waters suppresses net community calcification. Nature 2018, 555, 516–519. [Google Scholar] [CrossRef]
- Xu, D.; Schaum, C.E.; Lin, F.; Sun, K.; Munroe, J.R.; Zhang, X.W.; Fan, X.; Teng, L.H.; Wang, Y.T.; Zhuang, Z.M. Acclimation of bloom-forming and perennial seaweeds to elevated pCO2 conserved across levels of environmental complexity. Glob. Chang. Biol. 2017, 23, 4828–4839. [Google Scholar] [CrossRef]
- Gao, K.; Aruga, Y.; Asada, K.; Kiyohara, M. Influence of enhanced CO2 on growth and photosynthesis of the red algae Gracilaria sp. and G. chilensis. J. Appl. Phycol. 1993, 5, 563–571. [Google Scholar] [CrossRef]
- Zou, D.; Gao, K. Effects of elevated CO2 on the red seaweed Gracilaria lemaneiformis (Gigartinales, Rhodophyta) grown at different irradiance levels. Phycologia 2009, 48, 510–517. [Google Scholar] [CrossRef]
- Walker, B.J.; Strand, D.D.; Kramer, D.M.; Cousins, A.B. The response of cyclic electron flow around photosystem I to changes in photorespiration and nitrate assimilation. Plant Physiol. 2014, 165, 453–462. [Google Scholar] [CrossRef]
- Li, H.; Beardall, J.; Gao, K. Photoinhibition of the picophytoplankter Synechococcus is exacerbated by ocean acidification. Water 2023, 15, 1228. [Google Scholar] [CrossRef]
- Asada, K. Production and scavenging of reactive oxygen species in chloroplasts and their functions. Plant Physiol. 2006, 141, 391–396. [Google Scholar] [CrossRef] [PubMed]
- Xie, X.; Lu, X.; Wang, L.; He, L.; Wang, G. High light intensity increases the concentrations of β-carotene and zeaxanthin in marine red macroalgae. Algal Res. 2020, 47, 101852. [Google Scholar] [CrossRef]
- Bao, M.; Wang, J.; Xu, T.; Wu, H.; Li, X.; Xu, J. Rising CO2 levels alter the responses of the red macroalga Pyropia yezoensis under light stress. Aquaculture 2019, 501, 325–330. [Google Scholar] [CrossRef]
- Chen, C.; Zhang, Y.; Feng, Z.; Wu, M.; Xu, T.; Qiao, S.; Wang, W.; Ma, J.; Xu, J. Photosynthetic physiological response of Porphyra yezoensis to light change at different CO2 concentrations. Water 2023, 15, 781. [Google Scholar] [CrossRef]
- Lee, Y.-H.; Kim, D.-J.; Kim, H.-K. Characteristics of the seawater quality variation on the South Coastal Area of Korea. KSCE J. Civ. Eng. 2003, 7, 123–130. [Google Scholar] [CrossRef]
- Karsten, U. Seaweed acclimation to salinity and desiccation stress. In Seaweed Biology: Novel Insights into Ecophysiology, Ecology and Utilization; Springer: Berlin/Heidelberg, Germany, 2012; pp. 87–107. [Google Scholar]
- Wu, H.; Shin, S.K.; Jang, S.; Yarish, C.; Kim, J.K.; Wu, H.; Shin, S.K.; Jang, S.; Yarish, C.; Kim, J.K. Growth and nutrient bioextraction of Gracilaria chorda, G. vermiculophylla, Ulva prolifera, and U. compressa under hypo-and hyper-osmotic conditions. Algae 2018, 33, 329–340. [Google Scholar] [CrossRef]
- Fong, P.; Boyer, K.E.; Desmond, J.S.; Zedler, J.B. Salinity stress, nitrogen competition, and facilitation: What controls seasonal succession of two opportunistic green macroalgae? J. Exp. Mar. Biol. Ecol. 1996, 206, 203–221. [Google Scholar] [CrossRef]
- Kumar, M.; Kumari, P.; Gupta, V.; Reddy, C.; Jha, B. Biochemical responses of red alga Gracilaria corticata (Gracilariales, Rhodophyta) to salinity induced oxidative stress. J. Exp. Mar. Biol. Ecol. 2010, 391, 27–34. [Google Scholar] [CrossRef]
- Samanta, P.; Shin, S.; Jang, S.; Kim, J.K. Comparative assessment of salinity tolerance based on physiological and biochemical performances in Ulva australis and Pyropia yezoensis. Algal Res. 2019, 42, 101590. [Google Scholar] [CrossRef]
- Provasoli, L.J.C.; Algae, C.O. Media and prospects for the cultivation of marine algae. In Cultures and Collections of Algae, Proceedings of United States and Japan Conference, Hakone, Japan, September 1966; Japan Society of Plant Physiology: Tokyo, Japan, 1968; pp. 63–75. [Google Scholar]
- Gao, G.; Qu, L.; Xu, T.; Burgess, J.G.; Li, X.; Xu, J. Future CO2-induced ocean acidification enhances resilience of a green tide alga to low-salinity stress. ICES J. Mar. Sci. 2019, 76, 2437–2445. [Google Scholar] [CrossRef]
- Lewis, E.; Wallace, D. Program Developed for CO2 System Calculations; Environmental System Science Data Infrastructure for a Virtual Ecosystem (ESS-DIVE): United States, 1998. Available online: https://www.osti.gov/dataexplorer/biblio/dataset/1464255 (accessed on 18 October 2023).
- Genty, B.; Briantais, J.-M.; Baker, N.R. The relationship between the quantum yield of photosynthetic electron transport and quenching of chlorophyll fluorescence. Biochim. Biophys. Acta-Gen. Subj. 1989, 990, 87–92. [Google Scholar] [CrossRef]
- Eilers, P.; Peeters, J. A model for the relationship between light intensity and the rate of photosynthesis in phytoplankton. Ecol. Model. 1988, 42, 199–215. [Google Scholar] [CrossRef]
- Jassby, A.D.; Platt, T. Mathematical formulation of the relationship between photosynthesis and light for phytoplankton. Limnol. Oceanogr. 1976, 21, 540–547. [Google Scholar] [CrossRef]
- Wellburn, A.R. The spectral determination of chlorophylls a and b, as well as total carotenoids, using various solvents with spectrophotometers of different resolution. J. Plant Physiol. 1994, 144, 307–313. [Google Scholar] [CrossRef]
- Beer, S.; Eshel, A. Determining phycoerythrin and phycocyanin concentrations in aqueous crude extracts of red algae. Mar. Freshw. Res. 1985, 36, 785. [Google Scholar] [CrossRef]
- Loewus, F.A. Improvement in anthrone method for determination of carbohydrates. Anal. Chem. 1952, 24, 219. [Google Scholar] [CrossRef]
- Blouin, N.A.; Brodie, J.A.; Grossman, A.C.; Xu, P.; Brawley, S.H. Porphyra: A marine crop shaped by stress. Trends Plant Sci. 2011, 16, 29–37. [Google Scholar] [CrossRef]
- Wang, W.-J.; Sun, X.-T.; Liu, F.-L.; Liang, Z.-R.; Zhang, J.-H.; Wang, F.-J. Effect of abiotic stress on the gameophyte of Pyropia katadae var. hemiphylla (Bangiales, Rhodophyta). J. Appl. Phycol. 2016, 28, 469–479. [Google Scholar] [CrossRef]
- Hurd, C.L.; Harrison, P.J.; Bischof, K.; Lobban, C.S. Seaweed Ecology and Physiology; Cambridge University Press: Cambridge, UK, 2014. [Google Scholar]
- Kumar, M.; Kumari, P.; Reddy, C.; Jha, B. Salinity and desiccation induced oxidative stress acclimation in seaweeds. In Advances in Botanical Research; Elsevier: Amsterdam, The Netherlands, 2014; Volume 71, pp. 91–123. [Google Scholar]
- Qu, L.; Beardall, J.; Jiang, X.; Gao, K. Elevated pCO2 enhances under light but reduces in darkness the growth rate of a diatom, with implications for the fate of phytoplankton below the photic zone. Limnol. Oceanogr. 2021, 66, 3630–3642. [Google Scholar] [CrossRef]
- Liu, C.; Zou, D.; Yang, Y. Comparative physiological behaviors of Ulva lactuca and Gracilariopsis lemaneiformis in responses to elevated atmospheric CO2 and temperature. Environ. Sci. Pollut. Res. 2018, 25, 27493–27502. [Google Scholar] [CrossRef]
- Liu, C.; Zou, D.; Liu, Z.; Ye, C. Ocean warming alters the responses to eutrophication in a commercially farmed seaweed, Gracilariopsis lemaneiformis. Hydrobiologia 2020, 847, 879–893. [Google Scholar] [CrossRef]
- Raven, J.A.; Hurd, C.L. Ecophysiology of photosynthesis in macroalgae. Photosynth. Res. 2012, 113, 105–125. [Google Scholar] [CrossRef]
- Olischläger, M.; Wiencke, C. Ocean acidification alleviates low-temperature effects on growth and photosynthesis of the red alga Neosiphonia harveyi (Rhodophyta). J. Exp. Bot. 2013, 64, 5587–5597. [Google Scholar] [CrossRef] [PubMed]
- Gao, G.; Gao, Q.; Bao, M.; Xu, J.; Li, X. Nitrogen availability modulates the effects of ocean acidification on biomass yield and food quality of a marine crop Pyropia yezoensis. Food Chem. 2019, 271, 623–629. [Google Scholar] [CrossRef] [PubMed]
- Wu, H.; Jiang, H.; Liu, C.; Deng, Y. Growth, pigment composition, chlorophyll fluorescence and antioxidant defenses in the red alga Gracilaria lemaneiformis (Gracilariales, Rhodophyta) under light stress. S. Afr. J. Bot. 2015, 100, 27–32. [Google Scholar] [CrossRef]
- Zou, D.; Gao, K. Photosynthetic acclimation to different light levels in the brown marine macroalga, Hizikia fusiformis (Sargassaceae, Phaeophyta). J. Appl. Phycol. 2010, 22, 395–404. [Google Scholar] [CrossRef]
- Sfriso, A.A.; Gallo, M.; Baldi, F. Phycoerythrin productivity and diversity from five red macroalgae. J. Appl. Phycol. 2018, 30, 2523–2531. [Google Scholar] [CrossRef]


| Treatment | pH | TA (μM) | HCO3− (μM) | CO32− (μM) | CO2 (μM) | DIC (μM) |
|---|---|---|---|---|---|---|
| LS-50-AC | 8.08 ± 0.06 a | 1555.8 ± 92.9 a | 1355.0 ± 100.1 a | 80.38 ± 6.31 a | 11.96 ± 2.21 a | 1447.4 ± 100.1 a |
| LS-100-AC | 8.07 ± 0.01 a | 1551.6 ± 66.0 a | 1352.8 ± 60.5 a | 79.61 ± 3.47 a | 11.92 ± 0.71 a | 1444.3 ± 64.0 a |
| HS-50-AC | 8.12 ± 0.01 a | 2034.0 ± 49.0 b | 1670.1 ± 37.4 b | 144.99 ± 5.88 b | 11.56 ± 0.24 a | 1826.6 ± 42.8 b |
| HS-100-AC | 8.11 ± 0.01 a | 2010.6 ± 150.3 b | 1659.3 ± 131.0 b | 139.62 ± 10.36 b | 11.85 ± 1.08 a | 1810.8 ± 141.8 b |
| LS-50-HC | 7.71 ± 0.01 c | 1464.8 ± 33.8 a | 1376.4 ± 32.2 a | 34.90 ± 0.95 c | 28.14 ± 0.83 b | 1439.5 ± 33.7 a |
| LS-100-HC | 7.72 ± 0.02 c | 1426.3 ± 30.2 a | 1336.8 ± 28.3 a | 35.16 ± 1.92 c | 26.37 ± 1.05 b | 1398.3 ± 29.6 a |
| HS-50-HC | 7.82 ± 0.02 d | 1902.4 ± 9.5 b | 1713.8 ± 10.0 b | 74.00 ± 2.41 a | 23.87 ± 0.93 b | 1811.7 ± 9.9 b |
| HS-100-HC | 7.82 ± 0.01 d | 1917.9 ± 11.6 b | 1726.8 ± 10.4 b | 75.12 ± 1.74 a | 23.86 ± 0.59 b | 1825.8 ± 11.0 b |
| Treatment | rETRmax | α | Ik |
|---|---|---|---|
| LS-50-AC | 71.17 ± 3.82 ab | 0.16 ± 0.02 a | 458.0 ± 24.4 be |
| LS-100-AC | 60.57 ± 6.11 d | 0.15 ± 0.01 a | 400.0 ± 16.7 ce |
| HS-50-AC | 85.02 ± 8.34 a | 0.14 ± 0.01 ac | 605.8 ± 94.5 a |
| HS-100-AC | 75.75 ± 1.59 bc | 0.16 ± 0.01 a | 488.1 ± 13.9 bcf |
| LS-50-HC | 69.42 ± 3.22 bc | 0.12 ± 0.01 bc | 564.6 ± 29.1 af |
| LS-100-HC | 57.31 ± 2.88 d | 0.15 ± 0.02 a | 386.1 ± 83.8 de |
| HS-50-HC | 77.50 ± 2.71 ac | 0.16 ± 0.02 a | 495.7 ± 35.3 b |
| HS-100-HC | 69.11 ± 5.93 b | 0.17 ± 0.02 a | 418.5 ± 50.7 be |
Disclaimer/Publisher’s Note: The statements, opinions and data contained in all publications are solely those of the individual author(s) and contributor(s) and not of MDPI and/or the editor(s). MDPI and/or the editor(s) disclaim responsibility for any injury to people or property resulting from any ideas, methods, instructions or products referred to in the content. |
© 2023 by the authors. Licensee MDPI, Basel, Switzerland. This article is an open access article distributed under the terms and conditions of the Creative Commons Attribution (CC BY) license (https://creativecommons.org/licenses/by/4.0/).
Share and Cite
Wu, H.; Wang, C.; Li, H.; Chen, J.; Zhang, J.; Luo, Z.; Cheng, F.; Xu, J. High Light Intensity and CO2 Enrichment Synergistically Mitigated the Stress Caused by Low Salinity in Pyropia yezoensis. J. Mar. Sci. Eng. 2023, 11, 2193. https://doi.org/10.3390/jmse11112193
Wu H, Wang C, Li H, Chen J, Zhang J, Luo Z, Cheng F, Xu J. High Light Intensity and CO2 Enrichment Synergistically Mitigated the Stress Caused by Low Salinity in Pyropia yezoensis. Journal of Marine Science and Engineering. 2023; 11(11):2193. https://doi.org/10.3390/jmse11112193
Chicago/Turabian StyleWu, Hailong, Chuchu Wang, He Li, Jiang Chen, Jiankai Zhang, Zixue Luo, Fangsheng Cheng, and Juntian Xu. 2023. "High Light Intensity and CO2 Enrichment Synergistically Mitigated the Stress Caused by Low Salinity in Pyropia yezoensis" Journal of Marine Science and Engineering 11, no. 11: 2193. https://doi.org/10.3390/jmse11112193