
Effects of Gurney Flaps on the Performance of a Horizontal Axis Ocean Current Turbine

1
School of Marine Science and Technology, Northwestern Polytechnical University, Xi’an 710072, China
2
Key Laboratory for Unmanned Underwater Vehicle, Northwestern Polytechnical University, Xi’an 710072, China
3
Unmanned System Research Institute, Northwestern Polytechnical University, Xi’an 710072, China
*
Author to whom correspondence should be addressed.
J. Mar. Sci. Eng. 2023, 11(11), 2188; https://doi.org/10.3390/jmse11112188
Submission received: 23 October 2023
/
Revised: 14 November 2023
/
Accepted: 15 November 2023
/
Published: 17 November 2023
(This article belongs to the Section Ocean Engineering)
Abstract
:Gurney flaps can enhance the hydrodynamic efficiency of airfoils, and they are currently used in several applications, including racing cars and wind turbines. However, there is a lack of studies in the literature on the application of Gurney flaps on the Horizontal Axis Ocean Current Turbine (HAOCT). The influence of Gurney flaps on the hydrodynamic efficiency of the HAOCT is evaluated through numerical analysis. The effect of the Gurney flaps on the turbine is evaluated after the validation of the utilized numerical method is completed using the wind tunnel experimental data of the two-dimensional NACA 63415 airfoil and the water tunnel experimental data of the NACA 638xx series rotor on the clean blade. By calculating the velocity and pressure fields of the 2D airfoil by CFD, it was possible to analyze the lift improvement with the addition of the Gurney flaps by evaluating the pressure difference between the pressure surface and the negative pressure surface, and the drag improvement was due to the Gurney flaps obstructing the chordal flow of the fluid in the wake. For the 2D NACA-63415 airfoil, the drag coefficient increases with the increase in the head angle, while the lift coefficient increases and then decreases. The flap height divided by the local chord length of the Gurney flaps is 0.01, and the lift-to-drag ratio is the highest when the head angle is 4°. For the NACA-638xx turbine, the addition of Gurney flaps significantly increases the axial thrust coefficient. At lower tip speed ratios, the effect of the Gurney flaps on the rotor’s power coefficient is limited, with the greatest increase in the power coefficient at a tip speed ratio of 6 and a decrease in the power coefficient increase as the tip speed ratio increases. Increasing the height of the Gurney flaps can increase the peak power coefficient, but the power performance decreases at high tip speed ratios. The Gurney flaps distributed at the root of the rotor have less effect on the power performance. A 0.4 local radius spread of the Gurney flaps increases the peak turbine power coefficient by only 0.34%, while full-length Gurney flaps can increase the peaked blade power coefficient by 10.68%, indicating that Gurney flaps can be used to design a new HAOCT.
1. Introduction
The research on and development of renewable energy sources have made great progress in recent years against the backdrop of continuous growth in global fossil fuel consumption [1,2]. Ocean current energy stands out among the many renewable energy sources due to its high energy density and high storage capacity [3]. Ocean current energy contains a large amount of kinetic energy, and the function of Ocean Current Turbines (OCTs) is to convert that kinetic energy into electrical energy that can be more easily controlled and converted.
There are two mainstream OCTs [4]. One type is Horizontal Axis Ocean Current Turbines (HAOCTs) [5], where the rotation axis of the turbine is parallel to the direction of the incoming flow. Another type is Vertical Axis Ocean Current Turbines (VAOCTs) [6]. VAOCTs are insensitive to changes in the relative direction of the fluid flow and have the advantage of starting from low flow rates. Yang et al. [7] proposed a design scheme to improve the hydrodynamic performance of the turbine by controlling the blades through cam plates by opening and closing the blades. Tigabu et al. [8] provided a guideline for the design of the turbine by changing the turbine inertia by varying the density of the blades in order to balance the overshoot and to minimize the start-up time.
HAOCTs are a focus of attention because they have better energy efficiency performance and stability of operation [9]. A number of passive control methods have been used. Common passive flow control methods include vortex generators [10], leading-edge tubercles [11], Gurney flaps [12], slotted blading [13], winglets [14], and so on. Among them, the Gurney flap has the advantages of being able to improve the lift performance of the winglet and increase the lift-to-drag ratio [15], which can significantly enhance the hydrodynamic performance of the turbine; thus, it is favored by scholars.
Gurney flaps were invented by Dan Gurney to enhance handling by increasing the downforce on a race car by installing a narrow plate oriented with respect to the vertical chord length on the trailing edge of the race car’s trailing edge [16]. Gurney flaps increase lift by increasing the pressure difference between the two sides of the airfoil, while being able to increase the lift-to-drag ratio substantially under certain conditions. Nowadays, the research on Gurney flaps is mainly focused on the airfoil [17]. The aerodynamic performance of the NACA 0012 airfoil with Gurney flaps under rain and icing conditions has been studied [18].
Recently, Gurney flaps have been applied to rotating machines such as wind turbines [19]. Ye et al. [20] proposed a novel serrated Gurney flap for acoustic noise reduction at different angles of attack. Syawitri et al. [21] studied a VAWT with a Gurney flap through a transient RANS simulation and a stress-blended eddy simulation (SBES) turbulence model, which was used to simulate the power coefficient of a VAWT with a Gurney flap. A VAWT with a Gurney flap can significantly increase the power coefficient at a low TSR, but the power coefficient increase decreases with the increasing TSR [22]. The Gurney flap increases the power coefficients of the rotor of a Horizontal Axis Wind Turbine (HAWT) by 21% [23] and the rotor of a Vertical Axis Wind Turbine (VAWT) by 17.92% [24]. The Gurney flap also can be used with a Wells turbine blade for harvesting wave energy [25].
Through a summary of the research literature, it was found that the Gurney flaps are mainly used in vertical axis turbines, but the research on three-dimensional horizontal axis turbines at low Reynolds numbers is limited. In this paper, a type of HAOCT blade with a Gurney flap structure is proposed. This paper includes the following three main aspects:
- The effect of Gurney flap height on the hydrodynamic characteristics of the airfoil at different angles of approach.
- The relationship between the dynamic performance of the airfoil and the Gurney flap height.
- The effect of different radial lengths of Gurney flaps on the hydrodynamic performance of the airfoil.
2. Geometric Description
2.1. HAOCT Rotor Model
The HAOCT model used in this paper is a rotor model consisting of a three-bladed rotor with blades made up of NACA 63-8xx series airfoils [26]. Detailed experimental measurements of the non-stationary hydrodynamics of this turbine are provided in reference [27]. In order to facilitate the addition of Gurney flaps at the root of the blades, all components remain unchanged except for the hub diameter, which is changed from 0.08 m to 0.1 m, as shown in Figure 1. The specific values of the rotor are shown in Table 1.
2.2. Gurney Flaps
The Gurney flap is perpendicular to the trailing edge of the airfoil and located on the side of the positive pressure plane, as shown in Figure 1. The height of the flap is defined as h. The height scale of the Gurney flap is determined according to the research of Chandrasekhara [28]. The thickness of the flap is 0.002. is the local chord length. has different values for different radial positions. Therefore, the Gurney flap has different actual heights for different radial positions. The data on the chord, angle of twist, and thickness of the blade section airfoils are given in reference [26]. The data on the maximum bending position and thickness of NACA 63-815 are given in reference [29]. The radial length of the Gurney flap is l. The range of variation of l and is shown in Table 1. In this paper, the HAOCT rotor without the Gurney flap ( = 0, l = 0) is called a clean rotor.
2.3. Coefficients for Performance
The tip speed ratio (TSR) is a dimensionless number that is the ratio of the tip speed to the inflow flow rate. For the same inflow flow rate, a larger tip speed ratio implies a higher rotor speed, and the tip speed ratio (TSR) is defined as follows:
where is the rotor speed, is the inflow flow rate, and is the rotor radius.
The hydrodynamic performance of the HAOCT rotor can be characterized by two main metrics: the trend of the power coefficient () and the thrust coefficient () with respect to the TSR. The power coefficient () and the thrust coefficient () are defined as follows:
where is the water density, and and are the rotor power and thrust, respectively.
3. Numerical Method
This paper investigates the effect of Gurney flaps on the performance of HAOCT rotor blades and performs 2D and 3D CFD simulations. The CFD model solves the Reynolds-averaged Navier–Stokes (RANS) equations using a second-order accurate finite-volume discretization scheme. The turbulence term of the RANS equations is simulated by the shear stress transport (SST) k-ω turbulence model. The SST k-ω turbulence model can successfully simulate the turbulent shear stress transport [30]. Providing different speeds for the rotor depends on the multiple reference frame (MRF) method.
3.1. Computation Domain and Boundary Conditions
The region surrounding the HAOCT is the rotational domain that serves as the MRF region, while the region surrounding the rotational domain is the stationary domain. The rotational domain has different rotation speeds in order to simulate the rotation of the rotor. The computational domain is a cylinder with a length of 12D and a diameter of 6D containing the rotational and stationary domains, as shown in Figure 2. The rotation axis of the rotor coincides with the center axis of the computational domain. The area of the rotor disk is 2.78% of the velocity inlet area; so, the effect of the side walls is negligible.
The inlet velocity is a constant velocity of 1.73 m/s, and the turbulence intensity at the velocity inlet boundary is 1%. The outlet pressure is 0 Pa with respect to the atmospheric pressure. The interface is an overlapping surface, which allows the flow characteristics to be transferred between the two domains between the rotating and stationary domains. The no-slip wall boundary is applied to the blade surface. The smooth wall boundaries (zero shear) are applied to the cylindrical surface in the stationary domain.
3.2. Mesh Generation
The quality of the computational mesh will greatly affect the accuracy of the CFD results. In this paper, a high-quality structured mesh was generated using the ANSYS ICEM tool, as shown in Figure 3. The highest mesh density is located close to the blade. The boundary layer flow is described by a prismatic layer mesh, which significantly improves the mesh quality. In addition, the downstream region of the rotor is optimized to capture small flow structures in the rotor wake.
Analyzing the distribution of pressure coefficients on the positive and negative pressure surfaces of the airfoil helps in the in-depth study of the effect of Gurney flaps on the hydrodynamics of the airfoil. The computational domain of the two-dimensional airfoil in this paper is shown in Figure 4 The chord length of the airfoil is 600 mm, the mesh boundary corresponding to the leading edge of the airfoil is the velocity inlet, and the distance between the velocity inlet and the airfoil is 15 . The outlet is the mesh boundary corresponding to the trailing edge of the airfoil, and the distance between the outlet and the airfoil is 25 . The mesh boundary corresponding to the positive and negative pressure surfaces of the airfoil is a smooth wall boundary (zero shear), and the distance between the wall and the airfoil is 15 . The airfoil mesh is generated by the ANSYS ICEM tool. A boundary layer is placed around the airfoil. The region around the airfoil is refined.
3.3. Solution Settings and Validation of Numerical Methods
This article uses the coupled pressure–velocity method in two-dimensional and three-dimensional numerical simulations for quick convergence. A steady-state solver is employed in the simulations, and the equations for pressure and momentum are discretized using a second-order upwind space discretization algorithm. The scalar residual is less than 1 × 10⁻⁵. The gradient uses the least-squares cell-based algorithm.
In this study, in order to validate the numerical method, the rotor consisting of the NACA 63-8xx series blades is validated, and Figure 5 shows the power coefficients and thrust coefficients derived using this CFD method in comparison with the experimental results [26]. It can be seen that the power coefficients in the range were validated and had a deviation of less than 5% (TSR 6–9). Overall, the accuracy of the prediction results of the numerical methods in this study is acceptable.
In addition, this paper calculates the coefficient of the pressure number distribution curves for the NACA 63-415 2D airfoils and compares the calculated simulation data with the experimental data [31] for the three cases of the 4°, 12°, and 16° angles of attack of the airfoil, respectively. The inlet velocity is 40 m/s, and the turbulence intensity at the velocity inlet boundary is 1%. As shown in Figure 6, the simulation method used in this article is very consistent with the experimental results, indicating that the simulation method used in this paper can meet the required accuracy.
4. Results and Discussion
4.1. Hydrodynamic Performance of Gurney Flaps Height
The height of the Gurney flaps has a major impact on the lift and drag of the NACA-63815 airfoil. When comparing the clean airfoil with the airfoil equipped with the Gurney flaps, their lift and drag coefficients follow similar trends with the angle of attack. However, the difference lies in the fact that higher Gurney flaps enable the airfoil to achieve its maximum lift coefficient earlier. For instance, when the height of the Gurney flaps is h/c = 0.03 and the angle of attack is 10°, the maximum lift coefficient can be reached. On the other hand, the clean airfoil only reaches its maximum lift coefficient at an angle of attack of 14°. Airfoils with Gurney flap heights of h/c = 0.03 and 0.02 will enter a stalled state when the angle of attack is greater than 16 °, while clean and h/c = 0.01 airfoils will enter a stalled state when the angle of attack is greater than 18 °. In the range of an attack angle from 26 ° to 30 °, the lift and drag values of the airfoils with Gurney flaps are higher than those of the clean airfoils, and the higher the height of the Gurney flaps, the greater the lift and drag, as shown in Figure 7a,b. In the range of an attack angle from 0 ° to 6 °, increasing the Gurney flap can significantly improve the lift–drag ratio of the airfoil. When the attack angle is 4 °, the lift–drag ratio can be increased by 12.19%. However, as the angle of attack continues to increase and the Gurney flaps increase, the speed of the drag growth is faster; so, the lift–drag ratio will slightly decrease. Until the angle of attack increases to the point where the blades stall, the presence of Gurney flaps on the airfoil has little effect on the lift–drag ratio, as shown in Figure 7c.
By analyzing the velocity fields of the airfoil at the 0°, 10°, and 30° angles of attack, it is clear that with the addition of the Gurney flaps, the airfoil will have a significant flow stagnation area at the trailing edge of the blade in Figure 8. The extent of the stagnation area increases with the addition of Gurney flaps. The Gurney flaps will also expand the range of high-speed areas on the negative pressure side of the blade and the low-speed areas on the positive pressure side. When the angle of attack is 10°, which corresponds to the maximum value of the lift coefficient, the flow velocity in the negative pressure area is faster, and the high-velocity area is broader than when the angle of attack is 0°. As the positive pressure surface moves, the stagnant region of flow velocity at the trailing edge expands further and connects with the low-velocity area of the negative pressure surface. When the angle of attack is 30°, the blade is already in stalled state. The negative pressure area of the blade is fully covered by the low-velocity area. Whether the height of the Gurney flap increases in this state will have little effect on the flow field around the blade.
By analyzing the pressure fields of the airfoil at angles of attack of 0°, 10°, and 30°, it can be clearly seen that after the Gurney flaps are added the region at the trailing edge of the positive pressure surface of the airfoil has a higher pressure, as shown in Figure 9. As the height of the Gurney flaps increases, the pressure strength and size at the trailing edge also increase. When the angle of attack changes from 0° to 10°, it can be clearly seen that the pressure difference between the two sides of the blade increases, which means that the resultant force on the blade increases. When the angle of attack is ten degrees, the pressure difference between the two sides of the blade is the largest. The lifting force increases to the highest value in the lift component. When the angle of attack becomes 30°, the blade is in a state of deep flow separation. In this state, the pressure difference between the two sides of the blade is not greater than 10°, which means that the lift of the blade is reduced. However, due to the increase in the angle of attack, the resistance of the blade in the resistance component further increases. The pressure field analysis corresponds to the changing trend of the lift coefficient and drag coefficient curves corresponding to the different angles of attack.
In order to study the influence of the Gurney flaps on the flow velocity and pressure field around the blade more clearly, the flow field at the Gurney flaps at the 0° angle of attack of the blade is amplified in Figure 10. By analyzing the distribution of the flow velocity field, it can be seen that the Gurney flaps can create a stagnation zone located on the trailing edge of the blade, where the root velocity of the Gurney flaps on the front side of the flow surface is close to 0 m/s. Because the Gurney flaps prevent the smooth flow of the airfoil’s positive pressure surface through the trailing edge of the airfoil, it forms on the Gurney flap’s backflow surface. This creates a larger vacuum area, which in turn causes a negative pressure in this area. The upstream surface of the Gurney flaps appears as a positive pressure zone because it hinders further water flow. In the local area of the trailing edge, the increase in Gurney flaps can significantly increase the pressure difference across the airfoil at the trailing edge; thus, it appears that at 0 degrees the Gurney flaps significantly increases the lift of the airfoil.
4.2. Effect of the Full-Length Gurney Flap on Turbine
In Figure 11a, there is no difference in the effect of the height of the Gurney flap and the presence or absence of it on the blade power coefficient at low tip speed ratios. The main reason for this phenomenon is the low rotational speed of the turbine when the rotor is at a low blade tip speed ratio. It can be analyzed from Figure 12 that the rotational speed decreases and that the blade is in a high angle of attack (α) operation, i.e., the whole blade is in a stalled state at the constant blade inlet velocity (U). Based on the results of the analysis of the 2D airfoil at different angles of attack, it can be concluded that when the airfoil is in a stalled state, the change in the lift-to-drag ratio of the blades is smaller, which in turn affects the torque of the turbine. In Figure 11b, the main reason for the increase in turbine flow thrust is that each blade section is in the stalled state at large angles of attack, when the drag of the airfoil increases.
As the rotor speed increases, the blade inflow angle decreases. Because of the constant pitch angle, the angle of attack of the airfoil of each blade section also decreases, relieving the turbine of the high angle of attack in the stalled state. At the optimum tip speed ratio, the presence of Gurney flaps significantly increases the lift-to-drag ratio of the airfoil and greatly increases the torque of the airfoil, which in turn shows an increase in the power coefficient.
By analyzing the pressure distribution of the airfoil on the positive and negative pressure surfaces for a tip speed ratio of 6, it can be seen in Figure 13 that with the addition of Gurney flaps on the positive pressure surface, the pressure at the trailing edge of the airfoil increases significantly, and the area and size of the pressure region increase as the height of the Gurney flaps increases. Similarly, with the addition of Gurney flaps, the negative pressure value of the suction surface in the leading edge becomes significantly smaller.
The height of the Gurney flap was analyzed. The peak power factor improves when the flap height is increased from h/c = 0.01 to 0.02. Meanwhile, the power factor is more sensitive to the change in the tip speed ratio of the blade. The decrease in the power factor is mainly due to the increase in the blade drag loss, and the increase in the Gurney flap height further increases the drag of the wing and increases the drag loss; that is, when the tip speed ratio is 9 and the Gurney flap height is 0.03c, the power coefficient is lower than that of the case without Gurney flap blades.
4.3. Hydrodynamic Performance of Gurney Flaps Radial Dimensions
Taking Gurney flaps with a height of h/c = 0.02 as an example in Figure 14, the root of the blade is the starting point of the length of the Gurney flaps, and the tip of the blade is the end point. The hydrodynamic characteristics of the Gurney flap blades at different lengths are compared and analyzed. When the radial length of the Gurney flaps is l/R = 0.4, the power coefficient curve of the blade is almost unchanged, and as the radial length of Gurney flaps increases, the peak power coefficient increases. After adding Gurney flaps, the axial thrust of the turbine will be increased in the full speed range, and the longer the length of the Gurney flaps, the greater the axial thrust.
The analysis of the peak power coefficient of the different radial lengths of the Gurney flaps shows that the longer the radial dimension of the Gurney flaps, the greater the increase in the peak power coefficient. This means that the Gurney flaps at the tip of the blade contribute more to the increasing of the peak power factor. With a height of h/c = 0.02, the full-length Gurney flaps can increase the blade power coefficient peak by 10.68%, as shown in Figure 15.
By analyzing the pressure distribution on the blade surface when the tip speed ratio is 6, it can be seen in Figure 16 that the Gurney flap pressure on the positive pressure surface near the tip is higher than the Gurney flap pressure on the root side of the blade, and with the increase in the radial length, the pressure peaks and high pressure areas also increase. By comparing the clean blade with the blade with a radial length of 0.4R, it can be found that the pressure distributions on the pressure and negative pressure surfaces of the two are similar. When the radial length is increased to 0.6R, the pressure near the Gurney flap on the side close to the tip of the blade increases significantly. When the radial length is increased to 0.8R, the pressure range and the peak of the Gurney flap on the side close to the tip of the blade continue to increase; when the radial length of the Gurney flap is increased to the full length of the blade, the pressure range of the Gurney flap on the back of the blade increases. When the full length of the Gurney flap is reached, the pressure peak at the trailing edge of the blade increases the most; the pressure range also increases to the maximum, and the negative pressure value of the negative pressure surface of the blade further decreases. This indicates that the closer the Gurney flap is to the tip of the blade, the greater the contribution to the peak power coefficient corresponding to the optimum speed ratio of the turbine.
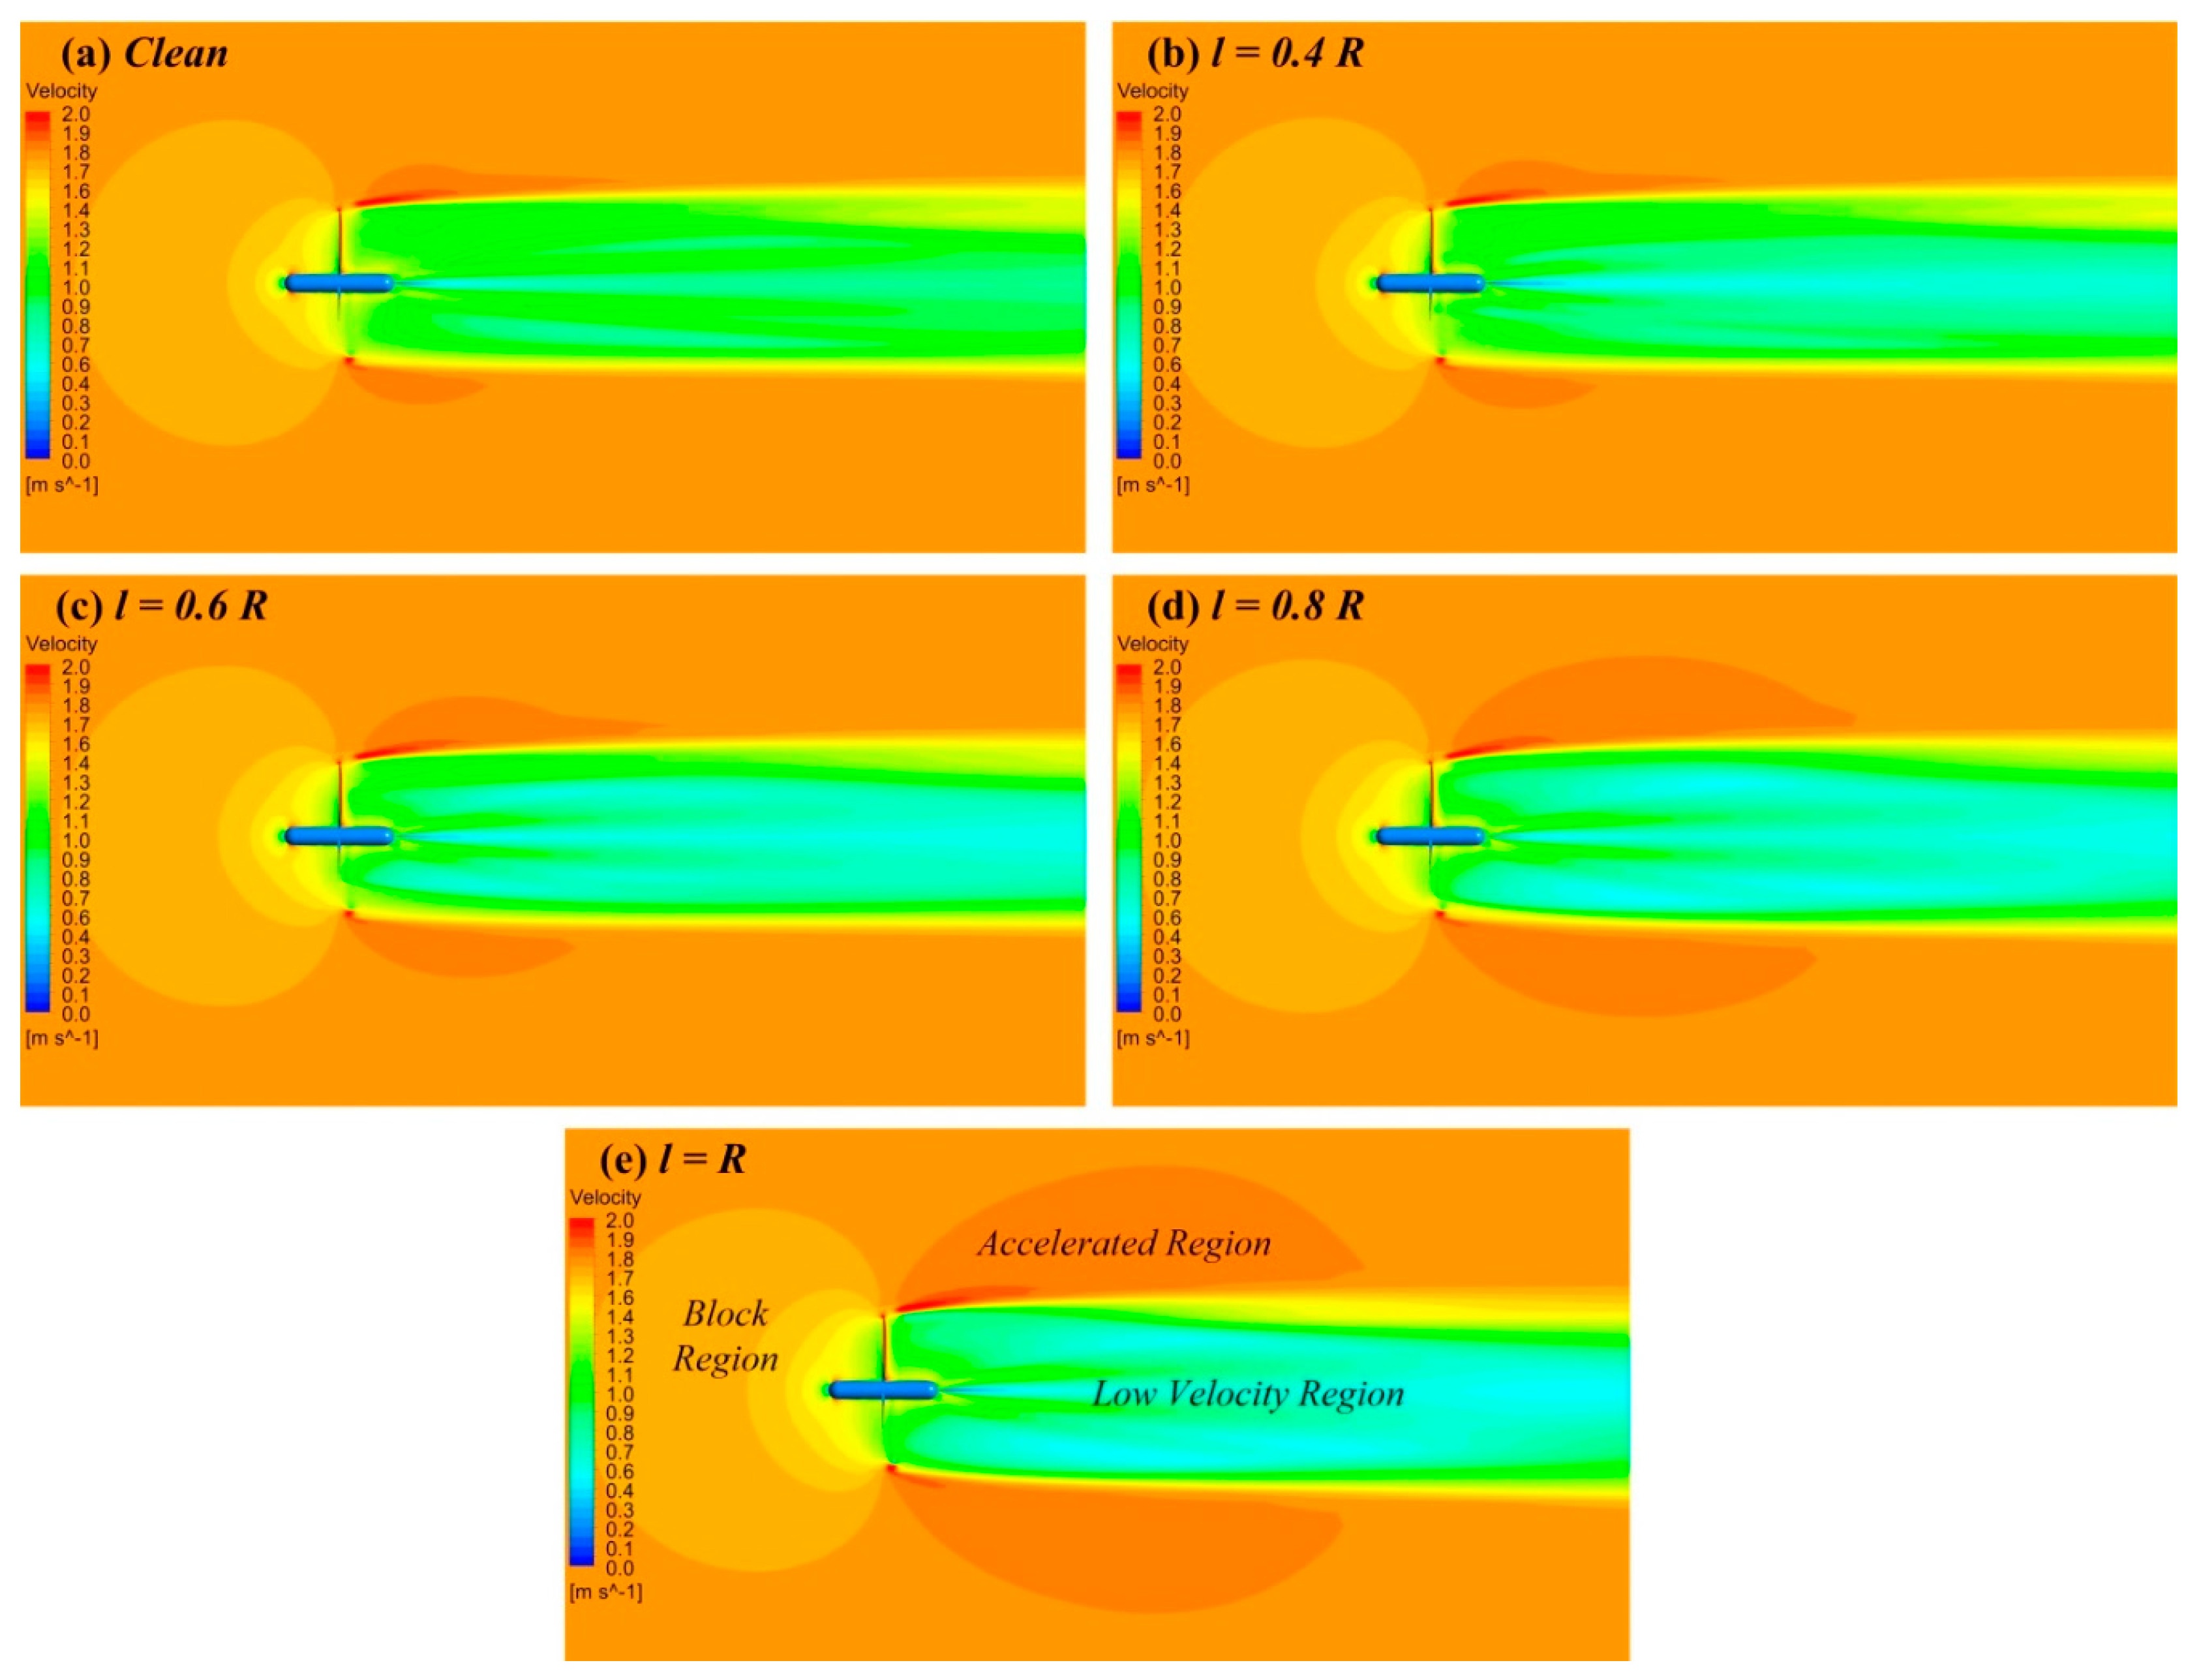
In Figure 17, it can be seen that the wake velocity of the blade with the Gurney flaps of radial length 0.4R is lower than that of the clean blade. As the radial length of the Gurney flap increases, the average wake velocity in the swept area of the blade continues to decrease. Meanwhile, the longer the flap length, the greater the effect on the wake edge flow field. It can be seen that the region of the high-velocity flow field at the wake boundary behind the blade tip increases accordingly. This is due to the fact that the flow remaining on the upstream side of the Gurney flap rotates with the flap, providing a positional reference for subsequent ocean current power generation devices using Gurney flaps.
5. Conclusions
In this paper, we examine the hydrodynamic performance of Gurney flaps on the rotor of HAOCT. Drawing on the computational fluid dynamics (CFD)-based results, we deduce the following conclusions:
(a) Gurney flaps can greatly enhance the power performance of the turbine and simultaneously boost the axial thrust of the turbine. Higher Gurney flaps lead to a greater lift and drag of the blade at the same angle of attack before the stall. At the heights of h/c = 0.01 and h/c = 0.02, the Gurney flaps have similar lift-to-drag ratios, which are better than the clean blade and the h/c = 0.03 blade at the angle of attack in the region of less than ten degrees.
(b) The higher the Gurney flaps, the higher the thrust coefficient of the rotor. The maximum peak power coefficient for a Gurney flap with a height of h/c = 0.02 is 0.4794. Decreasing the height of the Gurney flap enables the power coefficient curve of the blade to be insensitive to the TSR. This means that the power coefficient curve has higher values over a wider range of the TSR.
(c) Further increasing the height of the Gurney flaps not only does not significantly increase the peak power coefficient, it also leads to a reduction in the power performance of the turbine at high tip speed ratios. At a tip speed ratio of 9, a turbine with Gurney flaps of h/c = 0.03 displays a substantially lower power coefficient than one without the flaps.
(d) Gurney flaps near the blade tip contribute more to power and thrust performance. The full-length Gurney flaps can increase the blade power coefficient peak by 10.68% at a height of h/c = 0.02. However, Gurney flaps of r/R = 0.4 can only increase the power factor by 0.34% of the peak.
Author Contributions
Conceptualization, Z.M.; data curation, T.Z.; methodology, W.T.; validation, G.Y.; writing—original draft, T.Z.; writing—review and editing, W.T. All authors have read and agreed to the published version of the manuscript.
Funding
This research received no external funding.
Institutional Review Board Statement
Not applicable.
Informed Consent Statement
Not applicable.
Data Availability Statement
Data are contained within the article.
Conflicts of Interest
The authors declare no conflict of interest.
Nomenclature
| Tip speed ratio | |
| Number of blades | |
| Rotor rotation speed [rad/s] | |
| Angles of attack [°] | |
| U | Free-stream velocity [m/s] |
| U’ | Local stream velocity [m/s] |
| Turbulence intensity [%] | |
| Rotor radius [m] | |
| Rotor diameter [m] | |
| Hub length [m] | |
| Hub radius [m] | |
| Flap length [m] | |
| Flap height [m] | |
| Local radius [m] | |
| Local chord length [m] | |
| Power coefficient | |
| Thrust coefficient |
References
- Li, M.; Luo, H.; Zhou, S.; Senthil Kumar, G.M.; Guo, X.; Law, T.C.; Cao, S. State-of-the-Art Review of the Flexibility and Feasibility of Emerging Offshore and Coastal Ocean Energy Technologies in East and Southeast Asia. Renew. Sustain. Energy Rev. 2022, 162, 112404. [Google Scholar] [CrossRef]
- Khan, M.Z.A.; Khan, H.A.; Aziz, M. Harvesting Energy from Ocean: Technologies and Perspectives. Energies 2022, 15, 3456. [Google Scholar] [CrossRef]
- Bhuiyan, M.A.; Hu, P.; Khare, V.; Hamaguchi, Y.; Thakur, B.K.; Rahman, M.K. Economic Feasibility of Marine Renewable Energy: Review. Front. Mar. Sci. 2022, 9, 988513. [Google Scholar] [CrossRef]
- Rehman, S.; Alhems, L.M.; Alam, M.M.; Wang, L.; Toor, Z. A Review of Energy Extraction from Wind and Ocean: Technologies, Merits, Efficiencies, and Cost. Ocean Eng. 2023, 267, 113192. [Google Scholar] [CrossRef]
- Zhang, J.; Liu, S.; Guo, Y.; Sun, K.; Guan, D. Performance of a Bidirectional Horizontal-Axis Tidal Turbine with Passive Flow Control Devices. Renew. Energy 2022, 194, 997–1008. [Google Scholar] [CrossRef]
- Satrio, D.; Suntoyo; Ramadhan, L.I. The Advantage of Flow Disturbance for Vertical-Axis Turbine in Low Current Velocity. Sustain. Energy Technol. Assess. 2022, 49, 101692. [Google Scholar] [CrossRef]
- Yang, M.-H.; Gu, Z.-T.; Yeh, R.-H. Numerical and Experimental Analyses of the Performance of a Vertical Axis Turbine with Controllable-Blades for Ocean Current Energy. Energy Convers. Manag. 2023, 285, 117009. [Google Scholar] [CrossRef]
- Tigabu, M.T.; Khalid, M.S.U.; Wood, D.; Admasu, B.T. Some Effects of Turbine Inertia on the Starting Performance of Vertical-Axis Hydrokinetic Turbine. Ocean Eng. 2022, 252, 111143. [Google Scholar] [CrossRef]
- Nachtane, M.; Tarfaoui, M.; Goda, I.; Rouway, M. A Review on the Technologies, Design Considerations and Numerical Models of Tidal Current Turbines. Renew. Energy 2020, 157, 1274–1288. [Google Scholar] [CrossRef]
- Kundu, P.; Sarkar, A.; Nagarajan, V. Improvement of Performance of S1210 Hydrofoil with Vortex Generators and Modified Trailing Edge. Renew. Energy 2019, 142, 643–657. [Google Scholar] [CrossRef]
- Fan, M.; Sun, Z.; Yu, R.; Dong, X.; Li, Z.; Bai, Y. Effect of Leading-Edge Tubercles on the Hydrodynamic Characteristics and Wake Development of Tidal Turbines. J. Fluids Struct. 2023, 119, 103873. [Google Scholar] [CrossRef]
- Mansi, A.; Aydin, D. The Impact of Trailing Edge Flap on the Aerodynamic Performance of Small-Scale Horizontal Axis Wind Turbine. Energy Convers. Manag. 2022, 256, 115396. [Google Scholar] [CrossRef]
- Nanda, S.; Ahmed, S.; Warudkar, V.; Gautam, A. Effect of Uniformly Varying Width Leading-Edge Slots on the Aerodynamic Performance of Wind Turbine Blade. Mater. Today Proc. 2023, 78, 120–127. [Google Scholar] [CrossRef]
- Barbarić, M.; Batistić, I.; Guzović, Z. Numerical Study of the Flow Field around Hydrokinetic Turbines with Winglets on the Blades. Renew. Energy 2022, 192, 692–704. [Google Scholar] [CrossRef]
- Wang, J.J.; Li, Y.C.; Choi, K.-S. Gurney Flap—Lift Enhancement, Mechanisms and Applications. Prog. Aerosp. Sci. 2008, 44, 22–47. [Google Scholar] [CrossRef]
- Basso, M.; Cravero, C.; Marsano, D. Aerodynamic Effect of the Gurney Flap on the Front Wing of a F1 Car and Flow Interactions with Car Components. Energies 2021, 14, 2059. [Google Scholar] [CrossRef]
- Genest, B.; Dumas, G. Numerical Investigation into Single and Double Gurney Flaps for Improving Airfoil Performance. J. Aircr. 2023, 1–15. [Google Scholar] [CrossRef]
- Fatahian, H.; Salarian, H.; Eshagh Nimvari, M.; Khaleghinia, J. Effect of Gurney Flap on Flow Separation and Aerodynamic Performance of an Airfoil under Rain and Icing Conditions. Acta Mech. Sin. 2020, 36, 659–677. [Google Scholar] [CrossRef]
- Bianchini, A.; Balduzzi, F.; Di Rosa, D.; Ferrara, G. On the Use of Gurney Flaps for the Aerodynamic Performance Augmentation of Darrieus Wind Turbines. Energy Convers. Manag. 2019, 184, 402–415. [Google Scholar] [CrossRef]
- Ye, X.; Hu, J.; Zheng, N.; Li, C. Numerical Study on Aerodynamic Performance and Noise of Wind Turbine Airfoils with Serrated Gurney Flap. Energy 2023, 262, 125574. [Google Scholar] [CrossRef]
- Syawitri, T.P.; Yao, Y.-F.; Yao, J.; Chandra, B. The Effect of Gurney Flap on Flow Characteristics of Vertical Axis Wind Turbine. Int. J. Mod. Phys. B 2020, 34, 2040107. [Google Scholar] [CrossRef]
- Syawitri, T.P.; Yao, Y.; Yao, J.; Chandra, B. Geometry Optimisation of Vertical Axis Wind Turbine with Gurney Flap for Performance Enhancement at Low, Medium and High Ranges of Tip Speed Ratios. Sustain. Energy Technol. Assess. 2022, 49, 101779. [Google Scholar] [CrossRef]
- Zhang, Y.; Ramdoss, V.; Saleem, Z.; Wang, X.; Schepers, G.; Ferreira, C. Effects of Root Gurney Flaps on the Aerodynamic Performance of a Horizontal Axis Wind Turbine. Energy 2019, 187, 115955. [Google Scholar] [CrossRef]
- Zhu, H.; Hao, W.; Li, C.; Ding, Q. Numerical Study of Effect of Solidity on Vertical Axis Wind Turbine with Gurney Flap. J. Wind Eng. Ind. Aerodyn. 2019, 186, 17–31. [Google Scholar] [CrossRef]
- Kumar, P.M.; Samad, A. Introducing Gurney Flap to Wells Turbine Blade and Performance Analysis with OpenFOAM. Ocean Eng. 2019, 187, 106212. [Google Scholar] [CrossRef]
- Bahaj, A.S.; Molland, A.F.; Chaplin, J.R.; Batten, W.M.J. Power and Thrust Measurements of Marine Current Turbines under Various Hydrodynamic Flow Conditions in a Cavitation Tunnel and a Towing Tank. Renew. Energy 2007, 32, 407–426. [Google Scholar] [CrossRef]
- Batten, W.M.J.; Bahaj, A.S.; Molland, A.F.; Chaplin, J.R. Experimentally Validated Numerical Method for the Hydrodynamic Design of Horizontal Axis Tidal Turbines. Ocean Eng. 2007, 34, 1013–1020. [Google Scholar] [CrossRef]
- Chandrasekhara, M.S. Optimum Gurney Flap Height Determination for “Lost-Lift” Recovery in Compressible Dynamic Stall Control. Aerosp. Sci. Technol. 2010, 14, 551–556. [Google Scholar] [CrossRef]
- Molland, A.F.; Bahaj, A.S.; Chaplin, J.R.; Batten, W.M.J. Measurements and Predictions of Forces, Pressures and Cavitation on 2-D Sections Suitable for Marine Current Turbines. Proc. Inst. Mech. Eng. Part M J. Eng. Marit. Environ. 2004, 218, 127–138. [Google Scholar] [CrossRef]
- He, X.; Wang, J.; Yang, M.; Ma, D.; Yan, C.; Liu, P. Numerical Simulation of Gurney Flap on SFYT15thick Airfoil. Theor. Appl. Mech. Lett. 2016, 6, 286–292. [Google Scholar] [CrossRef]
- Bak, C.; Fuglsang, P.; Johansen, J.; Antoniou, I. Wind Tunnel Tests of the NACA 63-415 and a Modified NACA 63-415 Airfoil; Risoe National Lab.: Roskilde, Denmark, 2000; 107p. [Google Scholar]
Figure 1.
HAOCT rotor with Gurney flap.

Figure 2.
Computation domain and boundary conditions.
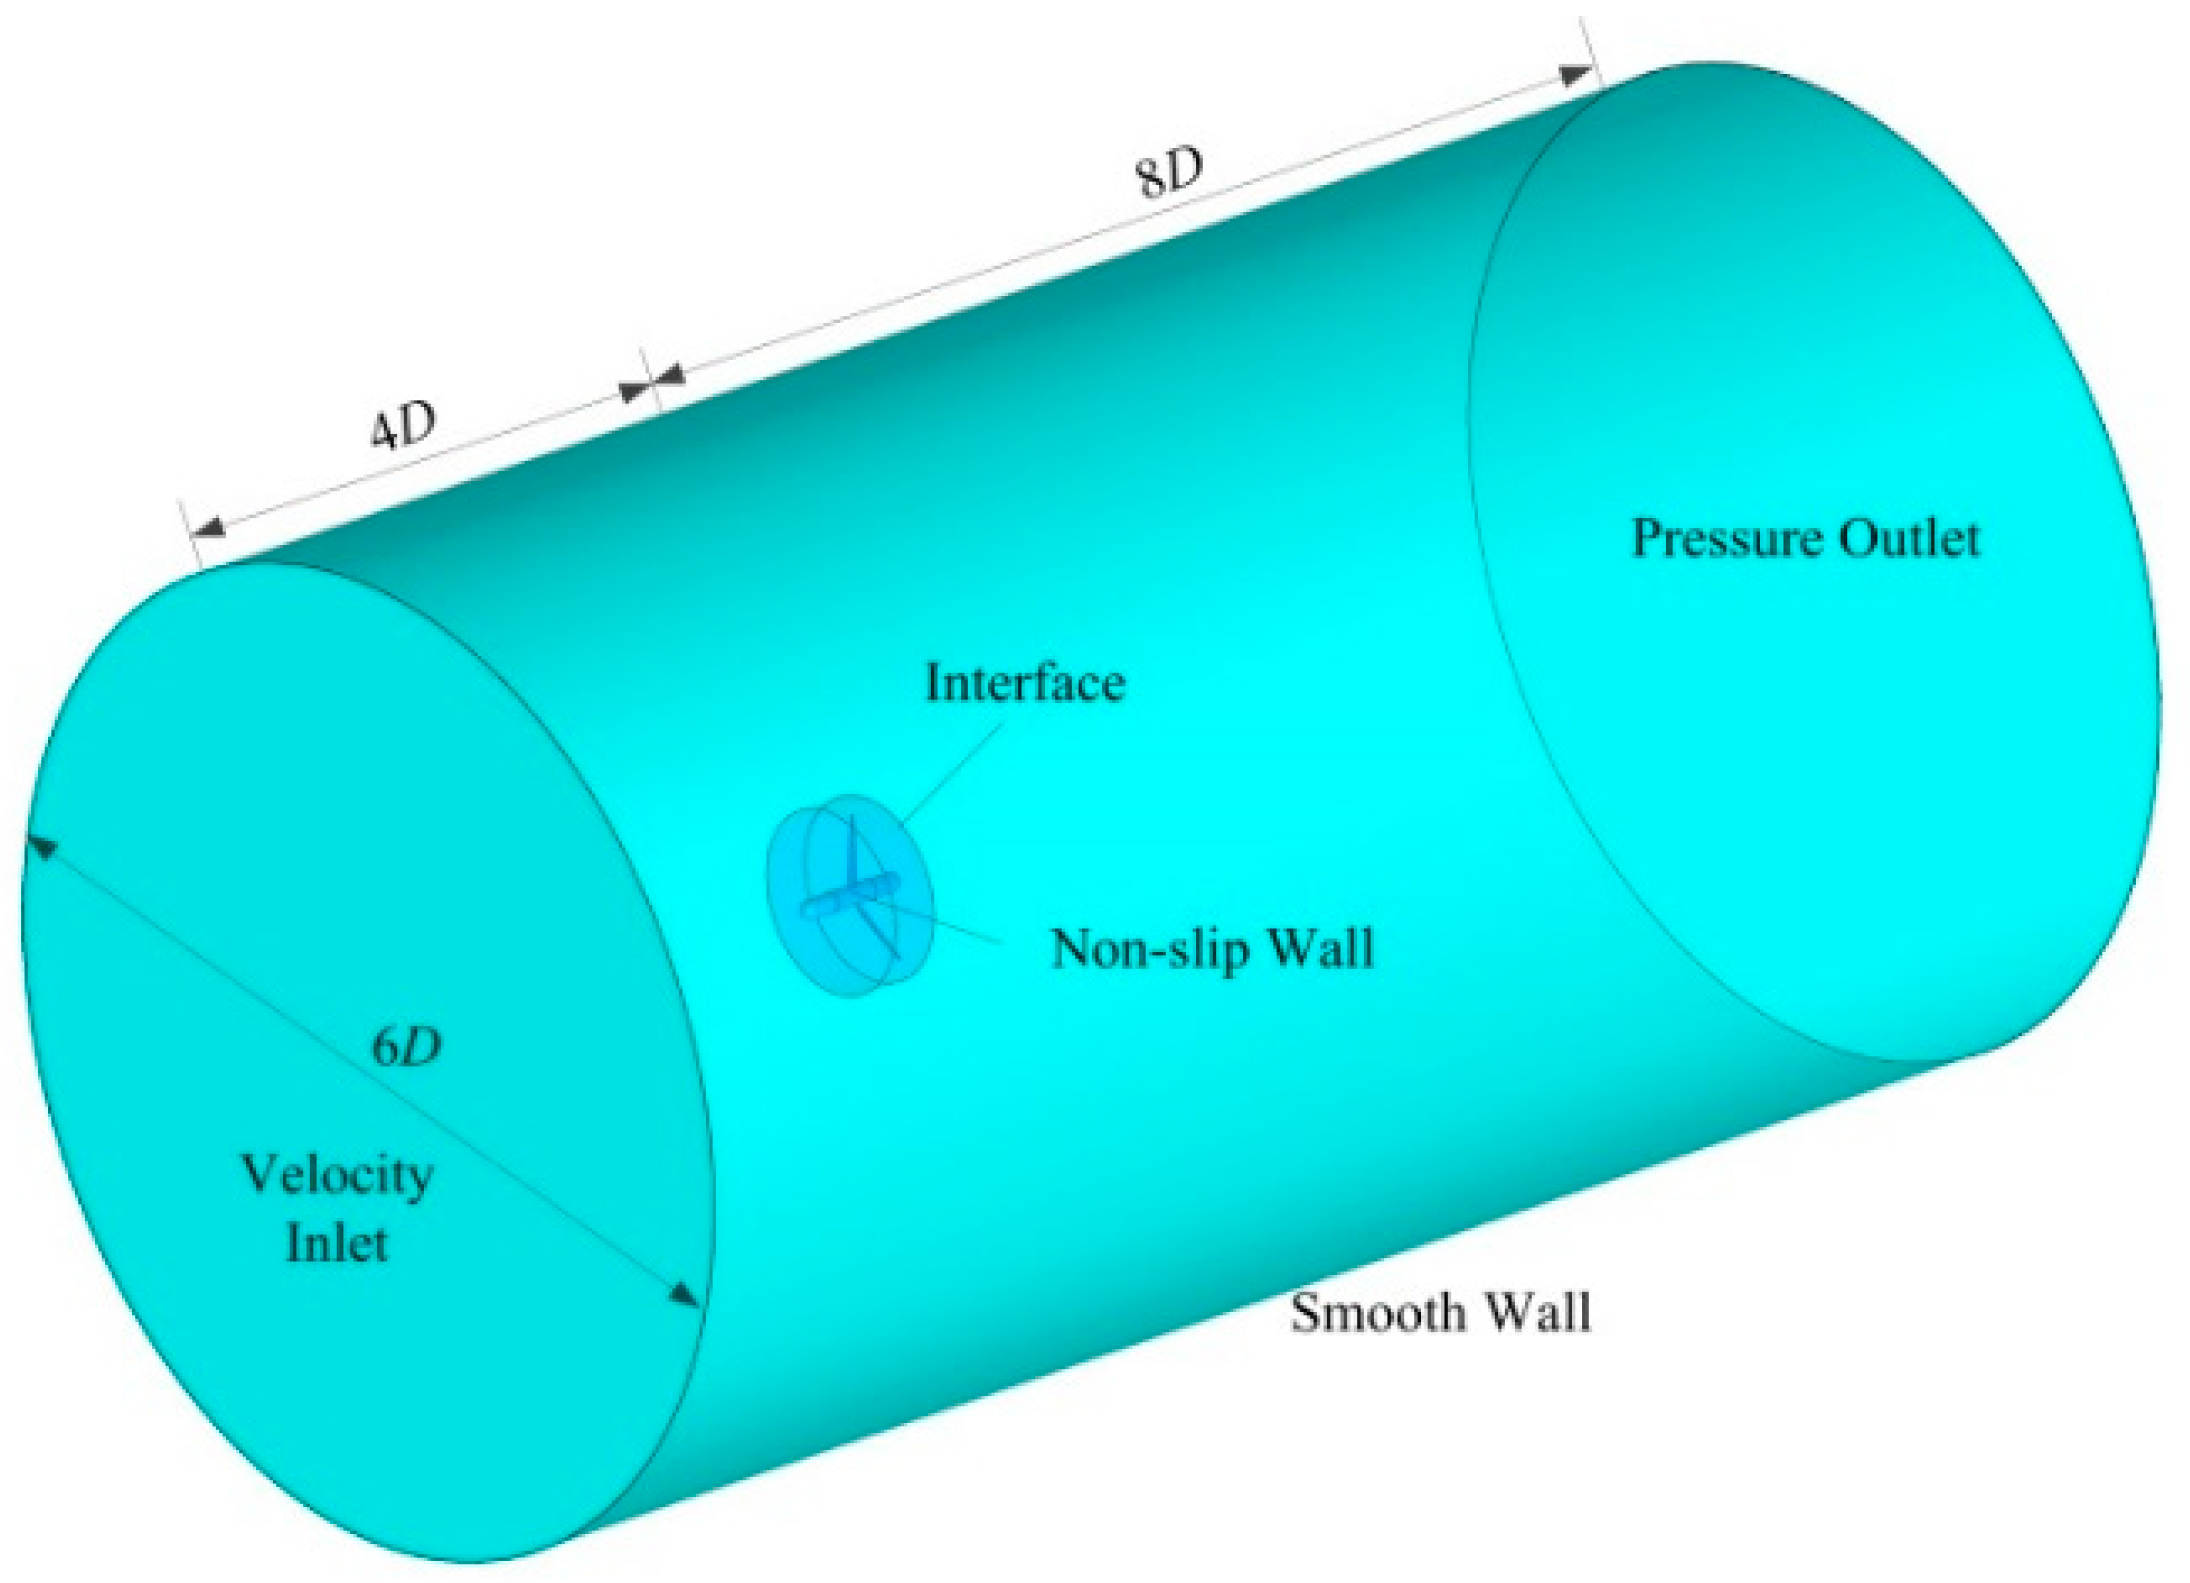
Figure 3.
Mesh details: (a) stationary domain, (b) rotor domain, (c) blade grid details.

Figure 4.
Two-dimensional airfoil mesh: (a) overview, (b) grids near airfoil.
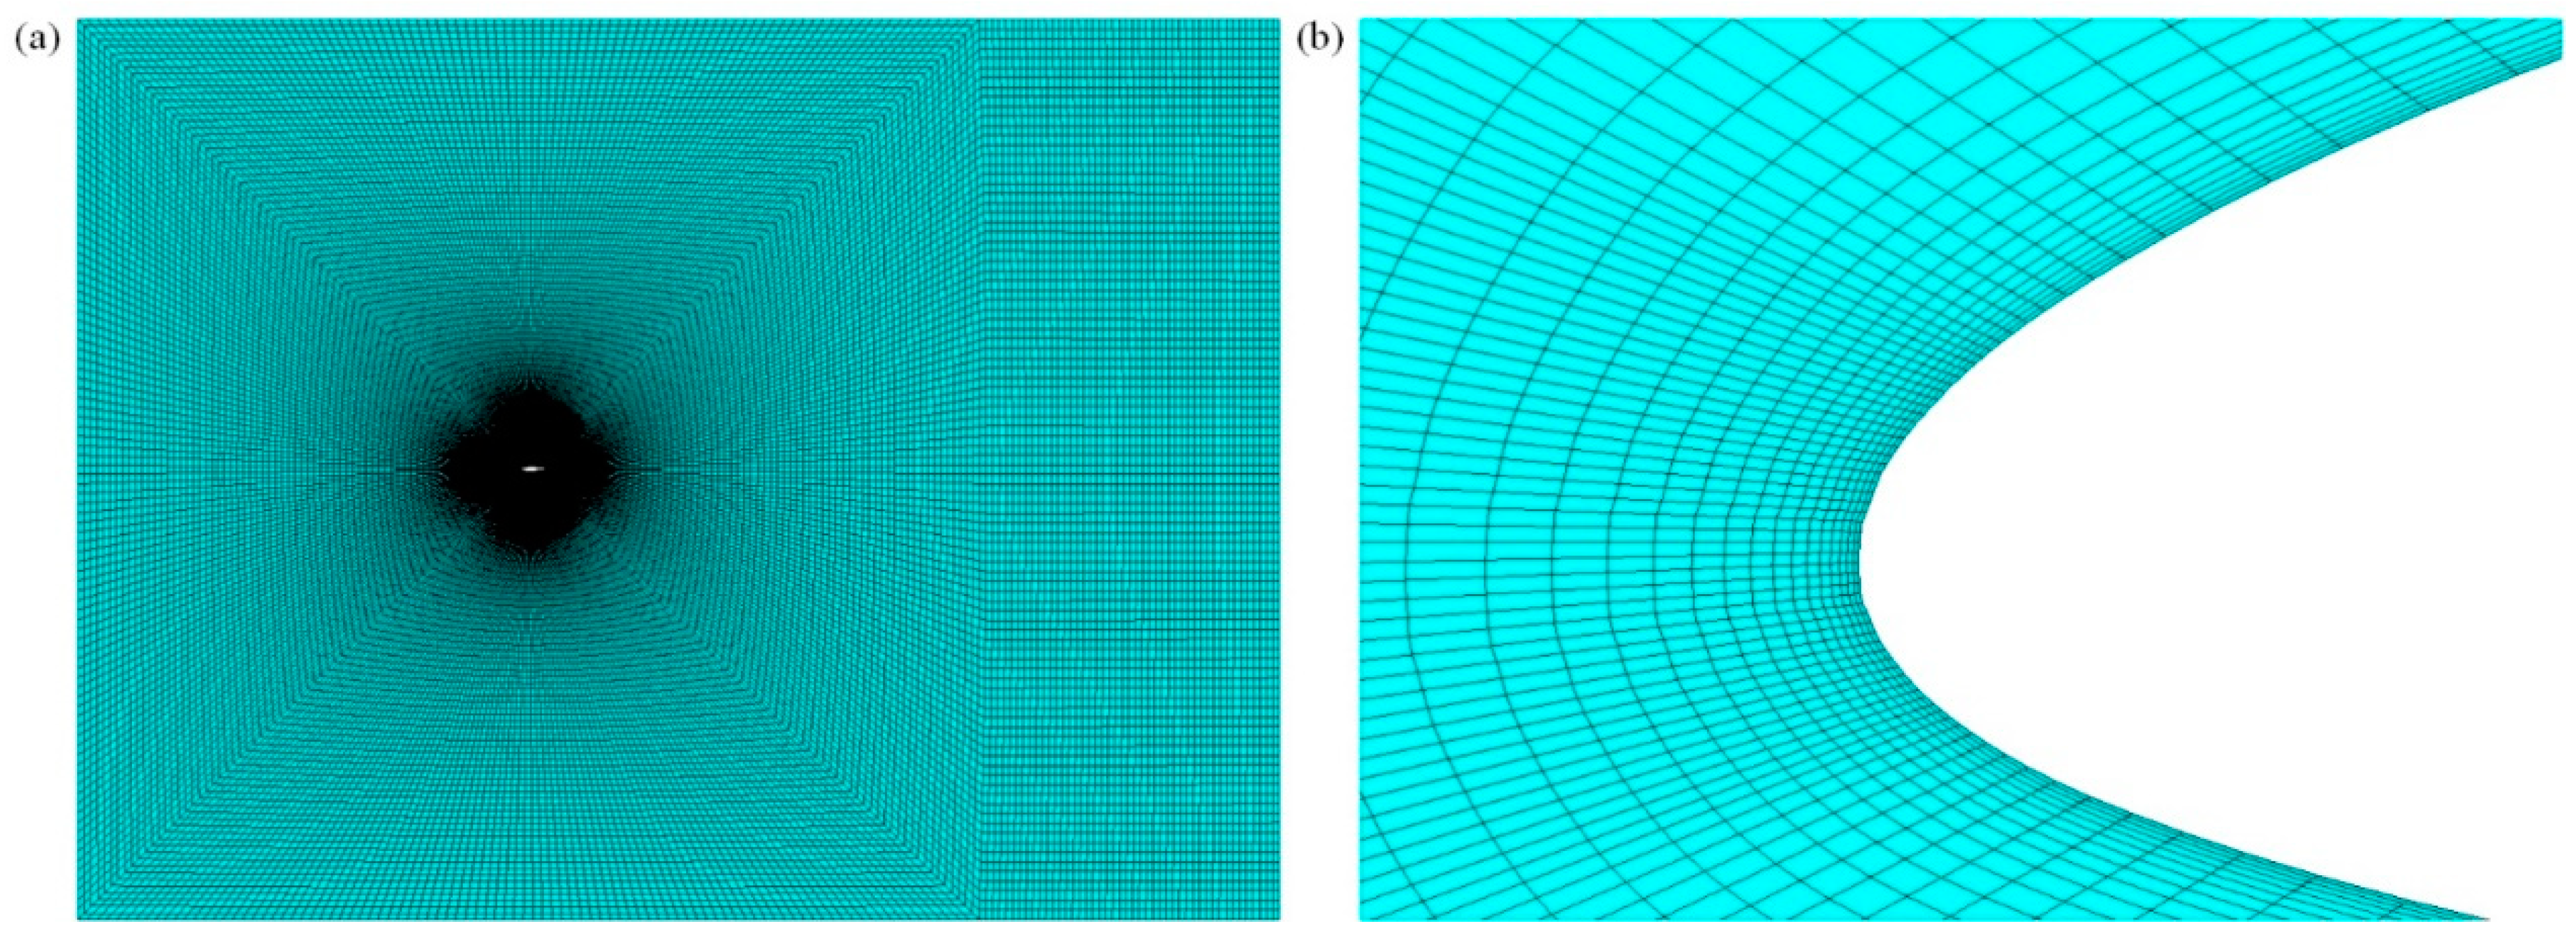
Figure 5.
Results of the numerical method validation: (a) power coefficient and (b) thrust coefficient.
Figure 5.
Results of the numerical method validation: (a) power coefficient and (b) thrust coefficient.

Figure 6.
Coefficient of pressure at different angles of attack for 2D airfoil: (a) 4°, (b) 12°, (c) 16°.
Figure 6.
Coefficient of pressure at different angles of attack for 2D airfoil: (a) 4°, (b) 12°, (c) 16°.

Figure 7.
Performance of 2D NACA 63815 at different angles of attack: (a) lift coefficient, (b) thrust coefficient, (c) lift–drag ratio.
Figure 7.
Performance of 2D NACA 63815 at different angles of attack: (a) lift coefficient, (b) thrust coefficient, (c) lift–drag ratio.
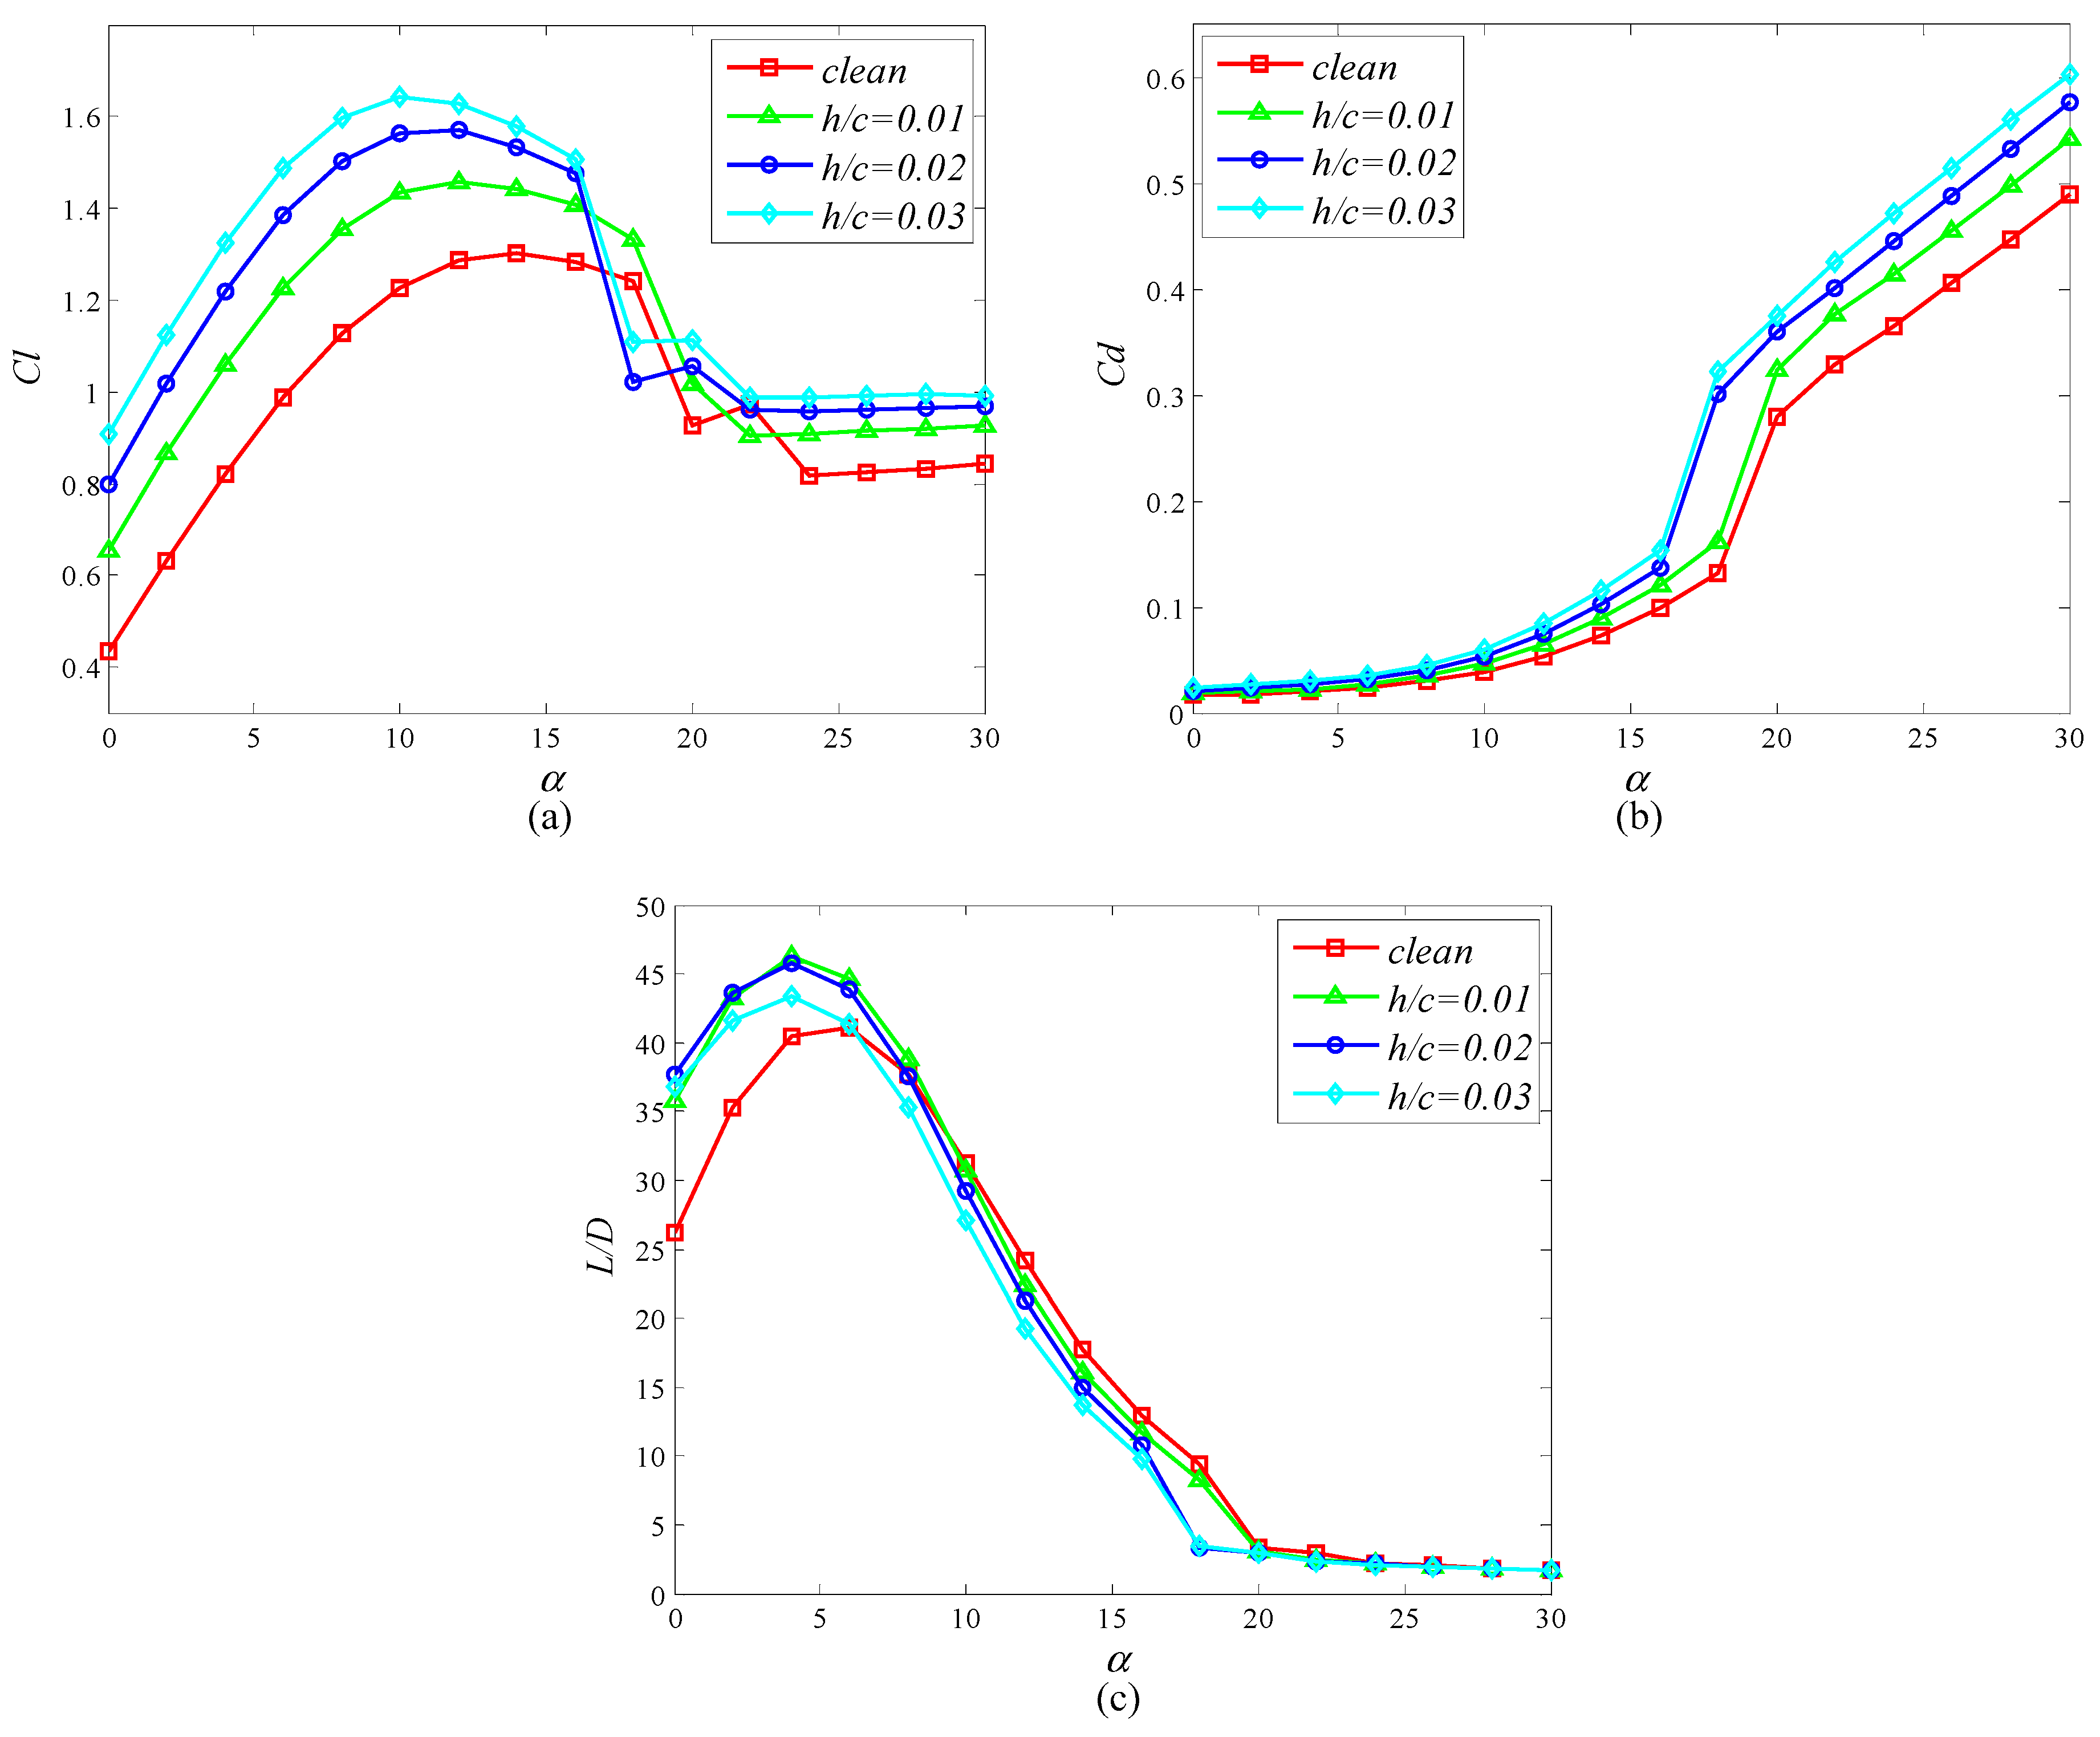
Figure 8.
Velocity contours with streamlines at different flap heights and angles of attack.

Figure 9.
Pressure contours with different flap heights at 0°, 10°, and 30° angles of attack.
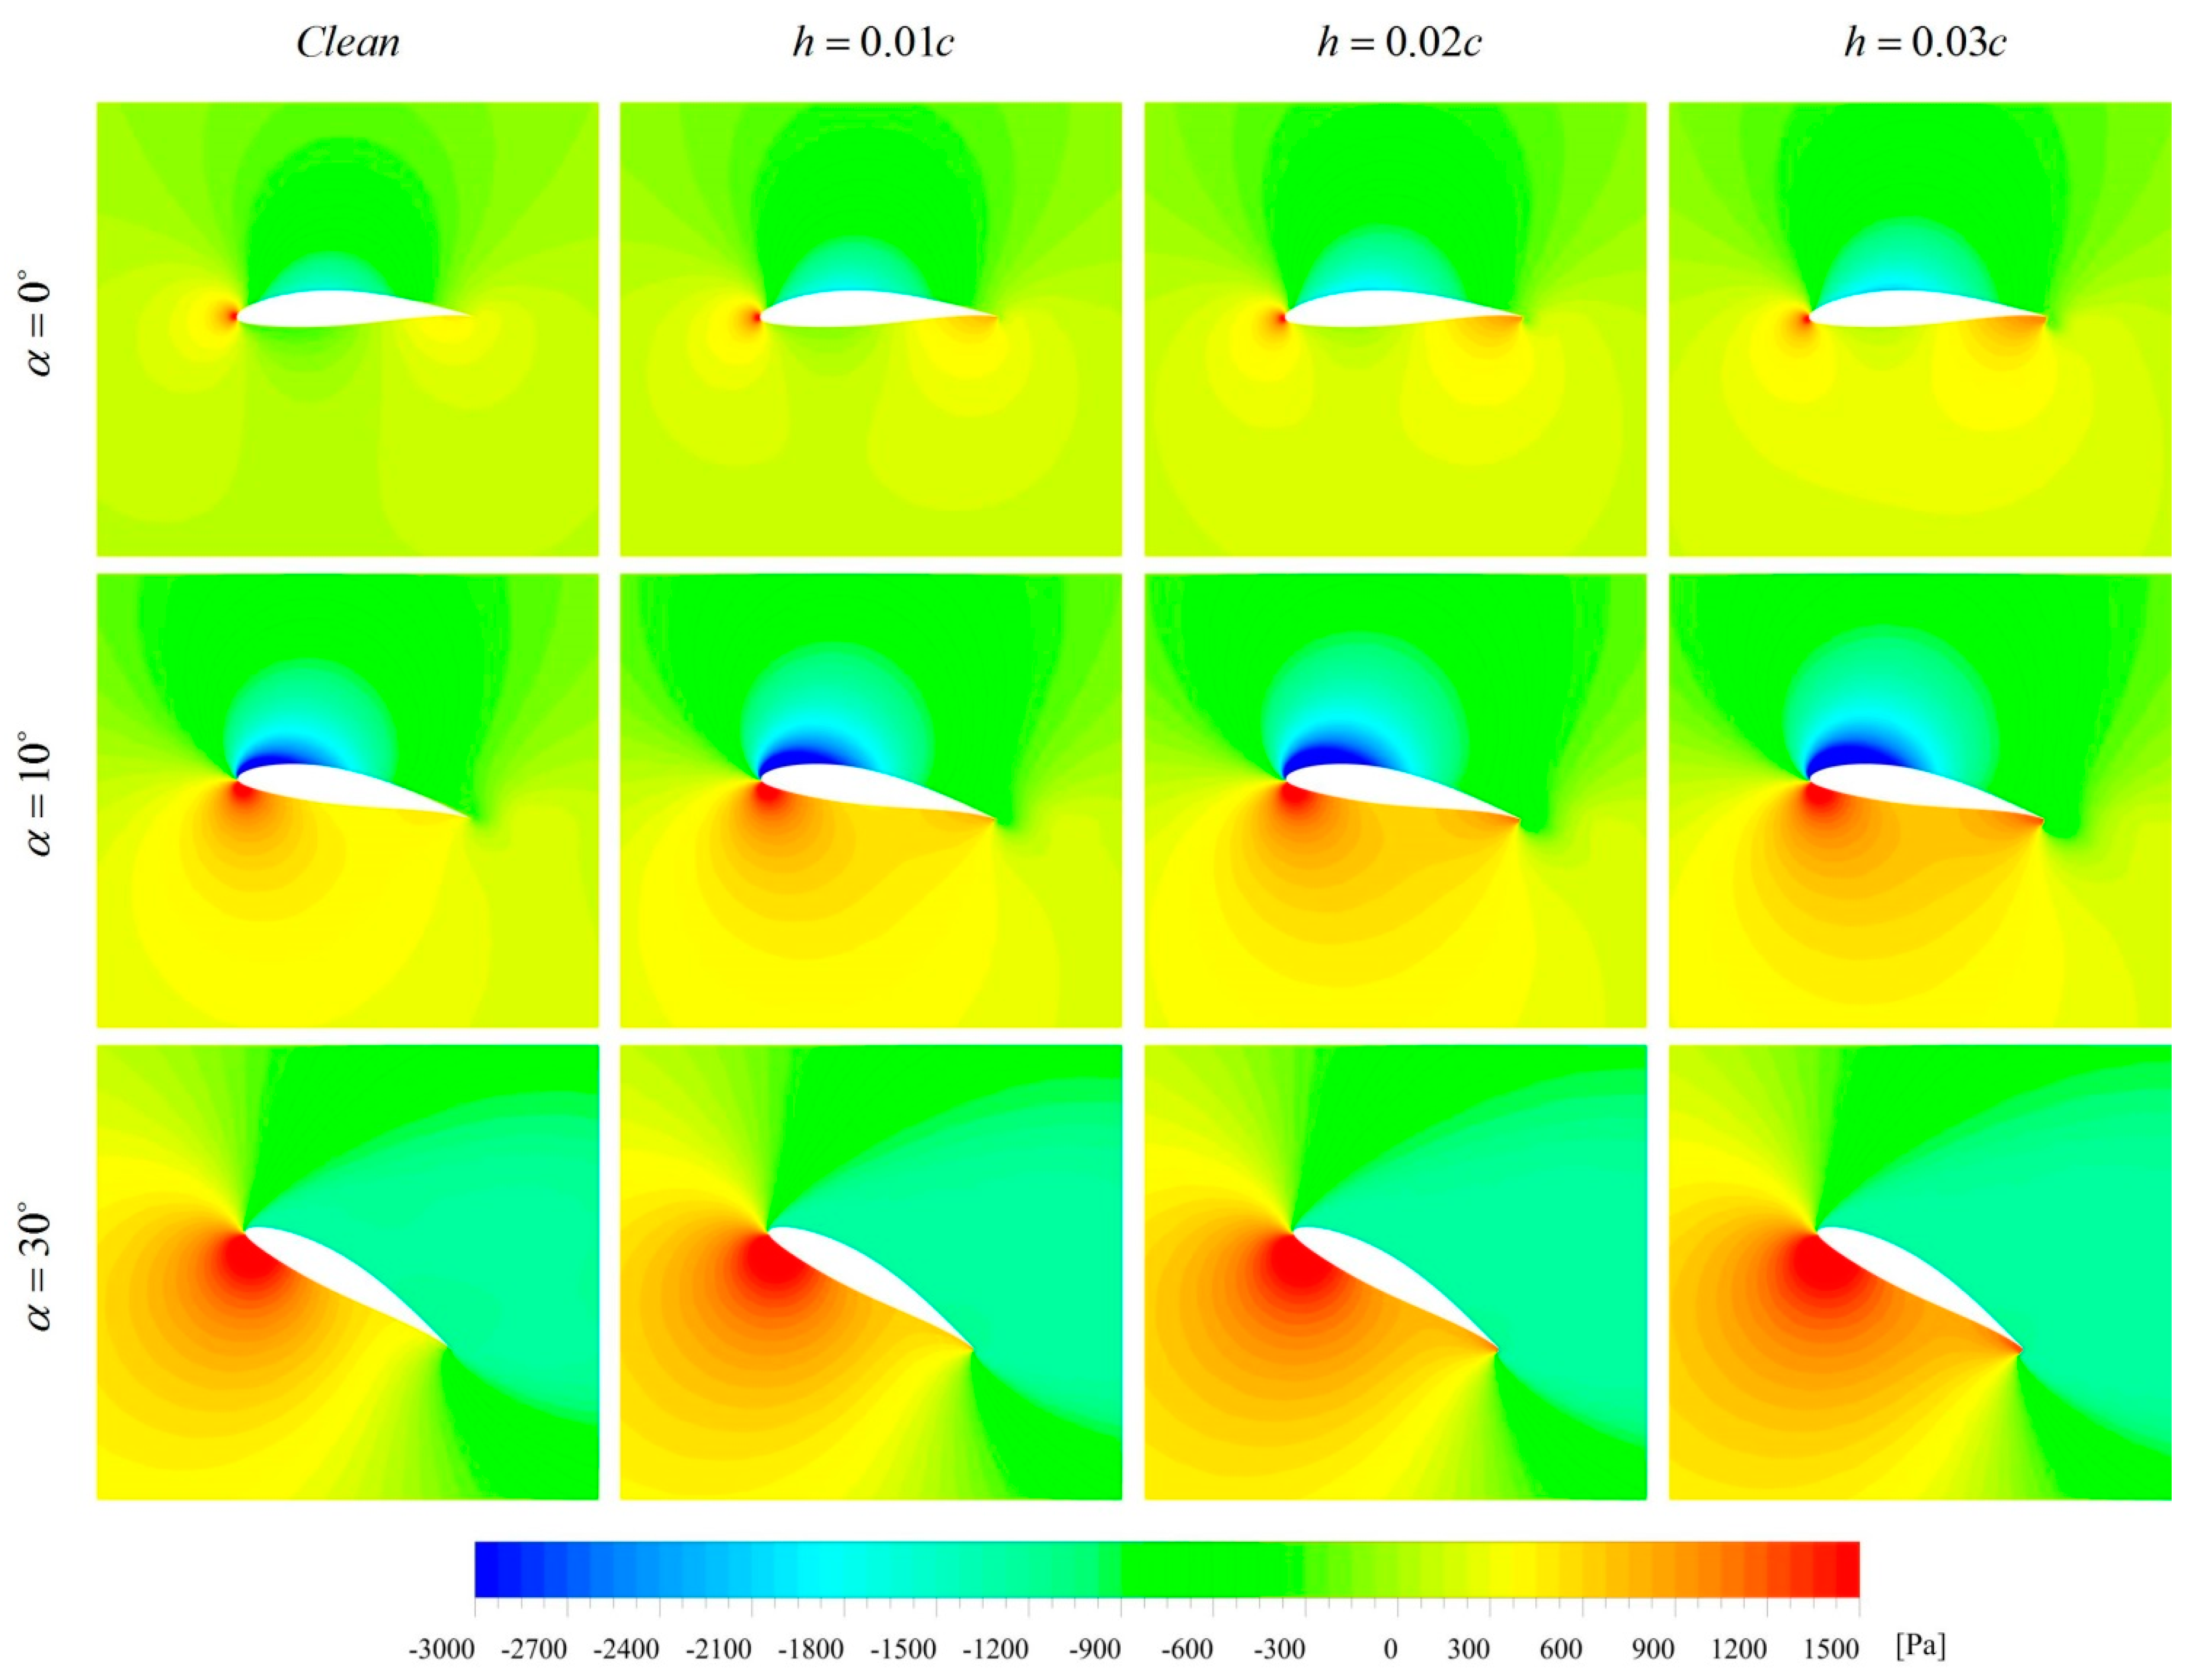
Figure 10.
Velocity contours and pressure contours of blade trailing edge at 0 angle of attack.
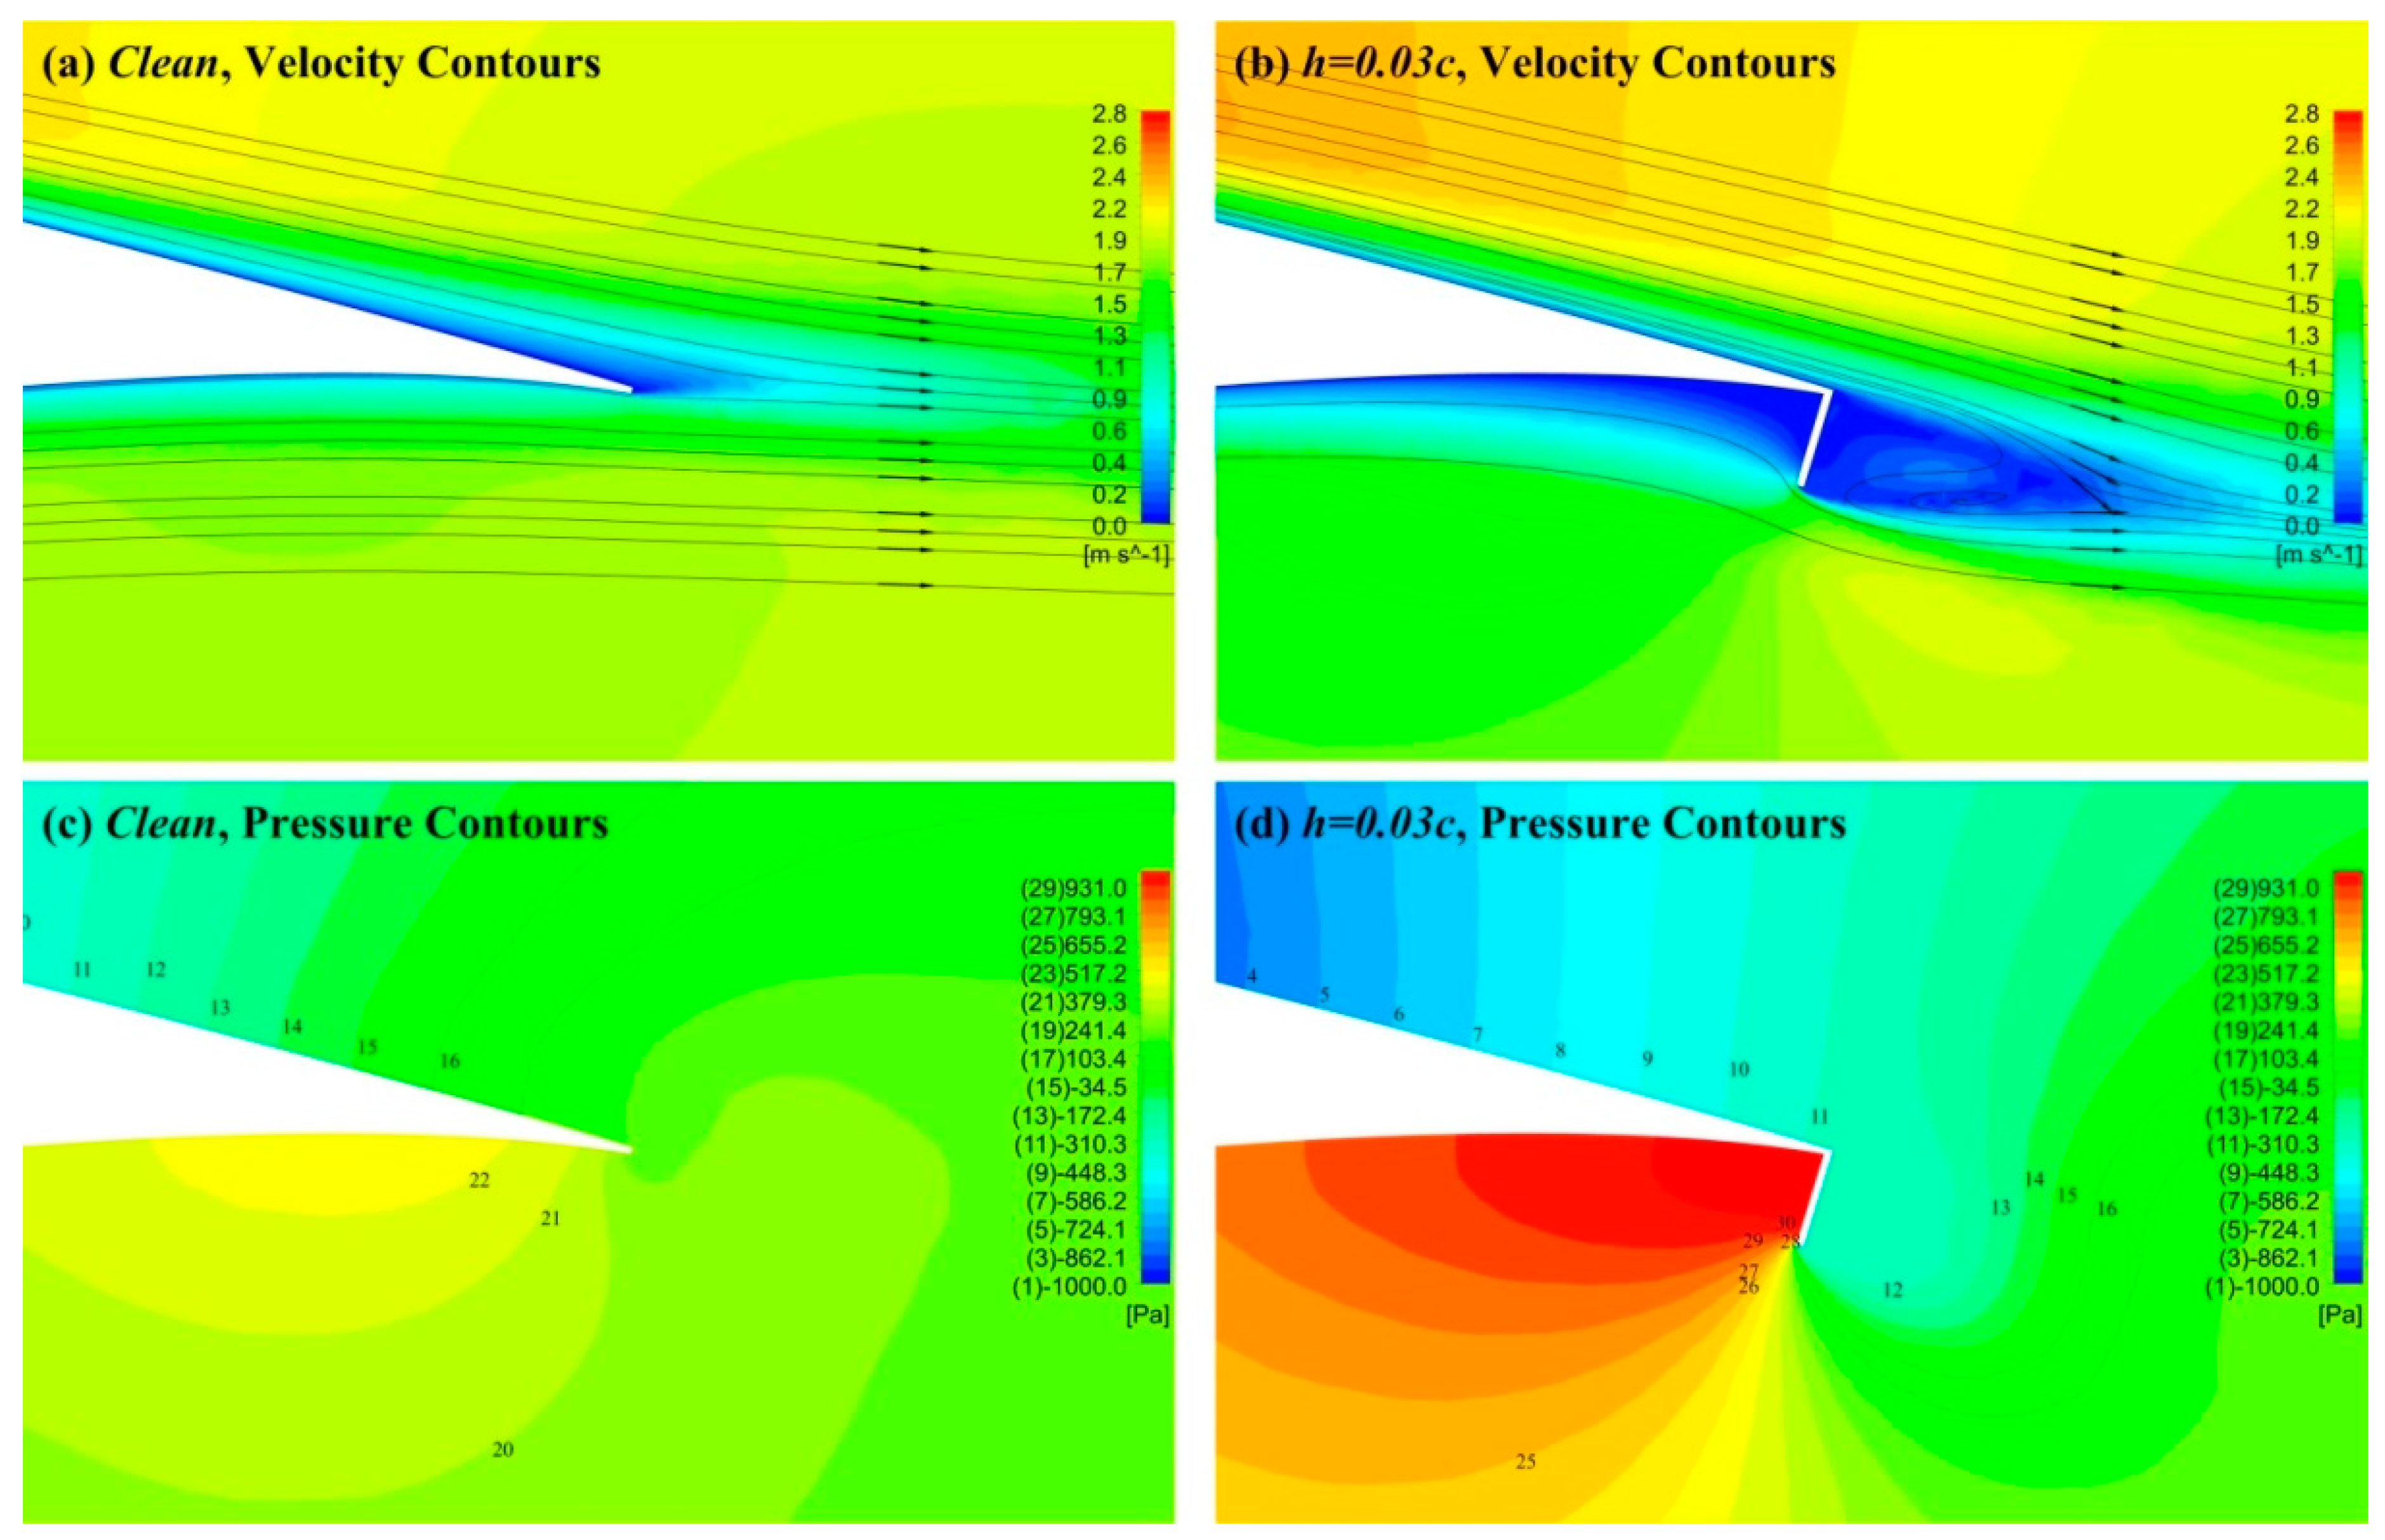
Figure 11.
Turbine with different heights of Gurney flaps: (a) power coefficient, (b) thrust coefficient.
Figure 11.
Turbine with different heights of Gurney flaps: (a) power coefficient, (b) thrust coefficient.

Figure 12.
Airfoil section stress analysis.
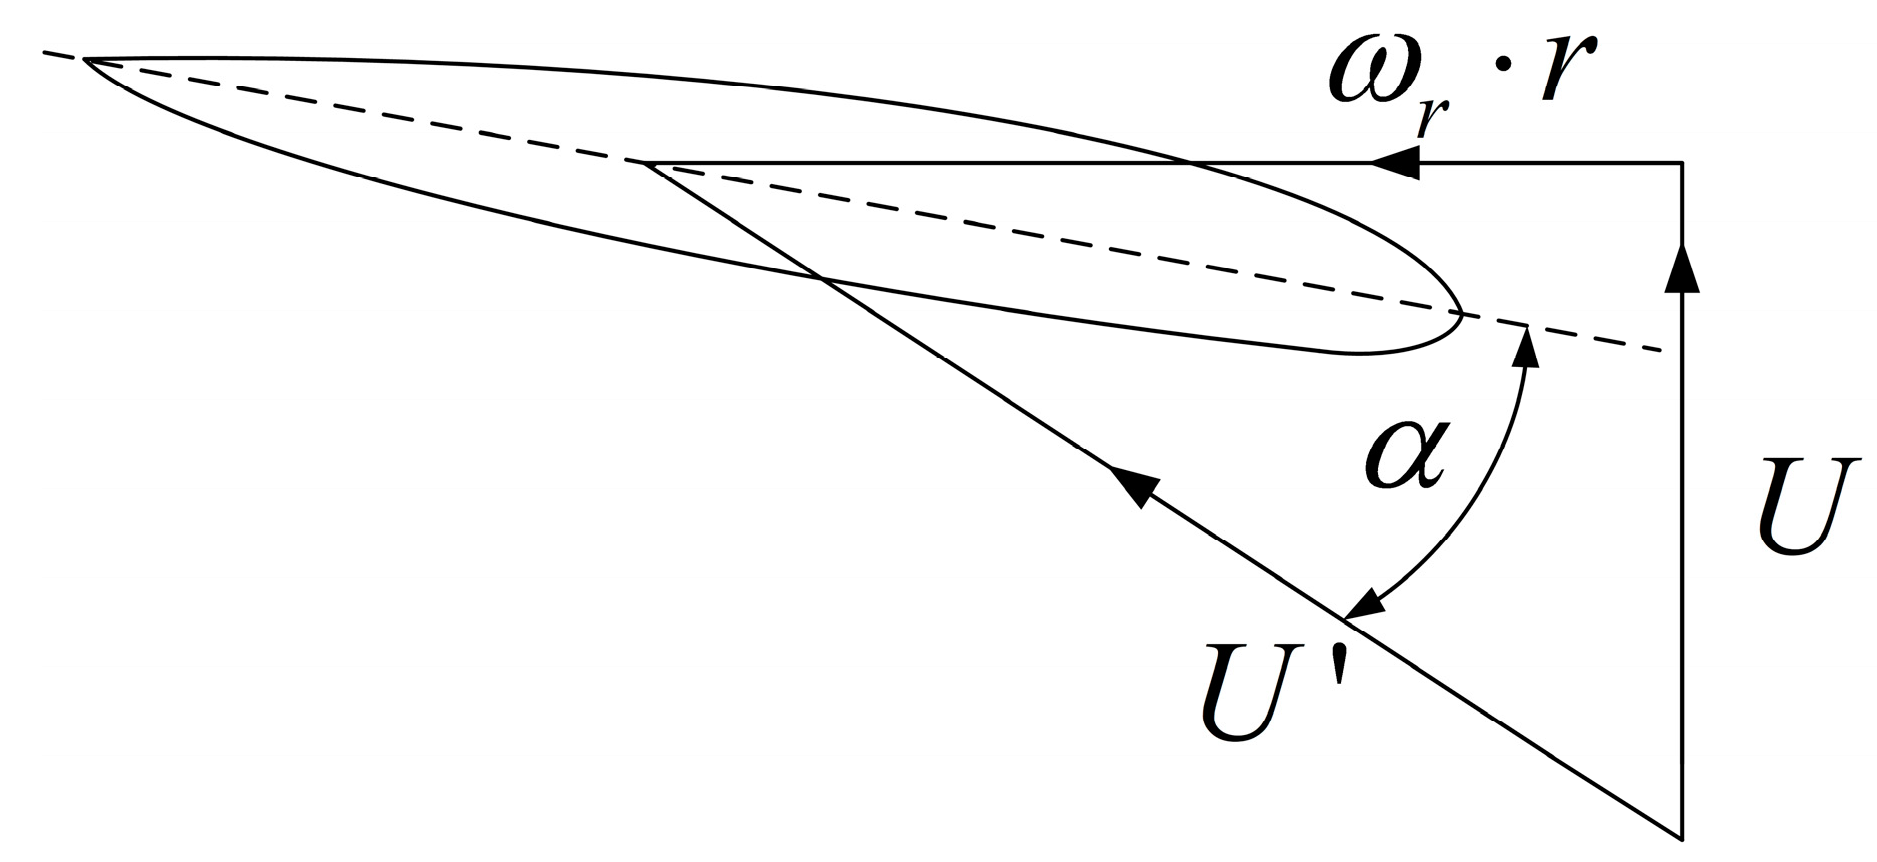
Figure 13.
Pressure distribution on the pressure surface and suction surface of the blade when tip speed ratio is 6.
Figure 13.
Pressure distribution on the pressure surface and suction surface of the blade when tip speed ratio is 6.
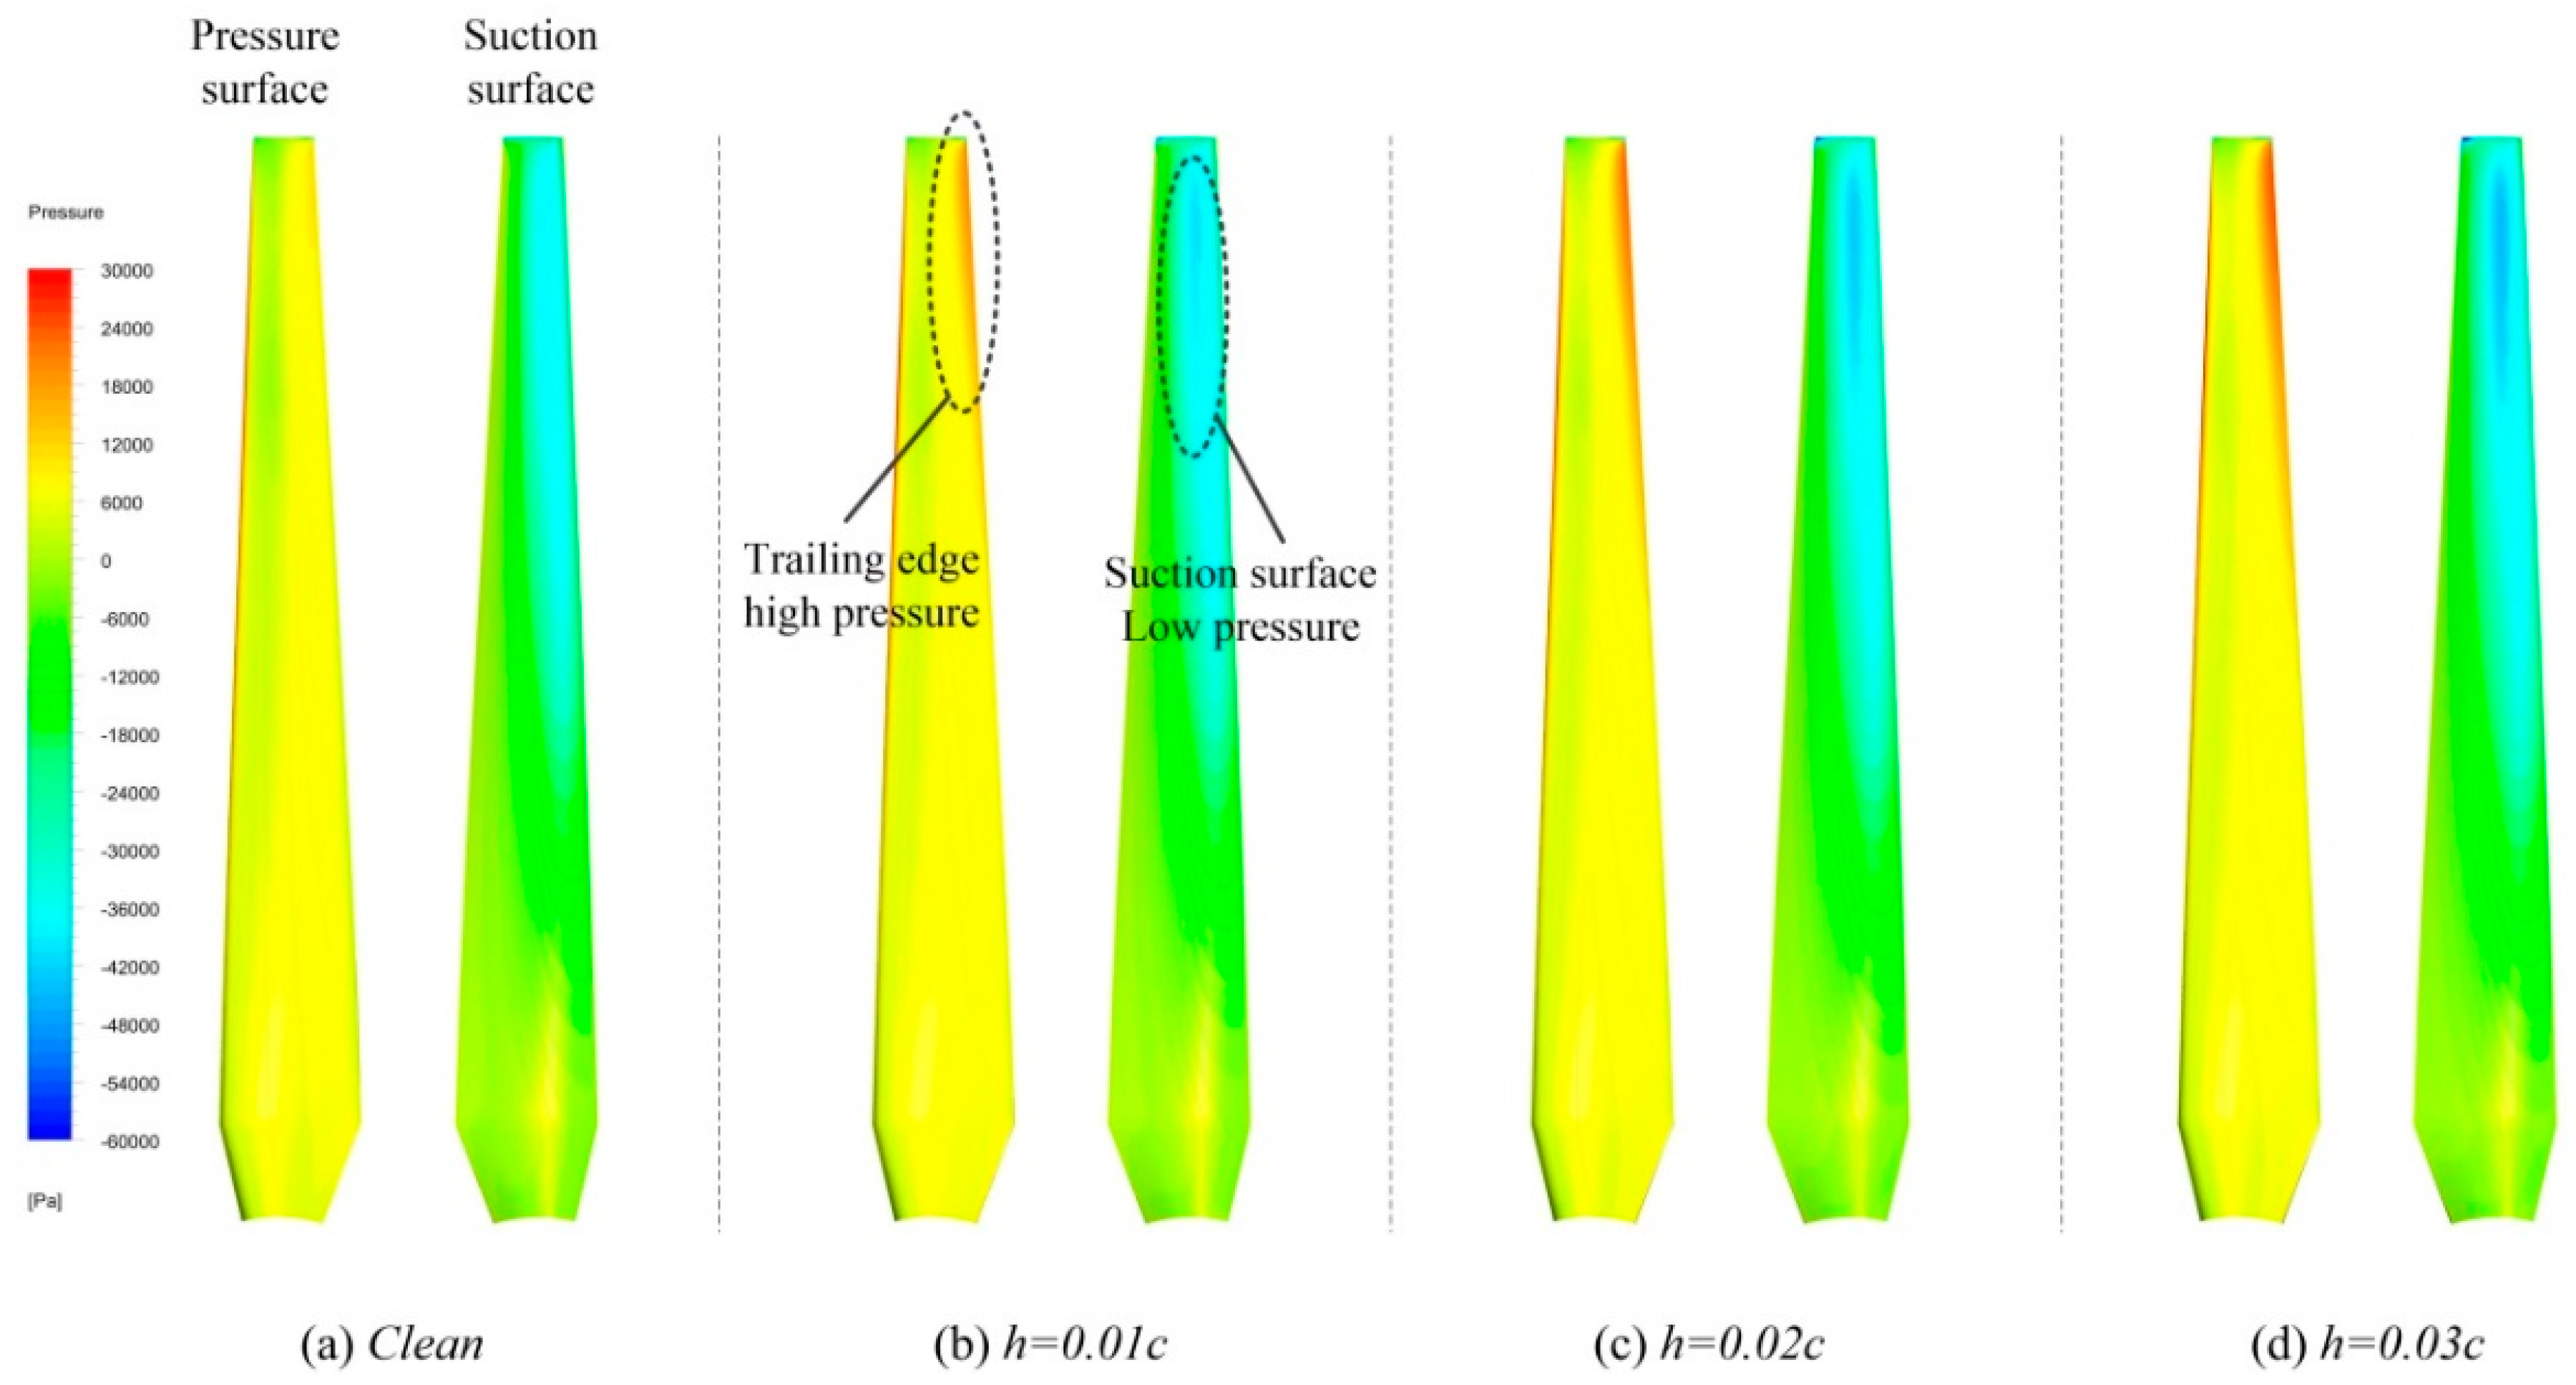
Figure 14.
Turbine with different radial dimensions of Gurney flaps: (a) power coefficient, (b) thrust coefficient.
Figure 14.
Turbine with different radial dimensions of Gurney flaps: (a) power coefficient, (b) thrust coefficient.
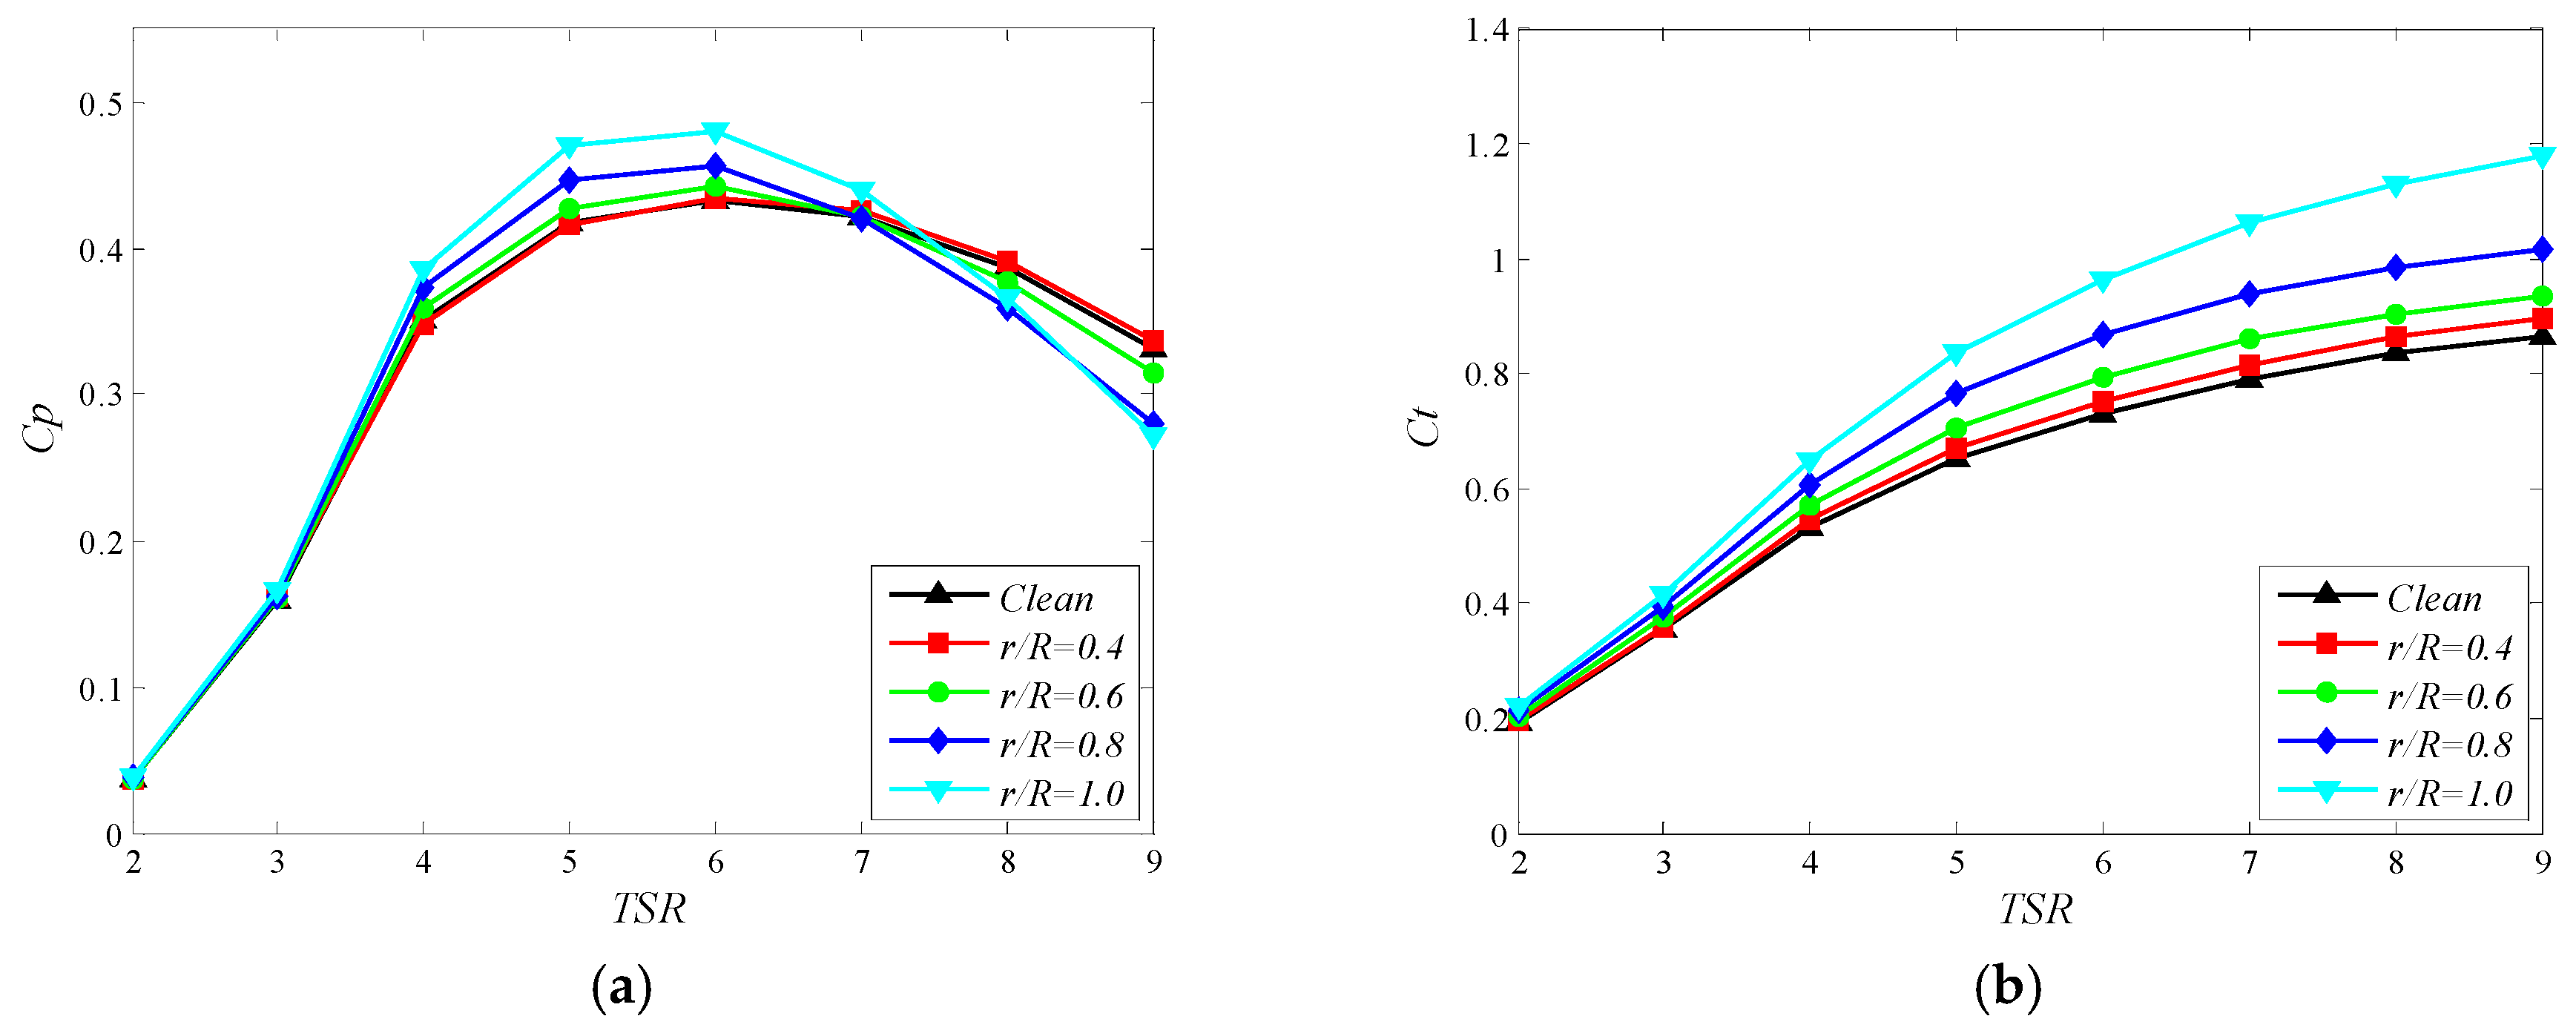
Figure 15.
Contribution of different radial lengths to peak power factor.

Figure 16.
Pressure distribution on the pressure side and suction side of the blade when tip speed ratio is 6.
Figure 16.
Pressure distribution on the pressure side and suction side of the blade when tip speed ratio is 6.

Figure 17.
Velocity contours on turbine when tip speed ratio is 6.

Table 1.
Rotor parameters.
| Number of blades | 3 |
| Rotor diameter [m] | 0.8 |
| Hub radius [m] | 0.05 |
| Hub length [m] | 0.6 |
| Rotor radius [m] | 0.4 |
| Flap length [m] | 0, 0.4 R, 0.6 R, 0.8 R, R |
| Flap height [m] | 0, 0.01 c, 0.02 c, 0.03 c |
| Free-stream velocity [m/s] | 1.73 |
| Turbulence intensity [%] | 2 |
| Rotational speed [rad/s] | 8.65~38.925 |
| Tip speed ratio | 2~9 |
Disclaimer/Publisher’s Note: The statements, opinions and data contained in all publications are solely those of the individual author(s) and contributor(s) and not of MDPI and/or the editor(s). MDPI and/or the editor(s) disclaim responsibility for any injury to people or property resulting from any ideas, methods, instructions or products referred to in the content. |
© 2023 by the authors. Licensee MDPI, Basel, Switzerland. This article is an open access article distributed under the terms and conditions of the Creative Commons Attribution (CC BY) license (https://creativecommons.org/licenses/by/4.0/).
Share and Cite
MDPI and ACS Style
Mao, Z.; Zhang, T.; Yang, G.; Tian, W. Effects of Gurney Flaps on the Performance of a Horizontal Axis Ocean Current Turbine. J. Mar. Sci. Eng. 2023, 11, 2188. https://doi.org/10.3390/jmse11112188
AMA Style
Mao Z, Zhang T, Yang G, Tian W. Effects of Gurney Flaps on the Performance of a Horizontal Axis Ocean Current Turbine. Journal of Marine Science and Engineering. 2023; 11(11):2188. https://doi.org/10.3390/jmse11112188
Chicago/Turabian StyleMao, Zhaoyong, Tianqi Zhang, Guangyong Yang, and Wenlong Tian. 2023. "Effects of Gurney Flaps on the Performance of a Horizontal Axis Ocean Current Turbine" Journal of Marine Science and Engineering 11, no. 11: 2188. https://doi.org/10.3390/jmse11112188
Note that from the first issue of 2016, this journal uses article numbers instead of page numbers. See further details here.