1. Introduction
Ship traffic has increased as the world emerges from the COVID-19 pandemic, leading to a surge in global maritime activities. This escalation in ship movements underscores the importance of preemptively identifying abnormal ship movements to prevent accidents. Existing research on anomaly detection for ships displaying irregular movements has predominantly relied on the integration of the automatic identification system (AIS) [
1,
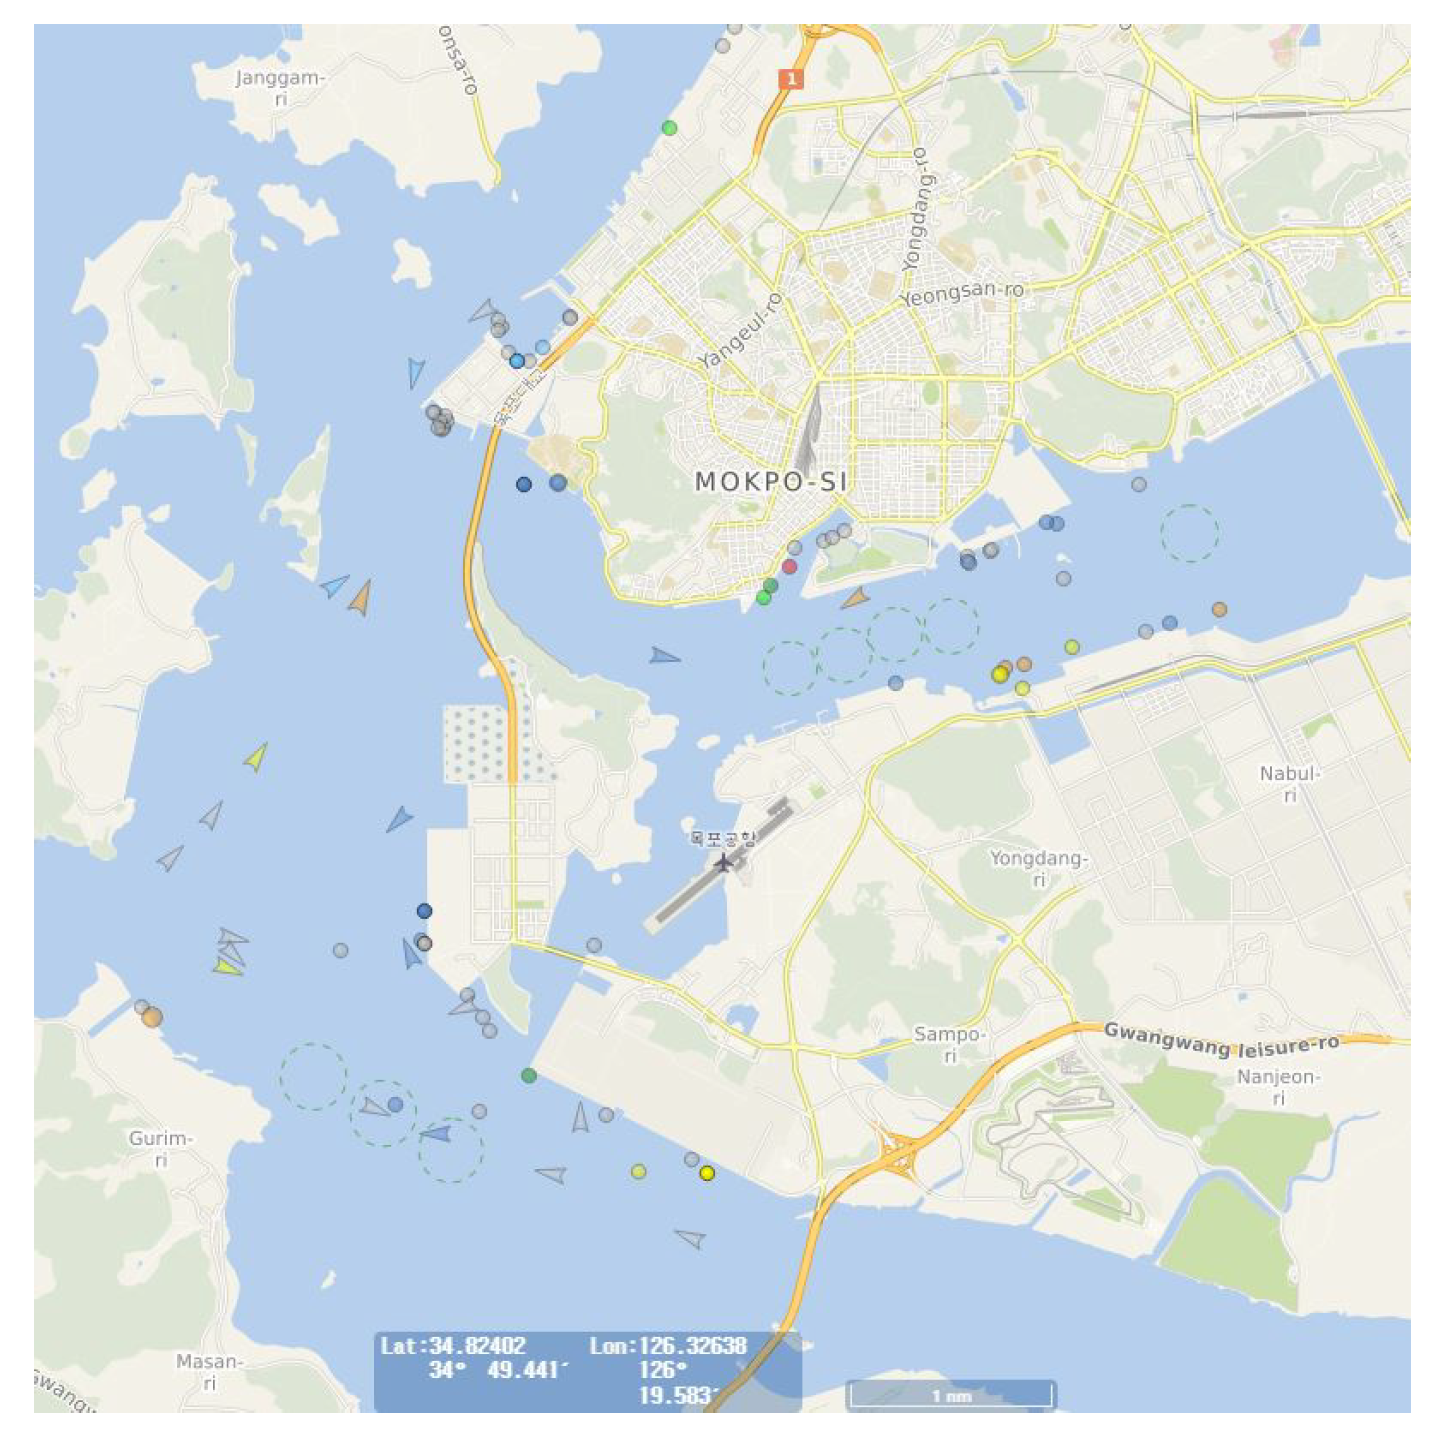
2]. However, this approach has its limitations. Notably, significant data gaps exist in AIS data communication. Consequently, accurately determining ship movements in narrow coastal areas such as harbors becomes challenging, depending on data reception intervals, as illustrated in
Figure 1. Moreover, the lack of integration between AIS and visual data yields non-intuitive insights. Thus, the exclusion of many ships, especially smaller ones lacking AIS equipment, poses a substantial challenge.
Meanwhile, machine learning is evolving rapidly, driving significant advancements across various areas, particularly in processing image and video data. Interestingly, this surge of innovation has broad implications, influencing various fields such as safety, security, and surveillance. In response to this dynamic context, our research focuses on diverging from conventional methods that heavily depend on AIS data for tracking ship movements. Instead, we focus on harnessing the potential of closed-circuit television (CCTV) video data to detect anomalies in maritime activities (
Figure 2). Particularly, our study represents a significant shift rooted in the vision of pioneering a new era in machine learning-based anomaly detection for ship movements using CCTV videos.
At the core of our research lies the development of a novel machine learning-based method that capitalizes on the rich insights embedded within CCTV video data. Specifically, this innovative method aims to overcome limitations tied to conventional AIS-based techniques and unlock a more nuanced understanding of ship behaviors. As we delve into new horizons, sophisticated graph-based analytics and nuanced insights from CCTV video data emerge as guiding factors. Particularly, this direction shapes our efforts to redefine how we identify anomalies in maritime activities. With this goal in mind, we aim to contribute to enhancing maritime security in our ever-more connected world.
Specifically, this study focuses on identifying abnormal ship behaviors using object detection and tracking techniques, utilizing data from maritime observation CCTV systems. We aim to represent ship paths as graphs, enabling us to recognize regular routes and deviations from them. This approach is particularly pertinent for detecting paths that deviate significantly from the norm, indicating potentially unusual or unsafe activities.
Furthermore, our investigation capitalizes on real-time object tracking methods, known for their ability to instantly process data, handle extensive datasets, adapt to various contexts, enable live monitoring, and automate processes. Particularly, these attributes align with our overarching goal: developing a service dedicated to accident prevention through the analysis of CCTV video data. More specifically, we employ detection models based on YOLO (You Only Look Once) [
3] and utilize tracking algorithms grounded in SORT (Simple Online and Realtime Tracking) [
4] to achieve this objective.
The structure of the paper is as follows:
Section 2 presents related research on anomalous pattern detection in ships via CCTV and explores prior studies in identifying anomalous ships through AIS integration. In
Section 3, our method to identify abnormal ship behaviors is presented and visualization techniques are introduced.
Section 4 explores the dataset, experimental methods, and results. Finally, in
Section 5, the proposed approach is summarized, highlighting avenues for future research.
2. Related Work
In this section, we summarize popular object tracking and detection algorithms, focusing on well-established methods and the algorithms employed in our study: YOLOv7 [
5] for object detection and StrongSORT [
6] for object tracking. In addition, we introduce several algorithms adopted for identifying anomalous ship movements.
2.1. Object Detection
Object detection entails recognizing and localizing meaningful objects within images and videos. Specifically, it addresses various challenges, including face detection, video tracking, and people counting. Conventional object detection methods involve feature extraction using techniques, such as Haar features [
7], scale-invariant feature transform (SIFT) [
8], and histogram of oriented gradient (HOG) [
9], coupled with classification algorithms such as support vector machine (SVM) and adaptive boosting (AdaBoost). More recently, convolutional neural network (CNN)-based approaches have gained prominence, divided into 1-stage and 2-stage detectors. The 1-stage detectors, exemplified by YOLO and SSD [
10], offer real-time processing, while 2-stage detectors such as Faster R-CNN [
11] use region proposal networks to enhance accuracy. YOLOv7 [
5], a 1-stage detector, is selected in this paper for its real-time capability and improved accuracy.
Meanwhile, Faster R-CNN [
11] is a deep learning-based object detection algorithm that improves the speed of R-CNN by using a region proposal network (RPN) to generate candidate regions for object detection. Specifically, it extracts features using CNNs, transforms regions, and performs classification and bounding box regression. EfficientDet [
12] focuses on maximizing efficiency and performance by minimizing model size. Particularly, it uses EfficientNet as a backbone and introduces compound scaling to control network size. In addition, BiFPN is utilized for feature fusion across different levels. YOLOv7 [
5] is a regression-based object detection model that directly predicts bounding box coordinates and class probabilities. Specifically, it improves performance through model reparameterization and label assignment, maintaining real-time capabilities while achieving higher accuracy [
13].
2.2. Object Tracking
Object tracking identifies and continually tracks moving objects within image sequences or videos. Specifically, it interacts closely with object detection, enhancing detection results with temporal consistency. Particularly, kernelized correlation filter (KCF) [
14] and DeepSORT [
15] (that builds upon SORT), are notable tracking algorithms. DeepSORT integrates deep learning and the Kalman filter to achieve more accurate tracking; its enhanced version, StrongSORT [
6], features improvements in appearance and motion estimation, yielding superior performance.
KCF [
14] exploits pixel correlation to track objects in real time, utilizing a kernel function to measure the similarity between object and pixel values. DeepSORT [
15] combines deep learning with the Kalman filter to perform online object tracking, addressing challenges such as occlusion and fragmentation. Furthermore, StrongSORT [
6] improves upon DeepSORT by incorporating appearance features from a more robust backbone network and a refined motion estimation algorithm, leading to enhanced performance.
2.3. Enhancing CCTV Image Quality
Abnormal tracks or behavior often occur at night or in heavy weather conditions when visibility is poor. CCTV images under such conditions may be blurry and inconspicuous, posing challenges for the detection of abnormal ship movements. To address these issues, image preprocessing techniques can be applied to enhance the quality of CCTV video data. Preprocessing can help remove noise and improve image clarity, enabling more accurate identification of a ship’s trajectory and more effective detection of abnormal movements. Such preprocessing methods hold the potential to significantly improve anomaly detection performance, particularly in adverse weather or low-light conditions. To enhance the quality of CCTV images affected by adverse weather conditions, researchers have explored various image processing techniques. Shwartz et al. [
16] studied methods for improving the visibility of images degraded by atmospheric conditions. Similarly, Narasimhan et al. [
17] studied the challenges of restoring image contrast in weather-degraded conditions.
2.4. Anomalous Ship Identification Studies
Existing studies focusing on identifying anomalous ship movements primarily utilize AIS data. Some studies identify anomalies based on maritime big data to analyze ship anomaly trajectories [
18]. In particular, clustering-based approaches [
19] compress AIS data into lower-dimensional vectors, employing k-means and k-NN algorithms to group and classify trajectories based on similarity metrics. However, AIS data have limitations, including errors, limited coverage, and the absence of equipment on smaller ships. These studies underscore the significance of ship anomaly detection but also highlight AIS data limitations. Interestingly, integrating object detection and tracking methods can address these limitations and offer a more comprehensive approach to anomaly detection in maritime environments. Existing research on anomaly detection at the graph level could be adapted for this purpose [
20,
21]. As most trajectories are normal, using this method to identify anomalous trajectories can efficiently eliminate the need to select only normal patterns during dataset preparation manually. However, it should be noted that these approaches can be complex to implement in practice.
3. Methodology
In this section, we address the limitations observed in prior research concerning the identification of anomalous ship movements by introducing the use of CCTV video data as opposed to AIS data. Our study focuses on identifying anomalous ship behaviors using CCTV videos, assuming consistent maritime scenes across different time frames. In particular, we assume that the more significant the difference between a pre-learned ship trajectory pattern and the pattern under comparison, the higher the likelihood of indicating an anomalous path.
In this context, we propose a novel algorithm to differentiate between learned normal trajectory patterns and distinctive anomalous trajectory patterns. More specifically, this algorithm aims to identify deviations from established normal patterns and discern patterns indicative of anomalous behavior, contributing to enhanced ship anomaly detection within maritime environments.
3.1. Proposed Method
The methodology presented in this paper is summarized in Algorithms 1 and 2. In Algorithm 1, normal ship movement patterns are acquired through learning training. In Algorithm 2, these learned ship movement patterns are used to detect ships with abnormal movements. This approach compares the ship’s trajectory being tested to the learned patterns, facilitating the identification of anomalous ships.
| Algorithm 1: Generating Pattern Graphs. |
input : Training CCTV video , positive integer M, N, threshold; output: Detection of Abnormal Ship Behavior V; Divide the training video into intervals at regular intervals; Create nodes, each representing an interval; Detect and track each ship in using StrongSORT and YOLOv7; By using StrongSORT and YOLOv7, detect and track each ship in , enabling the extraction of positional coordinates , and a unique identifier, denoted as shipID m, for each ship; Compute using and ; If m exists, connect the ; Generate a directed graph using and m; Remove graphs from where the size of a path is below the threshold; return ;
|
| Algorithm 2: Detecting Abnormal Ships. |
input : Test CCTV video , pattern graph , positive integer M, N; output: Detection of Abnormal Ship Behavior V; Set ; Execute the same process as lines 1 through 7 of Algorithm 1 for ; Generate a directed graph using and m; If there is no match between and , set ; return V;
|
The algorithm’s process can be summarized as follows: First, the trajectories of ships moving normally are transformed into graphs. These are achieved by dividing CCTV video data into
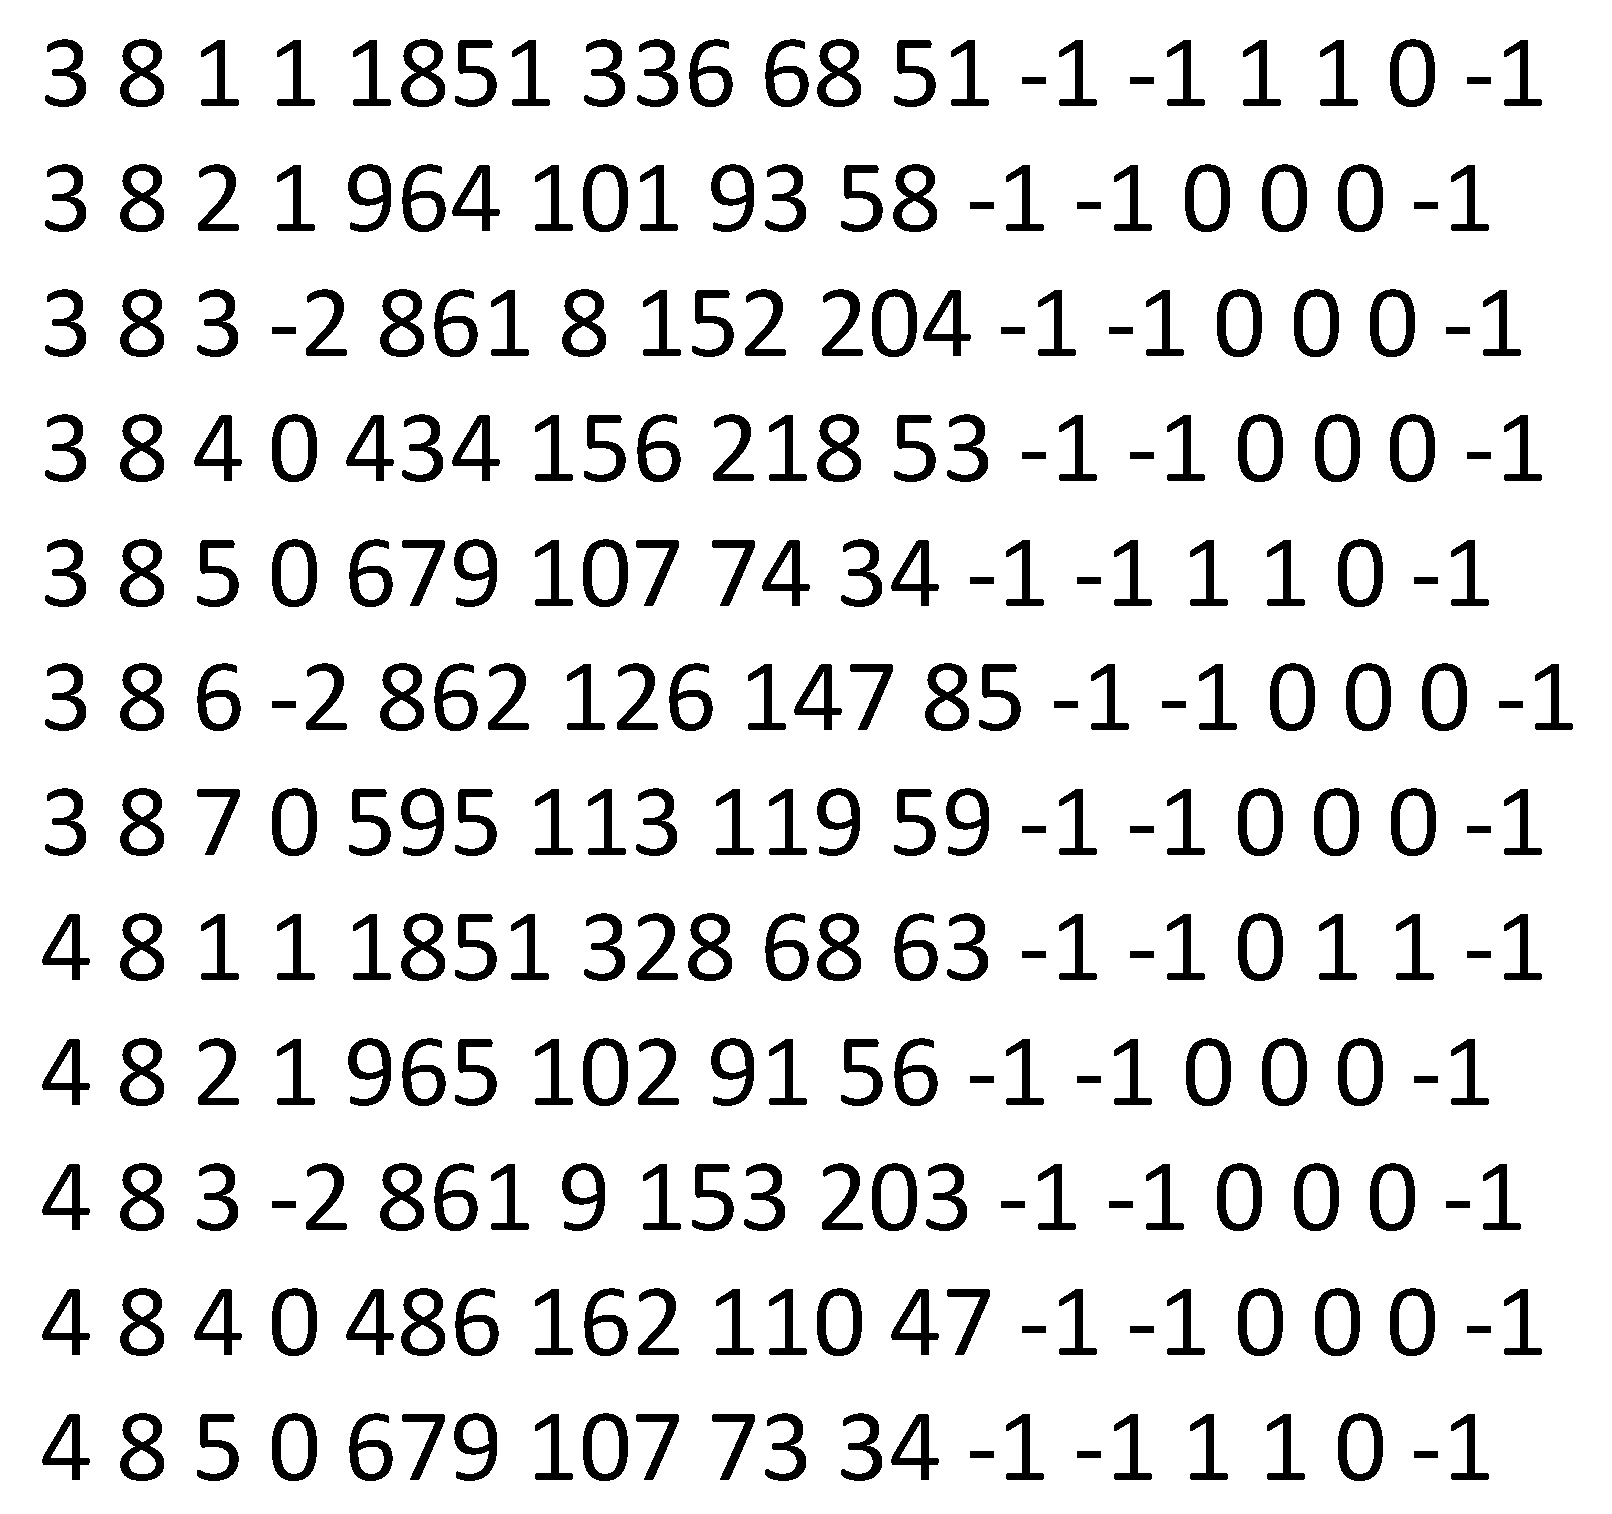
segments within training data and tracking ships using a tracking algorithm. The tracking results, presented in a text file, include frame numbers, object identifications (IDs), and coordinates of bounding boxes, as depicted in
Figure 3.
Specifically, each segment traversed by a ship is depicted as a node, while connections between sequential segments are denoted as directed links. These nodes and links collectively constitute a directed graph, which is referred to as a “pattern graph”. The ship’s traversal through these nodes is determined based on the ship’s coordinates, as illustrated in
Figure 3. These nodes are then connected to form the pattern graph. The equation to derive the node from tracking results is given as follows.
where
and
represent the ship’s
x and
y coordinates within the video frame, with the origin
located at the top-left corner and the maximum coordinates
situated at the bottom-right corner.
Example 1. Given a video with a width of 1920 and a height of 1080, where M is 5 and N is 7, suppose the detected ship’s x and y coordinates are 500 and 1000, respectively. In this scenario, is calculated as . Thus, it equals , resulting in .
Figure 4 illustrates an example graph with
. Precisely, solid lines represent the paths of individual ships and form a pattern graph. The pattern graph generated by the proposed algorithm for normal ship movements demonstrates a relatively simple structure with a limited number of participating nodes when compared to the total number of nodes. In addition, the number of incoming and outgoing links within this pattern graph is quite similar. This structured pattern graph provides a visual representation of the typical movement patterns observed.
Furthermore, a threshold is set to remove stationary or falsely detected objects within the generated directed graph. Graph paths with lengths below the threshold are eliminated, resulting in a final set of learned pattern graphs representing normal ship movements. This structured graph is referred to as the pattern graph. Particularly, the pattern graph comprises nodes representing features and edges indicating connectivity information. The division of ship trajectories into segments during the creation of the normal path pattern graph prevents misidentification due to minor pixel differences or incomplete learning of normal paths.
The same graphing process is applied for the ship under scrutiny for anomalous movement identification, creating a target graph. By comparing the target graph with the pattern graphs derived from training data, anomalous behavior is identified if no matching pattern is found within the pattern graph. The identification result includes the ship’s ID, coordinates, and indicates whether the detected behavior is true or false.
3.2. Visualizations
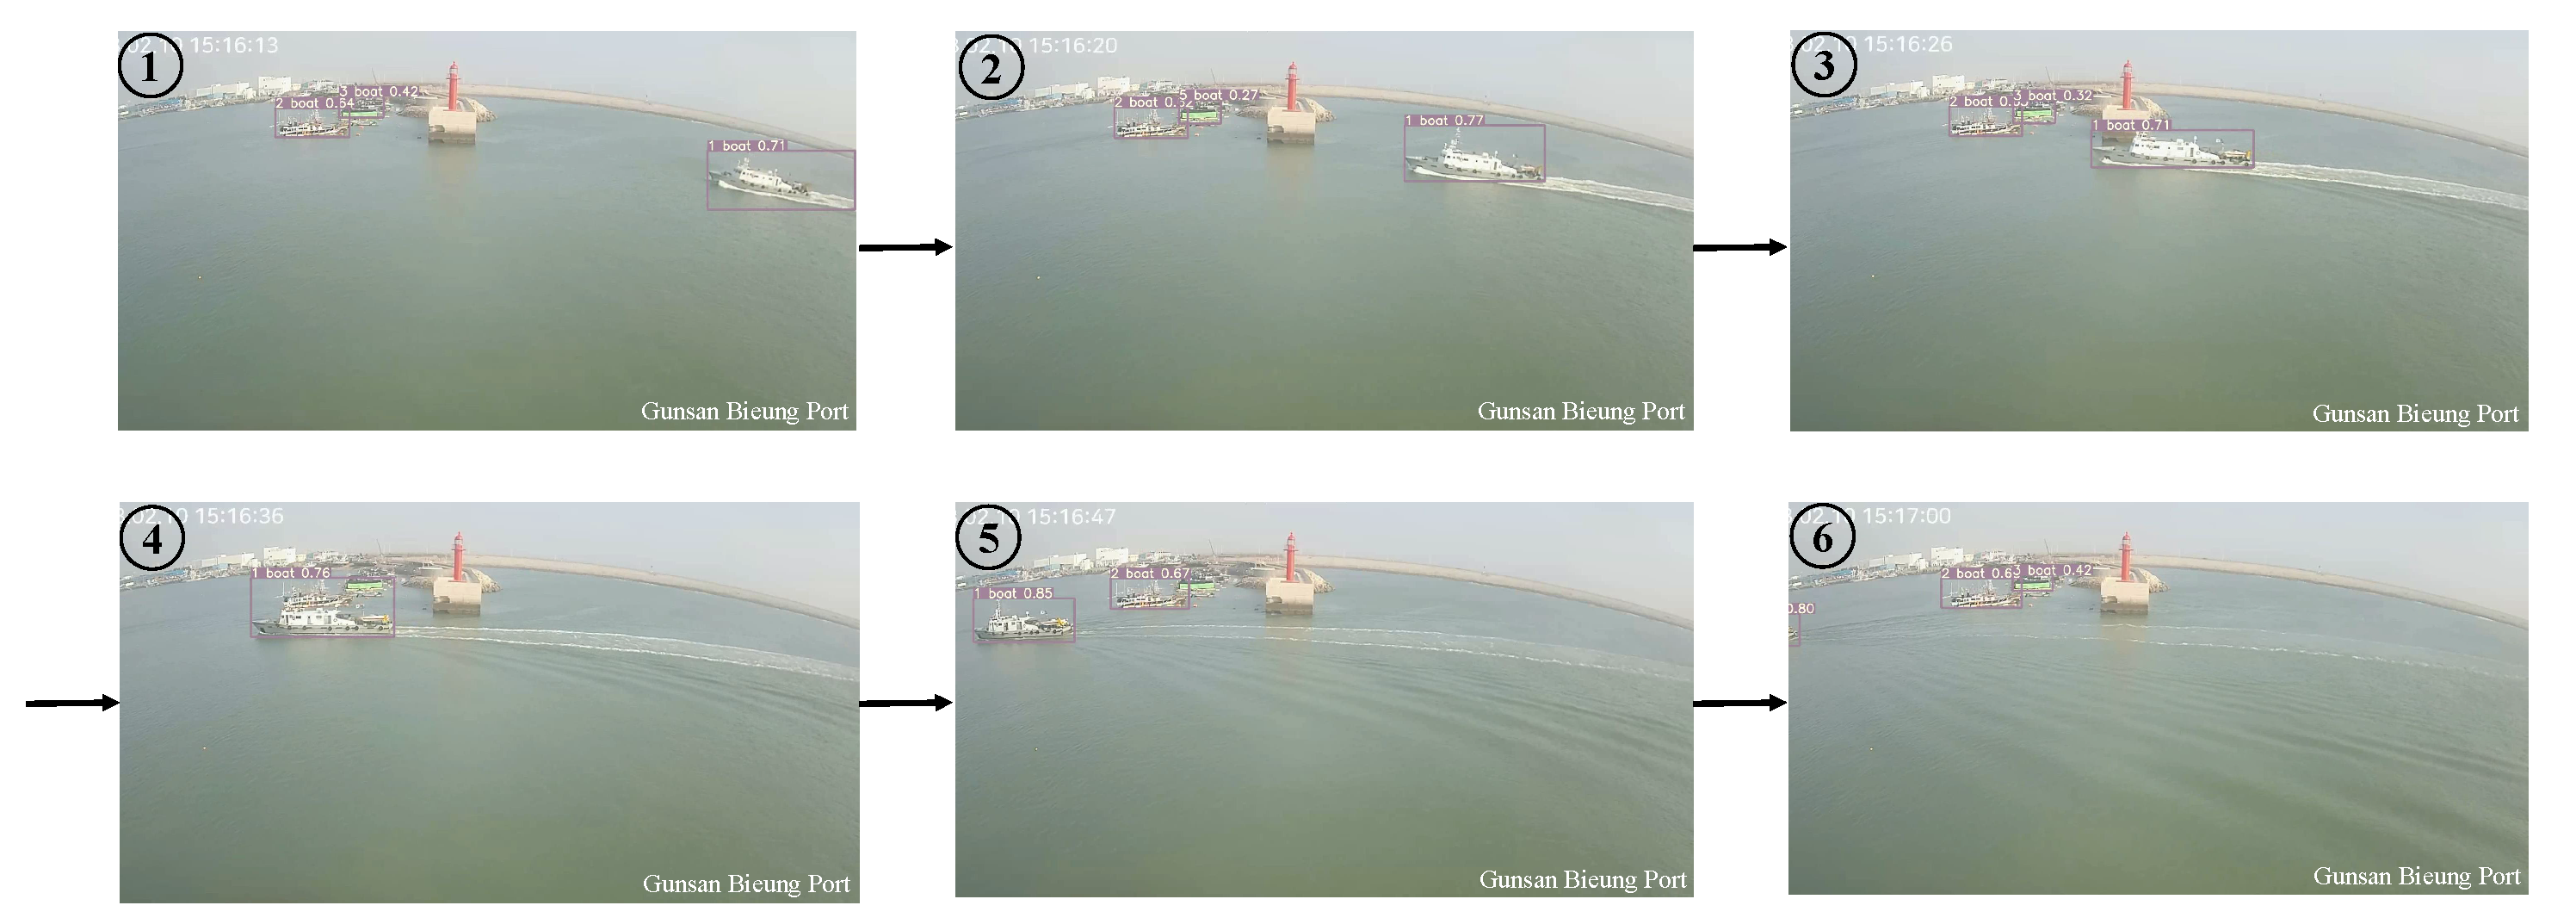
Expanding ship-traffic control zones, due to increased maritime traffic, has led to a heightened workload for control personnel. Moreover, instances of traffic congestion during peak hours can result in controllers failing to perceive potential risks. Along with the automated identification of anomalous ship behavior, visualization techniques were employed to facilitate the intuitive and straightforward detection of abnormal ships. As shown in
Figure 5, the results of ship tracking using StrongSORT and YOLOv7 are displayed in sequential order, demonstrating the successful tracking of ships as they pass through.
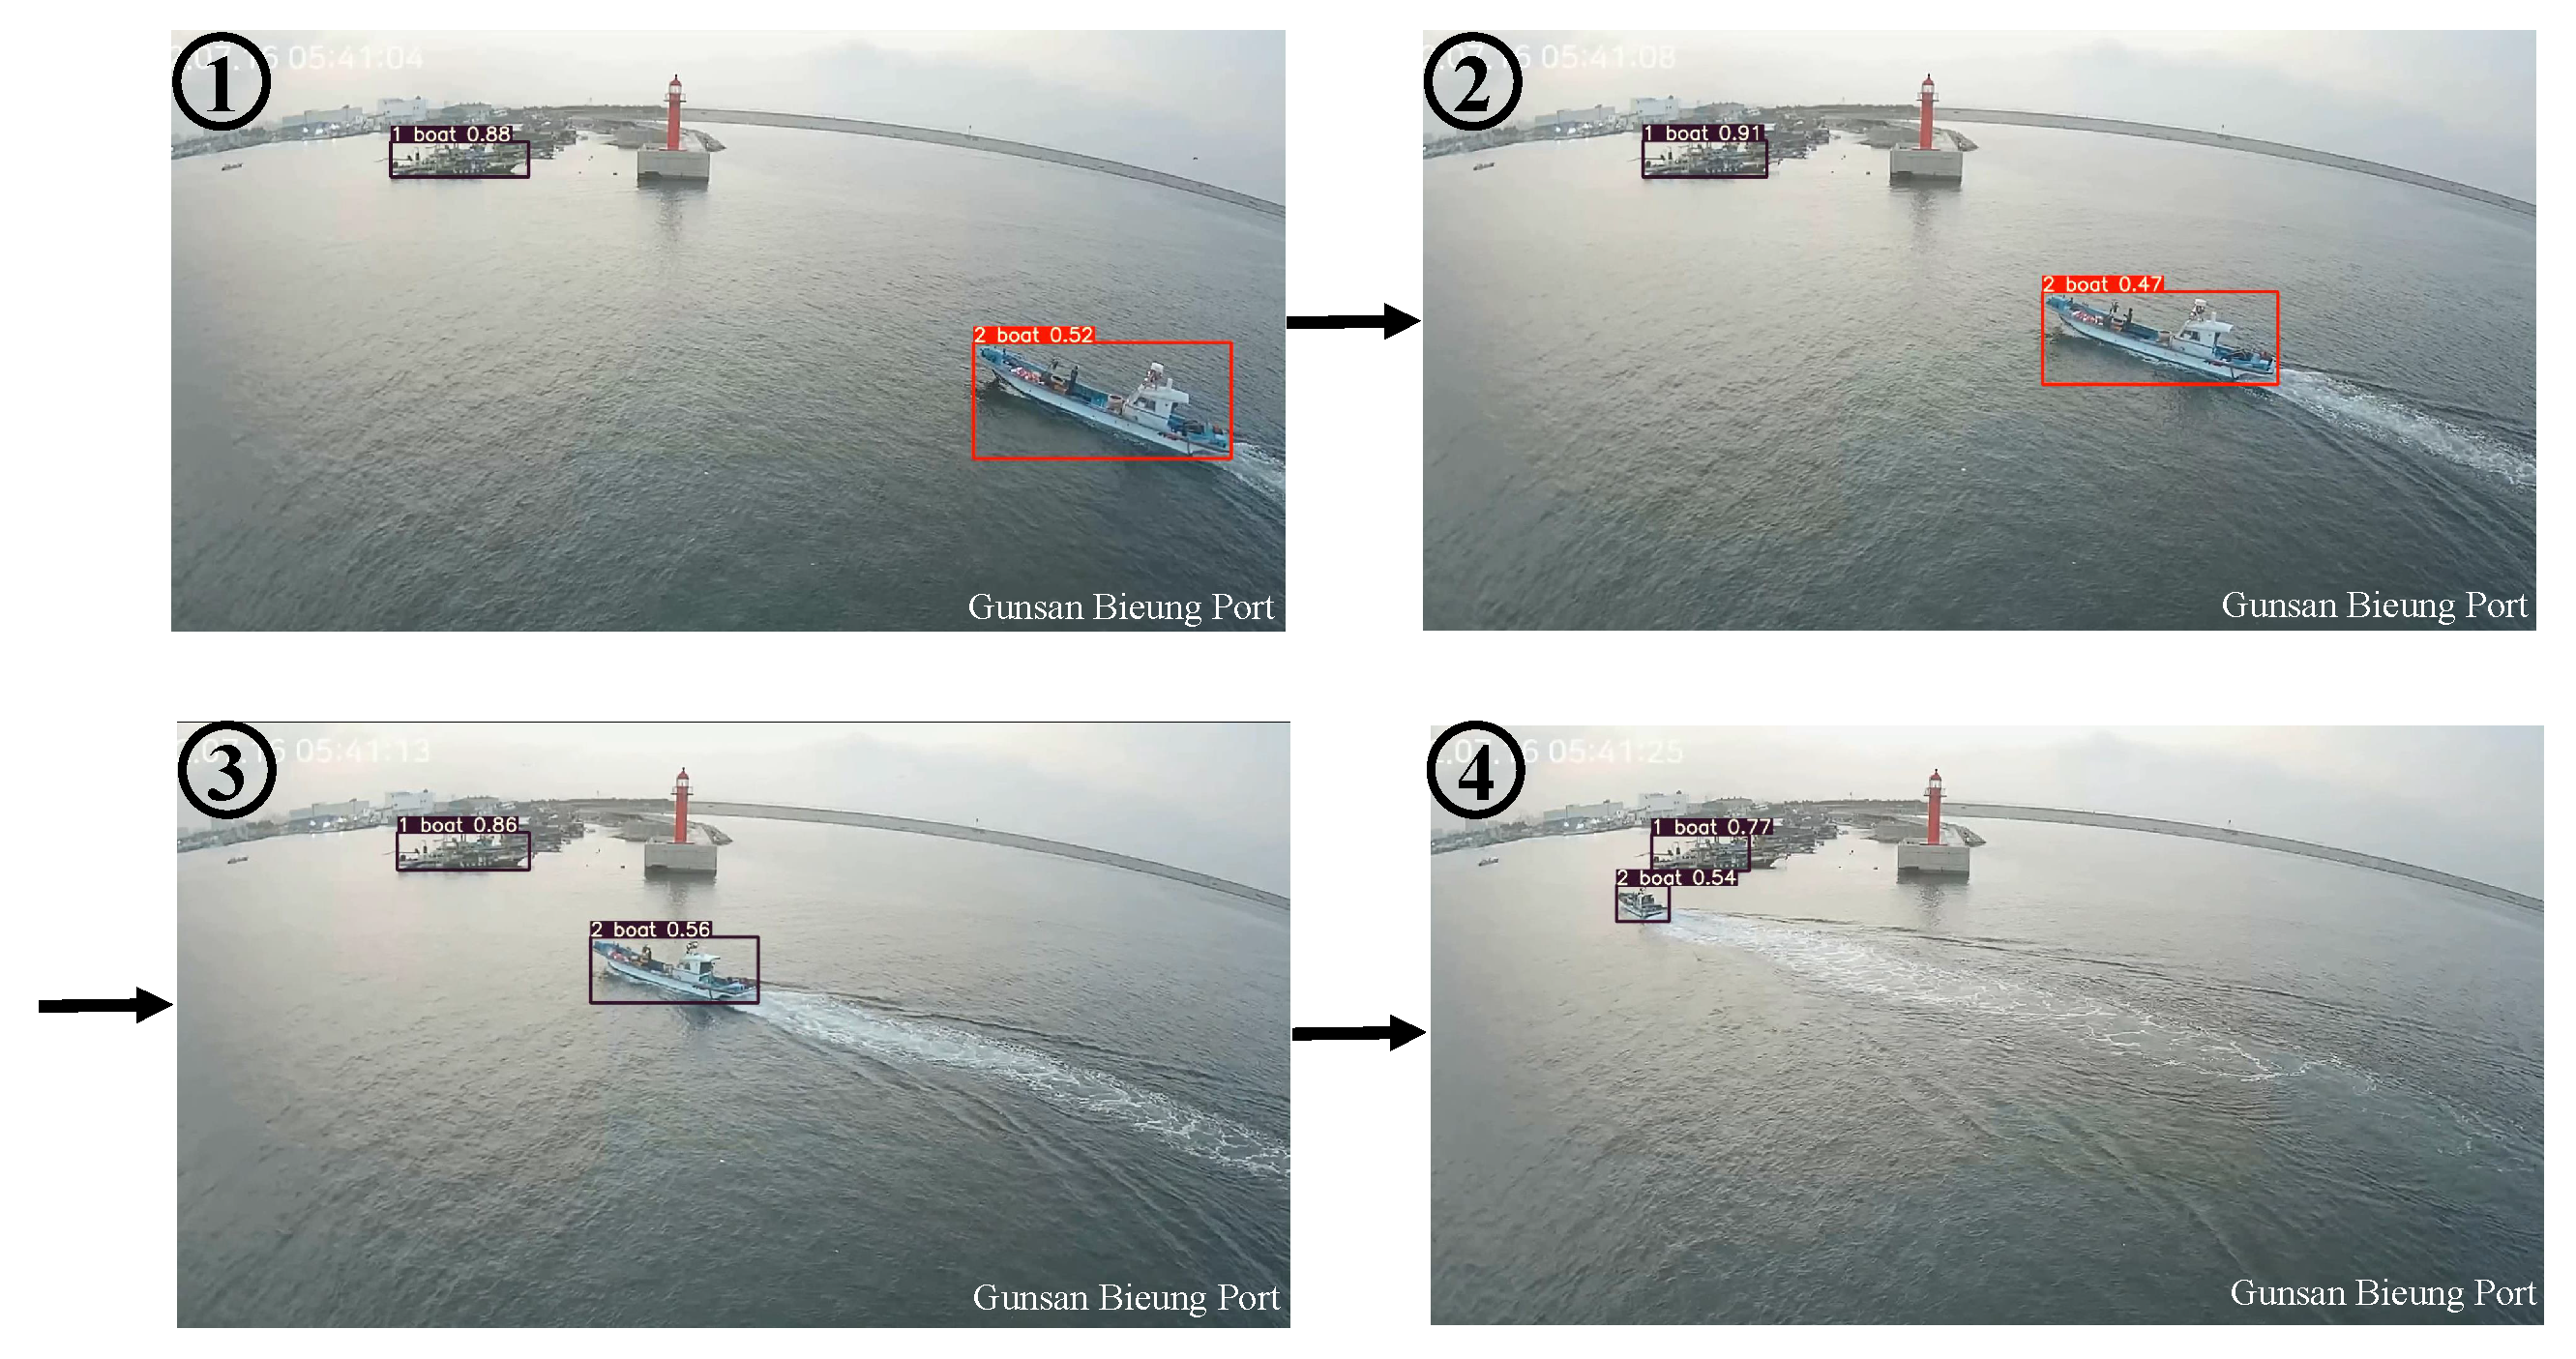
Furthermore,
Figure 6 employs distinct colors for bounding box visualization to identify ships with abnormal movements, utilizing the results obtained through the approach proposed in this paper. Specifically, when a ship follows an anomalous path, its bounding box is highlighted in red; conversely, if it follows a normal path, a different color is used for the bounding box. This visual representation allows an immediate understanding of where abnormal movements occurred on the sea, enabling faster decision-making.
Figure 6 is an example from Experiment 3, Case 7, illustrating the distinction between abnormal and normal paths. However, instances occurred where abnormal paths were misclassified as normal, or conversely, normal paths were classified as abnormal. Each of these cases has been detailed in the experimental section.
4. Experiments
4.1. Experimental Environments
The hardware and environmental resources for conducting experiments on the proposed method in this paper are outlined in
Table 1.
4.2. Datasets
In this paper, we utilized ship movement collected through CCTV installed at Bieung Port in Gunsan, South Korea. While the precise coverage area of the CCTV cameras used in this study was not explicitly defined, it is noteworthy that the region generally accommodates small to medium-sized vessels with an average length of approximately 24 m. More specifically,
Table 2 provides information about the data for training the normal pattern graph.
Table 2 presents the count of ships demonstrating normal patterns, excluding those encountering issues such as stationary ships or detection errors. Particularly during nighttime or adverse weather conditions, there is an increased likelihood of object identification errors due to reduced illumination in the videos. Therefore, we conducted video data collection on days with abundant daylight. For this experiment, we consistently used a total of 7 h of video data, recorded from 09:00 to 16:00, over three consecutive days.
In ordinary ship movements, the likelihood of irregular behavior, such as deviating from predetermined routes due to accidents, is extremely low. This indicates that there is sufficient data for learning normal patterns, but there are limitations when it comes to learning patterns of abnormal ship behavior in the context of machine learning. Despite collecting CCTV videos for approximately two months, obtaining distinct examples of abnormal ship behavior suitable for use as test cases proved to be challenging. We experienced challenges in finding cases that showed clear abnormal behavior, such as ships drifting in circular patterns, exhibiting unusual curves during movement, or abruptly stopping in the middle of their route.
Therefore, in order to identify abnormal ship movements, we assumed four cases that followed paths as different as possible from the learned pattern graphs as abnormal ships and conducted experiments using three normal cases.
Table 3 presents the number of target ships included in each case video, the total number of frames in the video, and a comparison of the paths of target ships in the case video with the normal pattern graph. Furthermore,
Table 3 shows the count of frames that should be classified as normal paths based on pattern matching and the count of frames that should be classified as significantly different abnormal paths. As depicted in
Table 3, cases 6 and 7 each encompass two ships including abnormal patterns (i.e., objective # of ships). The experiments present outcomes for an individual ship with an abnormal pattern, with the outcomes for case 6 indicated as case 6-1 and case 6-2, and the outcomes for case 7 denoted as case 7-1 and case 7-2.
4.3. Experimental Setup
The YOLOv7 and StrongSORT algorithms were employed in the detection and tracking processes for the experiments, respectively. We employed the pre-trained YOLOv7-e6e model for YOLOv7, which had undergone training on the MS-COCO dataset [
22], a widely recognized dataset in the field of image recognition. In the case of StrongSORT, we utilized the pre-trained OSnet model sourced from the Market-1501 [
23] and DukeMTMC-reID [
24] datasets. Furthermore, to mitigate coordinate jitter resulting from changes in bounding box size during pattern learning and abnormal pattern detection, we conducted detection and tracking at intervals of 20 frames in the CCTV video. Specifically, we conducted three experiments using different values of
N,
M, and threshold. In the first experiment,
M was set to 48, and
N was set to 27, resulting in a total of 1296 segments. We trained normal patterns from these segments and generated pattern graphs. A threshold of 5 was set, indicating that patterns with a length of five or fewer segments (i.e., those traversing fewer than five segments) were considered stationary ships or misidentified objects and excluded from abnormal path comparisons. In the second experiment, we configured
M as 32,
N as 18, and set the threshold to 3. For the third experiment,
M was set to 16,
N to 9, and the threshold to 1. The experimental settings for each scenario are summarized in
Table 4.
4.4. Experimental Results
For each test case in the experiments, a confusion matrix was computed to calculate the final results. In cases where detection was interrupted but not completely missed from the start, it was assumed that the result for the ship in question was the same as its previous detection.
4.4.1. Results of Experiment 1
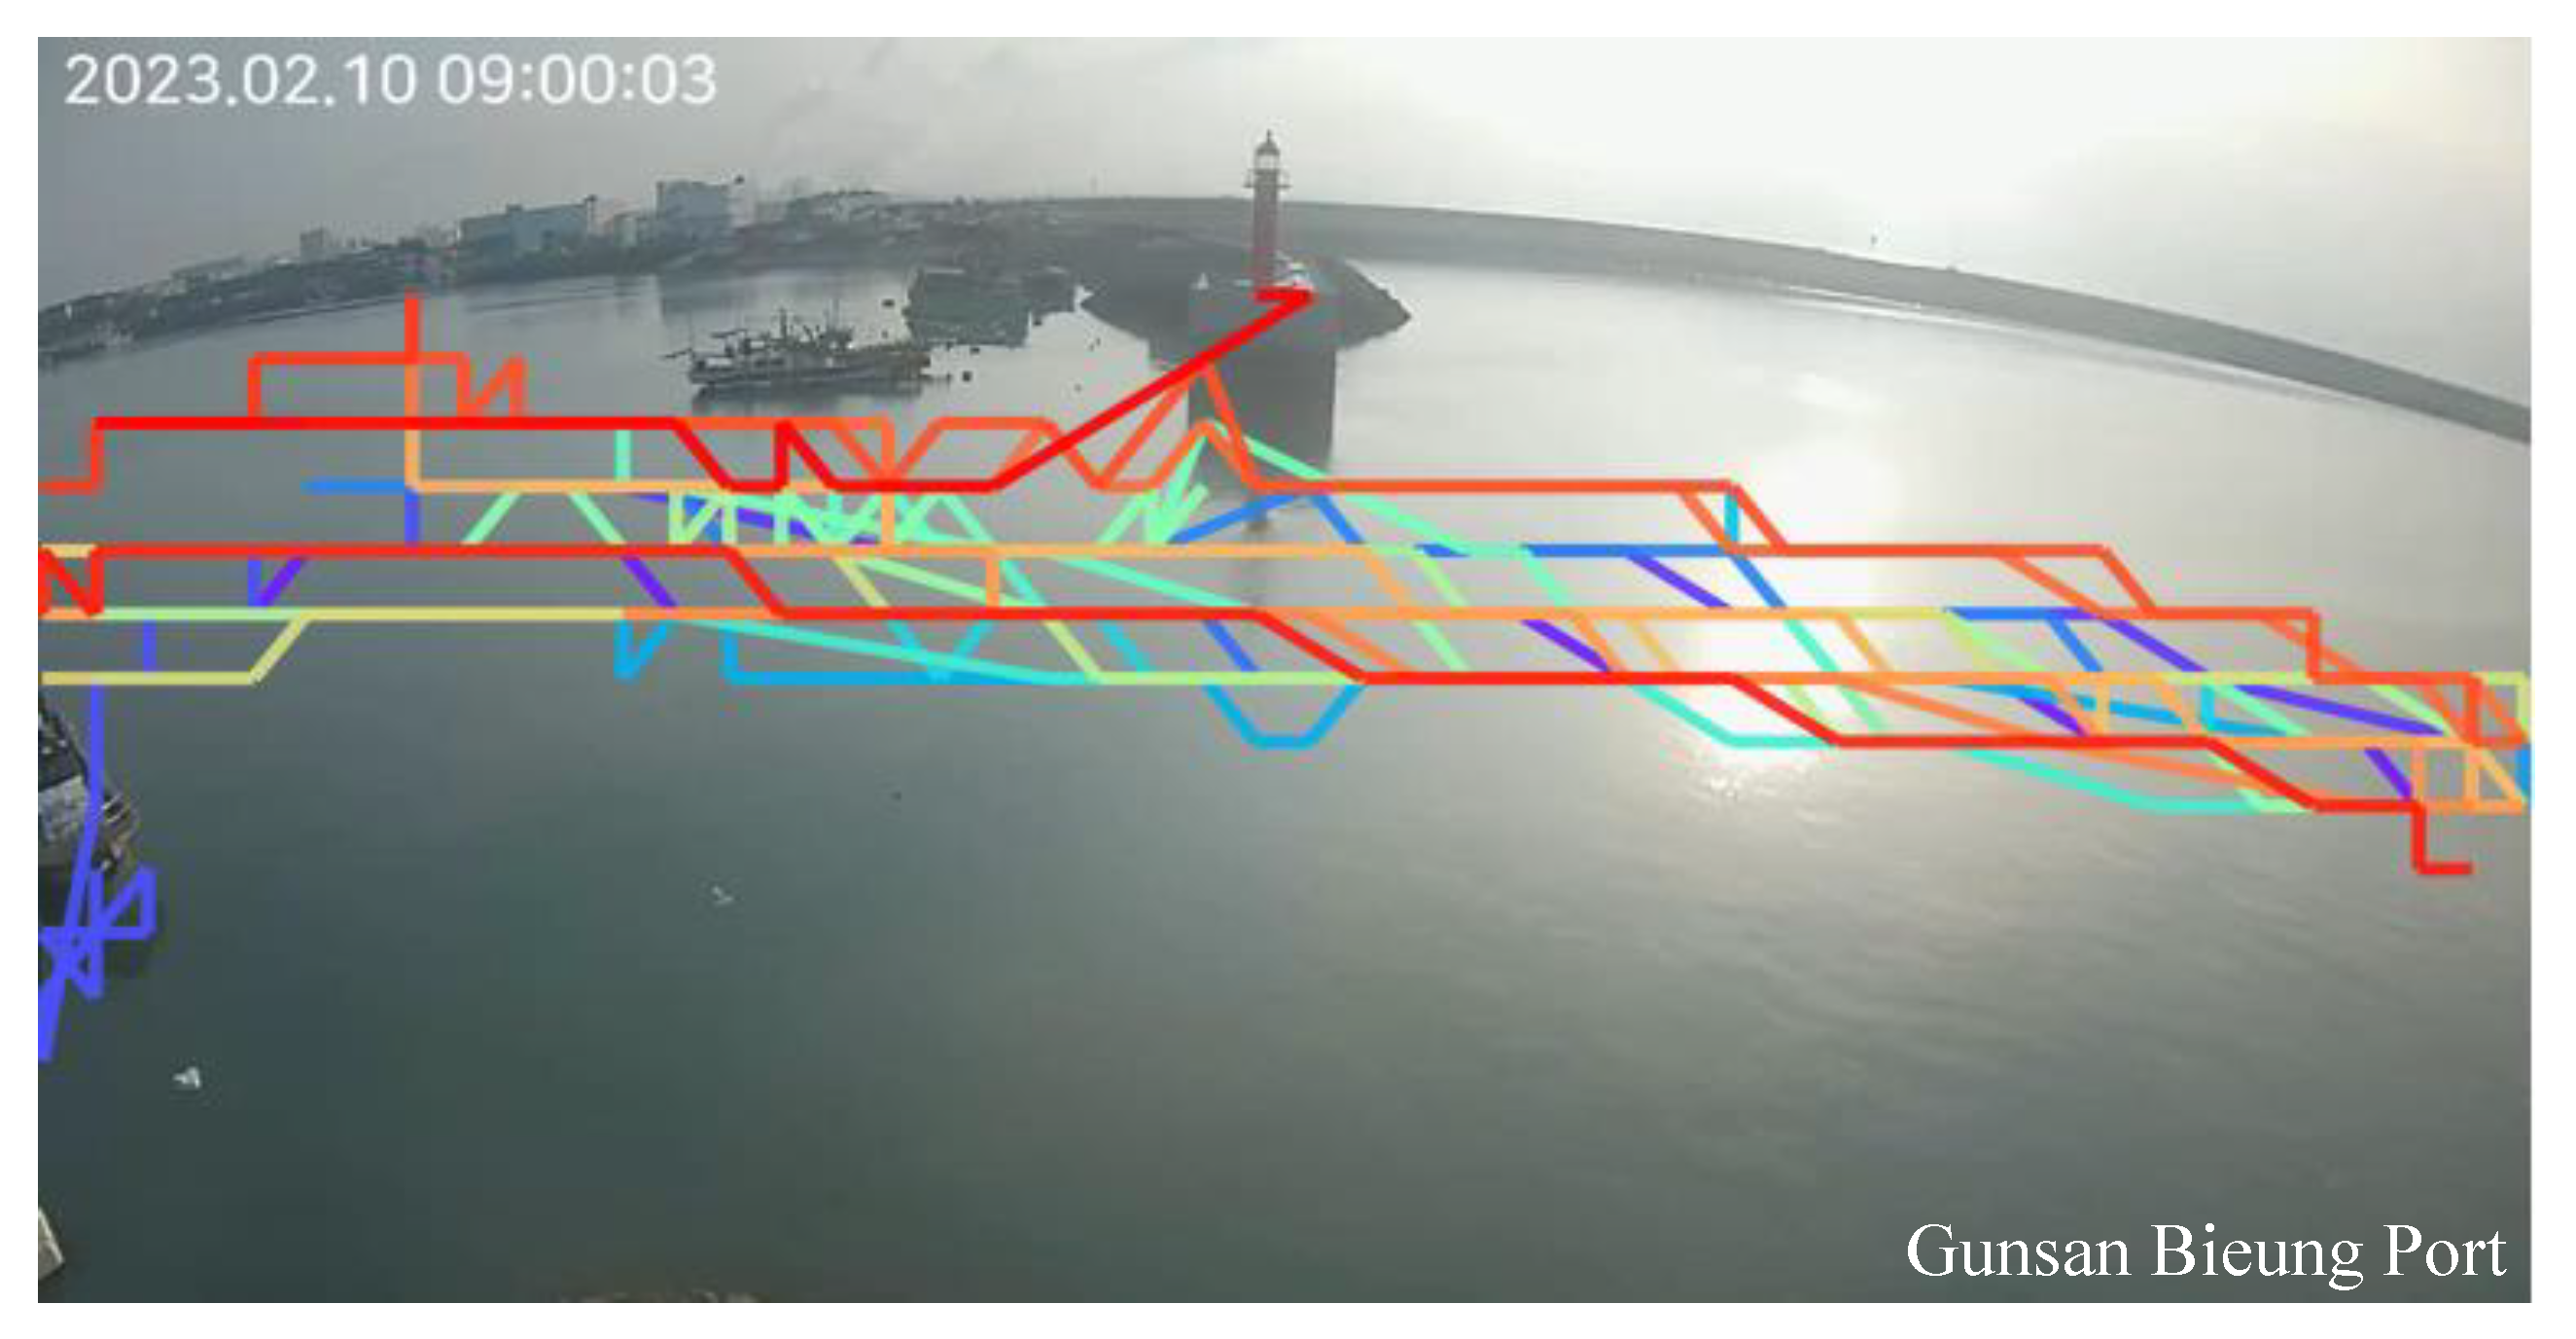
In
Figure 7, the visual representation illustrates the patterns of normal paths observed in Experiment 1 and contrasts them with the CCTV video. Interestingly, the substantial overlap observed among the majority of trajectories resulted in a reduced count of generated patterns compared to the total number of ships used for training. In Experiment 1, larger values of
N and
M led to the construction of more complex graphs compared to the other two experiments. Precisely, the final count of distinct patterns, after eliminating overlapping graphs, is 30, as indicated in
Table 5. These patterns, primarily displaying lateral movement characteristics, enable the differentiation of normal ship trajectories and the detection of abnormal movements, which is clearly highlighted in
Figure 7.
Table 6 presents the outcomes of Experiment 1, illustrating the frame-level detection results for various cases. The table provides a detailed breakdown of true positives (TP), false negatives (FN), false positives (FP), and true negatives (TN) for each case. In Experiment 1, a comprehensive assessment of anomaly detection was conducted for different scenarios, each represented by a specific case. True positives (TP) indicate the number of frames correctly identified as abnormal ship movements. False negatives (FN) represent frames depicting abnormal movements but were not detected as such. False positives (FP) signify frames mistakenly classified as abnormal, while true negatives (TN) denote frames accurately identified as normal ship movements.
Experiment 1 serves as the baseline, and its results provide insights into the algorithm’s initial performance. It is noticeable that Experiment 1 exhibits a mixed performance across different cases. Notably, Cases 1, 4, and 5 demonstrate competitive performance with a substantial number of true positives (TP) while keeping false negatives (FN) relatively low. These results indicate that Experiment 1 effectively detects abnormal ship movements in these scenarios, particularly in scenarios with clear distinctions between normal and abnormal behaviors. However, in Cases 2, 3, and 7-1, Experiment 1 faces significant challenges with the presence of false negatives. In these cases, some abnormal ship movements were not correctly identified, highlighting areas where the algorithm can be improved. Furthermore, the absence of false positives (FP) in all cases suggests that Experiment 1 tends to be conservative in labeling ship movements as abnormal, minimizing the risk of false alarms but potentially missing some anomalies.
4.4.2. Results of Experiment 2
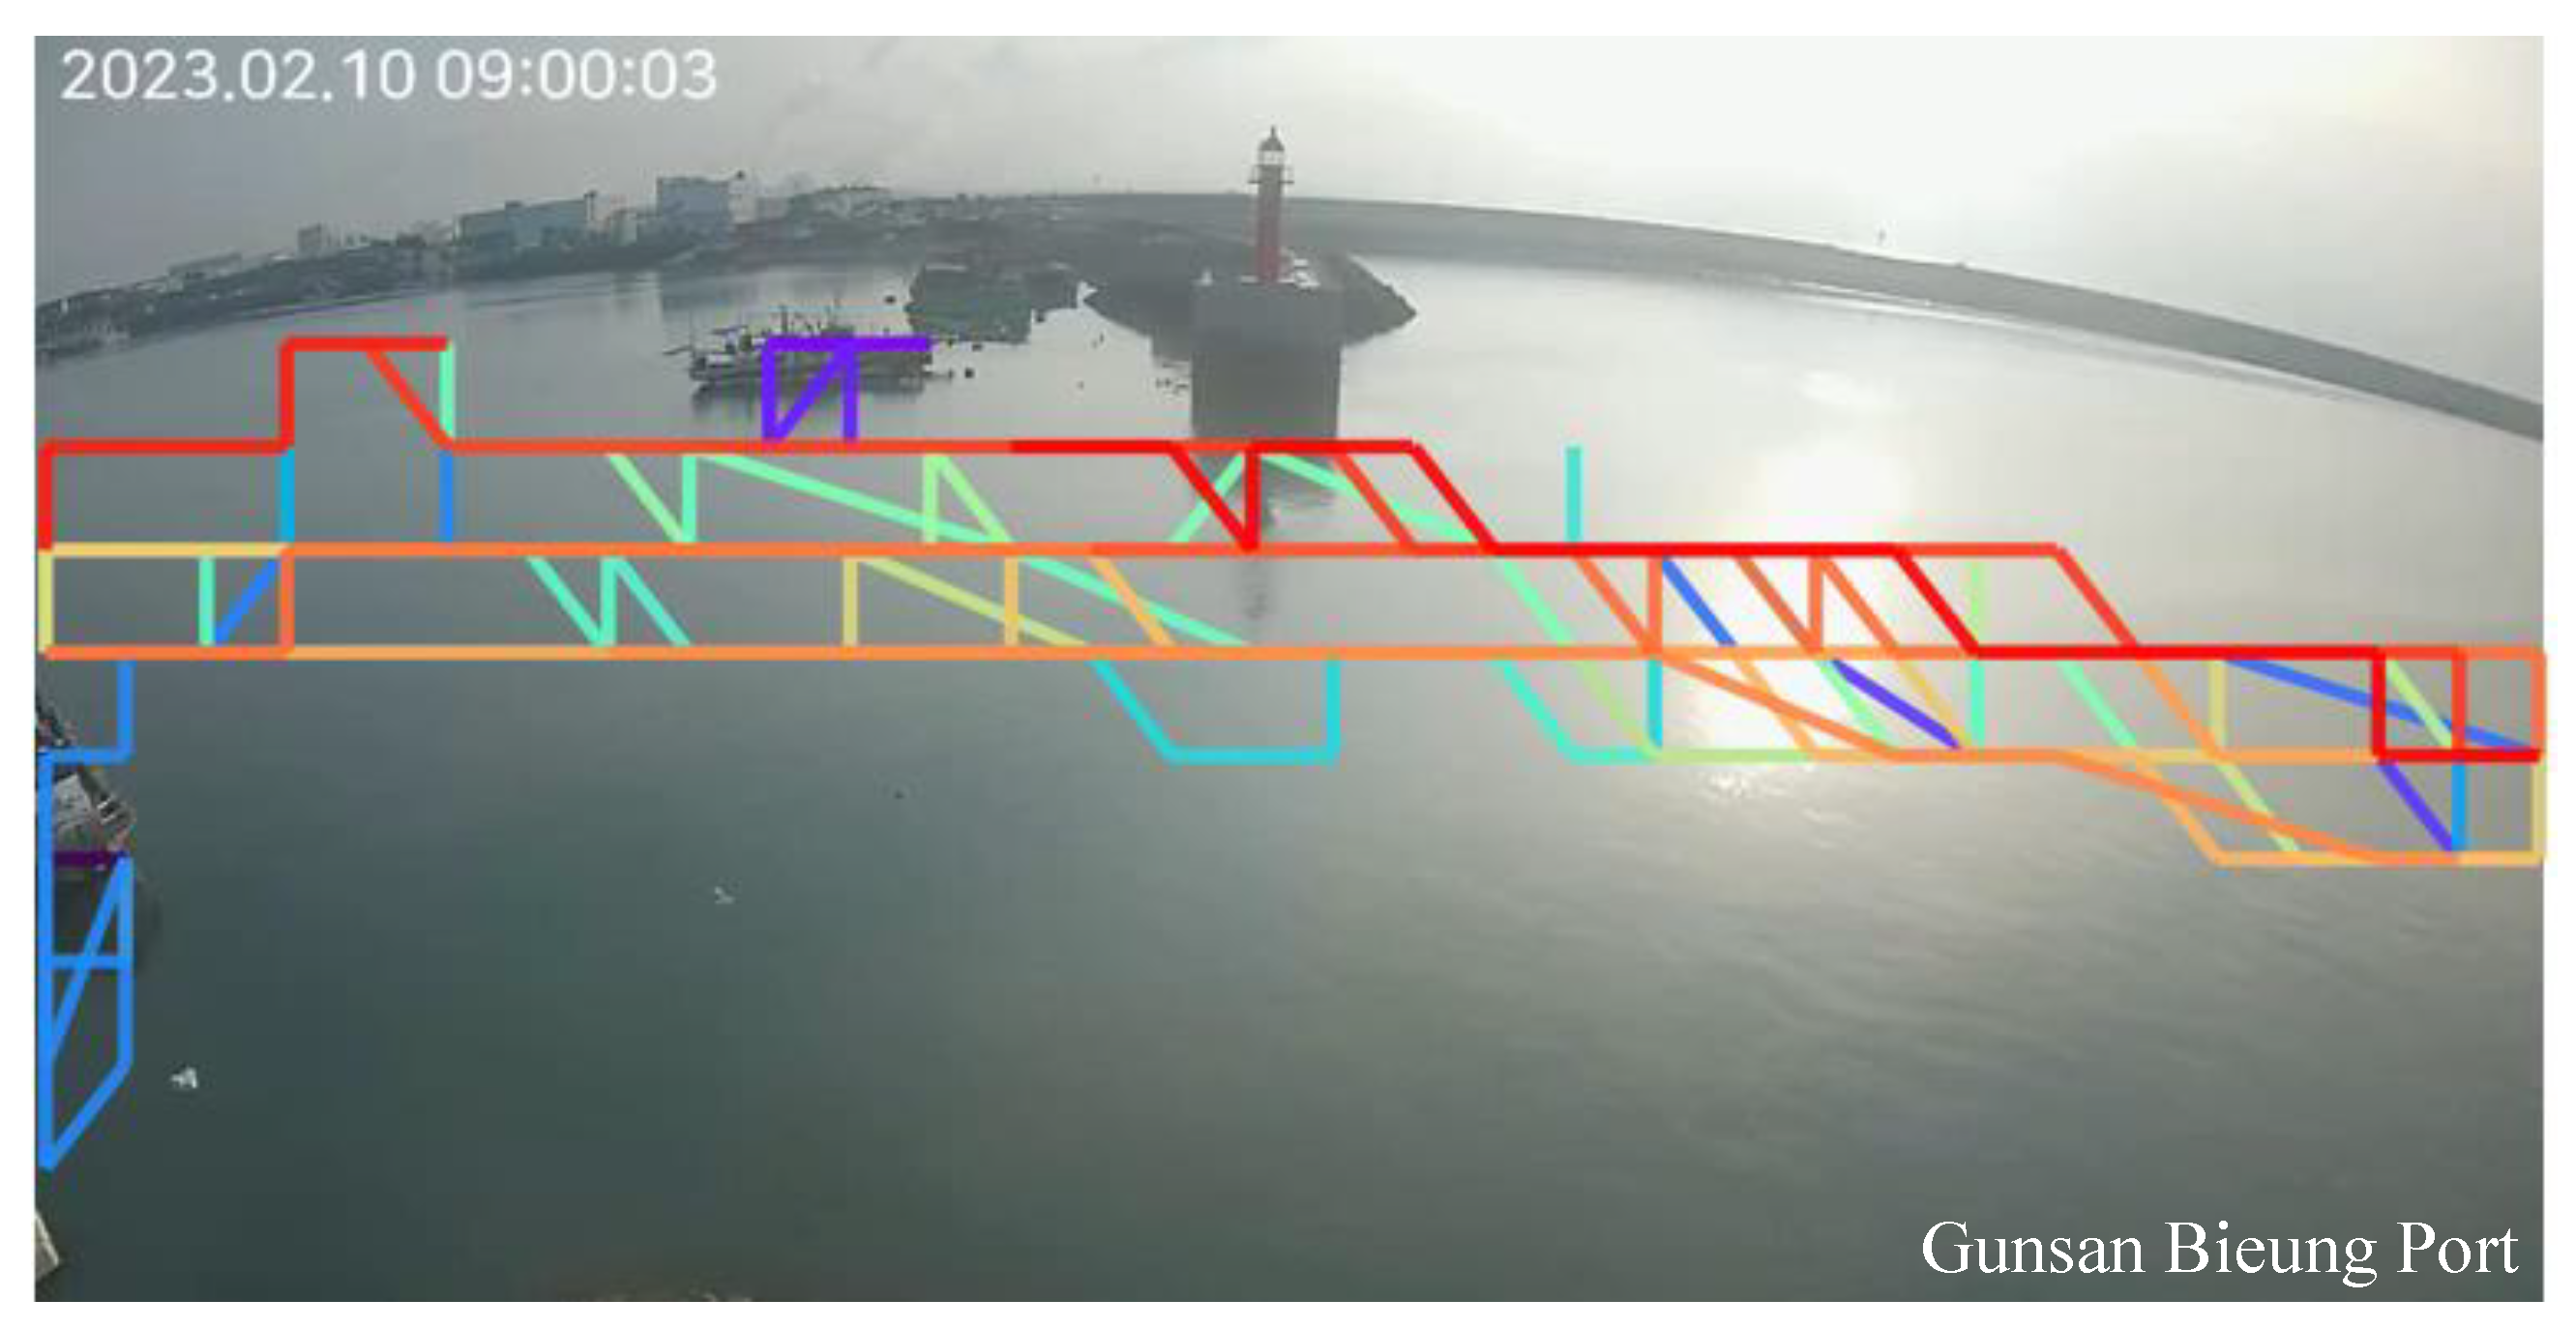
Figure 8 visually compares and contrasts the patterns of normal paths from Experiment 2 with the video.
Table 7 provides information about the learned pattern graphs from Experiment 2. Among the three experiments, Experiment 2 demonstrates a pattern count similar to Experiment 1, with a segment size that falls in between. Due to smaller values of
N and
M compared to Experiment 1, the segment size increased, leading to a simplification of the patterns. As a result, due to the smaller number of segments, Experiment 2 pattern graphs exhibit simpler movement patterns compared to the patterns in
Figure 7.
Table 8 displays the aggregated confusion matrix for the frame-level detection results in Experiment 2. Experiment 2 represents adjustments in segment size (N and M) and provides an opportunity to evaluate the algorithm’s sensitivity to these parameters. While it does show improved performance in Cases 1, 4, and 5, where TPs are notably higher compared to Experiment 1, it also introduces challenges in Cases 2, 3, and 7-1, where FP cases emerge. One key observation in Experiment 2 is the ability to detect anomalies effectively when they exhibit relatively distinct behavior patterns. Cases 1, 4, and 5 demonstrate the algorithm’s potential for accurate detection when differences between normal and abnormal movements are pronounced. However, the emergence of FPs in Cases 2, 3, and 7-1 underscores the need for fine-tuning to reduce false positives in scenarios with more subtle deviations from normal ship movements.
4.4.3. Results of Experiment 3
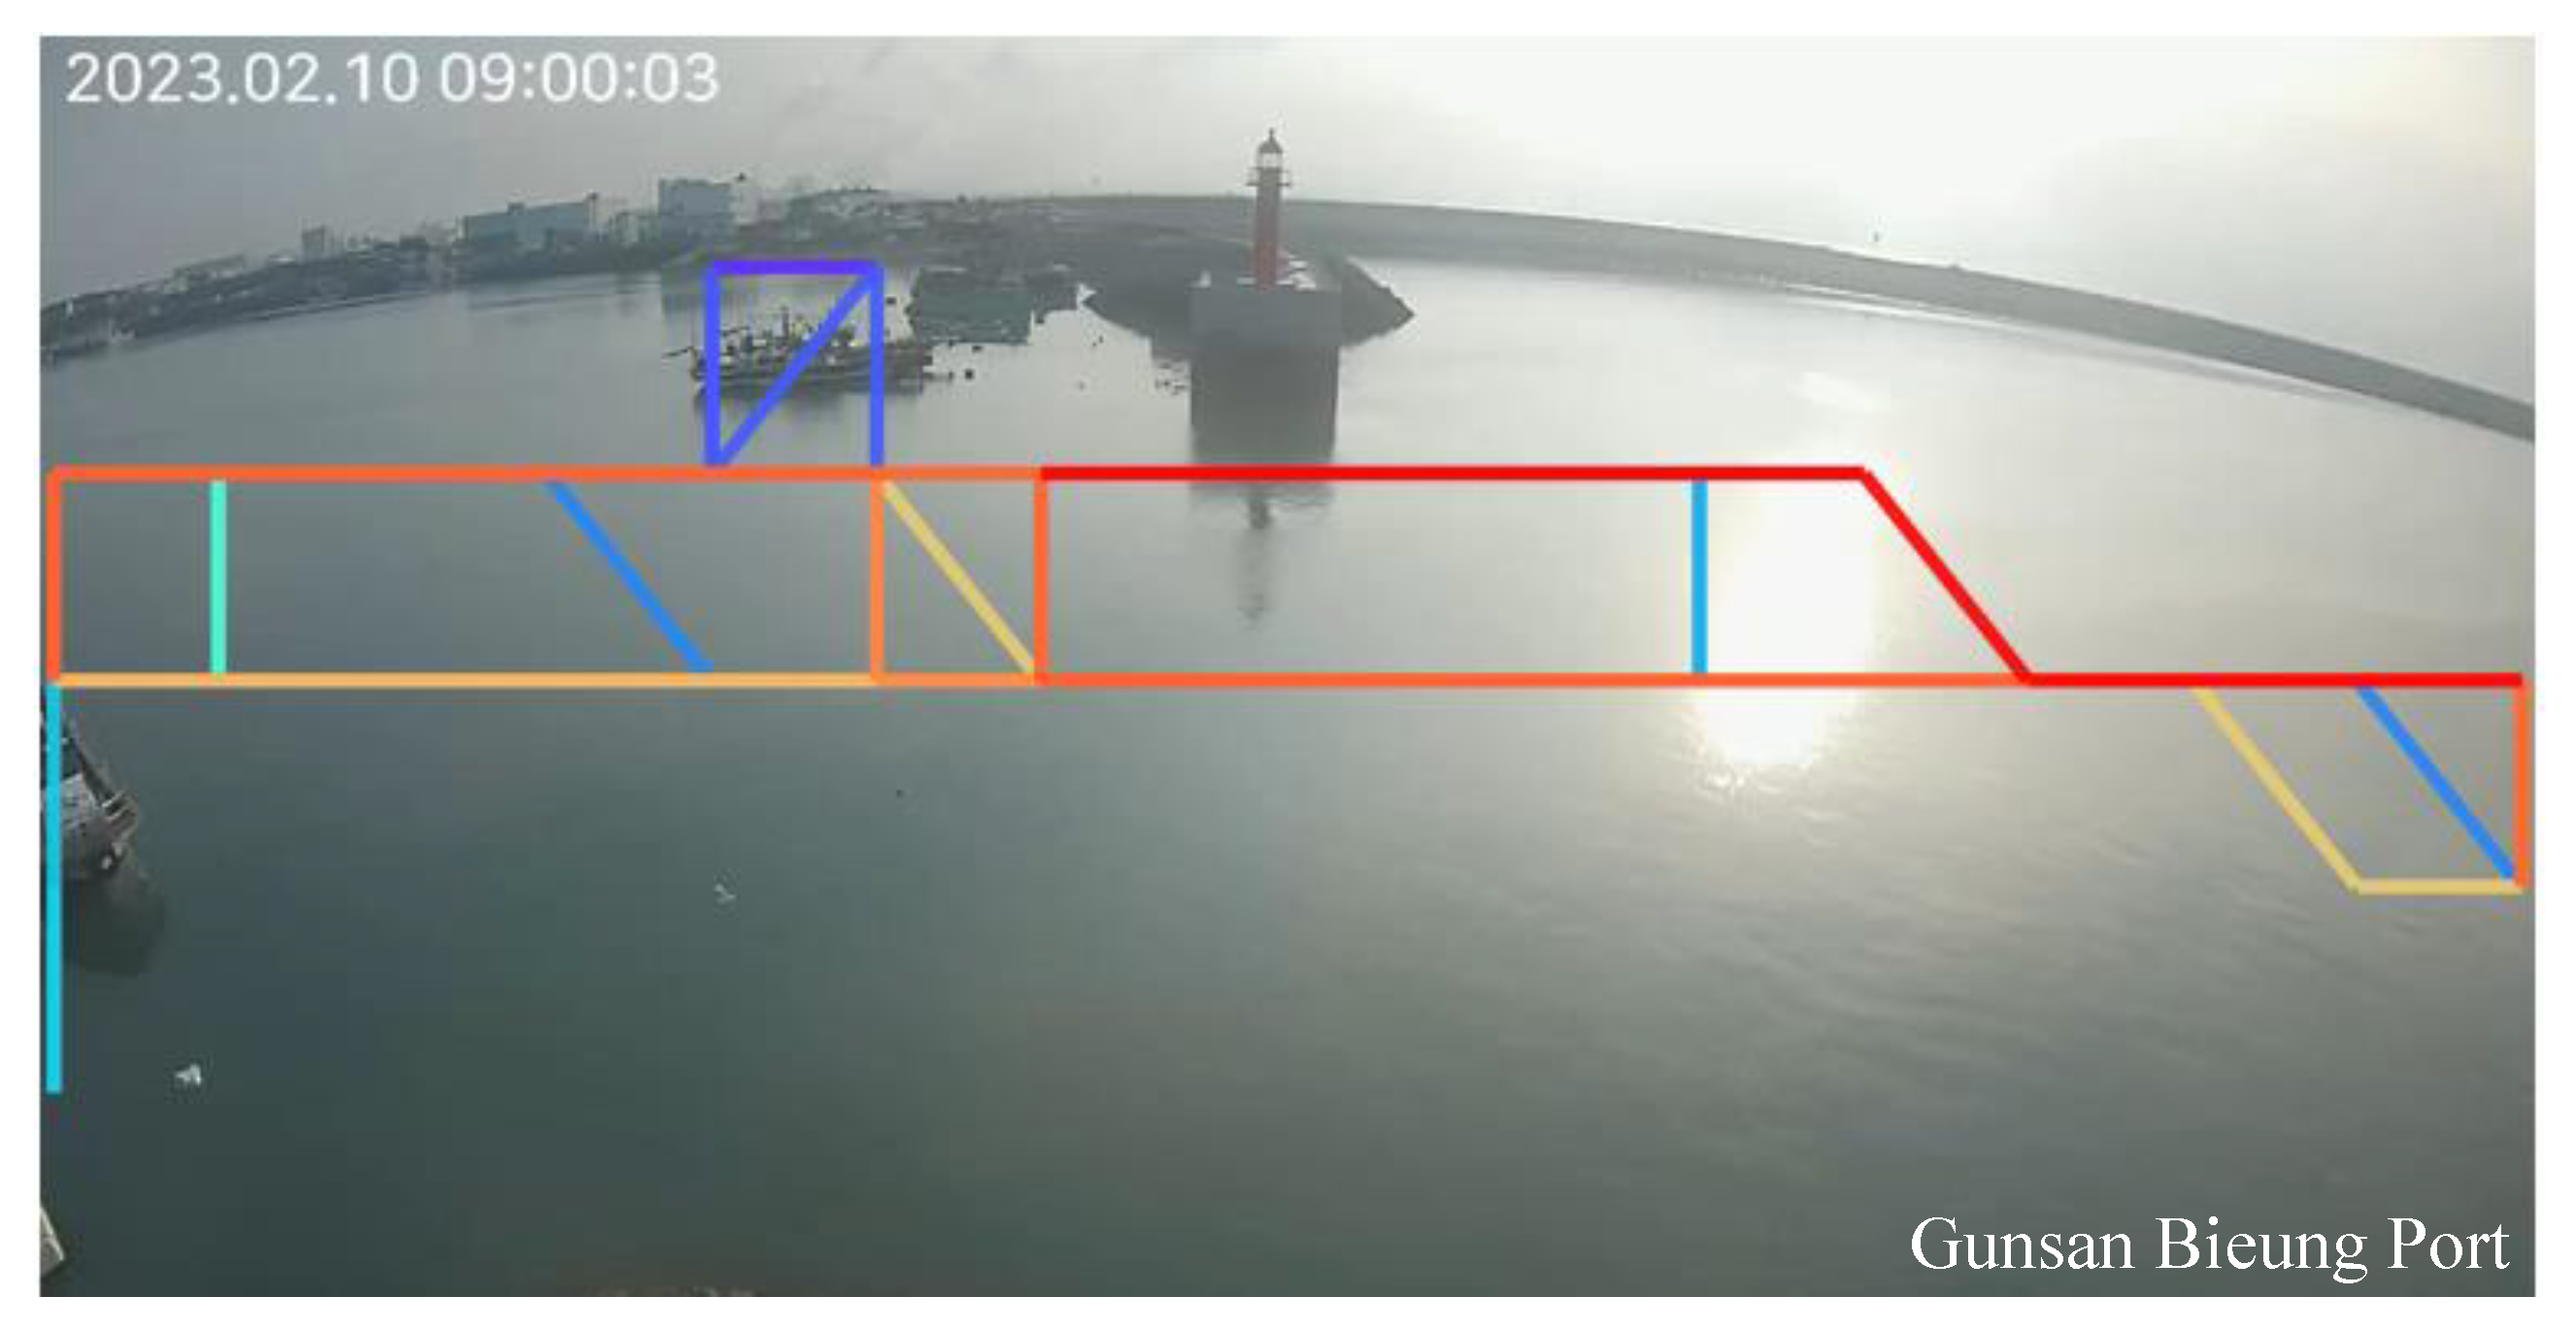
Figure 9 visualizes the patterns of normal paths from Experiment 3 and compares them with the video. Given the largest segment size among the three experiments, there is greater overlap among patterns, resulting in the smallest total count of patterns, which is 18. As
N and
M are at their smallest, the patterns also represent a more straightforward shape.
Table 9 provides information about the learned pattern graphs from Experiment 3. The segment count being smaller than in Experiments 1 and 2 allows for a much simpler pattern graph of movement to be observed, particularly when compared to
Figure 7 and
Figure 8.
Table 10 represents the confusion matrix for the frame-level detection results in Experiment 3. Experiment 3 stands out with consistent and high-performance results across various cases. It effectively addresses some of the challenges observed in Experiments 1 and 2. Notably, it excels in Cases 1, 5, 6-1, 6-2, 7-1, and 7-2, achieving high TP counts while maintaining minimal FN, FP, or TN counts. One remarkable aspect of Experiment 3 is its robustness in detecting abnormal ship movements across different scenarios. Cases 1 and 5 represent scenarios where the algorithm performs exceptionally well, and Cases 6-1, 6-2, 7-1, and 7-2 showcase its consistency in delivering high-quality results.
4.4.4. Summary of Results
Table 11 presents a comprehensive comparison of the experimental results for Experiments 1, 2, and 3, based on key metrics including Recall, Precision, F1-score, and Accuracy. The table presents the metrics averaged across various cases. Across all cases, Experiment 3 consistently outperforms Experiments 1 and 2 in terms of Recall, achieving perfect or near-perfect scores. This indicates Experiment 3’s superior ability to detect true positives.
In terms of Precision, Experiments 1 and 2 generally maintain perfect Precision scores, while Experiment 3 exhibits slightly lower but still commendable Precision values. F1-scores, which consider the balance between Recall and Precision, are notably high for all experiments. Experiment 3 achieves the highest F1-scores across the majority of cases, indicating its strong overall performance. Accuracy results show that Experiment 3 achieves the highest accuracy scores, reflecting its ability to correctly classify ship trajectories.
In Experiment 1, the generated normal pattern graphs exhibit relatively complex paths due to the division of segments into (i.e., ). This complexity led to anomalies being identified in cases where test paths closely resembled the patterns. These findings suggest that further training with a larger dataset, possibly involving increased segment counts, could offer advantages in identifying more detailed paths. Experiment 3, on the other hand, produced notably favorable results. These outcomes can be attributed to the appropriate segment division based on the dataset size. However, it is worth noting that reducing segment size might bias the identification of test data as normal paths, underscoring the challenge in selecting suitable test cases with anomalous movements.
5. Conclusions
In conclusion, this paper presents a novel approach to maritime anomaly detection using CCTV videos. We aimed to address the limitations of existing methods that rely on AIS integration by directly identifying and visualizing anomalous ship behaviors. Our experiments demonstrated the effectiveness of our approach, achieving high accuracy rates in detecting abnormal movements within narrow coastal areas, where traditional AIS-based methods often fall short. One key finding from our experiments is the significant impact of segment size on the performance of our anomaly detection method. Properly configuring the segment size is crucial for striking the right balance between collecting normal patterns and maintaining discriminatory power.
While our model has shown promise, challenges related to occlusion, fragmentation, and ID switching still pose important research questions. These challenges provide valuable directions for future work, including the acquisition of additional datasets, fine-tuning the model, and exploring the incorporation of diverse ship parameters into the anomaly detection process. Additionally, broadening the scope of anomaly detection involves taking into account diverse ship parameters, encompassing factors such as course, speed, yaw angle, and yaw rate. This expanded approach to anomaly detection should be a key focus of future research efforts, as it has the potential to make more efficient use of CCTV data and enhance the overall accuracy and effectiveness of maritime anomaly detection.
In summary, our work represents a significant advancement in maritime anomaly detection using CCTV videos, with the potential to enhance maritime safety and contribute to accident prevention.
Author Contributions
Conceptualization, N.S., J.K. and S.L.; methodology, N.S., J.K. and S.L.; software, N.S. and J.K.; validation, N.S., J.K. and S.L.; formal analysis, N.S., J.K. and S.L.; investigation, N.S., J.K. and S.L.; resources, N.S. and J.K.; data curation, N.S. and J.K.; writing—original draft preparation, N.S., J.K. and S.L.; writing—review and editing, S.L.; visualization, N.S., J.K. and S.L.; supervision, S.L.; project administration, S.L.; funding acquisition, S.L. All authors have read and agreed to the published version of the manuscript.
Funding
This research was supported by Korea Institute of Marine Science & Technology Promotion (KIMST) funded by the Ministry of Oceans and Fisheries (20210650) and was supported by the Institute of Information & communications Technology Planning & Evaluation (IITP) grant funded by the Korea government (MSIT) (No. RS-2022-00155857, Artificial Intelligence Convergence Innovation Human Resources Development (Chungnam National University)).
Institutional Review Board Statement
Not applicable.
Informed Consent Statement
Not applicable.
Data Availability Statement
Not applicable.
Conflicts of Interest
The authors declare no conflict of interest.
References
- Guo, S.; Mou, J.; Chen, L.; Chen, P. An Anomaly Detection Method for AIS Trajectory Based on Kinematic Interpolation. J. Mar. Sci. Eng. 2021, 9, 609. [Google Scholar] [CrossRef]
- Wolsing, K.; Roepert, L.; Bauer, J.; Wehrle, K. Anomaly Detection in Maritime AIS Tracks: A Review of Recent Approaches. J. Mar. Sci. Eng. 2022, 10, 112. [Google Scholar] [CrossRef]
- Redmon, J.; Divvala, S.K.; Girshick, R.B.; Farhadi, A. You Only Look Once: Unified, Real-Time Object Detection. In Proceedings of the CVPR, Las Vegas, NV, USA, 27–30 June 2016; pp. 779–788. [Google Scholar]
- Bewley, A.; Ge, Z.; Ott, L.; Ramos, F.T.; Upcroft, B. Simple Online and Realtime Tracking. In Proceedings of the ICIP, Phoenix, AZ, USA, 25–28 September 2016; pp. 3464–3468. [Google Scholar]
- Wang, C.Y.; Bochkovskiy, A.; Liao, H.Y.M. YOLOv7: Trainable Bag-of-Freebies Sets New State-of-the-Art for Real-Time Object Detectors. In Proceedings of the CVPR, Vancouver, BC, Canada, 18–22 June 2023; pp. 7464–7475. [Google Scholar]
- Du, Y.; Zhao, Z.; Song, Y.; Zhao, Y.; Su, F.; Gong, T.; Meng, H. StrongSORT: Make DeepSORT Great Again. IEEE Trans. Multimed. 2023. early access. [Google Scholar] [CrossRef]
- Wilson, P.I.; Fernandez, J. Facial Feature Detection using Haar Classifiers. J. Comput. Sci. Coll. 2006, 21, 127–133. [Google Scholar]
- Lindeberg, T. Scale Invariant Feature Transform. Scholarpedia 2012, 7, 10491. [Google Scholar] [CrossRef]
- Dalal, N.; Triggs, B. Histograms of Oriented Gradients for Human Detection. In Proceedings of the CVPR, San Diego, CA, USA, 20–26 June 2005; pp. 886–893. [Google Scholar]
- Liu, W.; Anguelov, D.; Erhan, D.; Szegedy, C.; Reed, S.; Fu, C.Y.; Berg, A.C. SSD: Single Shot MultiBox Detector. In Proceedings of the ECCV, Amsterdam, The Netherlands, 11–14 October 2016; Volume 1, pp. 21–37. [Google Scholar]
- Ren, S.; He, K.; Girshick, R.B.; Sun, J. Faster R-CNN: Towards Real-Time Object Detection with Region Proposal Networks. In Proceedings of the NIPS, Montreal, QC, Canada, 7–12 December 2015; pp. 91–99. [Google Scholar]
- Tan, M.; Pang, R.; Le, Q.V. EfficientDet: Scalable and Efficient Object Detection. In Proceedings of the CVPR, Seattle, WA, USA, 13–19 June 2020; pp. 10778–10787. [Google Scholar]
- Zhou, S.; Cai, K.; Feng, Y.; Feng, Y.; Tang, X.; Pang, H.; He, J.; Shi, X. An Accurate Detection Model of Takifugu rubripes Using an Improved YOLO-V7 Network. J. Mar. Sci. Eng. 2023, 11, 1051. [Google Scholar] [CrossRef]
- Henriques, J.F.; Caseiro, R.; Martins, P.; Batista, J. High-Speed Tracking with Kernelized Correlation Filters. IEEE Trans. Pattern Anal. Mach. Intell. 2015, 37, 583–596. [Google Scholar]
- Wojke, N.; Bewley, A.; Paulus, D. Simple Online and Realtime Tracking with a Deep Association Metric. In Proceedings of the ICIP, Beijing, China, 17–20 September 2017; pp. 3645–3649. [Google Scholar]
- Shwartz, S.; Namer, E.; Schechner, Y.Y. Blind haze separation. In Proceedings of the 2006 IEEE Computer Society Conference on Computer Vision and Pattern Recognition (CVPR’06), New York, NY, USA, 17–24 June 2006; Volume 2, pp. 1984–1991. [Google Scholar]
- Narasimhan, S.G.; Nayar, S.K. Contrast restoration of weather degraded images. IEEE Trans. Pattern Anal. Mach. Intell. 2003, 25, 713–724. [Google Scholar] [CrossRef]
- Zhang, B.; Ren, H.; Wang, P.; Wang, D. Research Progress on Ship Anomaly Detection Based on Big Data. In Proceedings of the ICSESS, Beijing, China, 16–18 October 2020; pp. 316–320. [Google Scholar]
- Oh, J.Y.; Kim, H.J.; Park, S.K. Detection of Ship Movement Anomaly Using AIS Data: A Study. ICSESS 2020, 42, 277–282. [Google Scholar]
- Ma, X.; Wu, J.; Xue, S.; Yang, J.; Zhou, C.; Sheng, Q.Z.; Xiong, H.; Akoglu, L. A Comprehensive Survey on Graph Anomaly Detection with Deep Learning. IEEE Trans. Knowl. Data Eng. 2021. early access. [Google Scholar] [CrossRef]
- Kim, H.; Lee, B.S.; Shin, W.Y.; Lim, S. Graph Anomaly Detection with Graph Neural Networks: Current Status and Challenges. IEEE Access 2022, 10, 111820–111829. [Google Scholar] [CrossRef]
- Lin, T.Y.; Maire, M.; Belongie, S.J.; Hays, J.; Perona, P.; Ramanan, D.; Dollár, P.; Zitnick, C.L. Microsoft COCO: Common Objects in Context. In Proceedings of the ECCV, Zurich, Switzerland, 6–12 September 2014; Volume 5, pp. 740–755. [Google Scholar]
- Lin, T.Y.; Maire, M.; Belongie, S.J.; Hays, J.; Perona, P.; Ramanan, D.; Dollár, P.; Zitnick, C.L. Liang Zheng and Liyue Shen and Lu Tian and Shengjin Wang and Jingdong Wang and Qi Tian. In Proceedings of the ICCV, Santiago, Chile, 7–13 December 2015; pp. 1116–1124. [Google Scholar]
- Ristani, E.; Solera, F.; Zou, R.S.; Cucchiara, R.; Tomasi, C. Performance Measures and a Data Set for Multi-target, Multi-camera Tracking. In Proceedings of the ECCV Workshop, Amsterdam, The Netherlands, 8–10 October 2016; Volume 2, pp. 17–35. [Google Scholar]
Figure 2.
Overall framework of our proposed method.
Figure 2.
Overall framework of our proposed method.
Figure 3.
Examples of tracking results. From left to right, it signifies frame, class, ID, vehicle side, bounding box’s left, bounding box’s top, bounding box’s width, bounding box’s height, padding, padding, departure/arrival decision flag, anomalous trajectory decision flag, padding, and padding.
Figure 3.
Examples of tracking results. From left to right, it signifies frame, class, ID, vehicle side, bounding box’s left, bounding box’s top, bounding box’s width, bounding box’s height, padding, padding, departure/arrival decision flag, anomalous trajectory decision flag, padding, and padding.
Figure 4.
Examples of pattern graphs.
Figure 4.
Examples of pattern graphs.
Figure 5.
Examples of tracking results.
Figure 5.
Examples of tracking results.
Figure 6.
Examples of abnormal movements in tracking results.
Figure 6.
Examples of abnormal movements in tracking results.
Figure 7.
Examples of pattern graphs in Experiment 1.
Figure 7.
Examples of pattern graphs in Experiment 1.
Figure 8.
Examples of pattern graphs in Experiment 2.
Figure 8.
Examples of pattern graphs in Experiment 2.
Figure 9.
Examples of pattern graphs in Experiment 3.
Figure 9.
Examples of pattern graphs in Experiment 3.
Table 1.
Hardware and environmental resources.
Table 1.
Hardware and environmental resources.
| | Experimental Environments |
|---|
| OS | Ubuntu 22.04 |
| CPU | Intel Xeon W-2225 (4.1 GHz) |
| GPU | NVIDIA GeForce RTX 3090 (CUDA 11.3) |
| Memory | 128 GB |
| Language | Python 3.8 |
Table 2.
Summary of dataset.
Table 2.
Summary of dataset.
| | Video Dataset |
|---|
| Resolution | FHD (1920*1080) |
| FPS | 30 fps |
| Video length | 7 h*3 days |
| # of ships | 319 |
| # of normal ships | 106 |
Table 3.
Summary of information about test cases.
Table 3.
Summary of information about test cases.
| Test Cases | Classification | Objective # of Ships | Total Frames | Abnormal Frames | Normal Frames |
|---|
| Case 1 | Abnormal | 1 | 133 | 0 | 133 |
| Case 2 | Abnormal | 1 | 60 | 18 | 42 |
| Case 3 | Abnormal | 1 | 60 | 16 | 44 |
| Case 4 | Abnormal | 1 | 93 | 21 | 72 |
| Case 5 | Normal | 1 | 90 | 0 | 90 |
| Case 6 | Normal | 2 | 75 | 0 | 75 |
| Case 7 | Normal | 2 | 150 | 0 | 150 |
Table 4.
Experimental setup.
Table 4.
Experimental setup.
| | N | M | Threshold |
|---|
| Experiment 1 | 48 | 27 | 5 |
| Experiment 2 | 32 | 18 | 3 |
| Experiment 3 | 16 | 9 | 1 |
Table 5.
Learned pattern graph of Experiment 1.
Table 5.
Learned pattern graph of Experiment 1.
| | Pattern Graph Information |
|---|
| # of nodes | 882 |
| # of edges | 852 |
| # of patterns | 30 |
Table 6.
Results of Experiment 1.
Table 6.
Results of Experiment 1.
| | TP | FN | FP | TN |
|---|
| Case 1 | 71 | 62 | 0 | 0 |
| Case 2 | 12 | 30 | 0 | 18 |
| Case 3 | 20 | 24 | 0 | 16 |
| Case 4 | 43 | 29 | 0 | 21 |
| Case 5 | 79 | 11 | 0 | 0 |
| Case 6-1 | 34 | 41 | 0 | 0 |
| Case 6-2 | 59 | 16 | 0 | 0 |
| Case 7-1 | 113 | 37 | 0 | 0 |
| Case 7-2 | 98 | 52 | 0 | 0 |
Table 7.
Learned pattern graph of Experiment 2.
Table 7.
Learned pattern graph of Experiment 2.
| | Graph Information |
|---|
| # of nodes | 581 |
| # of edges | 552 |
| # of patterns | 29 |
Table 8.
Results of Experiment 2.
Table 8.
Results of Experiment 2.
| | TP | FN | FP | TN |
|---|
| Case 1 | 70 | 63 | 0 | 0 |
| Case 2 | 21 | 21 | 6 | 12 |
| Case 3 | 30 | 14 | 3 | 13 |
| Case 4 | 69 | 3 | 8 | 13 |
| Case 5 | 86 | 4 | 0 | 0 |
| Case 6-1 | 46 | 29 | 0 | 0 |
| Case 6-2 | 68 | 7 | 0 | 0 |
| Case 7-1 | 142 | 8 | 0 | 0 |
| Case 7-2 | 134 | 16 | 0 | 0 |
Table 9.
Learned pattern graph of experiment 3.
Table 9.
Learned pattern graph of experiment 3.
| | Graph Information |
|---|
| # of nodes | 189 |
| # of edges | 171 |
| # of patterns | 18 |
Table 10.
Results of Experiment 3.
Table 10.
Results of Experiment 3.
| | TP | FN | FP | TN |
|---|
| Case 1 | 118 | 15 | 0 | 0 |
| Case 2 | 38 | 4 | 8 | 10 |
| Case 3 | 44 | 0 | 10 | 6 |
| Case 4 | 71 | 1 | 11 | 10 |
| Case 5 | 87 | 3 | 0 | 0 |
| Case 6-1 | 70 | 5 | 0 | 0 |
| Case 6-2 | 73 | 2 | 0 | 0 |
| Case 7-1 | 149 | 1 | 0 | 0 |
| Case 7-2 | 150 | 0 | 0 | 0 |
Table 11.
Comprehensive comparison of experimental results.
Table 11.
Comprehensive comparison of experimental results.
| | Metrics | Experiment 1 | Experiment 2 | Experiment 3 |
|---|
| Case 1 | Recall | 0.533 | 0.526 | 0.887 |
| Precision | 1 | 1 | 1 |
| F1-score | 0.696 | 0.689 | 0.94 |
| Accuracy | 0.534 | 0.526 | 0.887 |
| Case 2 | Recall | 0.286 | 0.5 | 0.905 |
| Precision | 1 | 0.778 | 0.826 |
| F1-score | 0.444 | 0.609 | 0.864 |
| Accuracy | 0.5 | 0.55 | 0.8 |
| Case 3 | Recall | 0.455 | 0.682 | 1 |
| Precision | 1 | 0.909 | 0.815 |
| F1-score | 0.625 | 0.779 | 0.898 |
| Accuracy | 0.6 | 0.717 | 0.833 |
| Case 4 | Recall | 0.597 | 0.958 | 0.986 |
| Precision | 1 | 0.896 | 0.866 |
| F1-score | 0.748 | 0.926 | 0.922 |
| Accuracy | 0.688 | 0.882 | 0.871 |
| Case 5 | Recall | 0.878 | 0.956 | 0.967 |
| Precision | 1 | 1 | 1 |
| F1-score | 0.935 | 0.978 | 0.983 |
| Accuracy | 0.878 | 0.956 | 0.967 |
| Case 6-1 | Recall | 0.453 | 0.613 | 0.933 |
| Precision | 1 | 1 | 1 |
| F1-score | 0.624 | 0.76 | 0.965 |
| Accuracy | 0.453 | 0.613 | 0.933 |
| Case 6-2 | Recall | 0.787 | 0.907 | 0.973 |
| Precision | 1 | 1 | 1 |
| F1-score | 0.881 | 0.951 | 0.986 |
| Accuracy | 0.787 | 0.907 | 0.973 |
| Case 7-1 | Recall | 0.753 | 0.947 | 0.993 |
| Precision | 1 | 1 | 1 |
| F1-score | 0.859 | 0.973 | 0.996 |
| Accuracy | 0.753 | 0.947 | 0.993 |
| Case 7-2p | Recall | 0.653 | 0.893 | 1 |
| Precision | 1 | 1 | 1 |
| F1-score | 0.79 | 0.943 | 1 |
| Accuracy | 0.653 | 0.893 | 1 |
| Disclaimer/Publisher’s Note: The statements, opinions and data contained in all publications are solely those of the individual author(s) and contributor(s) and not of MDPI and/or the editor(s). MDPI and/or the editor(s) disclaim responsibility for any injury to people or property resulting from any ideas, methods, instructions or products referred to in the content. |
© 2023 by the authors. Licensee MDPI, Basel, Switzerland. This article is an open access article distributed under the terms and conditions of the Creative Commons Attribution (CC BY) license (https://creativecommons.org/licenses/by/4.0/).


