Article

Investigations on the Effectiveness of Protection Methods for a Submarine Pipeline Exposed to the Impact of a Falling Anchor

1
State Key Laboratory of Hydraulic Engineering Simulation and Safety, Tianjin University, Tianjin 300350, China
2
Tianjin Research Institute for Water Transport Engineering, Ministry of Transport, Tianjin 300456, China
3
Key Laboratory of Earthquake Engineering Simulation and Seismic Resilience of China Earthquake Administration, Tianjin University, Tianjin 300350, China
4
School of Engineering, Design and Built Environment, University of Western Sydney, Penrith 2751, Australia
5
National Engineering Laboratory for Pipeline Safety/Beijing Key Laboratory of Urban Oil and Gas Distribution Technology, China University of Petroleum, Beijing 102249, China
*
Author to whom correspondence should be addressed.
J. Mar. Sci. Eng. 2022, 10(8), 1159; https://doi.org/10.3390/jmse10081159
Submission received: 22 July 2022 / Revised: 16 August 2022 / Accepted: 18 August 2022 / Published: 21 August 2022
(This article belongs to the Special Issue Advances in Marine and Offshore Hydrodynamic Design)

Abstract

:
The occurrence of a buried submarine pipeline crossing a channel becoming damaged by the impact of a falling anchor is becoming more common. It is important to analyze the dynamic response of pipelines exposed to such impact and develop effective protection methods to ensure the safe operation of the pipelines exposed to the impact of falling anchors. In this study, different protection methods, including pure rock, concrete mattress + rock, concrete mattress + rock + rubber pad, and compound flexible pad + rock, are physically tested. The strains at the impacting point and along the pipeline were measured with the fiber Bragg grating (FBG) sensors. The effectiveness of the protection methods is analyzed based on the maximum strain and its affected length on the pipeline. Then, a theoretical model is established to analyze the deformation and strain of a pipeline. Through curve-fitting the experimental results, the bearing capacity coefficients for different protection methods are determined. The protection method of compound flexible pad + rock has the best performance to protect the pipeline from the impact of a falling anchor.

1. Introduction

Submarine pipelines are important transportation infrastructures for offshore oil and gas industry. With the increasing construction of submarine pipelines and port development on coastlines, there are often cases where the landing part of a submarine pipeline crosses shipping lanes [1]. Over 50 percent failure of the global submarine oil and gas pipeline rupture has been caused by the third party, and the ship anchoring operation is one of the most important causes [2,3]. The risk assessment of pipelines caused by falling anchors have been assessed in the DNVGL-RP-F107 code [4]. Once an accidental causes damage in a pipeline, the economic loss is huge, and the pollution of sea water is severe as well. Therefore, it is necessary to analyze the dynamic response of a submarine pipeline exposed to the impact of a falling anchor and propose effective protection methods to prevent the damage in the design stage.
The subject of transverse impacts on submarine pipelines has received considerable attention in the literature. Yang et al. (2009) [5] studied the dynamic response of a horizontal pipeline impacted by another swinging vertical pipeline. The effects of impacting position and ending fixed condition on the strain response and depressed depth of the horizontal pipeline were investigated. Arabzadeh and Zeinoddini (2011) [6] established a coupled soil-structure-fluid finite element model to examine the effects of the pipeline bed flexibility on the dynamic pressure wave propagation inside the pipeline. Dou and Yu (2013) [7] used a finite element analysis (FEA) software package, LSDYNA, to model the pressurized pipelines to investigate the crash and collapse mechanisms of pipelines subjected to lateral impact. Yu et al. (2016) [8] conducted a three-dimensional numerical simulation to study the deformations of a pipeline due to transverse impacts from dropped anchors. The method has the advantages of higher-order resolution and low computational cost. Cui et al. (2018) [9] studied the effects of the mass, height, and shape of a falling object; the pipeline laying conditions; the water depth; and other factors on the mechanical damage of a submarine pipeline (including the axial and circumferential strain response of the pipeline). The above-mentioned research was mainly focused on the direct impact on an exposing pipeline and its deformation response under various factors.
There are also a few studies on the dynamic response of a pipeline under cover layers. Wang et al. (2009) [10] conducted 3D non-linear finite element (FE) analysis to study the interaction of dragging anchor with a pipeline protected by rock backfill. Ma et al. (2012) [11] studied the effects of the thickness and the particle size gradation of the rock protection layer on the effectiveness of protecting a submarine pipeline based on the DNVGL-RP-F107 code. To estimate the energy dissipating capacity of a rock armor berm, Qiu et al. (2015) [12] combined the discrete element method (DEM) and the finite element method (FEM) to analyze the dynamic response of pipelines exposed to impact loads. The calculated results of energy absorption by gravels agree well with those recommended by the DNVGL-RP-F107 code. Sun et al. (2018) [2] analyzed the effects of seabed material, burial thickness, water depth, and dropping height on the strain history of the top surface of a submarine pipeline. Shin et al. (2020) [3] conducted both experimental and finite element analysis of the soil–pipe–rock interactions to quantify the effects of seabed soil properties, anchor weight, dropping height, buried depth, and rock berm height on the strain of pipeline. Li et al. (2021) [13] studied the effects of buried foundation materials (including clay, sand, and rock) and buried depth on the depression depth and residual equivalent stress of buried pipelines impacted by spherical falling objects. It was found that the layered backfilling method of multi-layer foundation materials can effectively improve the impact resistance of high-rise pipeline.
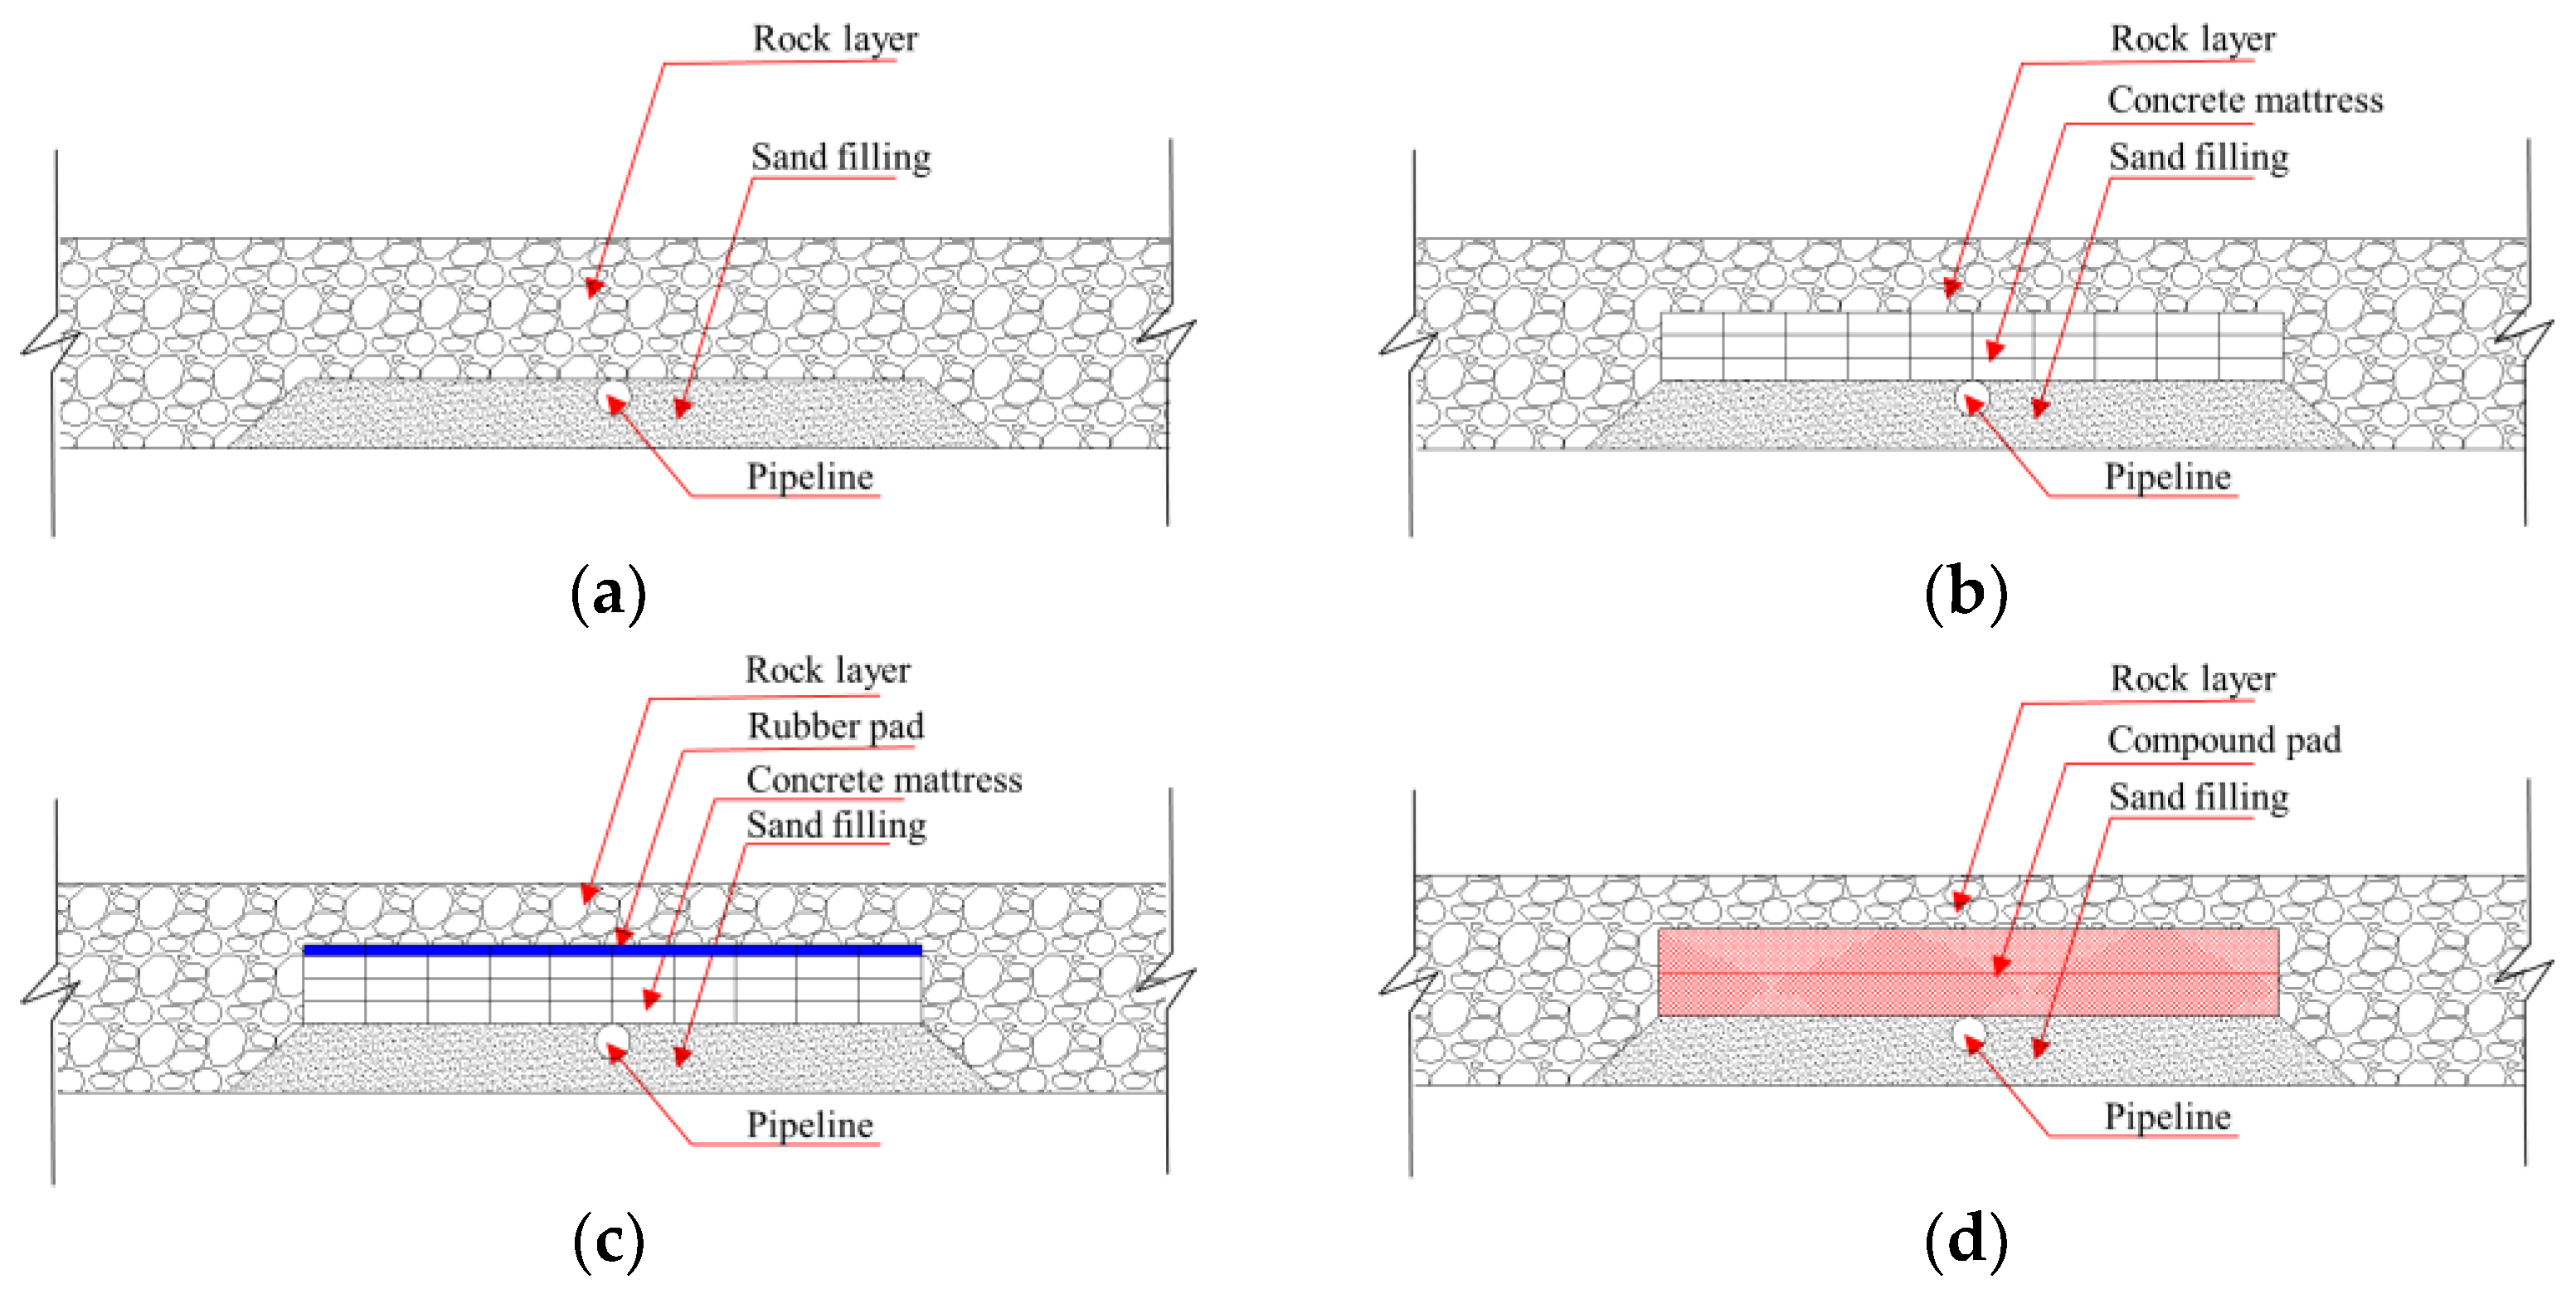
In addition to the traditional sand filling or rock berm above the pipeline using the pipeline protection method, more effective methods are required to protect pipelines from the damage of external forces. In this study, a series of physical model tests and theoretical analyses are conducted to study the dynamic response of a pipelines with various protection methods exposed to the impact of a falling anchor. Four protection methods are tested, and the strain and deformation are analyzed to investigate the effectiveness of the protection method. This paper comprises the following sections: the motivation and background of the study are stated in Section 1; the experimental setup and methodology are given in Section 2; the experimental results and discussions are presented in Section 3; theoretical analysis on the strain and deformation of the pipeline is conducted in Section 4; and concluding remarks are given in the final section.

2. Experimental Setup and Methodology

2.1. Discriptions of Protection Methods in Prototype Size

In this study, the pipeline laid in a sandy seabed is covered by a protective layer with a total thickness of 2.0 m. Four protection methods with different materials are described as follows:
(i) Pure rock (P1): the thickness of rock layer is 2.0 m with a rock particle weight ranging from 100 to 200 kg. The cross section view of this protection method is shown in Figure 1a. (ii) Concrete mattress + rock (P2): the pipeline is covered by three layers of concrete mattress, which is made of cubic cement blocks, each with a side length of 0.33 m, connected with high-strength nylon ropes. The total thickness of the concrete mattresses is 1.0 m. Then, the concrete mattresses is covered with rock layer with a thickness of 1.0 m, as shown in Figure 1b. (iii) Concrete mattress + rubber pad + rock (P3): in addition to concrete mattresses as described in P2, a rubber pad with a thickness of 0.2 m is placed on the concrete mattresses. Then, a rock layer with a 0.8 m is laid on the top, as shown in Figure 1c. (iv) Compound flexible pad + rock (P4): the pipeline is protected by layers of compound flexible pad and then covered with a rock on the top. Each layer of the compound flexible pad has a thickness of 0.75 m. The core materials of this protection method are bitumen and gravels with geogrid, and the outer layer is covered with geotextile. The details of the compound flexible pads are provided by the manufacturer. In this study, two layers of compound flexible pad are used, each with a thickness of 1.5 m. Then, the compound flexible pad is covered with rock with a thickness of 0.5 m. The sketch of the protection method is shown in Figure 1d.

2.2. Experimental Setup

Based on the flume size, water depth, and range of measuring equipment, a model scale of 1:15.4 is adopted in the present study. The thickness of the protective layer and the pipeline outer diameter meets the geometric similarity, and the pipeline stiffness is designed based on elastic similarity. The pipeline is modelled with a PVC pipe with an outer diameter of 40.2 mm. The length of the pipeline model is 2.0 m, which is the same as the width of the flume. The density of the PVC material is 1360 kg/m3 and the model pipe is filled with iron sand with a total density of 3010 kg/m3 after weight balance. The elastic modulus of PVC is measured at E = 2.3 × 10⁸ N/m2. The moment of inertia is I = 6.8 × 10⁻⁸ m4, which results in a bending stiffness of the pipeline model EI = 1.56 × 10² N·m2. In the experiments, each protective layer is scaled down from the sketch shown in Figure 1, with the total thickness of the protective layer reaching 130 mm. A hall anchor in the tests with a weight of 4.39 kg is used to represent a prototype anchor with a weight of 16.0 t. According to previous research experience, free falling of the anchor has greater impact on the bottom of the channel than falling with an inclined angle (under shipping conditions). Thus, vertical falling of the anchor is adopted in the tests.
In this study, a fiber Bragg grating (FBG) sensor (Micron Optics Int., Atlanta, GA, USA) is used to measure the strain of pipeline caused by the falling anchor to evaluate the effectiveness of the protective layers. FBG sensors offer high accuracy, long stability, small size, immunity to electromagnetic interference (EMI), and the ability to measure ultra-high-speed events (such as the impact issue). Because the Bragg wavelength is sensitive to strain and temperature, in a FBG sensor, the change in strain can be approximated by the relative shift in the Bragg wavelength with an empirical relationship.
Four FBG sensor strings are arranged along the pipeline axis with 90 degree circumferential interval to collect the strain data of the top (T), bottom (B), and side (S) surfaces of the pipeline. On each FBG sensor string, 7 measuring points are evenly arranged with a spacing of 250 mm. There are 28 strain measuring points in the tests. The FBG sensor arrangement is shown in Figure 2. Due to the weak shear resistance of FBG sensors, special coating is needed. In the study, the fiber glass has a very small diameter (~0.5 mm), having little effect on the stiffness of the pipe.
The model anchor is hung vertically above the pipeline and its positions are adjusted to make the anchor just fall down on the point of FBG sensor #4, i.e., the middle of the pipeline. In this study, two falling heights of the anchor, i.e., h = 1.0 m and 1.5 m above the top of the protective layer, are tested. The orientation of the anchor is kept perpendicular to the pipeline before it is released. Due to the scattering of the dropping point on the pipeline, the tests are repeated 10 times for each case. Before repeating a test, the protective layers around the dropping point are reconstructed to eliminate the plastic strain left by the previous test and also give sufficient time to allow the pipeline to recover to the original status. Then, the offset of the strain is reset at zero. The sketch of the experimental setup is shown in Figure 2. Meanwhile, the anchor dropping motion is also measured with a high-speed camera. Figure 3 shows photos of different protection methods in the tests.

3. Experimental Results and Discussions

3.1. General Characteristics of the Strain Response

Figure 4a shows the space distribution of the strain on the seven measuring points along the pipeline at top, bottom, and side surfaces, respectively, for cases of pure rock (P1) at a falling height of 1.0 m. In the plots, it can be seen that the impact occurs at the instance of t = 0.2 s simultaneously for all surfaces of the pipeline. For the top surface, the maximum strain occurs at the middle of the pipeline, i.e., x = 0 m, and has a negative value, which indicates the middle of the pipeline at the top surface is in compression. Meanwhile, the strain on the other points on the top surface has positive values, indicating that the other parts is stretched. For the bottom surface of the pipeline, the strain at each point is just contrary to that on the top surface. From the analysis of the strain on both the top and bottom surfaces of the pipeline, it is indicated that the middle part of the pipeline has a downward bending effect due to the downward impact of the falling anchor. However, curvatures on the others parts away from the falling point bend upwards. It is similar to the deformation of a fixed-end beam under a focused load. Due to the symmetry of the pipeline, the deformation on both side surfaces are nearly same and only the strain on one side surface is shown. It can be seen that at the middle of the pipeline, the strain is positive and has a maximum value, indicating that the vertical compression of the pipeline occurs due to the impact of the anchor. Meanwhile, for other parts of the pipeline, slight horizontal compression occurs with positive strain.
Figure 4b further shows the time histories of the strain on each measuring point on different surfaces of the pipeline. The maximum strain occurs at the sensor #4, i.e., the middle of the pipeline for all the surfaces. The duration of the impact can be also obtained from the time histories of the strain. For the present case, the duration of the impact is about 0.03 s.
As mentioned above, considering the scattering of the experimental data, the tests are repeated 10 times for each condition. Then, the statistic values of the results are analyzed. Figure 5 shows the probability density of the strain and the impact duration of the experimental results. In the plot, the horizontal axis is normalized with the averaged value. The vertical axis represents the probability of each value. Generally, both the maximum strain and the impact duration follow the standard normal distribution. The following normal function can be applied:
f ( x ) = 1 2 π σ e ( x μ ) 2 σ 2
where x represents ε / ε ¯ and t / t ¯ , respectively. The functions coefficients can be obtained by curve-fitting to the measured results. For ε / ε ¯ , the function coefficients are μ = 1.0 and σ = 0.28. For t / t ¯ , the function coefficients are μ = 1.0 and σ = 0.16. From the distribution of the probability, the average values of the maximum strain and the impact duration have the highest probability density, which indicates that the average value of the measured data can effectively represent the experimental results.

3.2. Comparisons of Strain for Different Protection Methods

Figure 6 shows the distribution of strains along the pipeline for the four protection methods at a falling height of 1.5 m. Both maximum and averaged values of strain at the top, bottom, and side surfaces are compared. The strain at the middle point of the pipeline (i.e., the impact point, x = 0 m) has the largest values, and then the absolute values of the strain decrease from the middle to the two ends of the pipeline. Generally, the absolute value of strain on both the top and bottom surfaces are in the same order, but they have the opposite values. In Figure 6a, for the pure rock (P1), the maximum value of the strain on the top surfaces are −790 με (1 με = 1.0 × 10⁻⁶ ε) and that on the bottom surface is about 770 με. Due to the downward local deflection at the middle of the pipeline, the top surface is in compression, while the bottom surface is in stretch. The strain values at the points close to the middle point have the opposite values to those at the middle point due to the locally upper bending. As discussed above, the middle of the pipeline is attacked directly by the dropped anchor; thus, the curvature at the middle part is downward. Due to the support by the surrounding soil, the bending of other part of the pipeline is upwards with positive strain values on the upper surface. The averaged values of strain also have the same trend as those of maximum values. Meanwhile, the strain on the side surface of the pipeline has a relatively small value compared to those on both the upper and bottom surfaces. The strains at the middle point of the pipeline have positive values, indicating that the pipeline is vertically compressed into an oblate shape by the anchor; thus, the side surface at the middle of the pipeline is stretched. For other protection methods, the general trend of the strain on the surface of pipeline are same to those for the pure rock (P1). The protection method P4 has the smallest values among these protection methods. Figure 7 shows the strain values of the pipeline at a falling height of 1.0 m. The strain values are all smaller than those for the 1.5 m falling height, due to the less impact energy by the anchor.
Then, the strain values of the four protection methods are quantitatively compared to determine the effectiveness of the protection method. The maximum value, the average value, and the root-mean-square values of the 10 tests for each case are compared together, as shown in Figure 8a. Generally, three types of strain have the same trend, i.e., the pure rock (P1) has the largest strain, while the compound flexible pad + rock (P4) has the smallest value, i.e., with the highest effectiveness of protection. From Figure 6 and Figure 7, it is also observed that the affected length on the pipeline exposed to the impact are different for the four protection methods. Here, the affected length is defined as the length of the area on the pipeline where significant strain values (i.e., S ≥ 10 με) can be detected by the FBG. For the falling height of 1.5 m, protection methods P1, P2, and P3 have an affected length of 1.5 m, while the affected length for P4 is around 1.0 m, as shown in Figure 8b. For the falling height of 1.0 m shown in Figure 9, the strain on the pipeline has the same trend to that of the falling height of 1.5 m. The protection methods P1 and P2 have an affected length of 1.5 m, while the affected length for both P3 and P4 is 1.0 m, as shown in Figure 9b. The above analysis indicates that an effective protection method can reduce both the maximum strain and the affected length on the pipeline. P4 provides the most effective protection for the pipeline from the impact of the falling anchor.

4. Theoretical Analysis

The theoretical model for a pipeline laid on a soft seabed [14], which considers the effect of the seabed stiffness on the deformation and stress of the pipeline, is applied in this study. Because the vertical deflection is much smaller than the horizontal length of the pipeline, the small deflection theory can be adopted.
The linear stiffness of the seabed is kb and the bending stiffness of the pipeline is EI. Due to the cushion effect of the protective layer, the action of the falling anchor can be represented by a uniform load q with an acting length 2a. Here, the acting length is defined as the length of the upper moving protective layer directly acting on the pipeline. In this study, the acting length is estimated as 10d empirically, i.e., 2
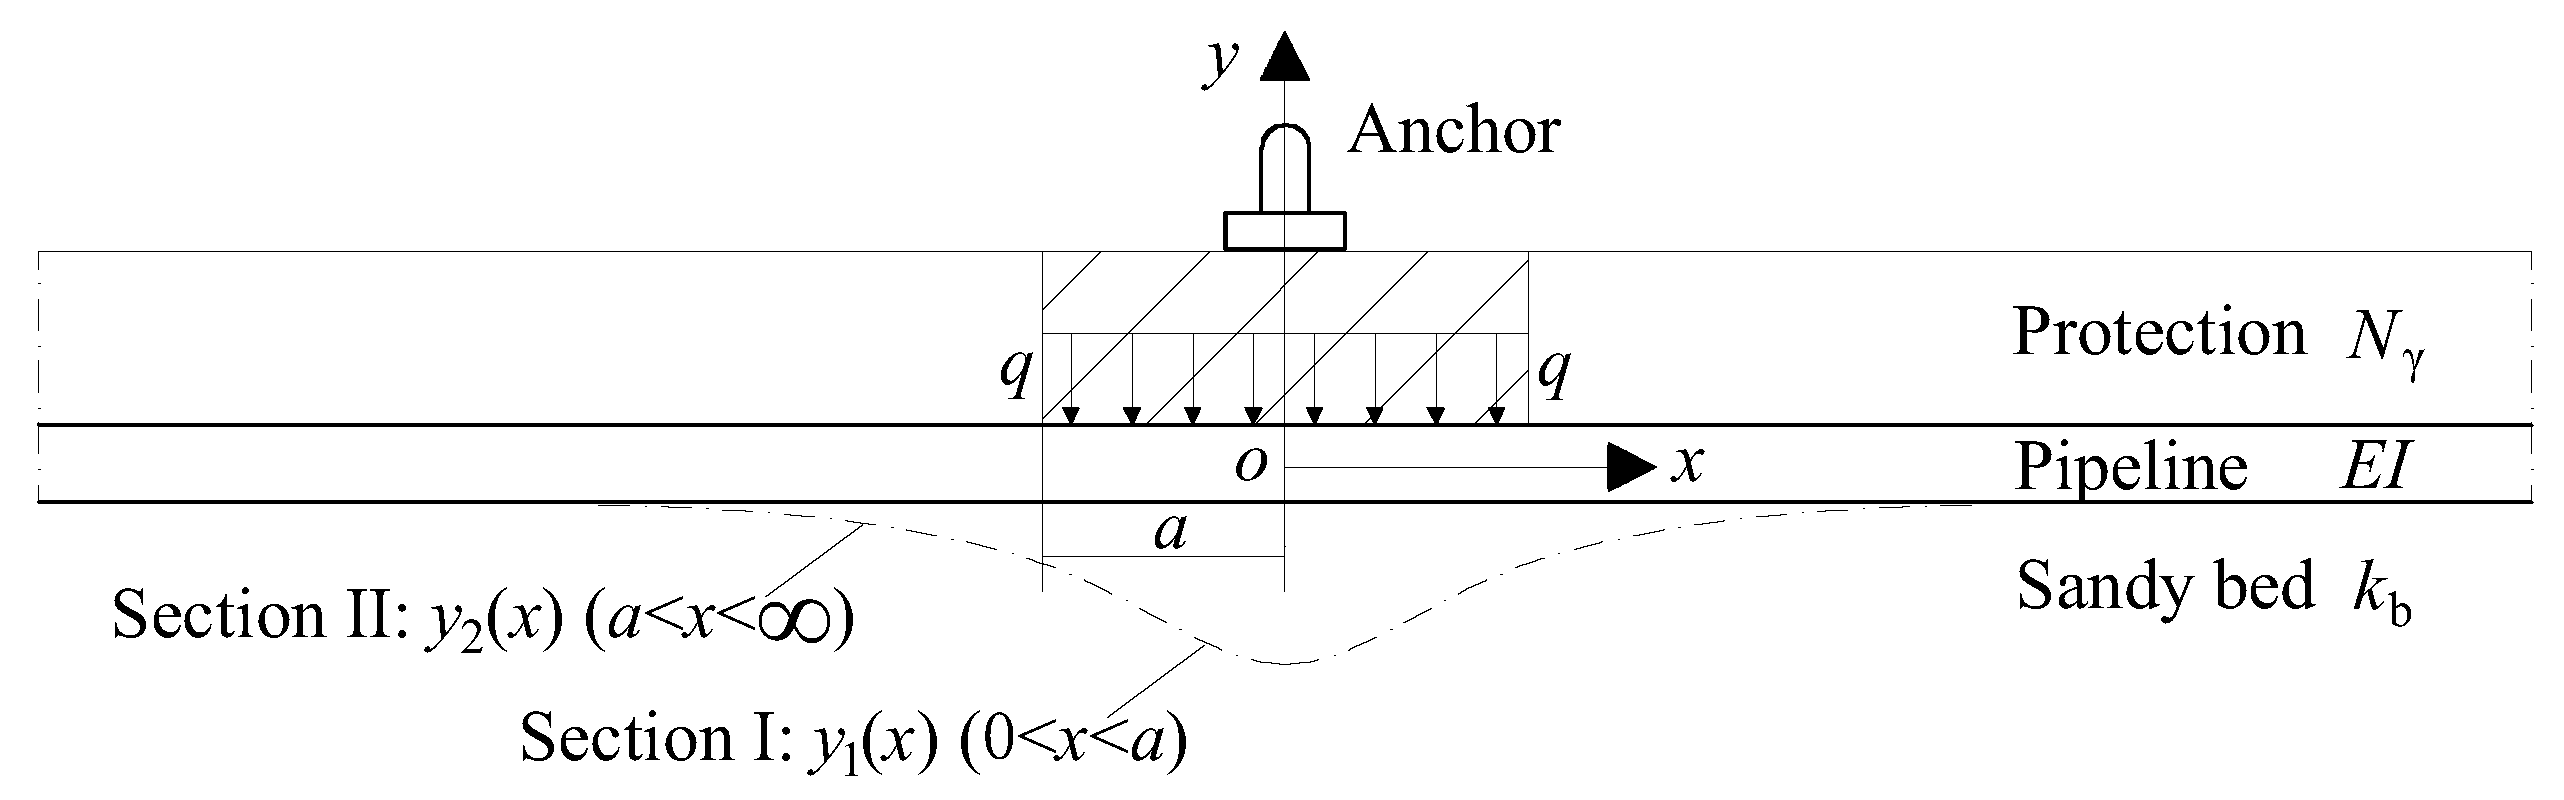
a = 0.40 m, through analysis of the strain distribution along the pipeline. It is assumed that the deflection is symmetrical at the impact point. The coordinate is established and its center is set at the impact point, as shown in Figure 10.
Then, the deflection and bending moment of the pipeline can be described in two sections (I and II), according to Xing et al. (2013), as shown in Figure 10. Here, the horizontal dimension is normalized as ξ = x/a and the normalized deflection is Y(ξ) = y(x)/a with the bending moment M1(ξ).
For section I:
M 1 ( ξ ) = q 0 ξ 2 2 4 q 1 λ 0 4 ξ + 2 q 1 λ 0 3 3 ( λ 0 + 1 ) [ ( 2 λ 0 2 3 ) ] ( 0 ξ 1 )
Y 1 ( ξ ) = q 0 ξ 4 24 + 2 q 1 λ 0 4 ξ 3 3 q 1 3 ( λ 0 + 1 )   { λ 0 3 ξ [ ( 2 λ 0 2 3 ) ξ + 2 ( 2 λ 0 2 + 3 ) ] + ( 2 λ 0 3 + 6 λ 0 2 + 6 λ 0 + 3 ) } ( 0 ξ 1 )
For section II:
M 2 ( ξ ) = 2 q 1 λ 0 3 3 ( λ 0 + 1 ) e λ 0 ξ [ ( 2 λ 0 2 3 ) cos ( λ 0 ξ ) ( 2 λ 0 2 + 6 λ 0 + 3 ) sin ( λ 0 ξ ) ] ( < ξ 0 )
Y 2 ( ξ ) = q 1 λ 0 q 1 3 ( λ 0 + 1 ) e λ 0 ξ [ ( 2 λ 0 2 + 6 λ 0 + 3 ) cos ( λ 0 ξ ) + ( 2 λ 0 2 3 ) sin ( λ 0 ξ ) ] ( < ξ 0 )
where q0, q1, and λ0 are calculated from the static load of the anchor, as follows:
q 0 = q a 3 E I
q 1 = q a k b
λ 0 = a ( k b 4 E I ) 1 / 4
Then, the strain on the surface of the pipeline can be approximated based on a beam theory with the bending moments from Equations (2) and (4):
ε ( ξ ) = M ( ξ ) D 2 E I
It is noted that for a falling anchor, a dynamic amplified coefficient kd should be multiplied on the values from above equations. For different protection methods, the dynamic load coefficients are different, which can be obtained through calibration from the measured results. 
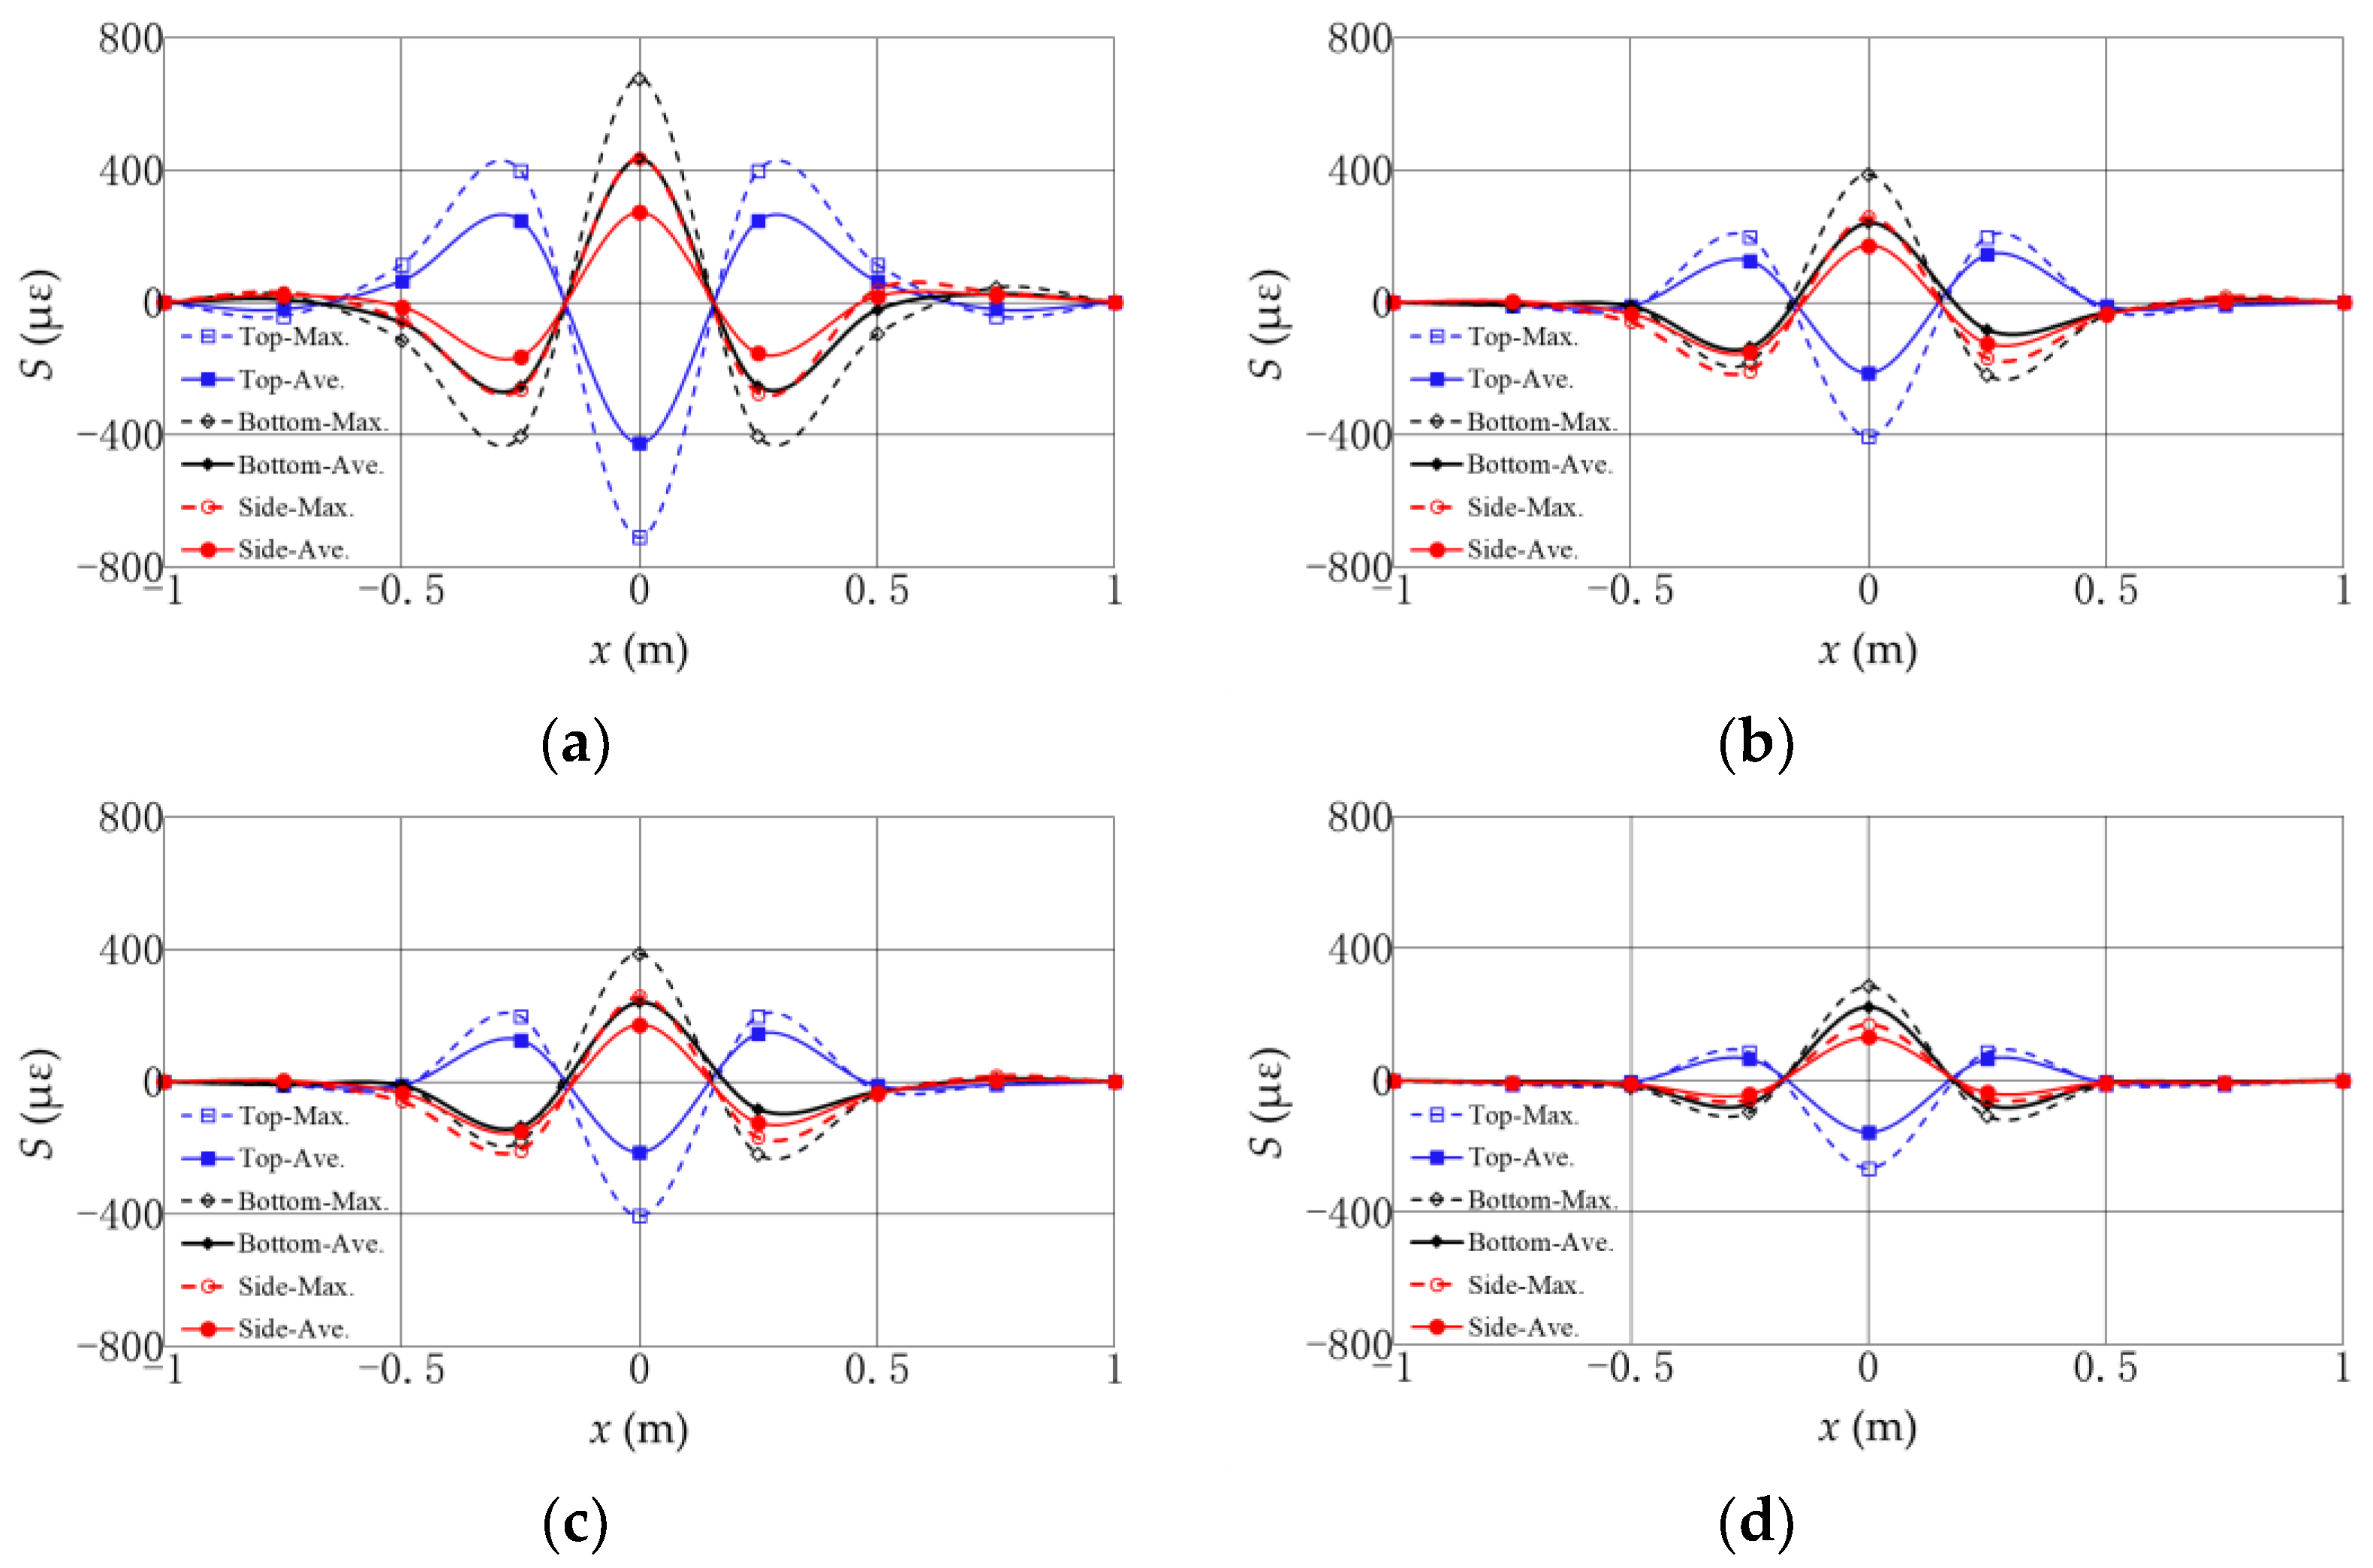
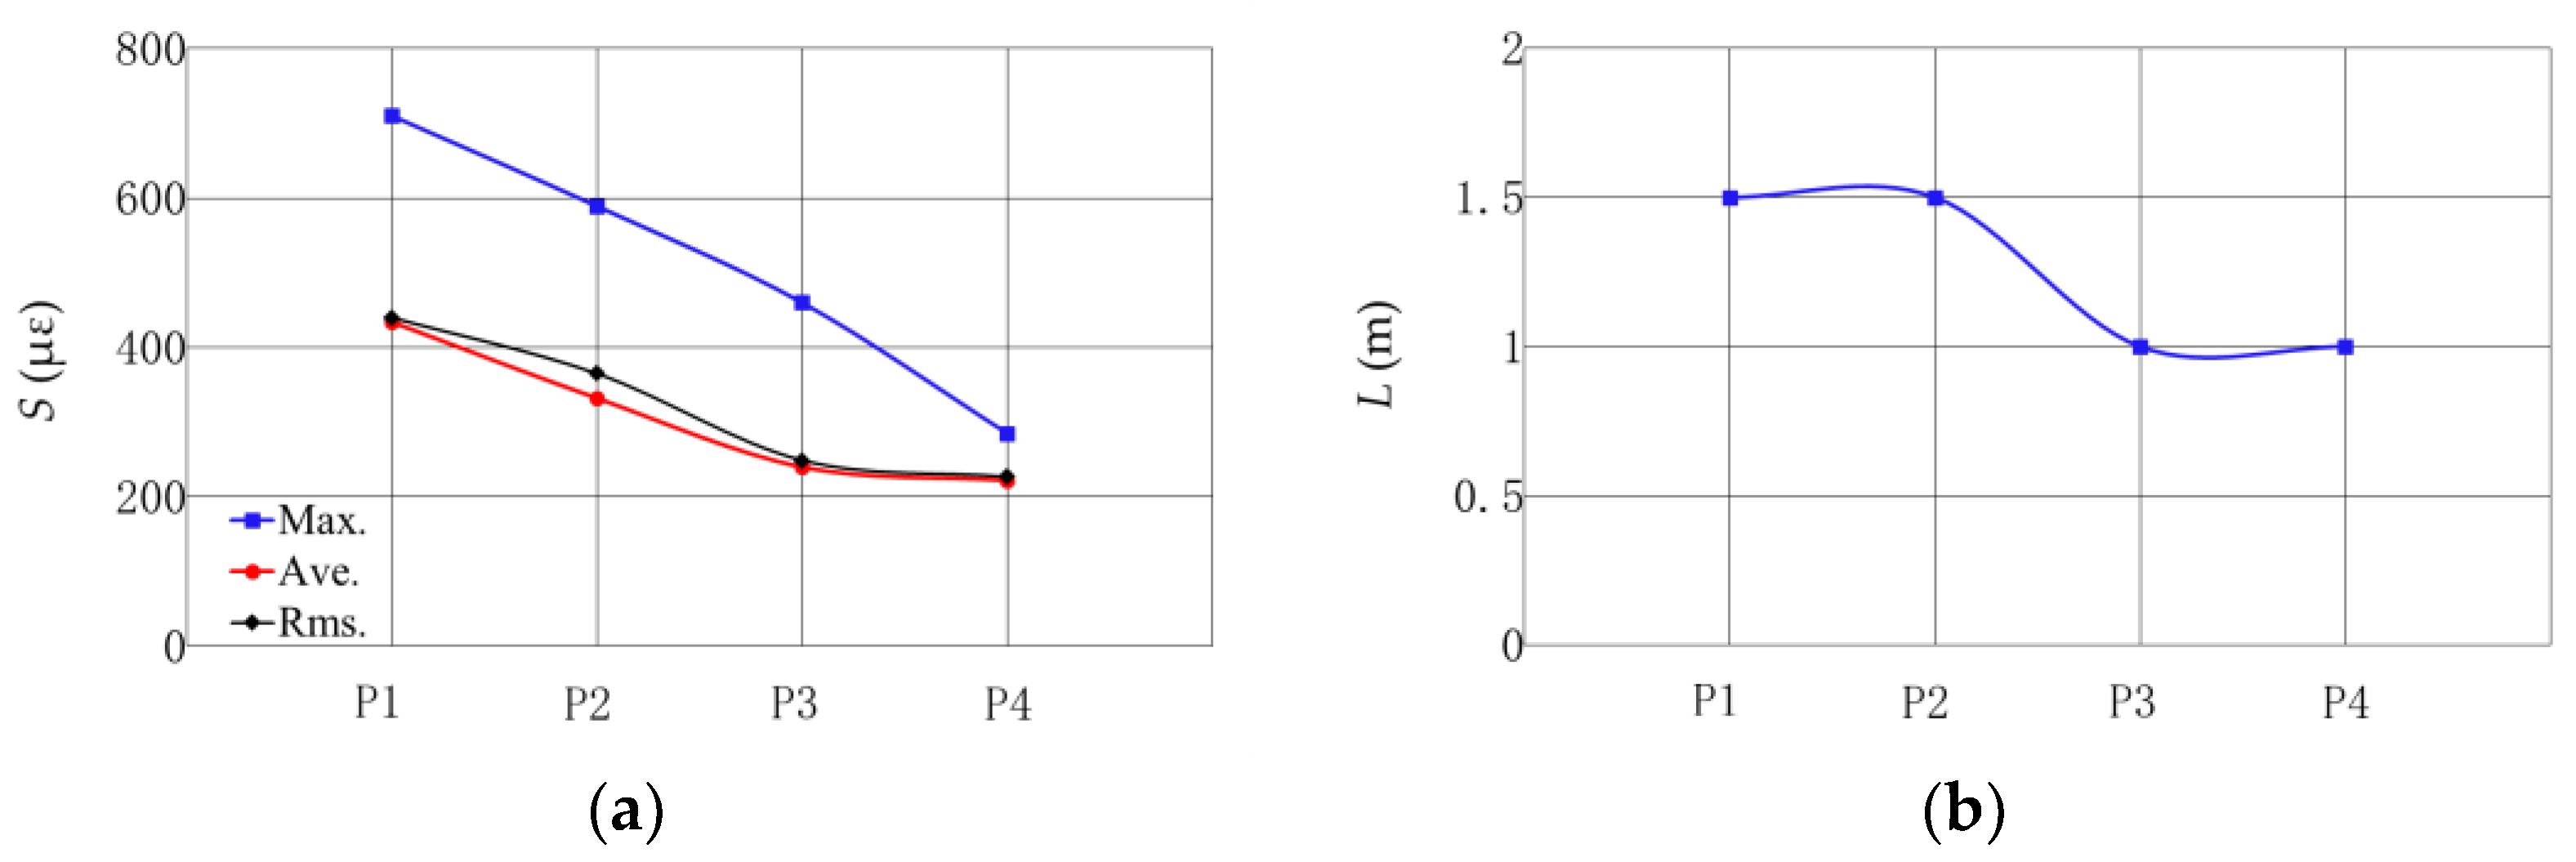
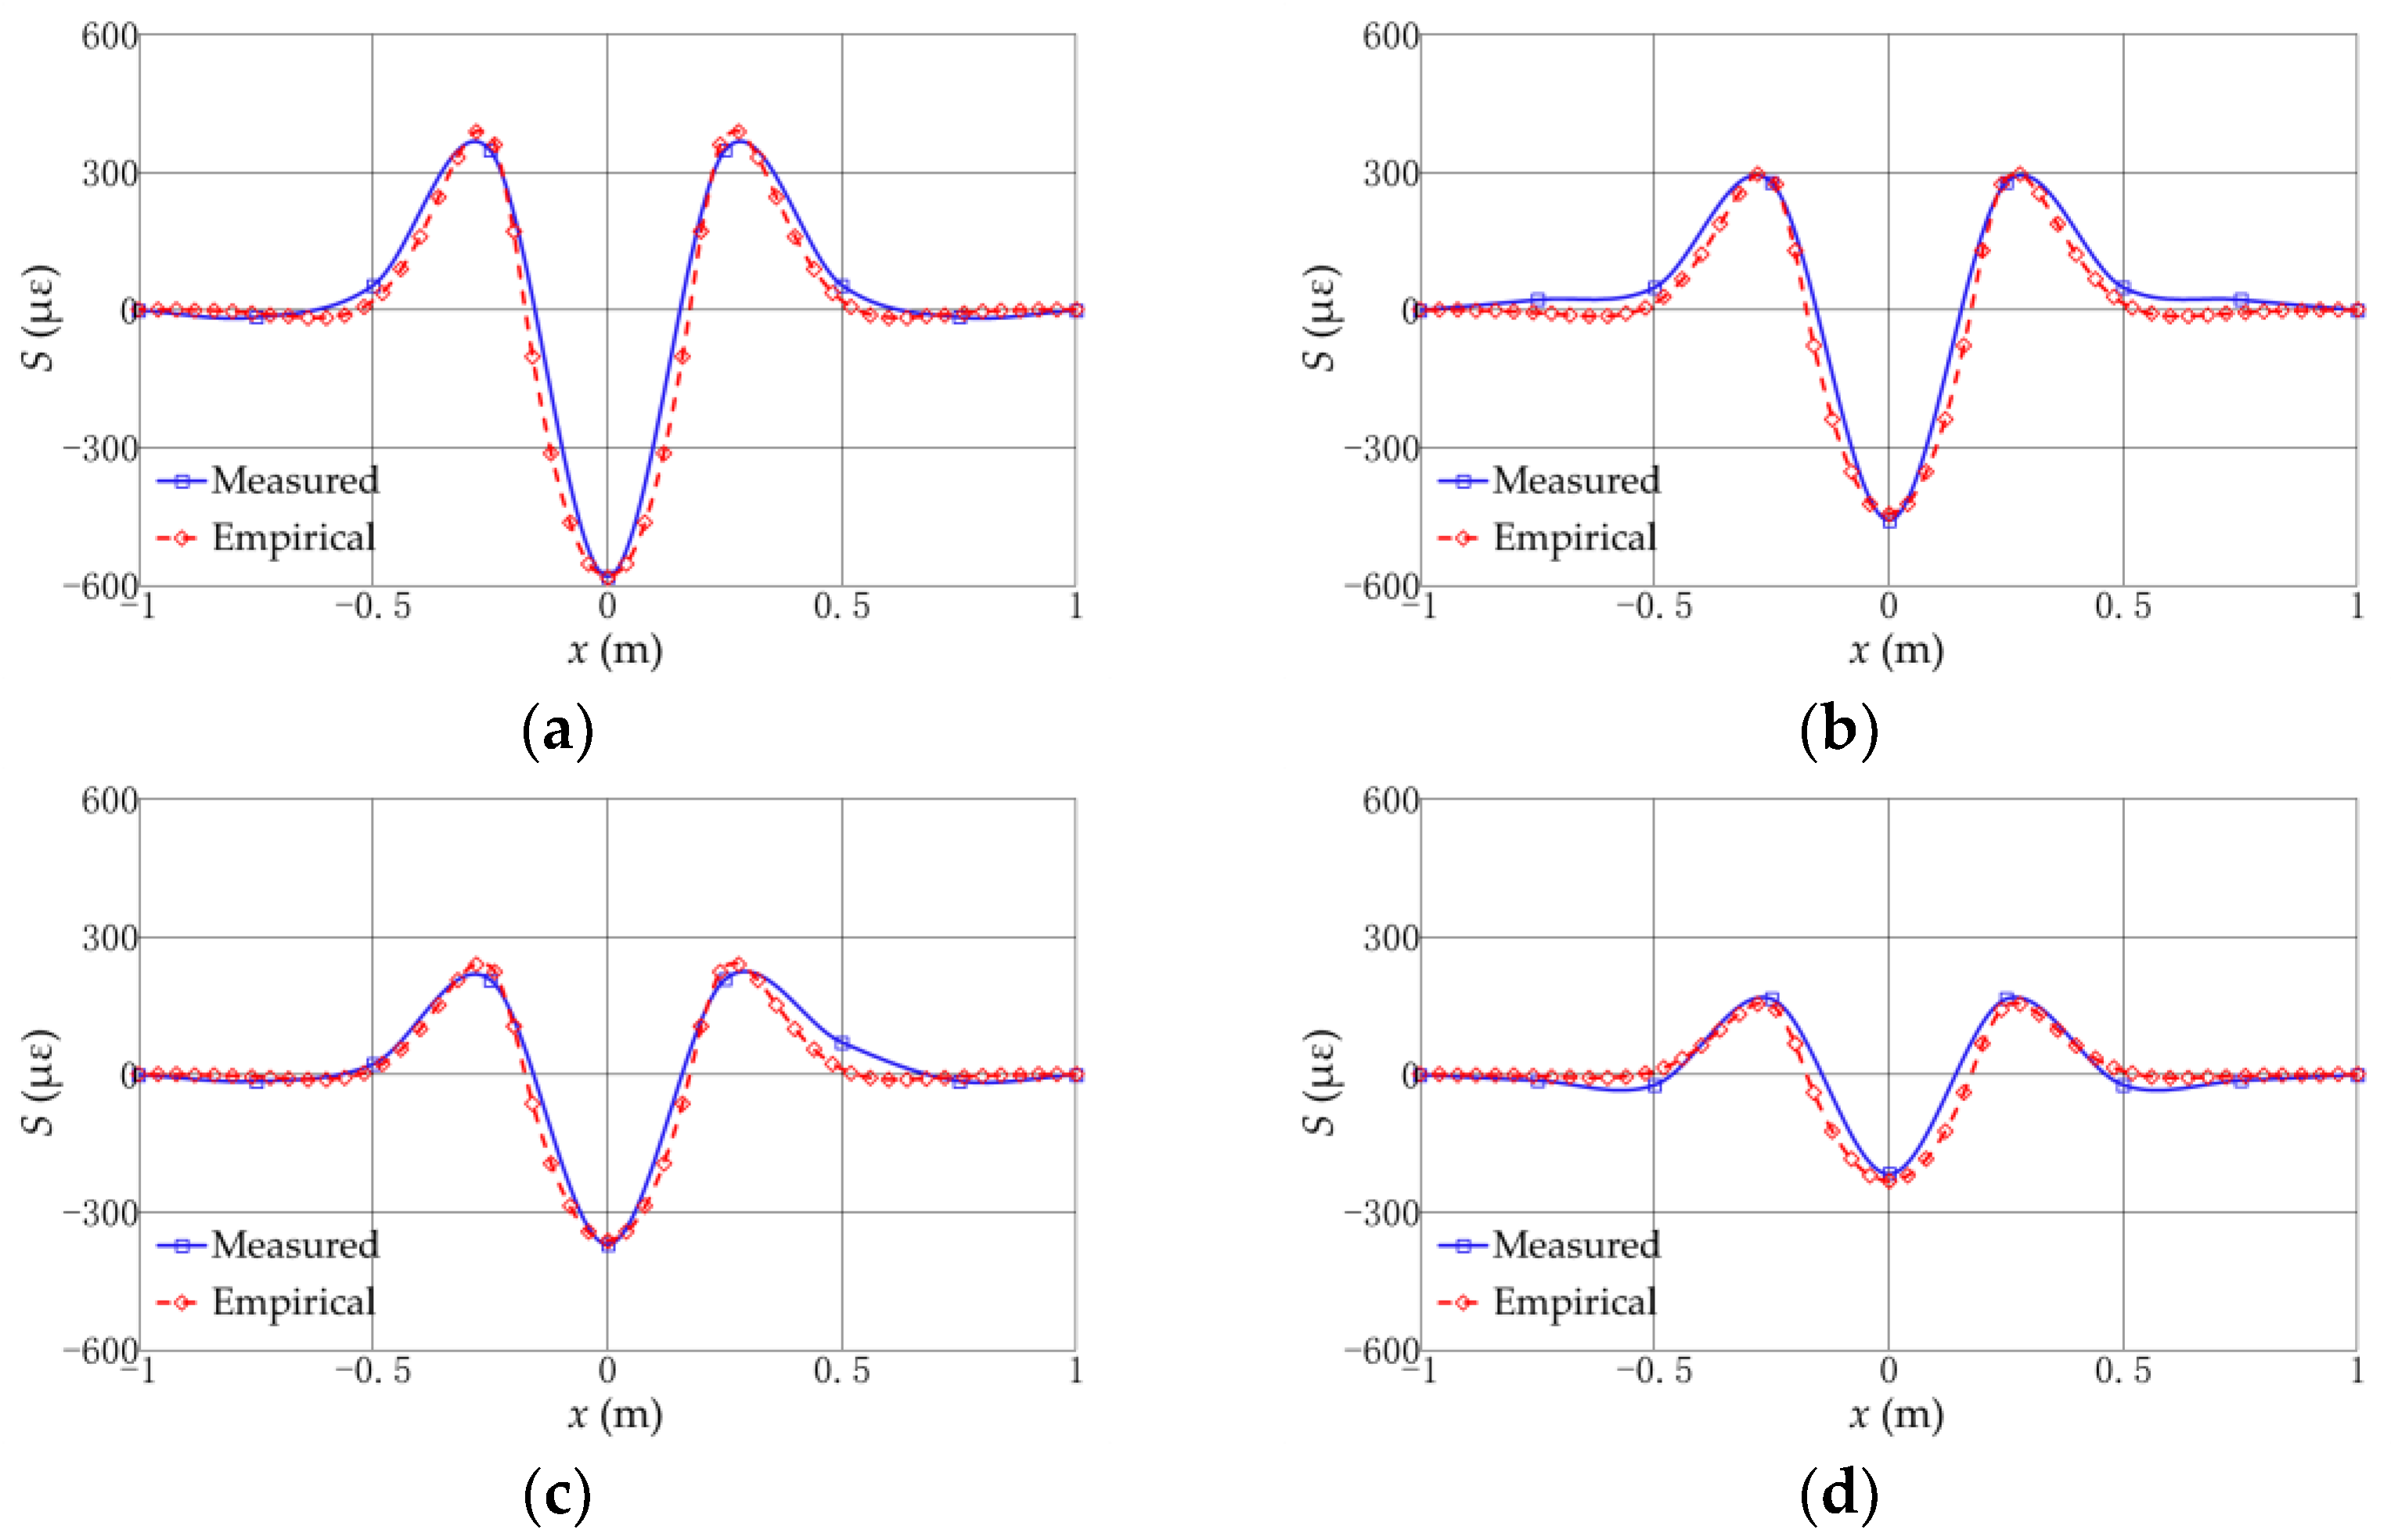
Figure 11 shows the comparisons between measured and theoretical values of strain along the pipeline. Through calibration, the dynamic amplified coefficient for the four protective layers are kd = 21, 16, 13, and 8, respectively, as shown in Table 1. The measured and theoretical values are also listed in 
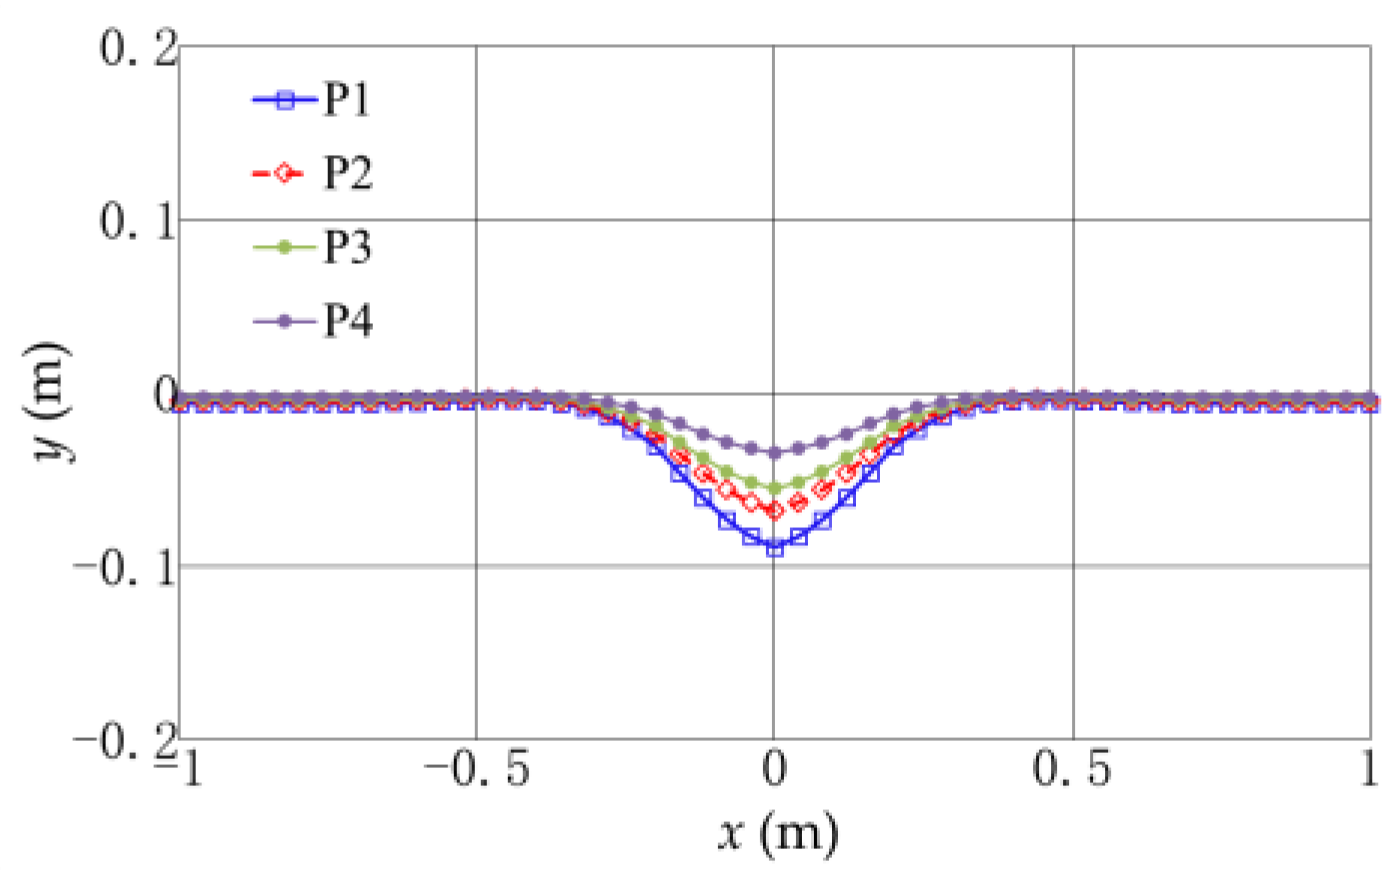
Table 1. It is observed that the theoretical model can effectively describe the distribution of strain on the pipeline exposed to the impact of a falling anchor. Then, the deformation of the pipeline can be calculated by Equations (3) and (5) with the dynamic amplified coefficient kd, as shown in Figure 12. The maximum deflections at the middle of the pipeline are 0.088 m, 0.068 m, 0.055 m, and 0.034 m for the four protection methods, as shown in Table 1.
Based on the theory of material mechanics (Wang and Kang, 2008), the dynamic amplified coefficient for a fixed-end beam can be approximated by:
k d = 1 + 1 + 0.532 v T 2 Δ s t
where Δst is the static deflection at the middle of the pipeline, which can be obtained from Equation (2) at ξ = 0; vT is the velocity of the upper protective layer associated with the anchor impacting on the pipeline. In this study, vT can be calculated based on the energy conversation principle.
According to DNV-RP-F107, the total energy before impacting on the seabed includes the kinetic energy of the falling anchor and the energy from the added hydrodynamic mass, i.e.,
E T = 1 2 ( m + ρ w C a V ) v 0 2
where Ca is the added mass coefficient and is taken as 1.0; V is the volume of the anchor; and v0 is the falling velocity before impacting on the seabed. In this study, v0 is analyzed from the high-speed video record and has a value of 3.27 m/s for a 1.0 m falling height.
After the anchor impacts on the seabed, a part of energy is absorbed by the protective layer, and then the anchor becomes further associated with a part of the protective layer impacting on the pipeline at a velocity vT, i.e.,
E T = E p + E e
where Ee is the kinetic energy of the anchor and the moving protective layer (i.e., the shadow area in Figure 10):
E e = 1 2 ( m + m p ) v T 2
where mp is mass of the moving protective layer. In the present study, the moving protective layer has a length of 2a (10d = 0.4 m), a width of d (0.04 m), and a thickness of 0.13 m. The density of the moving protective layer is taken as 2200 kg/m3. Thus, mp is calculated as 4.58 kg.
Ep is the energy absorbed by the protective layer, and can be described as (DNVGL-RP-F107):
E p = 1 2 γ W N r A z + γ N r A z 2
where γ′ is the submerged weight of the fill material, assumed to be 11,000 N/m3, according to the DNVGL-RP-F107 code; W is the width of the anchor, with a value of 0.1 m; z is the penetration depth, which is measured from the experiments and has a mean value of 0.029 m; and Nr is the bearing capacity coefficients of the protective layer.
According to DNVGL-RP-F107, the bearing capacity coefficients for a rock cover (P1) is empirically selected as Nr = 99. Combining Equations (12)–(14), the bearing capacity coefficients for other three protective layer (P2–P4) are Nr = 138, 169, and 196, as shown in 
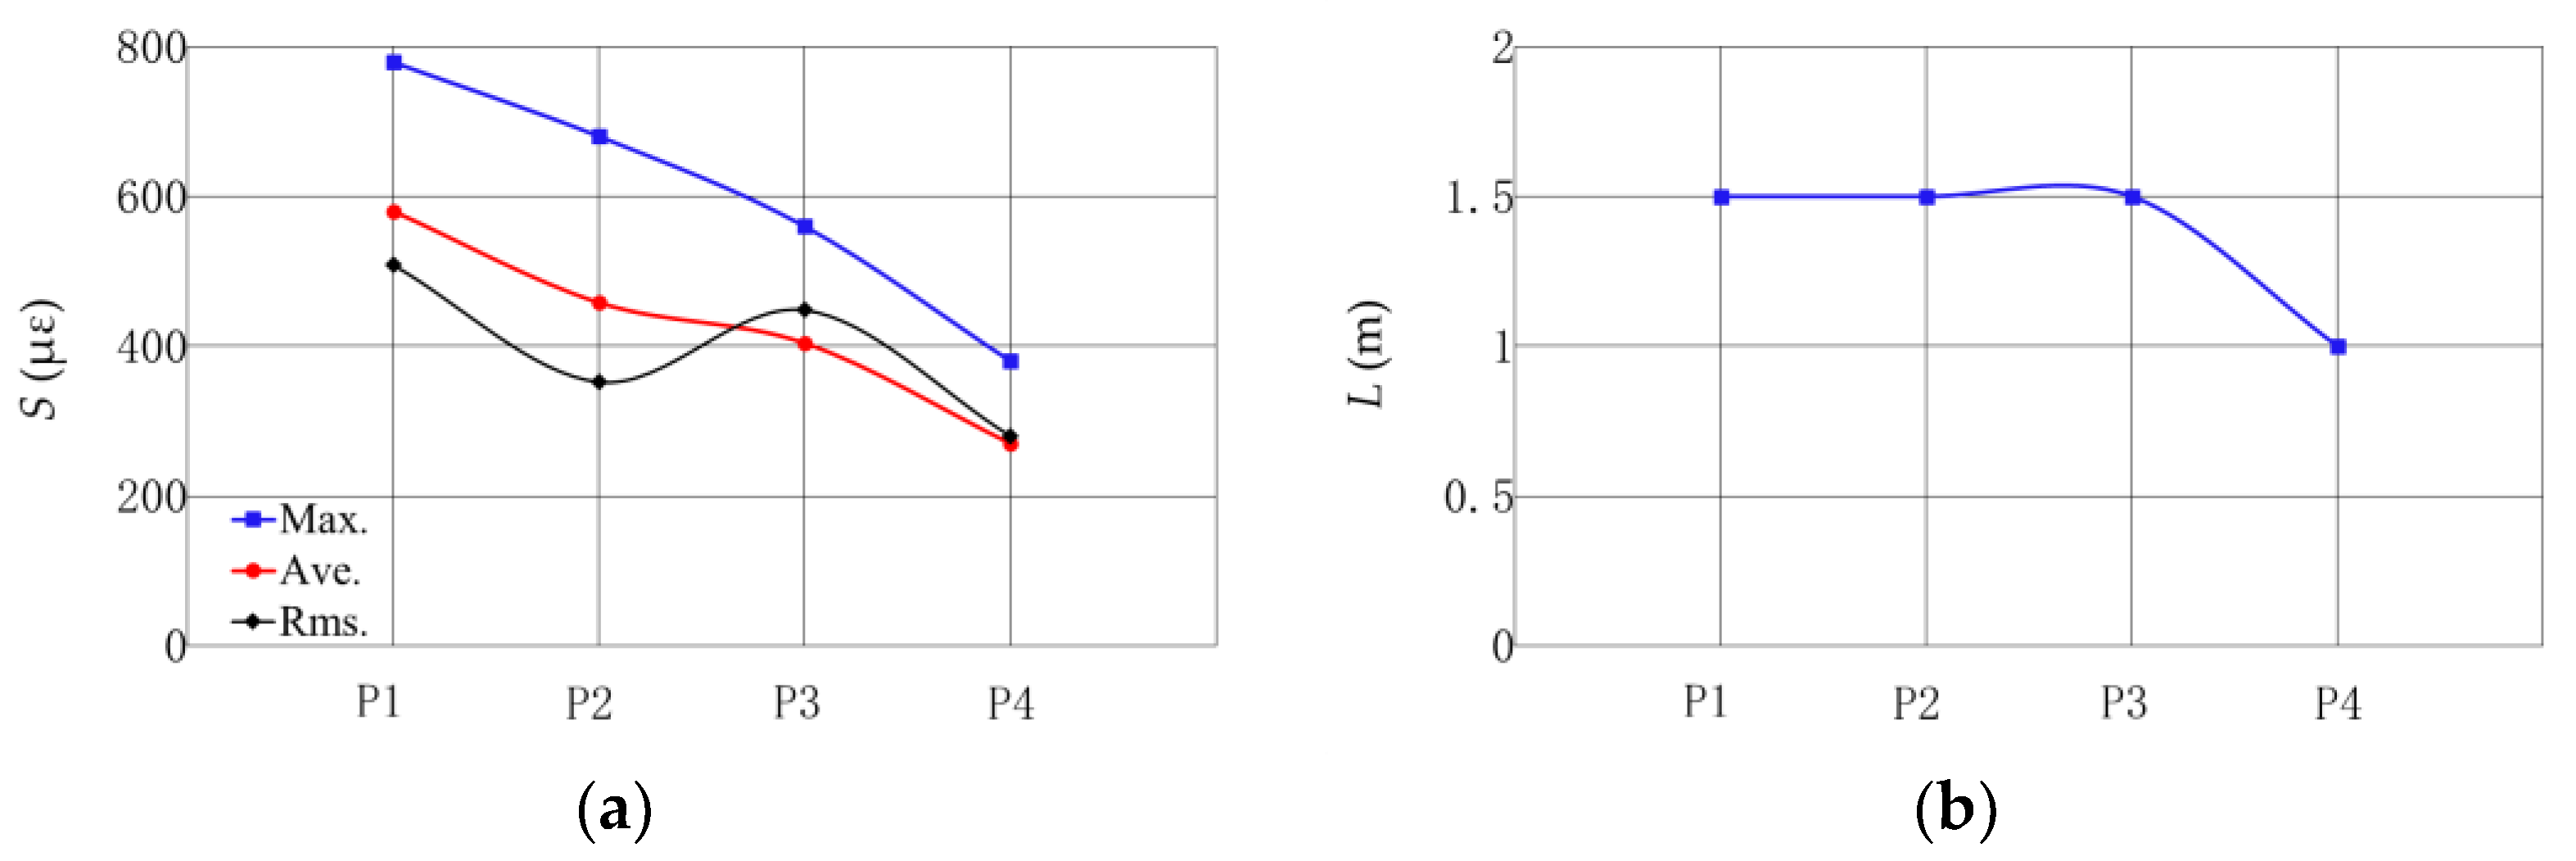
Table 1. Based on above analyses, the protective method P4 has the best performance to protect the pipeline, i.e., having the minimum strain on the pipeline and minimum effective length. It is noted that the effectiveness of the protective method is determined based on mechanical properties of materials in this study. As for the economy of different protective methods, it has not been considered because the submarine pipeline is a very important facility for offshore engineering, and the safe operation of the pipeline is usually at the first place in some important areas under the channel bottom.

5. Conclusions

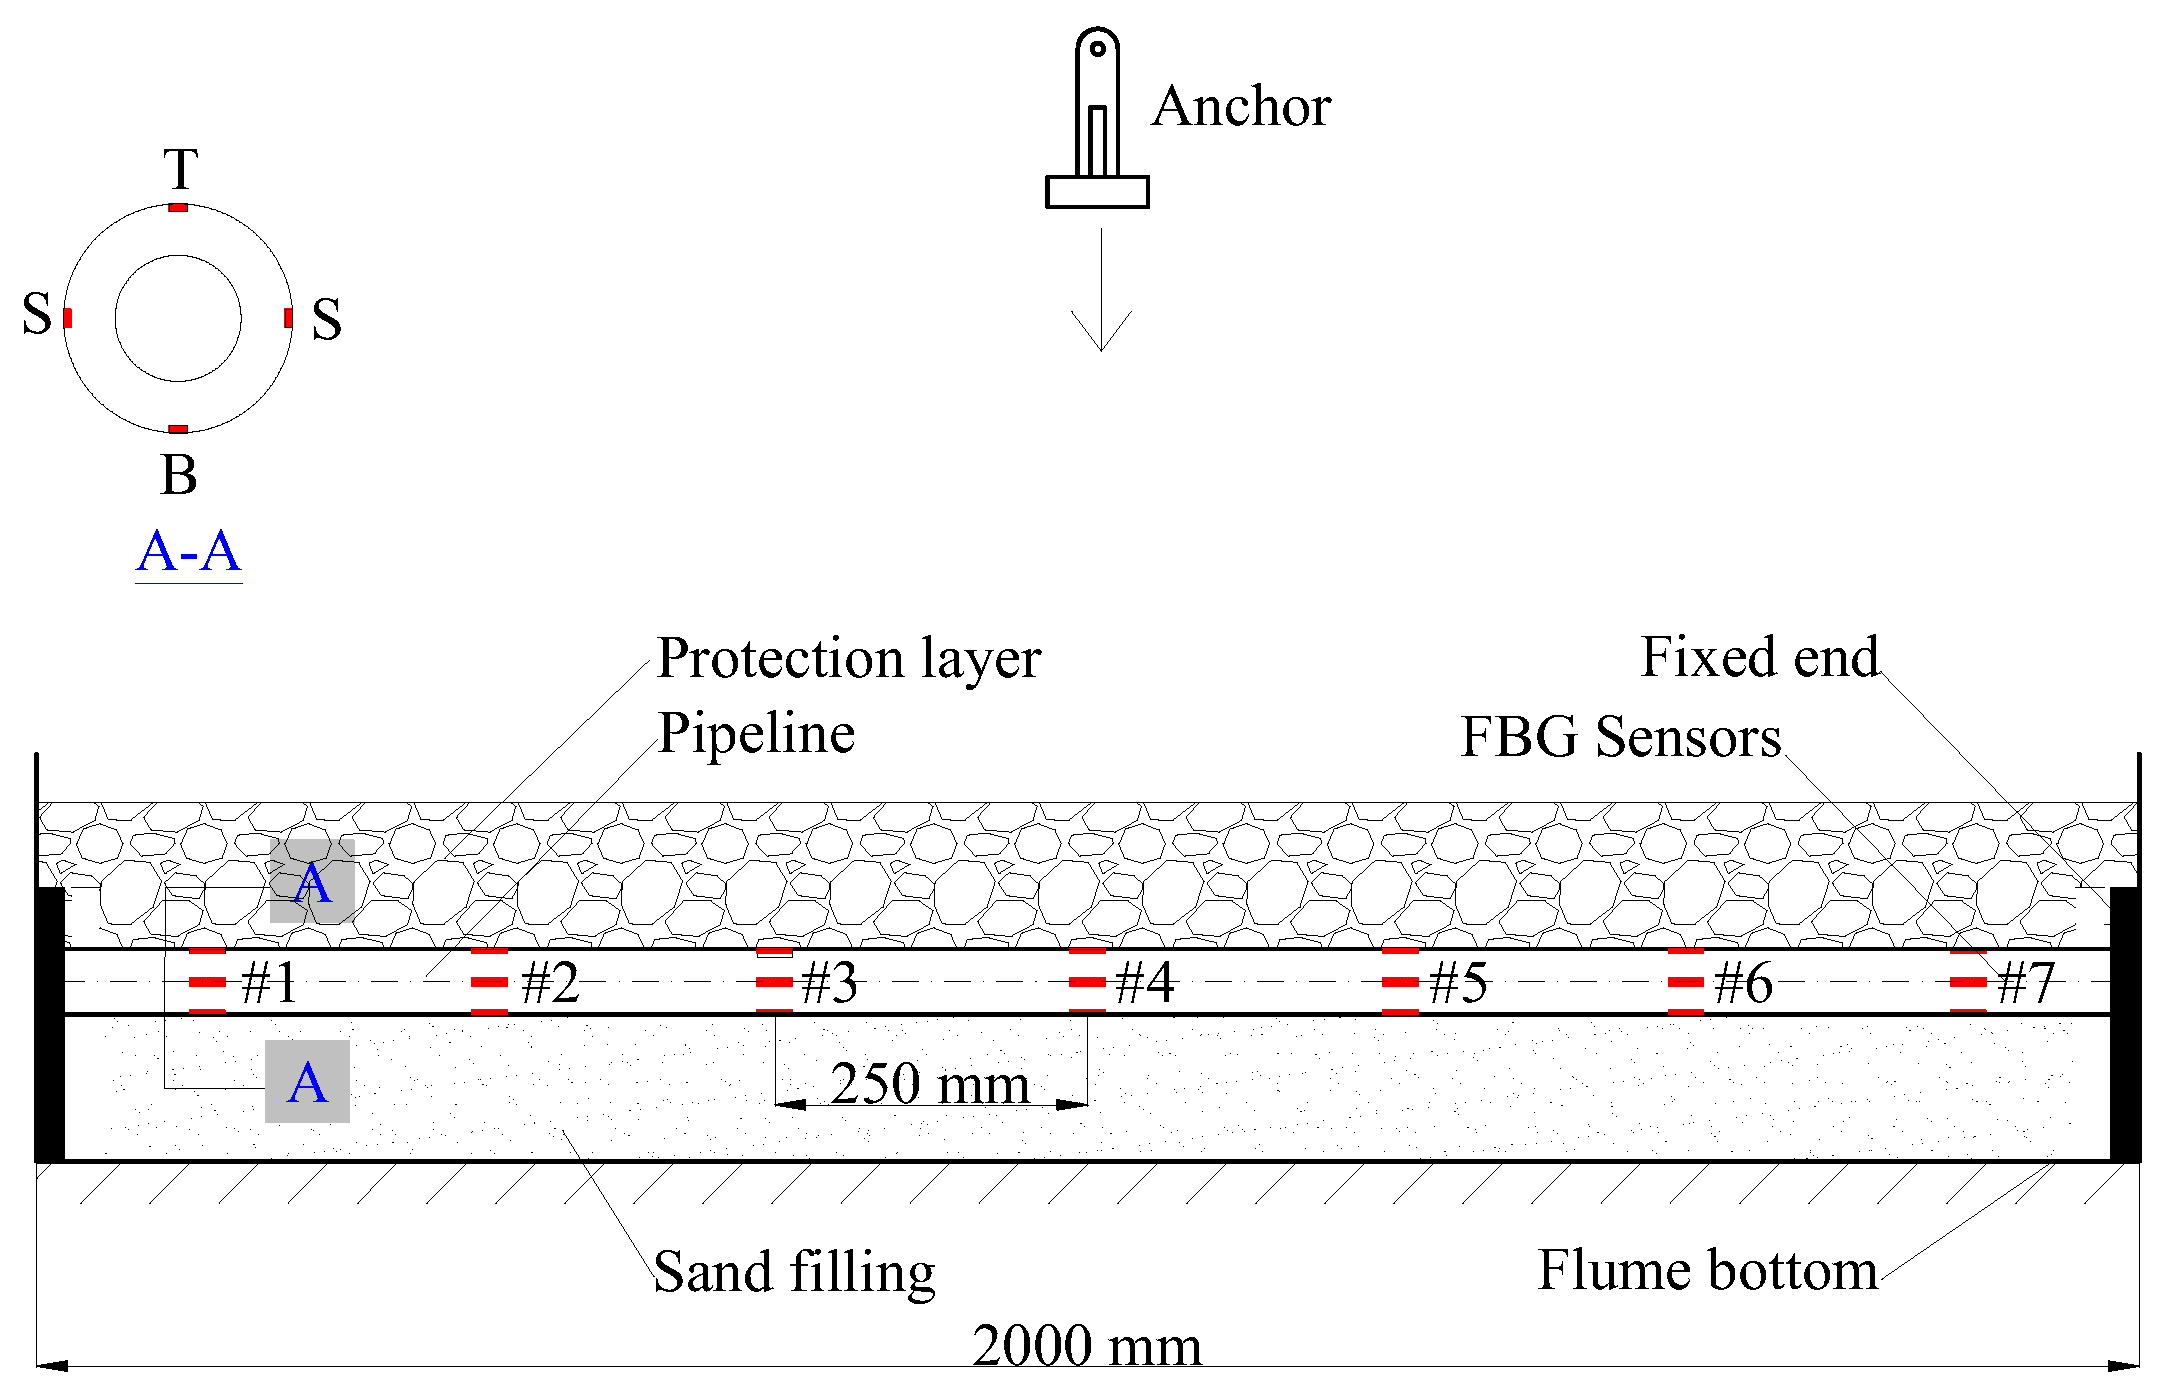
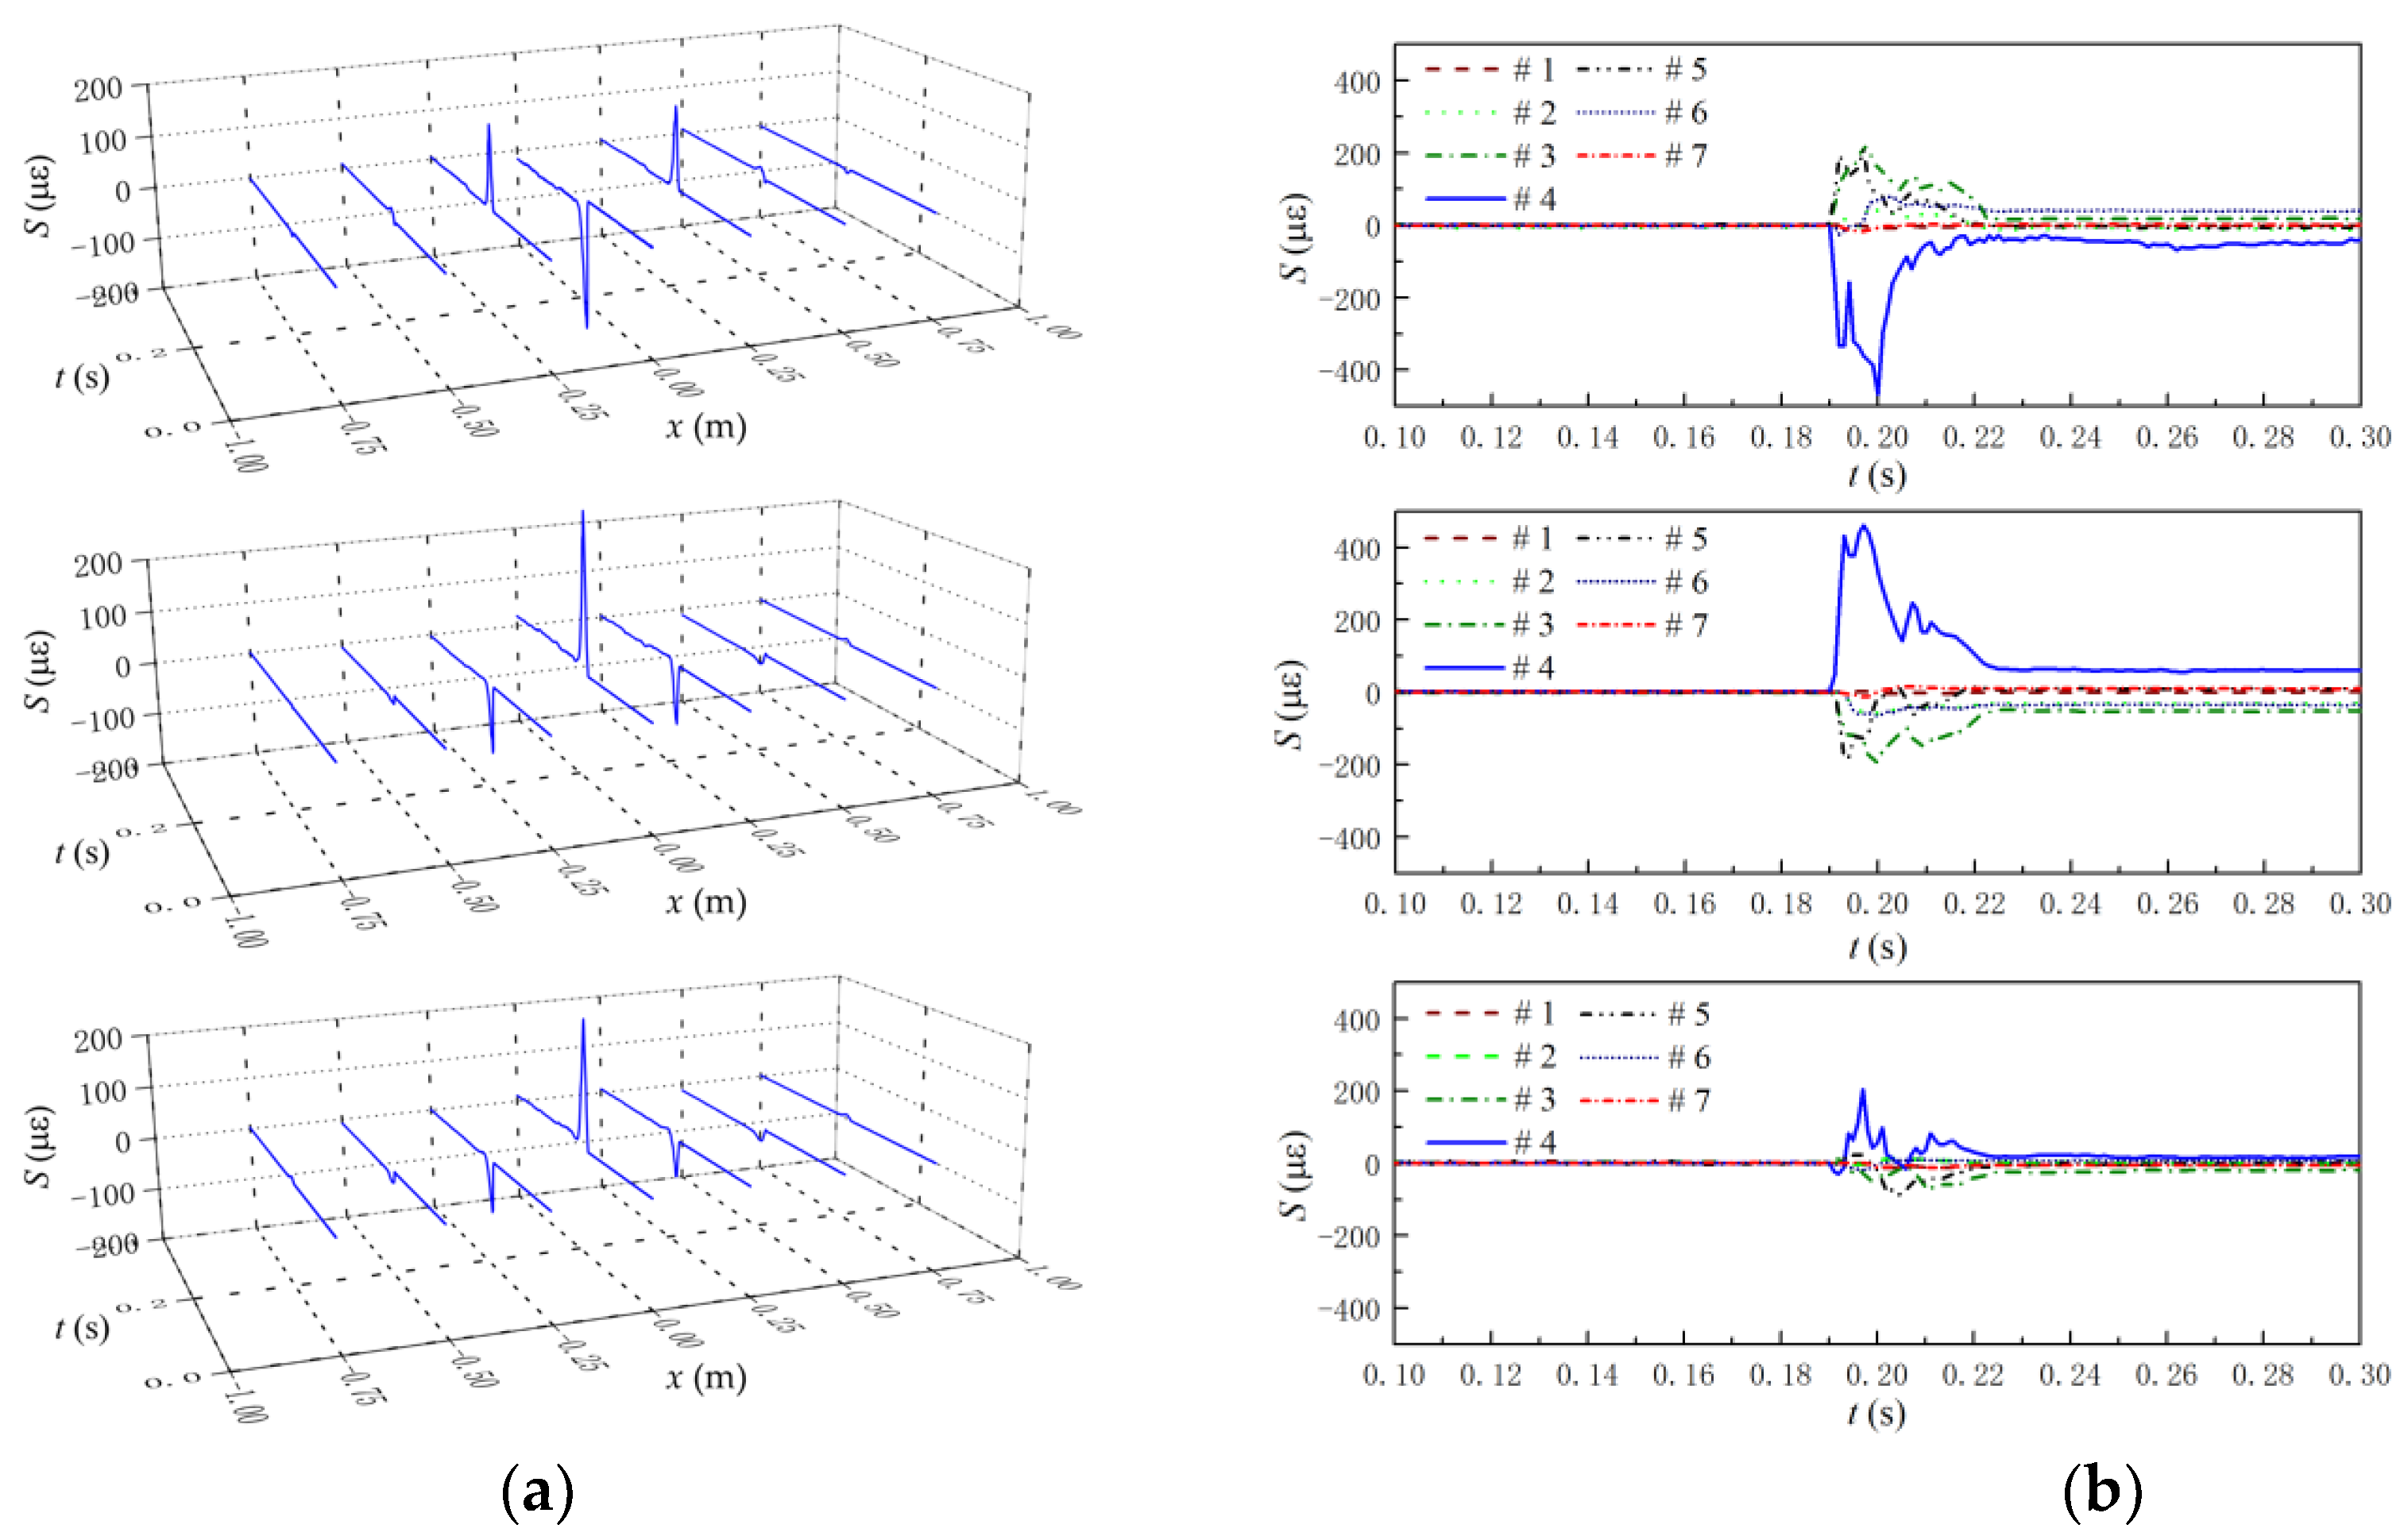
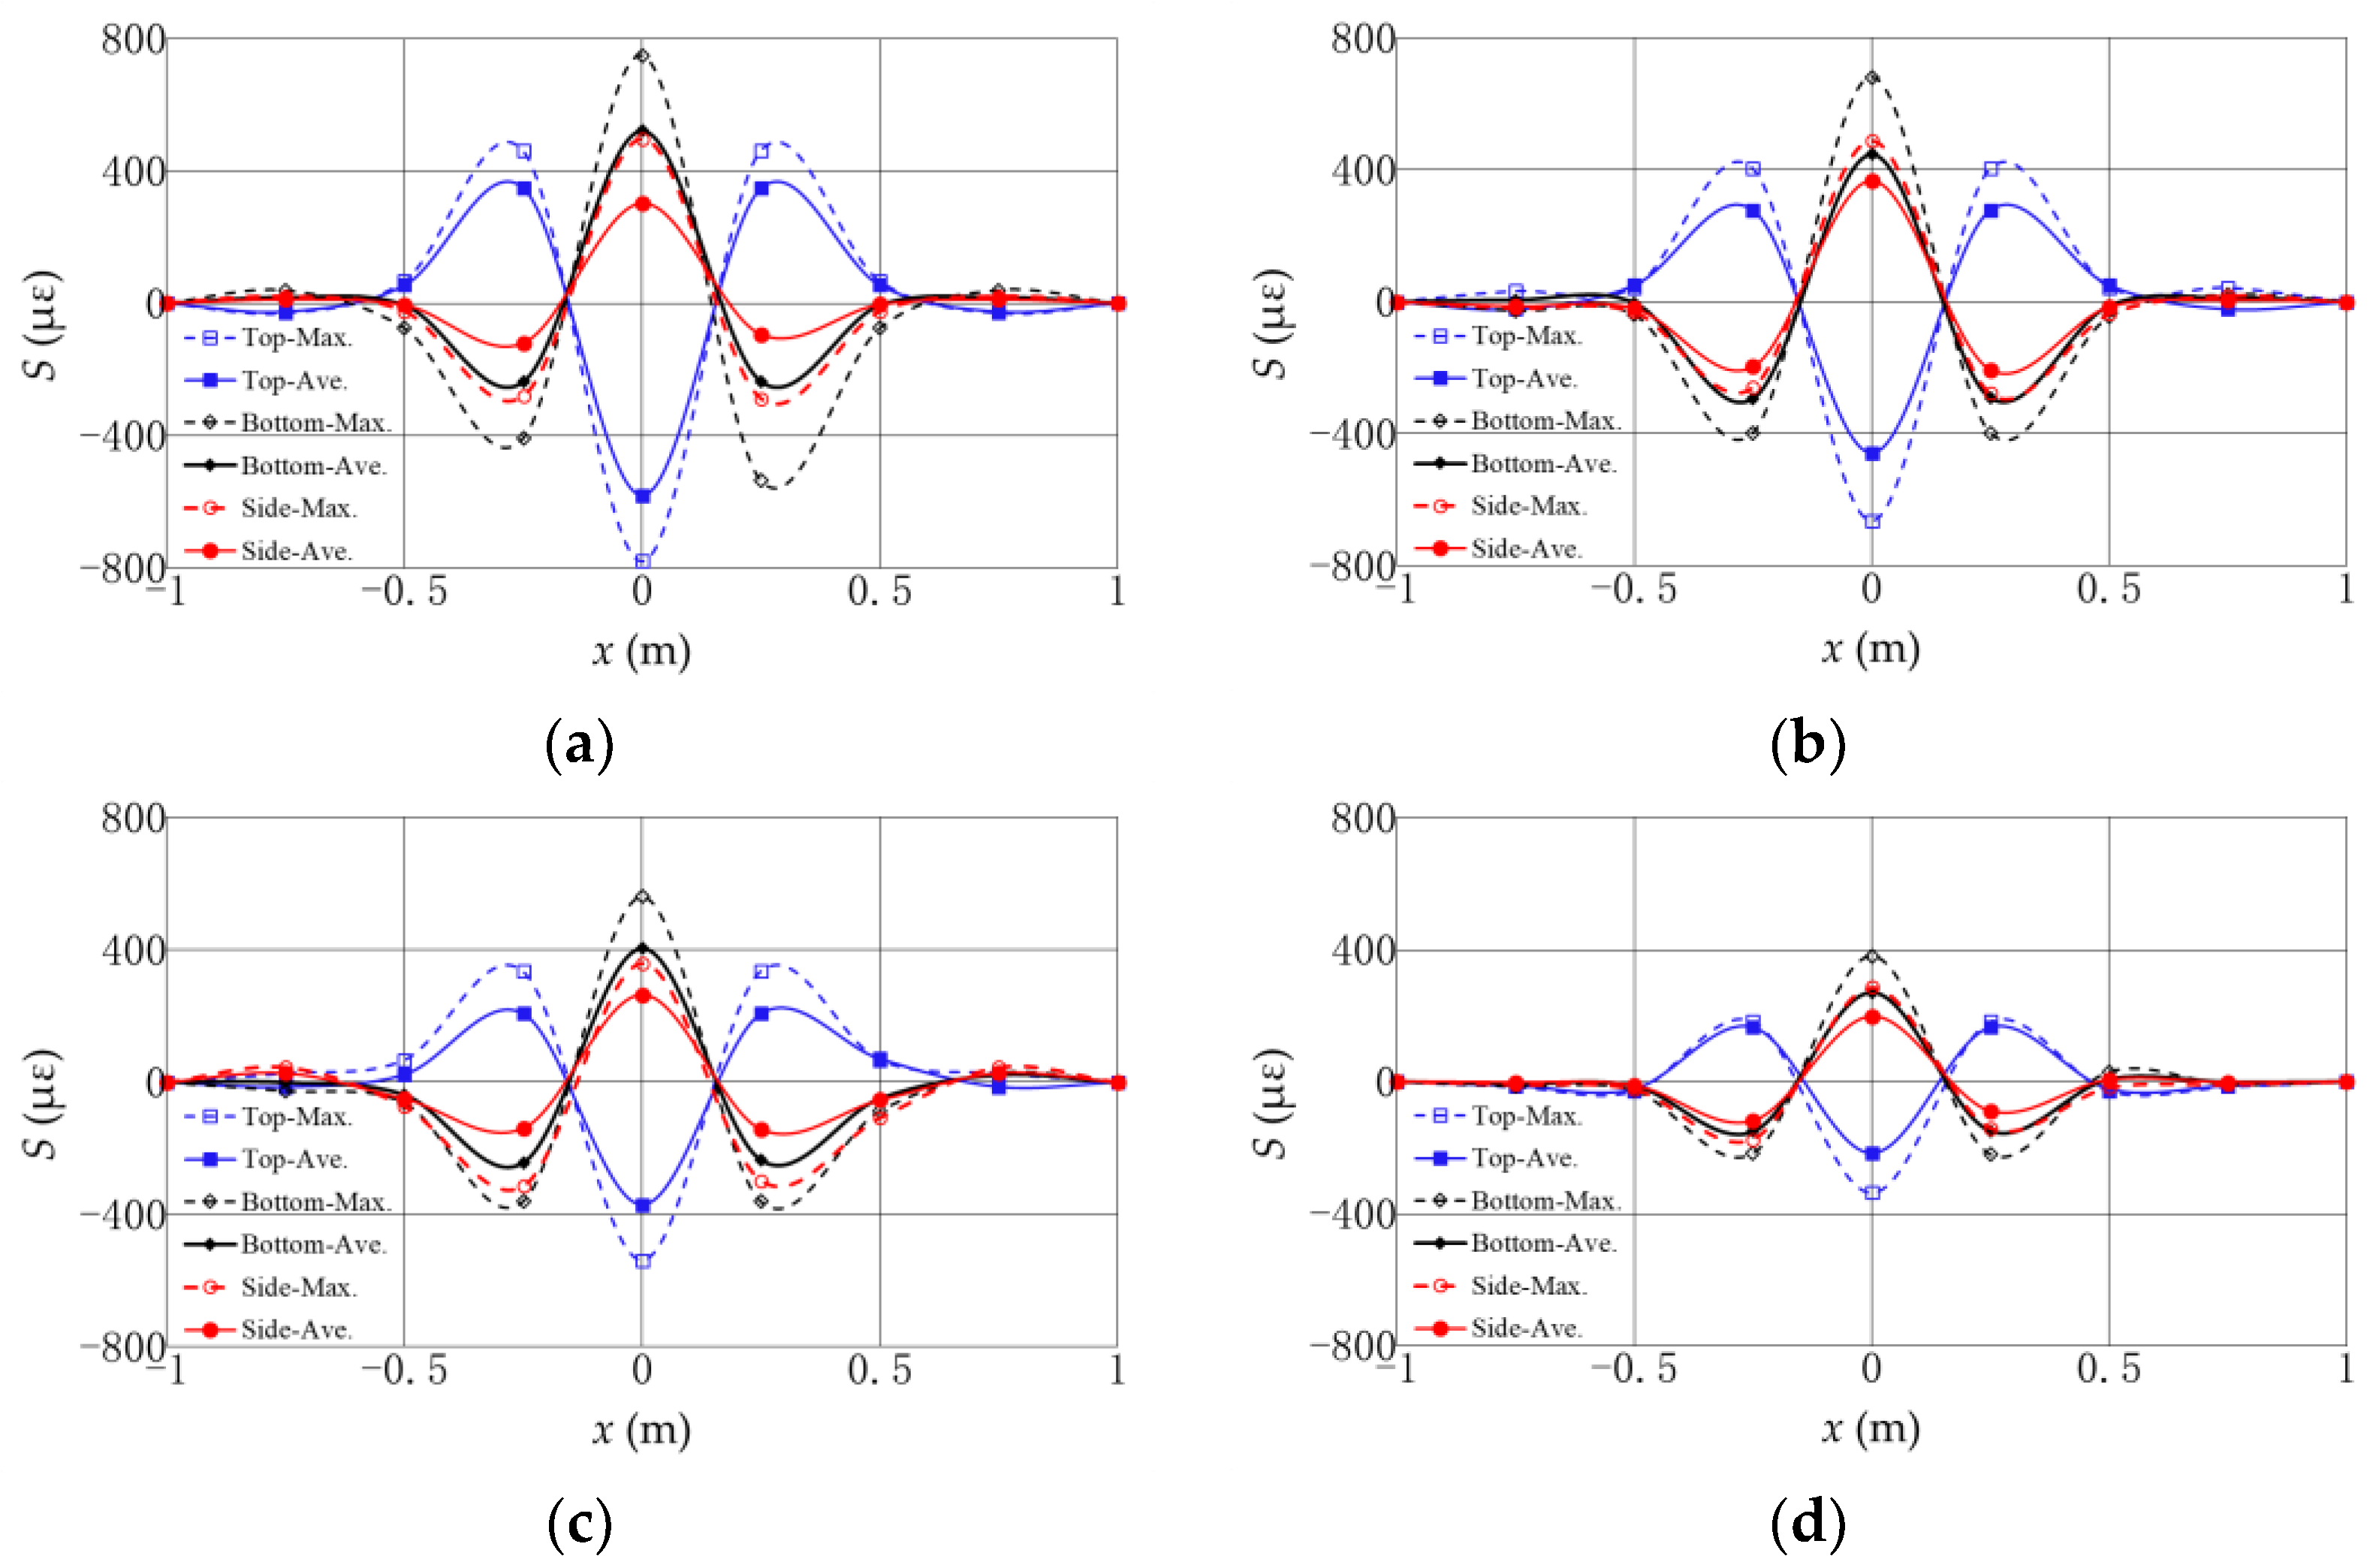
In this study, the impact of a falling anchor on a buried submarine pipeline is physically modelled and the strain responses of the pipeline are monitored with a series of fiber Bragg grating (FBG) sensors. Four protective methods on the pipeline, including pure rock, concrete mattress + rock, concrete mattress + rubber pad + rock layer, and compound flexible pad + rock, are tested. In the test, the anchor dropped from a certain height and attacks on the middle point of the pipeline. The peak value and the distribution of the impact along the pipelines are analyzed. The experimental results indicate that the maximum strain on the pipeline is located at the falling point, and then decreases along the axis of the pipeline to two sides. The affected length of the falling anchor on the pipeline can be up to 30~40 times that of the pipeline diameters. The absolute values of the strain on the upper surface of the pipeline are almost the same to those on the bottom surface, which can be treated as pure bending behavior. The strain on the upper surface at the middle point of the pipeline has the maximum negative value and has positive values on the other points. On contrary, the strain on the bottom surface at the middle point has a positive value and those on the other points on the bottom surface have negative values. This indicates that the bending of the pipeline at the colliding point is downward, while the bending of the pipeline at other points are upward due to support from the surrounding soil. It can be further described with a theoretical model for a pipeline laid on an elastic seabed. By curve-fitting the experimental results, the bearing capacity coefficients for the four protection methods are quantitatively determined as Nr = 99, 138, 169, and 196, respectively.
By comparing the maximum value of the strain on the middle of the pipeline, the effectiveness of the different protective methods is sorted (the first is the best) as follows: compound flexible pad + rock > concrete mattresses + rubber pad + rock layer > concrete mattresses + rock > pure rock. The protection method of the compound flexible pad + rock can provide the best protection with the lowest strain and affected length on the pipeline. It is also noted that the materials of the protective layer, such as the concrete mattresses, rubber pad, and compound flexible pad, cannot entirely satisfy the elastic similarity in model making, which may affect the test results to a certain extent. Therefore, in practical engineering, the influence of this difference on pipeline protection should be considered.

Author Contributions

Conceptualization, Z.Z. and M.Z.; methodology, C.Z., Z.Z. and M.Z.; investigation, C.Z. and Z.Z.; resources, Z.Z. and J.Z.; writing—original draft preparation, C.Z.; writing—review and editing, Z.Z., M.Z. and J.Z.; visualization, C.Z. and Y.C.; supervision, M.Z.; funding acquisition, Z.Z. All authors have read and agreed to the published version of the manuscript.

Funding

This research was funded by National Natural Science Foundation of China (51579232, 5197090657, 51890913).

Institutional Review Board Statement

Not applicable.

Informed Consent Statement

Not applicable.

Data Availability Statement

Data from the present experiment appear in the submitted manuscript.

Conflicts of Interest

The authors declare no conflict of interest.

References

  1. Zhang, Y.; Zhang, C.; Zang, Z.; Xu, Y.; Li, Q.; Xu, Z. Experimental study on performance of different cover layers for protecting a submarine pipeline from a dropped anchor of the article. J. Water. Harbor 2020, 41, 140–147. [Google Scholar]
  2. Sun, C.; Li, X.; Guo, H.; Dong, S. Study on damage of submarine pipeline impacted by dropped objects under different water depths and laying conditions. Ship Build. China 2018, 59, 142–151. [Google Scholar]
  3. Shin, M.B.; Park, D.S.; Seo, Y.K. Response of subsea pipelines to anchor impacts considering pipe–soil–rock interactions. Int. J. Impact Eng. 2020, 143, 103590. [Google Scholar] [CrossRef]
  4. Veritas, D.N. Risk Assessment of Pipeline Protection. In DNVGL-RP-F107; DNV: Bærum, Norway, 2017. [Google Scholar]
  5. Yang, J.; Lu, G.; Yu, T. Experimental study and numerical simulation of pipe-on-pipe impact. Int. J. Impact Eng. 2009, 36, 1259–1268. [Google Scholar] [CrossRef]
  6. Arabzadeh, H.; Zeinoddini, M. Dynamic response of pressurized submarine pipelines subjected to transverse impact loads. Procedia Eng. 2011, 14, 648–655. [Google Scholar] [CrossRef] [Green Version]
  7. Dou, Y.; Liu, Y. Computational investigation of lateral impact behavior of pressurized pipelines and influence of internal pressure. Thin Wall. Struct. 2015, 95, 40–47. [Google Scholar] [CrossRef]
  8. Yu, J.; Zhao, Y.; Li, T.; Yu, Y. A three-dimensional numerical method to study pipeline deformations due to transverse impacts from dropped anchors. Thin Wall. Struct. 2016, 103, 22–32. [Google Scholar] [CrossRef]
  9. Cui, P.; Guo, H.; Huang, Q.; Li, X.; Li, J.; Li, F. Model experimental study on damage of submarine pipeline subjected to falling anchor strike. J. Exp. Mech. 2018, 33, 781–789. [Google Scholar]
  10. Wang, L.; Chia, H.; Wei, J.; Chen, Q. FEA-based study of pipeline protection from anchors. In Proceedings of the ASME 2009 28th International Conference on Ocean, Offshore and Arctic Engineering, American Society of Mechanical Engineers, Honolulu, HA, USA, 31 May–5 June 2009; Volume 3, pp. 859–866. [Google Scholar]
  11. Ma, K.; Liu, Z.; Li, Q.; Qi, X.; Li, X. Study on rock armor protection design method of subsea pipeline in shipping lanes. Ship Build. China 2012, 53, 132–135. [Google Scholar]
  12. Qiu, C.; Wang, J.; Yan, S. Coupled DEM-FEM analysis of submarine pipelines with rock armor berm under impact load. Chin. J. Geotech. Eng. 2015, 37, 2088–2093. [Google Scholar]
  13. Li, Q.; Luo, M.; Shi, Z. Dynamic response behaviors of buried line pipes subjected to the impact of spherical falling objects. Nat. Gas Ind. 2021, 41, 138–145. [Google Scholar]
  14. Xing, J.; Liu, C.; Duan, M. Analyses on deformation and stress of an exposing pipeline on an elastic seabed. In Proceedings of the 12th Chinese Coastal Engineering Symposium, Kunming, China, 16–19 October 2005; pp. 647–653. [Google Scholar]
Figure 1. A sketch of different protection methods for the pipeline: (a) pure rock (P1); (b) concrete mattress + rock (P2); (c) concrete mattress + rubber pad+ rock (P3); and (d) compound flexible pad + rock (P4).
Jmse 10 01159 g001
Figure 2. A sketch of the experimental setup.
Jmse 10 01159 g002
Figure 3. Photos of different protection methods: (a) pure rock layer (P1); (b) concrete mattresses + rock layer (P2); (c) concrete mattresses + rubber pad + rock layer (P3); and (d) compound flexible pad + rock layer.
Jmse 10 01159 g003
Figure 4. Experimental results of the strain on the pipeline with rock (P1): (a) space distribution of train; (b) time histories of strain.
Jmse 10 01159 g004
Figure 5. Probability density of the measured data for: (a) maximum strain; (b) impact duration.
Jmse 10 01159 g005
Figure 6. The distribution of strains along the pipeline for 1.5 m falling height: (a) P1, (b) P2, (c) P3, and (d) P4.
Jmse 10 01159 g006
Figure 7. The distribution of strains along the pipeline for 1.0 m falling height: (a) P1, (b) P2, (c) P3, and (d) P4.
Jmse 10 01159 g007
Figure 8. Comparisons of the effectiveness of four protection methods for falling height of 1.5 m: (a) strain on the pipeline, Ave.—averaged value, Max.—maximum value, Rms.—root-mean-square value; (b) affected length of impact.
Jmse 10 01159 g008
Figure 9. Comparisons of the effectiveness of four protection methods for falling height of 1.0 m: (a) strain on the pipeline, Ave.—averaged value, Max.—maximum value, Rms.—root-mean-square value; (b) affected length of impact.
Jmse 10 01159 g009
Figure 10. A theoretical model for a pipeline laid on a seabed exposed to the impact of a falling anchor.
Jmse 10 01159 g010
Figure 11. Comparisons between the measured and theoretical results of strain on the pipeline: (a) P1; (b) P2; (c) P3; and (d) P4.
Jmse 10 01159 g011
Figure 12. Calculated deflections of the pipeline exposed to the impact of a falling anchor for different protection methods.
Jmse 10 01159 g012
Table 1. The main parameters to evaluate the effectiveness of protective methods.
MethodsSm1ε)Sp 2ε)Ymax3 (m)KdNr
P1−581−5840.0882199
P2−458−4450.06816138
P3−370−3610.05513169
P4−216−2310.0348196
1 Sm is the maximum measured strain value at the middle of the pipeline. 2 Sp is the maximum predicted strain value at the middle of the pipeline. 3 Ymax is the maximum predicted deflection at the middle of the pipeline.
Publisher’s Note: MDPI stays neutral with regard to jurisdictional claims in published maps and institutional affiliations.

