
Evaluating the Costs of Decarbonizing the Shipping Industry: A Review of the Literature


1
School of Business, Economics and Law, University of Gothenburg, P.O. Box 610, SE-405 30 Gothenburg, Sweden
2
Department of Management, College of Transport & Communications, Shanghai Maritime University, Shanghai 201306, China
*
Author to whom correspondence should be addressed.
J. Mar. Sci. Eng. 2022, 10(7), 946; https://doi.org/10.3390/jmse10070946
Submission received: 15 June 2022
/
Revised: 28 June 2022
/
Accepted: 29 June 2022
/
Published: 9 July 2022
(This article belongs to the Special Issue Environmental Footprint of Shipping—Characteristics and Mitigation Strategies)
Abstract
:The decarbonization of the shipping industry has risen to a new level of significance on the agendas of policy makers and strategic decision makers. This paper focuses on the likely cost implications for the shipping industry of recently implemented, and future planned policies that seek to reduce the carbon footprint of the sector. The scale of the problem is presented through a summary review of the International Maritime Organization’s fourth greenhouse gas study of 2020. The regulatory context, which is emerging as a response to overcoming this challenge, is analyzed at both the global and EU level. The potential cost implications for the future, in terms of this new regulatory context, are then analyzed on the basis of a review of academic and industry sources. Our paper concludes that alternative, zero-carbon fuels are the best way forward, but that operational and technological innovations will not be sufficient to bring about the complete decarbonization of the industry within the foreseeable future. Thus, market-based measures are required. Finally, the options available, and the likely implications of each of these options, is addressed, suggesting that there will be both winners and losers in the race to decarbonize the shipping industry.
1. Introduction
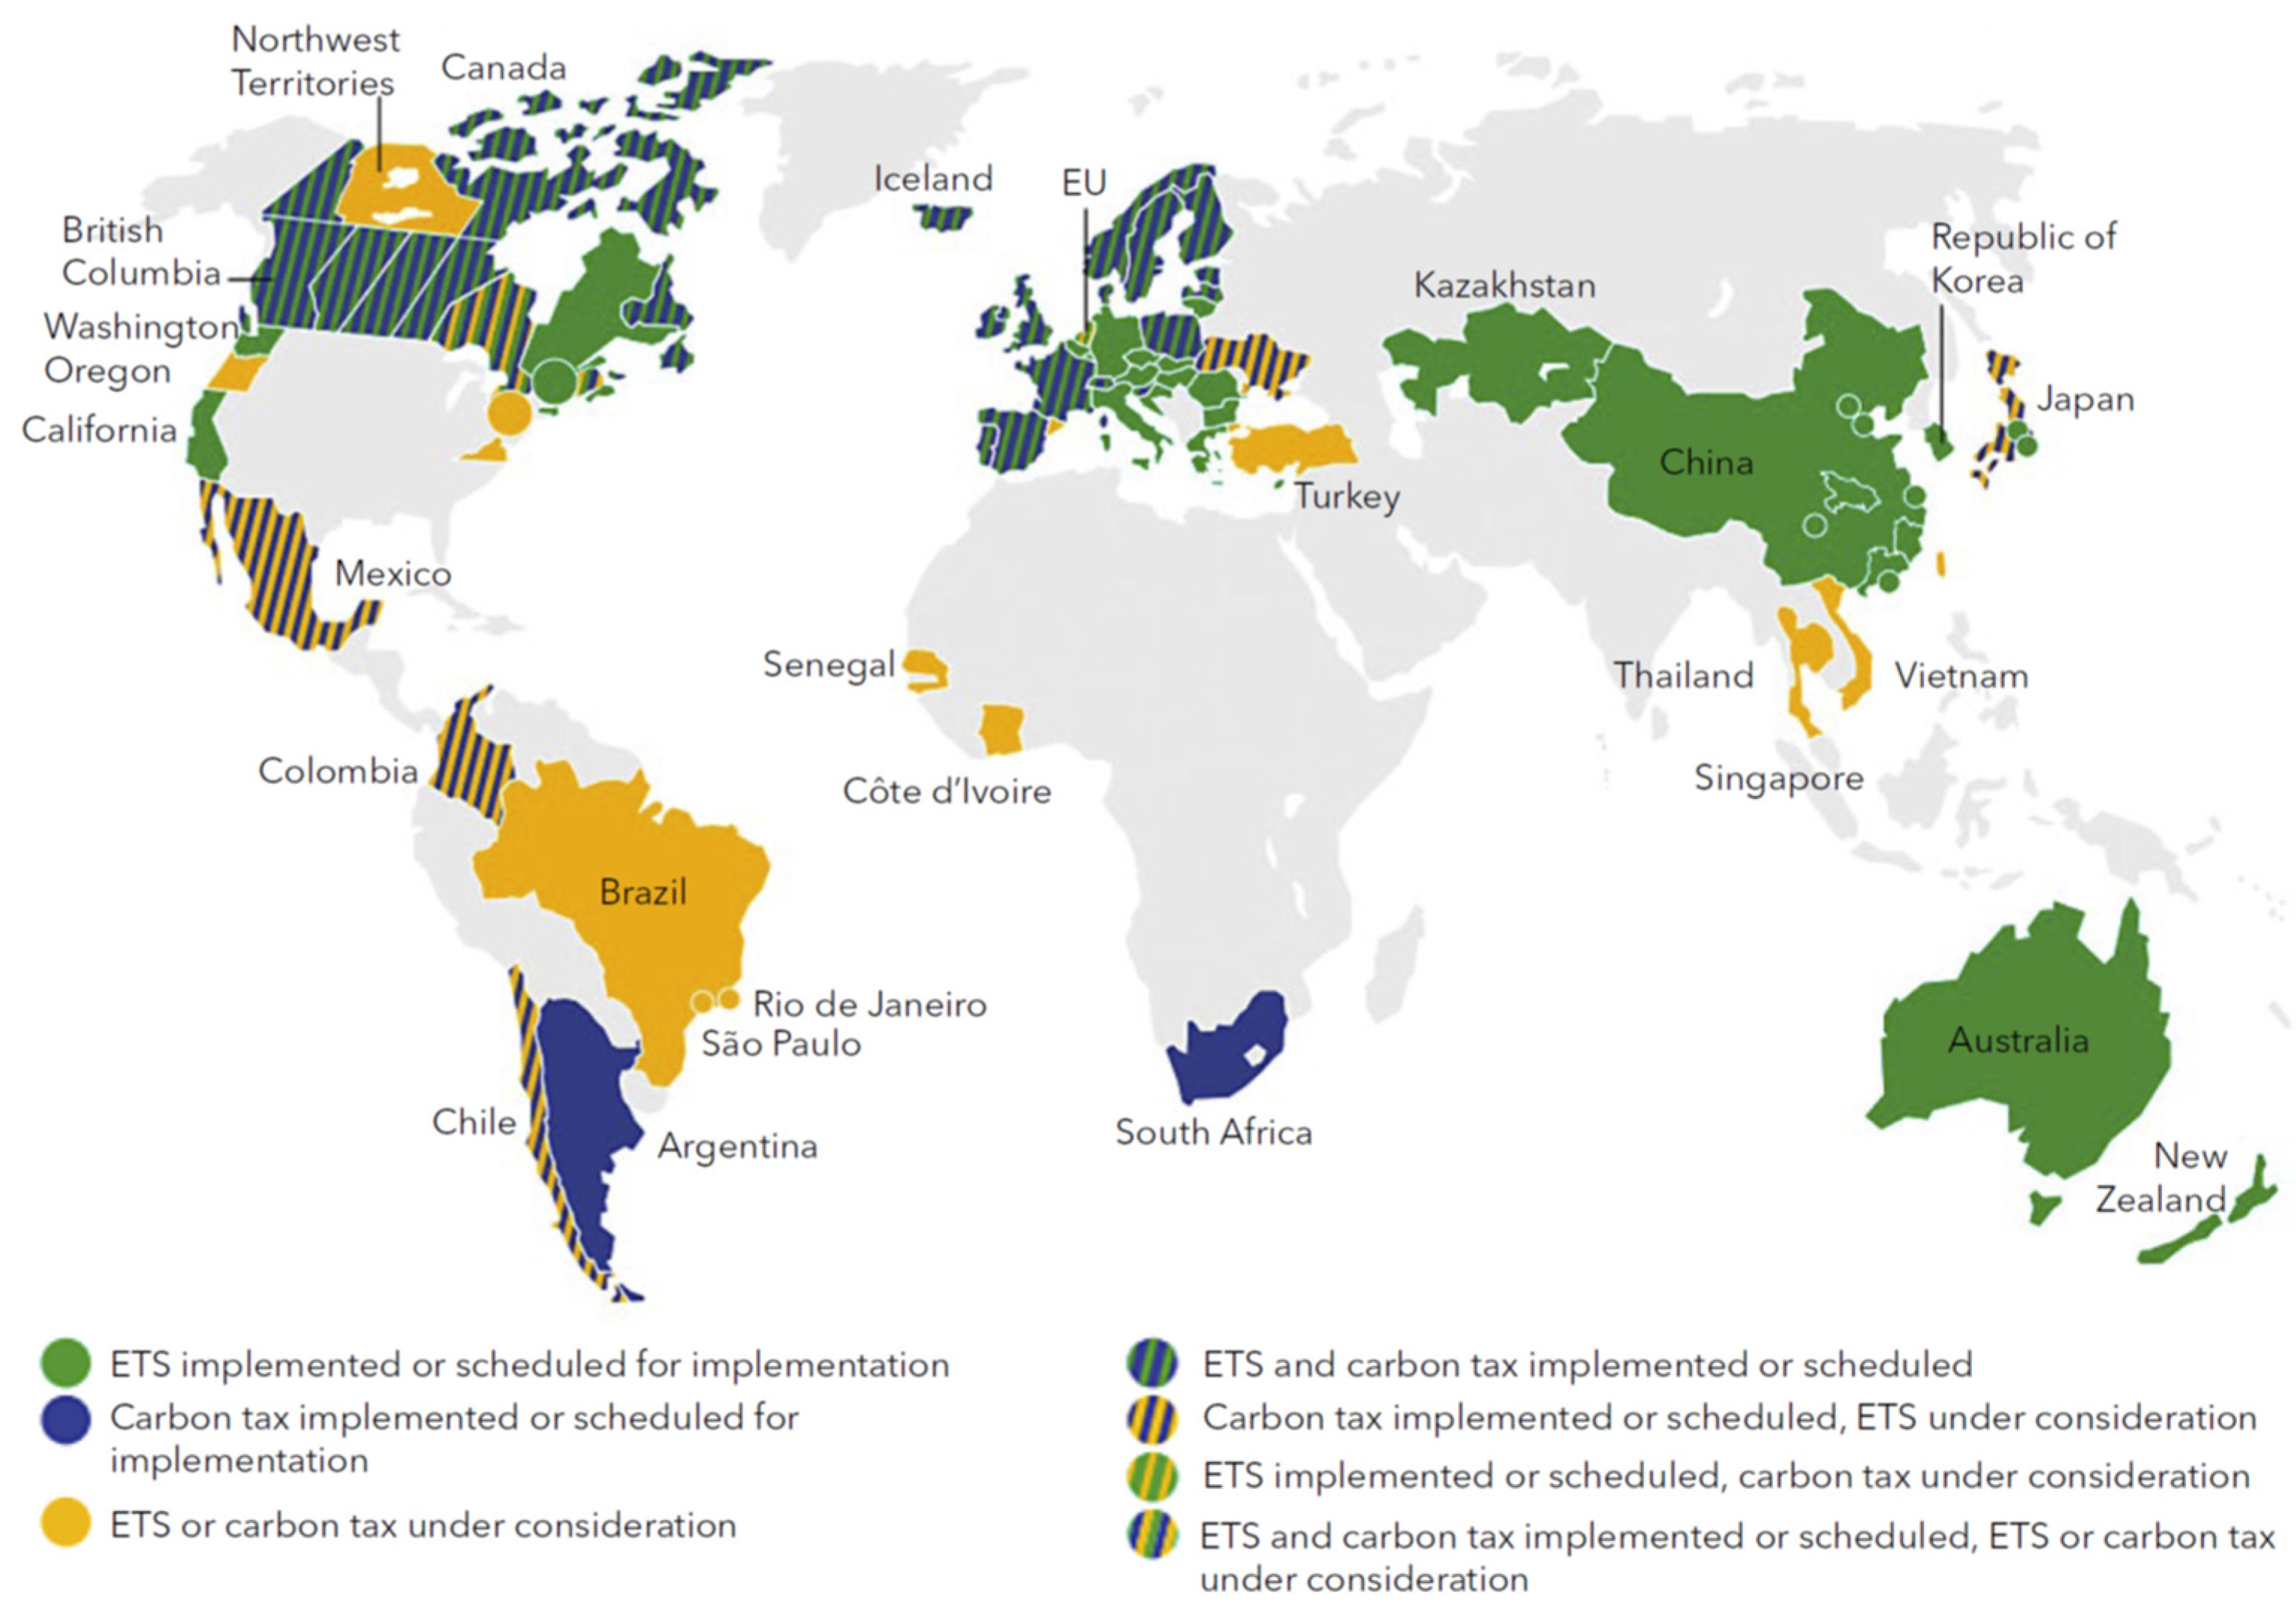
The carbon emission of the shipping industry is an issue that has risen to prominence in the past few years, most particularly since the imposition of the IMO’s global cap on the sulfur emissions from ships in January 2020, which is perceived as having resolved that particularly pressing challenge [1]. Because of its international nature, and the difficulties involved in measuring its emissions and attributing them to nations, shipping has typically been deliberately excluded from many of the measures and targets that have been implemented at the global level, such as those that were imposed on nations under the Kyoto and Paris agreements. Equally, at the regional level, it is only within the past 2–3 years that the EU has taken serious action in preparation for the inclusion of shipping within the EU Emissions Trading System (ETS), and is now on the verge of doing so. Notably, in China and parts of North America, the shipping sector has already been included in emissions trading schemes, where the focus now is very much the reduction of the sector’s carbon emissions. As can be seen in Figure 1, the impact of carbon pricing on the shipping industry is proliferating worldwide.
The IMO Fourth GHG Study [3] is the definitive source for the latest estimates of the current carbon footprint of the shipping industry, and for predictions of its future potential. Total GHG emissions (including carbon dioxide (CO2), methane (CH4), and nitrous oxide (N2O), expressed in CO2e, for the whole maritime sector (international, domestic, and fishing) have increased from 977 million tonnes in 2012 to 1076 million tonnes in 2018 (a 9.6% increase). Of these headline figures1, 962 million tonnes were CO2 emissions in 2012, while in 2018, this amount increased by 9.3% to 1056 million tonnes of CO2 emissions. As a consequence of these figures, the share of shipping emissions in global anthropogenic GHG emissions has increased from 2.76% in 2012 to 2.89% in 2018.
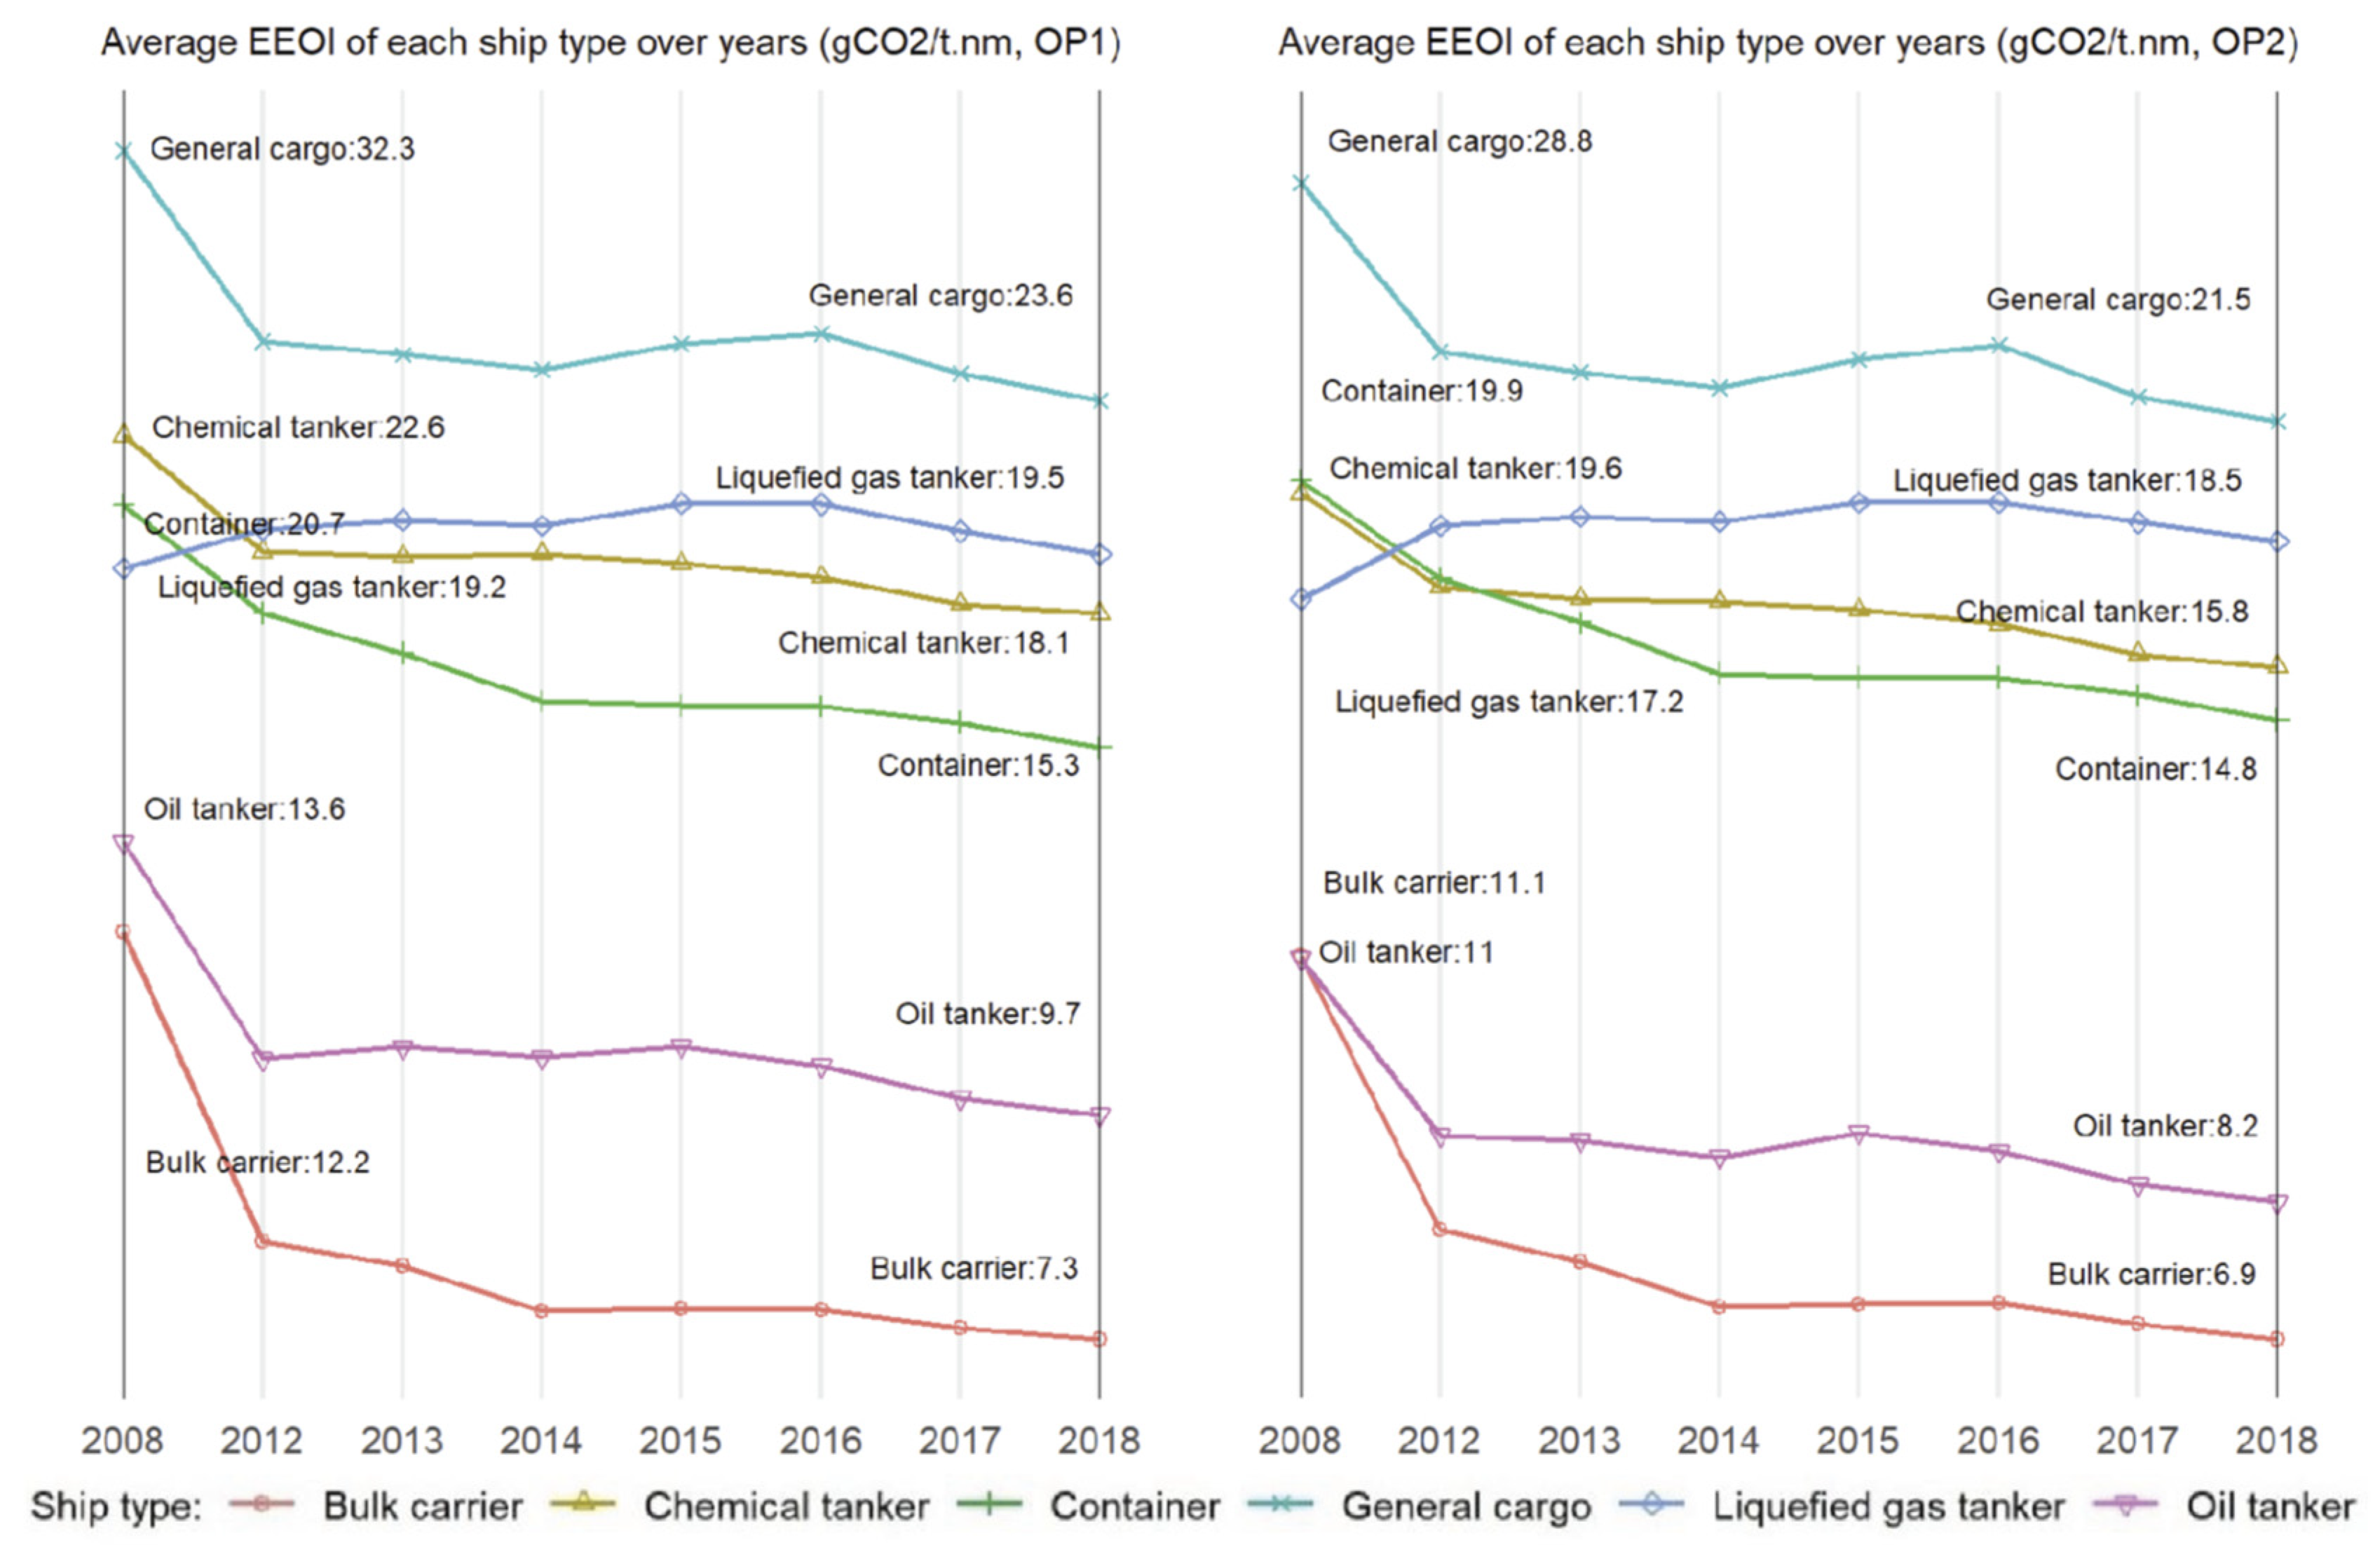
Depending upon the specific estimation method utilized, the IMO Fourth GHG Study [3] found that the overall carbon intensity of the industry was 21–22% better in 2018 than in 2008, as measured by the AER (Annual Efficiency Ratio, in grams CO2/Dwt/nm) and 29–32% better over the same period, as measured by the EEOI (Energy Efficiency Operational Indicator, in grams CO2/tonnes of cargo/nm). However, these improvements have not followed a linear trend over the period of analysis, with more than 50% of the improvements occurring before 2012, and only very small improvements (averaging 1–2% per annum) accruing since 2015. As can be seen in Figure 2, over the decade 2008–2018, the annual carbon intensity performance of all individual ship types also generally improved, although it fluctuated, with the upper and lower quartiles of the fluctuation rates in the EEOI of oil tankers, bulk carriers, and container ships standing at ±20%, ±15%, and ±10%, respectively.
As well as reviewing the historical development of the shipping industry’s GHG emissions generally, and its CO2 emissions more specifically, the IMO Fourth GHG Study [3] developed a range of forecast scenarios of shipping’s CO2 emissions for a time horizon of 2050. The conceptual algorithm, which is applied for developing these forecast scenarios, can be summarized as follows:
- Forecasting future volumes of maritime transport work carrying ‘non-energy products’, based on incorporating third-party, long-term strategic forecasts of GDP and population into an estimated model of the historical relationship between these variables and the variable of interest. Both logistics regression and the gravity model are applied as the basis for estimating this model, with the former yielding generally higher forecasted growth rate values (75–100%) than the latter (40–60%).
- Forecasting future volumes of maritime transport work carrying ‘energy products’, based on the IPCC’s formal projections of the evolution of energy production and consumption, particularly for energy products such as coal, oil, and gas, that are primarily carried by ships.
- Developing a detailed inventory of the shipping fleet and its activities for the base year of 2018, and projecting this into the future to develop future fleet compositions.
- Forecasting the future energy efficiency of the ships, taking into account regulatory developments and market-driven efficiency changes using a marginal abatement cost curve (MACC).
- On the basis of the foregoing, to develop estimates of future shipping emissions.
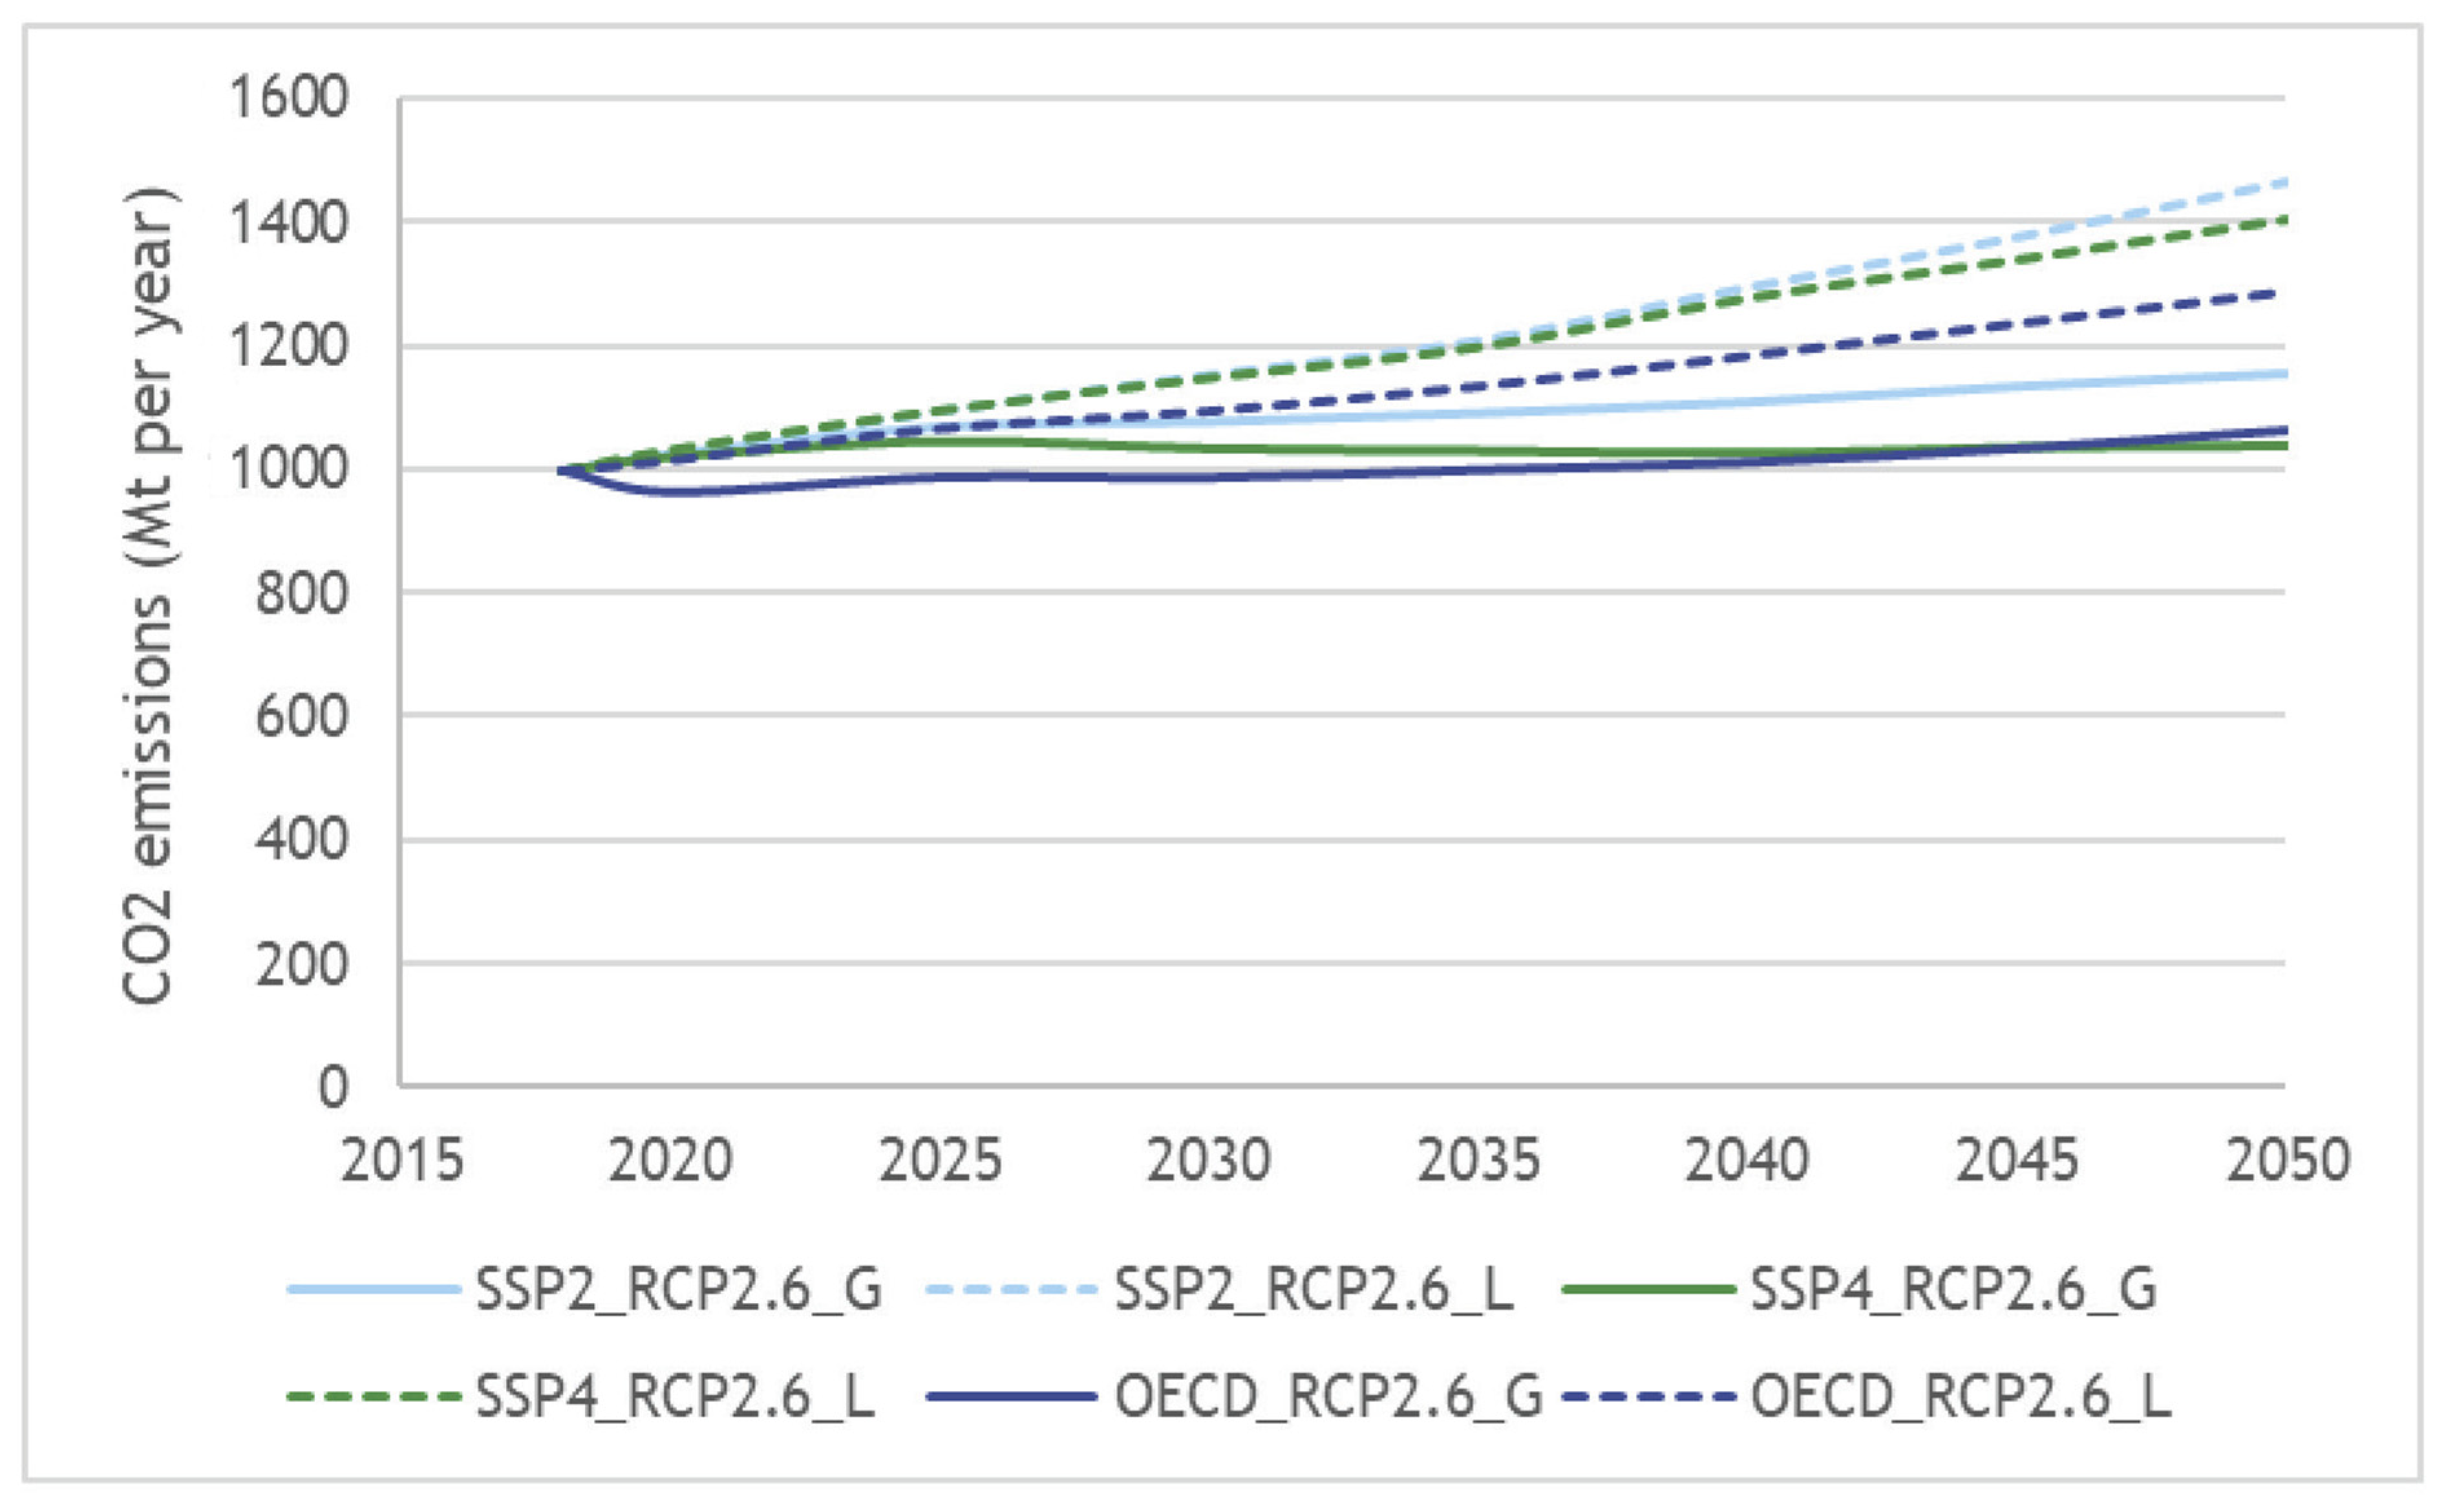
A range of scenarios for both the socioeconomic (GDP and population) and energy-related input variables are developed to estimate, firstly, the impact on transport work, and, ultimately, to forecast shipping emissions. In scenarios with ‘middle of the road’ aggregate economic growth (corresponding to OECD baseline projections) and energy demand from land-based sectors that limits the global temperature increase to well below 2 °C by 2050, aggregate maritime transport work increases by between 40% and 100% by 2050 compared to 2018. As depicted in Figure 3, on the basis of ‘Business as Usual (BAU)’ forecasts2 of shipping’s CO2 emissions, this ultimately translates to an increase from 1000 Mt CO2 in 2018 to 1000 to 1500 Mt CO2 in 2050, representing an increase of 0 to 50% over 2018 levels, and 90–130% above 2008 levels. The different BAU emissions forecast trajectories are ultimately caused by differences in the forecast values for transport work that, in turn, are caused by different socioeconomic assumptions and projections, as well as the use of two different methods for establishing the relationship between transport work and independent variables such as GDP, population, and primary energy demand. Obviously, therefore, shipping’s CO2 emissions could be higher (lower) than these forecast values, if economic growth rates prove to be higher (lower) than what has been assumed, or when the reduction in GHG emissions from land-based sectors is less (more) than assumed.
Notes: (1) The scenarios ‘SSP2 (Middle of the Road)’ (see [4]) and ‘SSP4 (Inequality—A Road Divided)’ (see [5]) refer to the framework of Shared Socioeconomic Pathways [6]; (2) (1) The scenario ‘RCP2.6′ (2 °C, very low GHG emissions) refers to the framework of Representative Concentration Pathways [7,8]; (3) The letters ‘L’ (logistics regression) and ‘G’ (gravity model) refer to the method of estimation used for establishing the relationship between transport work and the socioeconomic input variables.
Irrespective of the rigor applied in their development, the BAU forecasts produced within the IMO Fourth GHG Study [3] do not take account of either potential future technological innovations or of any future regulation that might have a positive impact on the carbon footprint of the shipping industry. Indeed, in his foreword to the IMO Fourth GHG Study, Mr. Kitack Lim (the Secretary-General of the IMO) concludes that shipping will certainly continue to improve its carbon intensity, but that energy-saving technologies and reducing the speed of ships will not be sufficient to deliver the objectives that have been set for the industry. He explicitly suggests, therefore, that under all projected scenarios, in 2050, the use of low-carbon alternative fuels will need to make a significant contribution to the total amount of CO2 reductions required. In order to facilitate this, appropriate regulatory and policy actions will be required.
2. The Regulatory Context for Decarbonizing Shipping
2.1. Global Level
As the international regulatory authority for the shipping industry, the IMO first turned its attention to the decarbonization of the shipping industry in 2011. The first actions implemented were the introduction of the Energy Efficiency Design Index (EEDI) for new ships and the Ship Energy Efficiency Management Plan (SEEMP) for all ships, which both came into force on 1 January 2013.
The EEDI for a given ship is calculated on the basis of a formula that encompasses numerous technical design parameters. The formula yields a specific figure for an individual ship design, expressed in grams of carbon dioxide (CO2) per ship’s capacity mile (e.g., tonne mile, TEU mile, etc.). The smaller the EEDI, the more energy efficient is the design of the ship in question. Ship types responsible for approximately 85% of the CO2 emissions from international shipping are now accounted for under the EEDI regulatory regime, whereby a minimum level of energy efficiency per capacity mile (i.e., a minimum level of the EEDI) is mandated for different ship types and sizes, with all relevant newbuilds having to conform with the set reference level. This reference level for the EEDI of specific ship type/size combinations is tightened incrementally every five years, in the expectation that this will prompt technological innovation early in the design process to improve fuel efficiency. The CO2 reduction level for the first phase of the EEDI (beginning in 2015) was set to 10%, as calculated from a reference line representing the average efficiency for ships built between 2000 and 2010. This was increased within a range up to a 20% required reduction level (depending upon ship type and size) at the start of EEDI Phase 2 in 2020. It is planned that EEDI Phase 3 will start in 2025, with the required CO2 reduction level set at up to 30% (depending on ship type and size) for all newbuilds. However, an earlier start date for Phase 3 implementation of these required CO2 reduction levels has now come into force, in 2022, for gas carriers, general cargo ships and LNG carriers. In addition, the Phase 3 levels for containerships have also recently come into force, in 2022, but with required CO2 reduction levels within the range of 30–50%, depending on ship size.
The Ship Energy Efficiency Management Plan (SEEMP) is intended to provide an instrument to improve the energy efficiency of a new or existing ship in a cost-effective manner. Each stage of the SEEMP prompts ship owners and operators to consider new technologies and practices when seeking to optimize the performance of a ship. The SEEMP incorporates best practice guidelines for fuel-efficient ship operation, and facilitates the management of both individual ship and fleet efficiency performance over time. This is achieved through the voluntary use of a monitoring tool, the Energy Efficiency Operational Indicator (EEOI), which enables ship operators to measure the fuel efficiency of a ship in operation, and to gauge the effect of any changes in operation.
Recognizing the need for better information on the fuel efficiency of ships, the IMO adopted a mandatory MARPOL Annex VI requirement in 2016 for ships of over 5000 GT to record and report their fuel oil consumption. In order to expedite this new requirement for the reporting of data on fuel consumption and CO2 emissions specifically, an amendment was also implemented, such that the SEEMP must now include a description of the methodology for the data collection system (DCS), and for reporting the collected data to the ship’s flag state. This new requirement came into operation in 2019, and was obviously pivotal to the IMO setting any strategic objectives for the reduction of GHG emissions from shipping.
The IMO adopted the ’Initial Strategy on the Reduction of GHG Emissions from Ships’ in 2018; this sets ambitions and objectives for GHG reduction as follows:
- To reduce the carbon intensity of individual ships through the implementation of further phases of the Energy Efficiency Design Index (EEDI) for new ships.
- To reduce the carbon intensity of international shipping (compared to a baseline of 2008), such that CO2 emissions per unit of transport work, as an average across the industry, are reduced by ‘at least’ 40% by 2030, and by ‘towards’ 70% by 2050.
- GHG emissions from international shipping to peak and decline as soon as possible, and to reduce the total annual GHG emissions by at least 50% by 2050 compared to 2008, whilst pursuing efforts towards phasing them out completely.
The development of this initial strategy was founded on the normal guiding principles that underpin the setting of regulations and policy within the IMO, such as the principle of ‘non-discrimination’ and the principle of ‘no more favorable treatment’ (enshrined within MARPOL and other IMO conventions), and the principle of ‘common but differentiated responsibilities and respective capabilities’, in light of different national circumstances (enshrined within the UNFCCC and its Kyoto Protocol, and the Paris Agreement). The IMO’s ‘Initial Strategy’ explicitly recognizes that technological innovation and the global introduction of alternative fuels and/or energy sources for international shipping will be integral to achieving the targets set.
In 2021, the IMO adopted new mandatory measures that will require all ships to calculate their Energy Efficiency Existing Ship Index (EEXI) based on a number of operational parameters, as well as technical parameters that are similar to those of the previously established EEDI for new ships. This requirement comes into force in November 2022, as part of a ship’s annual survey. The EEXI will then be utilized to establish a ship’s annual operational Carbon Intensity Indicator (CII) and associated CII rating. The CII links a ship’s GHG emissions to the amount of cargo carried over distance traveled, and comes into effect on 1 January 2023. Under the provisions of this regulation, ships will receive a rating of their energy efficiency (A, B, C, D, E—where A is the highest). A ship rated D, for three consecutive years, or E is required to submit a corrective action plan, to show how the required index (C or above) could be achieved. In establishing these new regulations, the IMO encouraged maritime administrations, port authorities, and other stakeholders as appropriate, to provide incentives to ships rated as A or B in order to ‘send out a strong signal’ to the market and financial sector.
Into the future, the IMO will continue its work towards achieving the objectives set in its ‘Initial Strategy’. In so doing, it has established workplans and a timetable for the consideration of candidate short-term and medium-term measures. Most critically, however, its ‘Initial Strategy’ is due for review in 2023. What emerges from that review will set the global regulatory context for the shipping industry until at least 2030, when the first substantive objective for shipping’s CO2 emissions has been set to be achieved.
2.2. EU Level
Along with the global initiatives undertaken by the IMO, specific regulatory legislation for the maritime sector has also been included in the EU’s ‘Fit for 55’ package that was published in June 2021, and seeks to achieve the ‘European Green Deal’ target for climate neutrality in Europe by 2050, and for a 55% reduction in the EU’s GHG emissions by 2030 [9,10]
CO2 emissions from shipping account for around a quarter of all EU transportation-related emissions. The EU’s ‘Fit for 55’ package proposes the adoption of various regulatory policies, among which is the inclusion of shipping in the EU Emissions Trading System (EU ETS) and the adoption of the FuelEU Maritime Directive that sets specific GHG intensity limits on the energy used on board ships, starting from the year 2025 [11].
2.2.1. The EU Emissions Trading System (ETS)
Discussions on the possibility of introducing market-based measures (MBMs) for the control of GHG emissions from shipping (including the idea of a global emissions trading scheme) started within the IMO as long ago as 2010. However, in May 2013, the IMO MEPC agreed to suspend discussions on MBMs and related issues to a future session. An Emissions Trading System (ETS) can be categorized as either global or regional according to its geographical scope. A global ETS has advantages over a regional ETS in the sense that it avoids carbon leakage [12] and pollution transfer [13]. More importantly, shipping networks may change. For example, Wang et al. [14] suggest that a global ETS would mean that the role of Singapore in the global shipping market may partially be replaced by Dubai.
No further discussions took place in the IMO until, in February 2017, the EU Parliament voted in favor of including shipping in the EU ETS as of 2023, unless the IMO creates a comparable scheme of its own by 2021. Since nothing has happened at the global level, in 2020, the EU Green Deal committed to bringing shipping within the EU Emissions Trading Scheme (ETS). This has now been reaffirmed within the EU’s ‘Fit for 55’ package [11].
The EU Emissions Trading System (ETS) began operation in 2005; however, a new, revised version has now been proposed, which includes extending its remit to include the shipping industry, so that shipping companies will have to purchase allowances to cover the cost of the CO2 emissions they produce. The EU ETS is a market-based decarbonization measure that functions according to a ‘polluter pays’ principle, which means that the costs involved in the purchasing of allowances to emit are ultimately defined by the market price for carbon emissions—i.e., by the interaction between the demand for, and supply of, allowances.
Applicable only to ships of 5000 GT and above, a ship traveling strictly within the EU will pay for all of the carbon dioxide it emits, whereas a ship that crosses into or out of the EU will pay for 50% of the carbon dioxide it emits (regardless of how much of that voyage lies inside or outside the EU). In addition, all emissions from port stays at EU ports are included. The ‘polluter pays’ principle means that, for any ship, the entity responsible for presenting the relevant ETS allowances will be the shipping company, the ship owner, or whoever operates the ship. However, since the shipping company or operator is not always responsible for purchasing fuel or making operational decisions regarding the cargo carried, speed, or route of the vessel, the EU has proposed that a binding clause should be included into charterparty agreements, so that the costs of emissions can be passed to the charterers. The relevance of this provision is evidenced in [15], who analyzed data on the Panamax shipping market over the period 2007–2012, and found that, on average, only 40% of energy efficiency savings were accrued to the ship owners that had implemented operational measures and technical measures.
A gradual phase-in of the new system is planned, so that stakeholders in the industry can adjust to it over time. Shipping companies will have to record their emissions correctly starting from 2023, so that they can become familiar with the system; however, at this time, companies will only be required to hand over a proportion of their reported emissions. This proportion will grow each year, with the system planned to be fully in place by 2025. The requirement is that shipping companies must purchase and surrender allowances over a four-year period, as follows:
- (a)
- 20% of verified emissions reported for 2023;
- (b)
- 45% of verified emissions reported for 2024;
- (c)
- 70% of verified emissions reported for 2025;
- (d)
- 100% of verified emissions reported for 2026, and each year thereafter.
There are no current plans for any allocation of free allowances to the industry, an aspect that aligns with the plan to remove all free allowances from the EU ETS by 2027. Although it has been recognized that the maritime sector will have access to the funds that accumulate centrally within the EU’s Innovation Fund, there has been no indication that the contributions of the maritime industry will be earmarked for distribution back to the industry. At the same time, the EU is prepared to adjust the scope of the ETS to align with any global market-based measures that may be developed by the IMO. To this end, the scope of the ETS can either be extended to cover 100% of the voyages to and from EU ports if the IMO measures are seen as insufficient for reaching Paris Agreement goals, or reduced to avoid a double burden.
2.2.2. The FuelEU Maritime Directive
This section is based on content derived from [16].
The FuelEU Maritime Directive forms part of the EU ‘Fit for 55’ package and, in an attempt to address the urgent need of eliminating the CO2 emissions of shipping, sets specific GHG intensity limits on the energy used on board ships starting from the year 2025. These energy intensity limits are calculated as the amount of GHG emissions per unit of energy. Each ship operating within the EEA will need to proceed with the employment of alternative fuels or energy sources in order to not exceed the GHG intensity limit, which will become tighter over the years; reaching reductions of 75% of energy used in 2050 compared to 2020, the baseline year for the implementation of the Directive.
More specifically, although certain vessel categories are excluded from the provisions of the Directive (e.g., warships, naval auxiliaries, fishing vessels, etc.), the FuelEU Maritime Directive applies to all ships above a gross tonnage of 5000 GT, regardless of their flag. The Directive includes “(a) the energy used during their stay within a port of call under the jurisdiction of a Member State, (b) 100% of the energy used on voyages from a port of call under the jurisdiction of a Member State to a port of call under the jurisdiction of a Member State, and (c) 50% of the energy used on voyages departing from or arriving to a port of call under the jurisdiction of a Member State, where the last or the next port of call is under the jurisdiction of a third country” (European Commission, 2021). This approach to what voyages are included mirrors that taken for the proposed inclusion of shipping in the EU ETS [17].
In accordance with the FuelEU Maritime Directive, as mentioned above, each ship will need to proceed with the employment of alternative fuels or energy sources in order to not exceed the GHG intensity limit, which will become tighter over the years, reaching reductions of 75% of energy used in 2050 compared to 2020. Additionally, from 2030, ships staying at EU ports should connect to a shore-based electricity supply. Article 4 of the Directive sets the specific GHG intensity limits of energy used on board a ship during a reporting period that should not be exceeded, which is calculated by reducing the reference value (X grams of CO2 equivalent per MJ) by the following percentages:
- -
- −2% from 1 January 2025;
- -
- −6% from 1 January 2030;
- -
- −13% from 1 January 2035;
- -
- −26% from 1 January 2040;
- -
- −59% from 1 January 2045;
- -
- −75% from 1 January 2050.
The reference value for the calculation of the energy intensity used on board a ship corresponds to the fleet average GHG intensity of the energy used on board ships in 2020, as determined on the basis of data monitored and reported within the framework of the EU MRV Regulation 2015/757. This regulation was an imperative precursor for the abatement of maritime CO2 emissions in Europe, as it establishes the EU Monitoring, Reporting, Verification (MRV) database, which provides valuable information on the energy efficiency, fuel consumption, and CO2 emissions of vessels on a yearly basis.
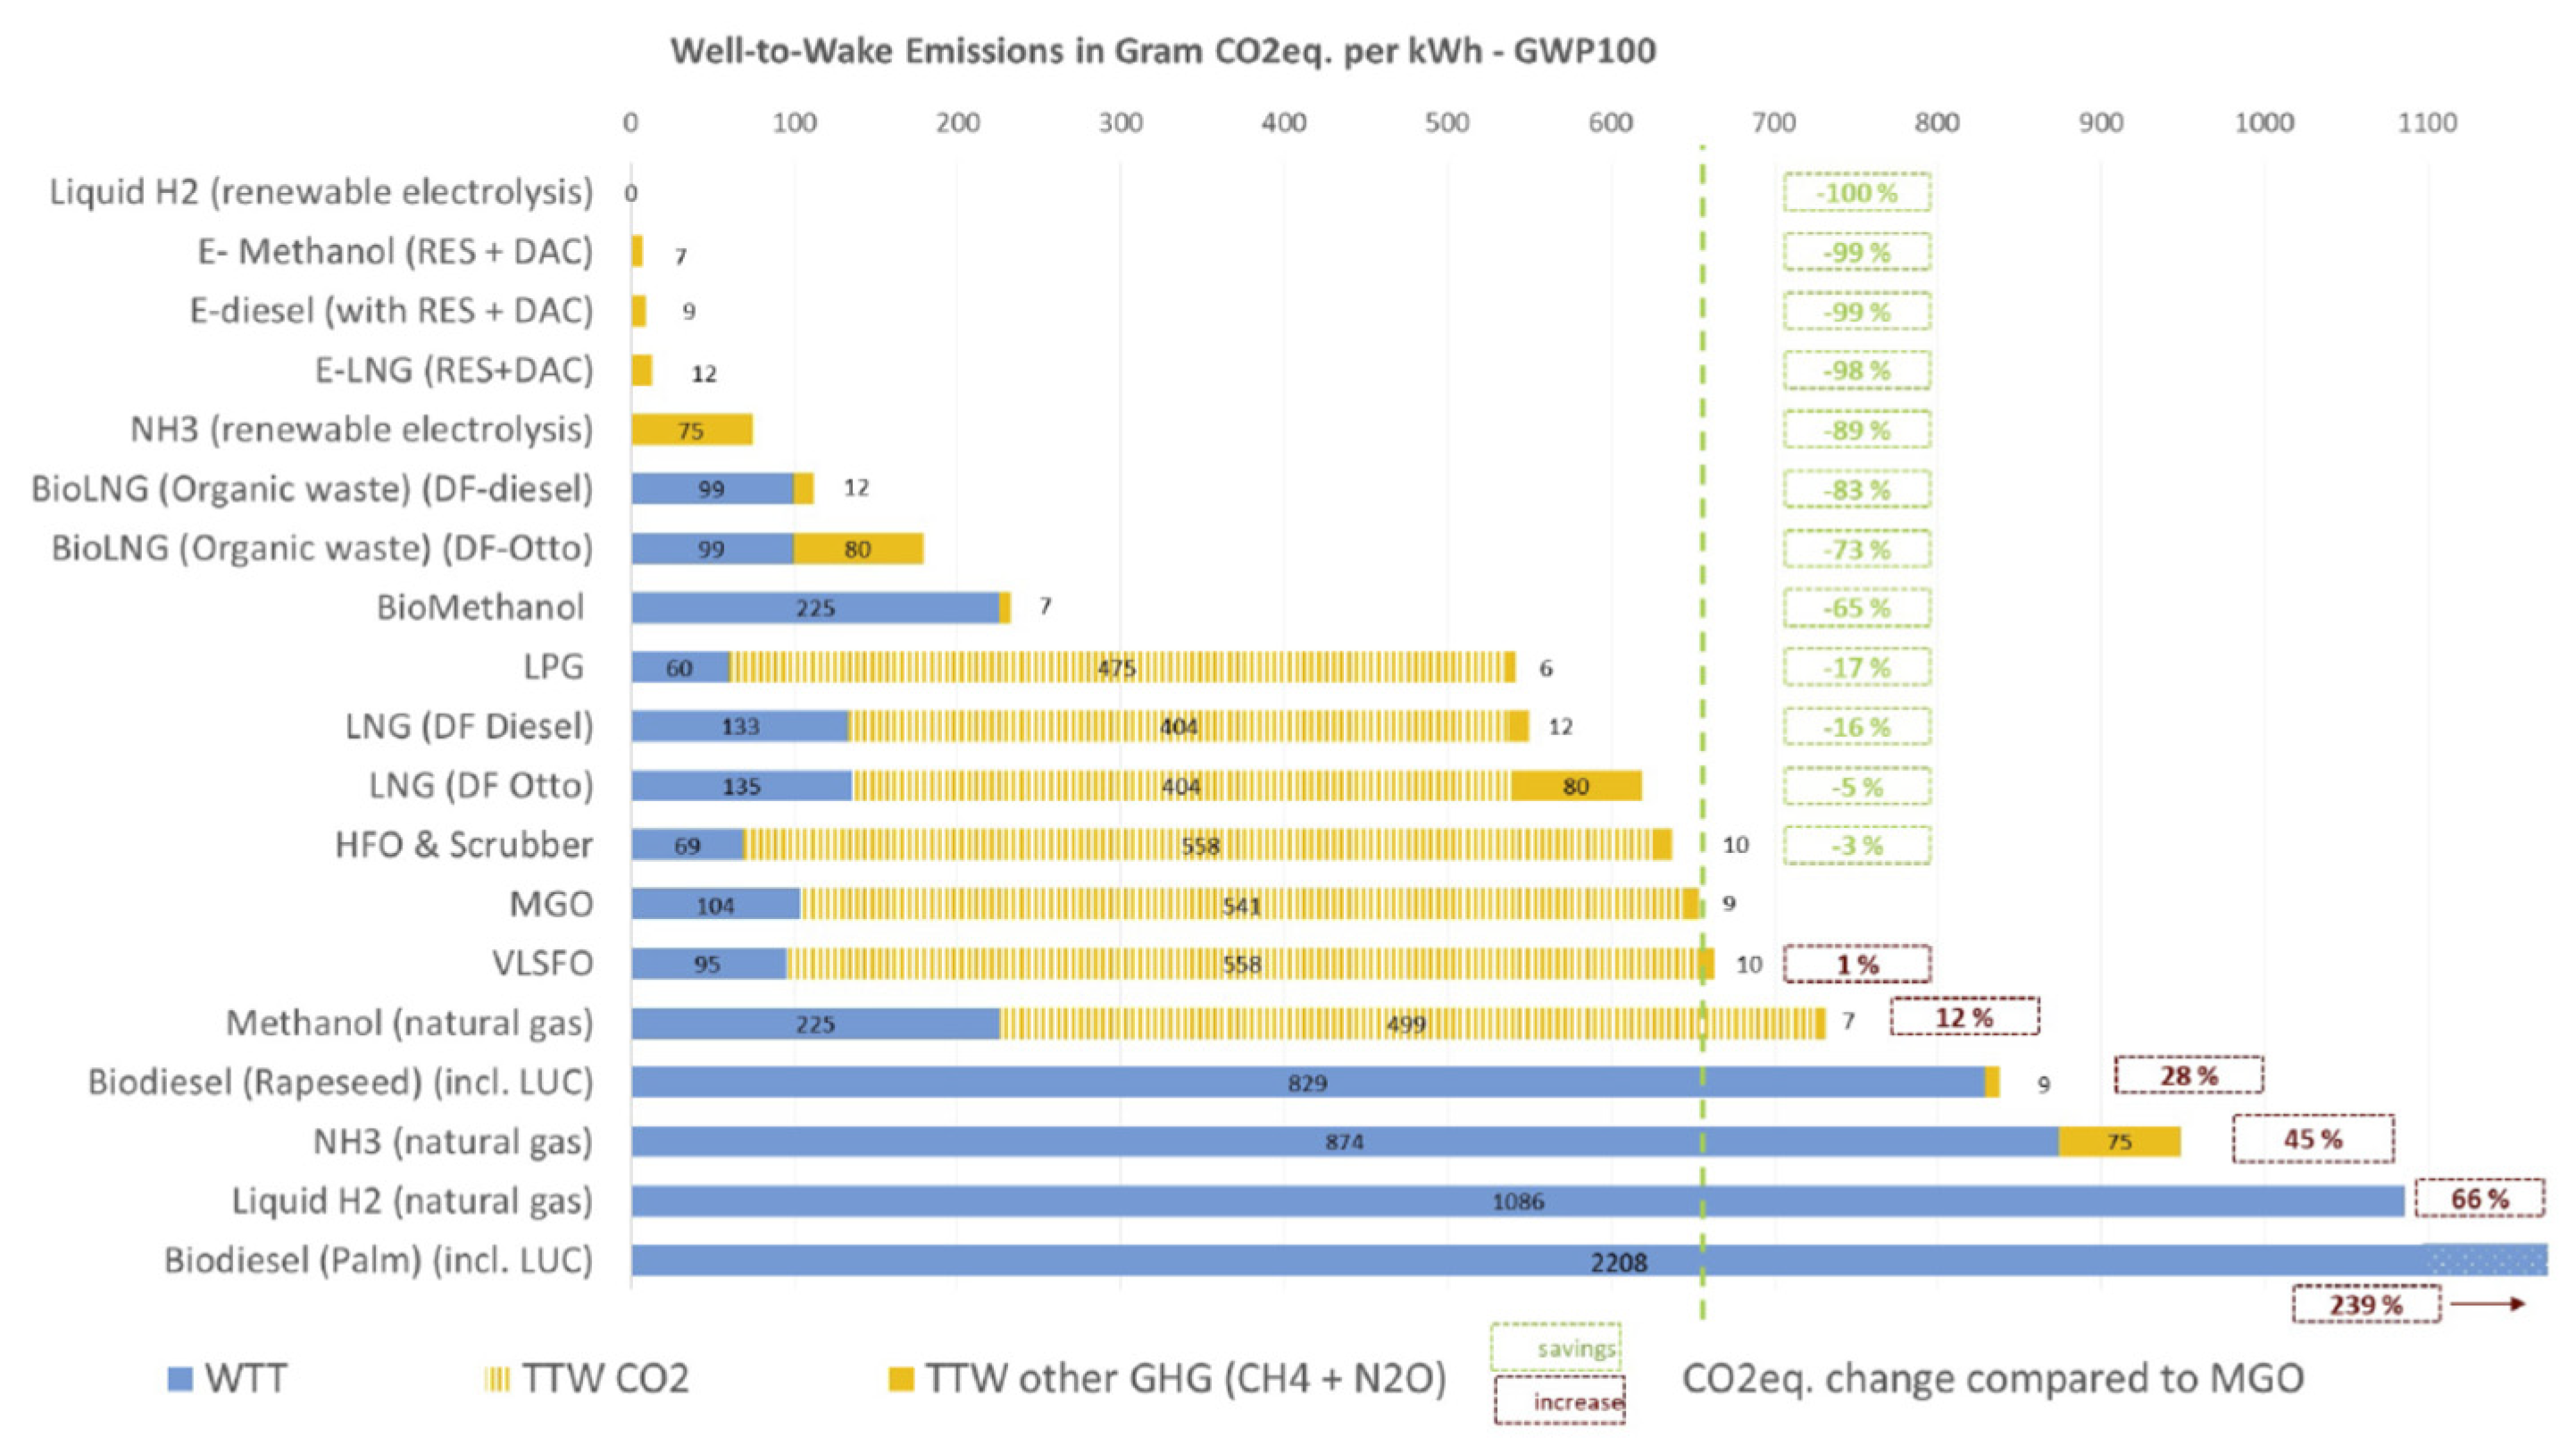
Annex II of the FuelEU Maritime Directive includes the emission factors and Well-to-Wake GHG emissions of alternative fuels as a guide for vessels operating in the EEA to help them achieve compliance with the specific energy intensity limits set by the Directive. Well-to-Wake GHG emissions comprises, and accounts for, both Well-to-Tank (emissions generated during the production process, transport of fuel to the ship, and bunkering) and Tank-to-Wake (which focuses on the emissions from the combustion of marine fuels).
In addition to conventional fossil fuels and biofuels, the Directive analyzes the potential of electro-fuels (e-fuels, which are produced from renewable sources) to decarbonize maritime transport. The Well-to-Wake GHG emissions of e-fuels are very low compared to conventional fuels, and they encompass e-diesel, e-LNG, and e-methanol (which can all be used in existing vessels, and do not require large modifications), as well as e-hydrogen and e-ammonia (which do require the conversion of existing marine engines, or the delivery of newbuildings). With all e-fuels, there is also likely to be some additional investment required in new infrastructure [18,19,20,21].
2.2.3. The Energy Taxation Directive
The EU’s ‘Fit for 55’ package includes a proposal to revise the Energy Taxation Directive (ETD), which has been in place since 2004, and is now deemed to be out of line with EU energy, environment, and climate objectives. Under the previous provisions of the Directive, maritime bunker fuel has been tax-free within the EU. The revised version of the ETD will mean, however, that this exemption will be removed, and that all bunker fuel sold in the EU, and used within the EU, will be subject to taxation as of January 2023. The structure of the new taxes is such that the bunker fuels that pollute the most will be taxed the most, with the highest rate of EUR 10.75/GJ being applied to fossil fuels, and the lowest minimum rate of EUR 0.15/GJ being applied to electricity, advanced sustainable biofuels and biogas, and renewable fuels. Sustainable and alternative fuels in the maritime sector will have a zero-minimum tax rate over a 10-year transition period.
2.2.4. Other Relevant EU Policies
Some of the more general changes introduced within the EU’s ‘Fit for 55’ package will also have a more specific, albeit indirect, impact on the shipping industry.
Currently, there is a certain reluctance on the part of ship owners and operators to be a ‘first mover’ with respect to the adoption of greener fuels, especially because of the perceived insufficiency of the required infrastructure. At the same time, there is some hesitance among EU member states to invest in the required infrastructure, because of the fear that it will prove inappropriate to market demands and become stranded. The Alternative Fuels Infrastructure Directive has been in place since 2014 to prompt such investments in infrastructure, and thus to support the availability of alternative fuels within the EU. The ‘Fit for 55’ package has now turned this Directive into a Regulation (the Alternative Fuels Infrastructure Regulation), which means that it is now binding on EU member states to provide such infrastructure. This change should prompt greater consumer and investor confidence. For the maritime sector, this should better promote more climate-friendly electrical power supplies at ports, as well as the required infrastructure for the refueling of vessels at berth with alternative fuels, particularly LNG and hydrogen. Although this new, generally applicable regulation does not impact shipping directly, it does provide support for the energy transition required under the FuelEU Maritime Directive.
The original Renewable Energy Directive (RED I) that came into effect in 2009, was updated with RED II in 2018. RED II is generally applicable in that it is designed to promote the wider use of energy from renewables, foster better energy system integration, and contribute to climate and environmental objectives associated with global warming and biodiversity loss. The ‘Fit For 55’ package includes a slight revision of this Directive, so that the objectives for the use of renewables are better aligned with the EU’s more ambitious climate objectives. As such, RED II introduces a new EU-wide target of 40% for the share of energy from renewable sources by 2030. This replaces the previous target of 32%. More specifically, the revised version of RED II introduces a new GHG intensity reduction target of at least 13% by 2030 in the transport sector, replacing the target of 14% of energy from renewable sources in the transport sector. As a benchmark for achieving these targets, in 2020, 22.1% of the energy consumed in the EU was from renewable sources, as was 10.2% of the energy consumed in transport activities. Clearly, shipping companies are not directly impacted by the provisions of RED II, since this Directive is really just setting the objectives that the more specific and directly relevant measures, such as the EU ETS, the FuelEU Maritime Directive, and the ETD, are aiming to help achieve.
3. Evaluating the Impact of Decarbonization on Shipping Costs
In terms of the operational solutions for individual ship owners, speed reduction is regarded as the most effective method, while others include enhanced network routing, hull cleaning, and engine maintenance [22,23,24]. Yuan et al. [24] explore potential energy saving measures using a cost effectiveness analysis applied to a chemical tanker as a case study, where speed reduction, weather routing, trim optimization, autopilot adjustment, and the speed control of the pumps and fans, are used as mitigation strategies. Speed reduction emerges as the most effective measure, ranking first under the criteria of ‘energy saving’ and ‘marginal cost effectiveness’. Similarly, [25] measures the potential reduction of CO2 under combined strategies, i.e., four possible pathways related to different speed reductions and available technologies, such as adjusted demand, operational measures, technical measures, alternative fuels/energy, increase in ship size. The results indicate that an 82–95% CO2 reduction could be reached by 2030. However, as Woo and Moon [26] point out, the effectiveness of speed reduction for cutting future emissions is limited once the average speeds of ocean-going vessels have been reduced to 15–18 knots. Despite this, Schwartz et al. [27] reinforce the ubiquitous argument that there are a number of relatively simple and inexpensive methods and solution combinations that could be implemented, which would prove profitable for shipping companies. This is partly because of the improved operational performance, and partly because of the enhanced energy efficiency, which would emerge.
For the shipping industry itself, the choice between green technology and environmental fuels has always been a hot issue in the discussions around how best to rise to the decarbonization challenge. Even a relatively small increase in cost may lead to a significant decrease in GHG emissions when considering the use of low/zero-carbon fuel oil and investments in technological improvements [28]. When deciding upon the installation of green technologies, Bai et al. [29] found that deadweight is one of the key determinants in the container and dry bulk shipping markets, while for tankers, the relationship is not so close. Bai et al. [29] also found that, compared with the dry bulk and tanker sectors, containership owners are more sensitive to fuel price differentials and, as such, are less likely to invest in the installation of green technology when there are higher revenues per day. With respect to the potential use of alternative low/zero-carbon fuels, however, Lindstad et al. [19] suggested that the most important factor for ship owners is the availability of these fuels, and that, in the short-term, dual-fuel engines may be the most cost-effective and practical option for ship owners—i.e., involving the interaction between the use of alternative fuels and implementing technological change.
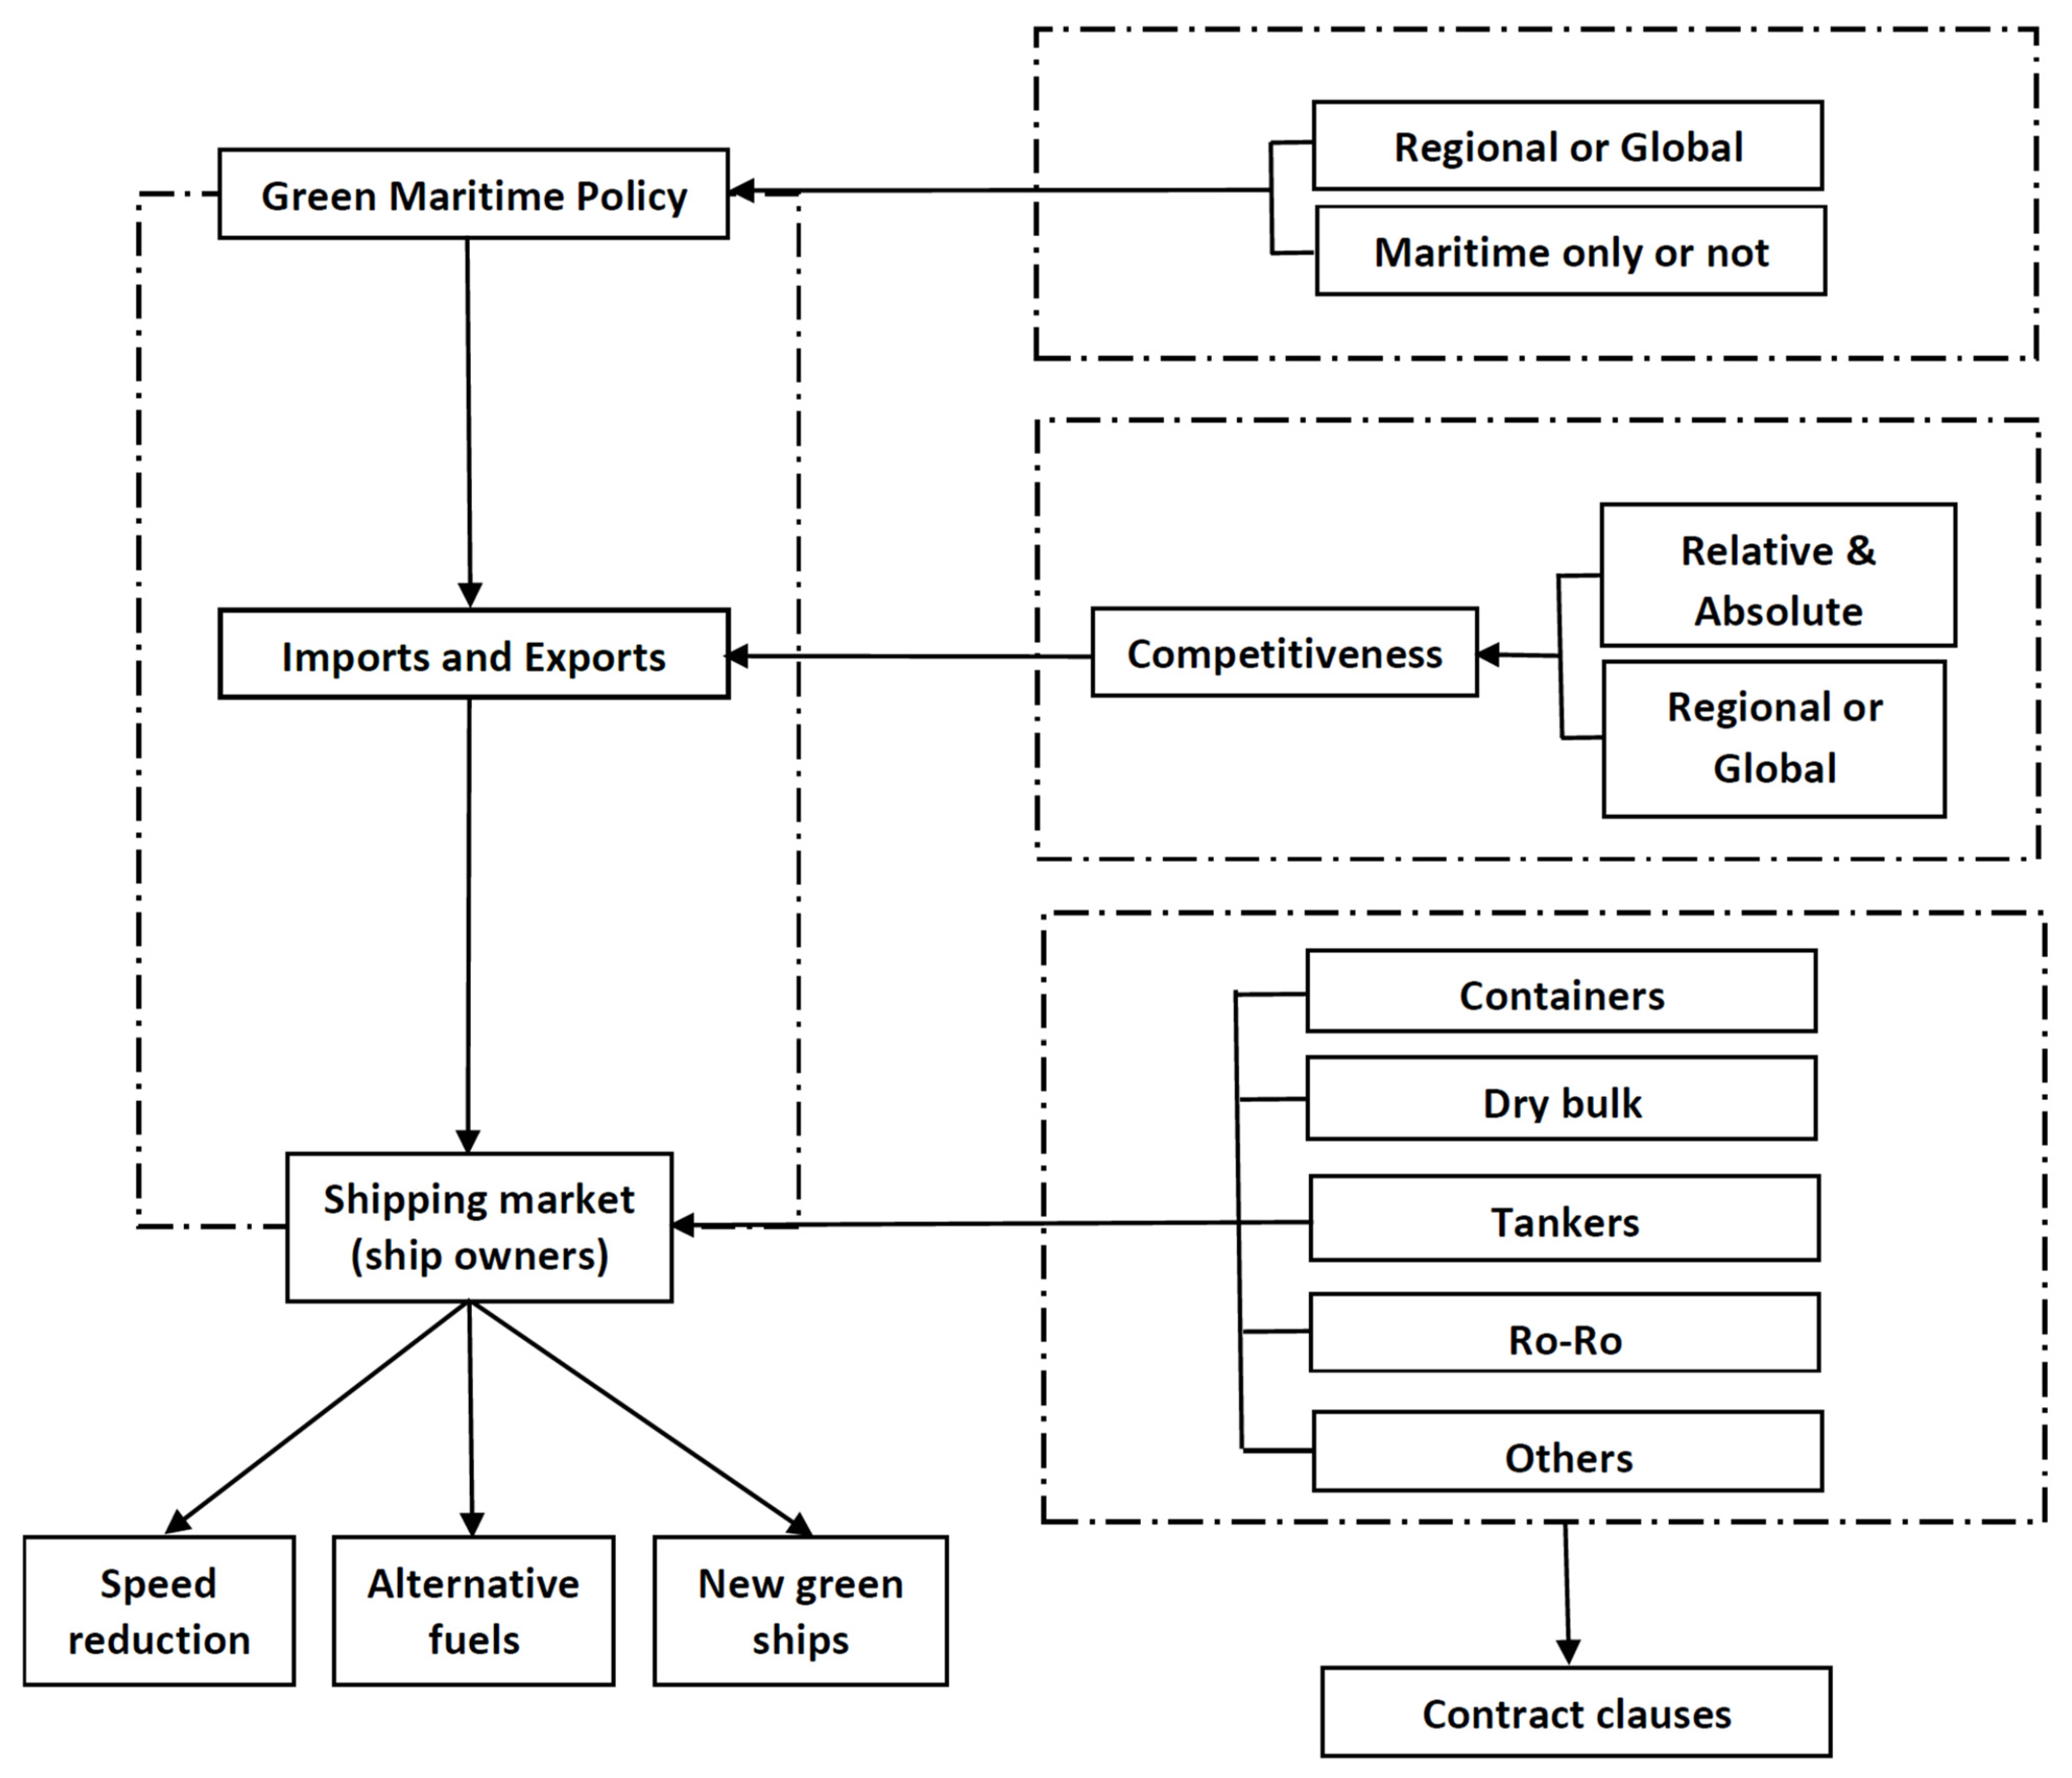
As can be inferred from Figure 4, apart from speed reduction (although this will reduce shipping company revenues), it is clear that virtually all approaches to the decarbonization of shipping will inevitably result in greater costs for ship owners and operators. While there have been various analyses of the myriad of options available for decarbonizing the shipping industry [30,31,32,33,34], there are only a few studies that focus specifically on the cost implications of the various options for the sector. It is here that the major benefit of this work lies; in providing a review of the few available studies, and comparing and contrasting their approaches and outcomes.
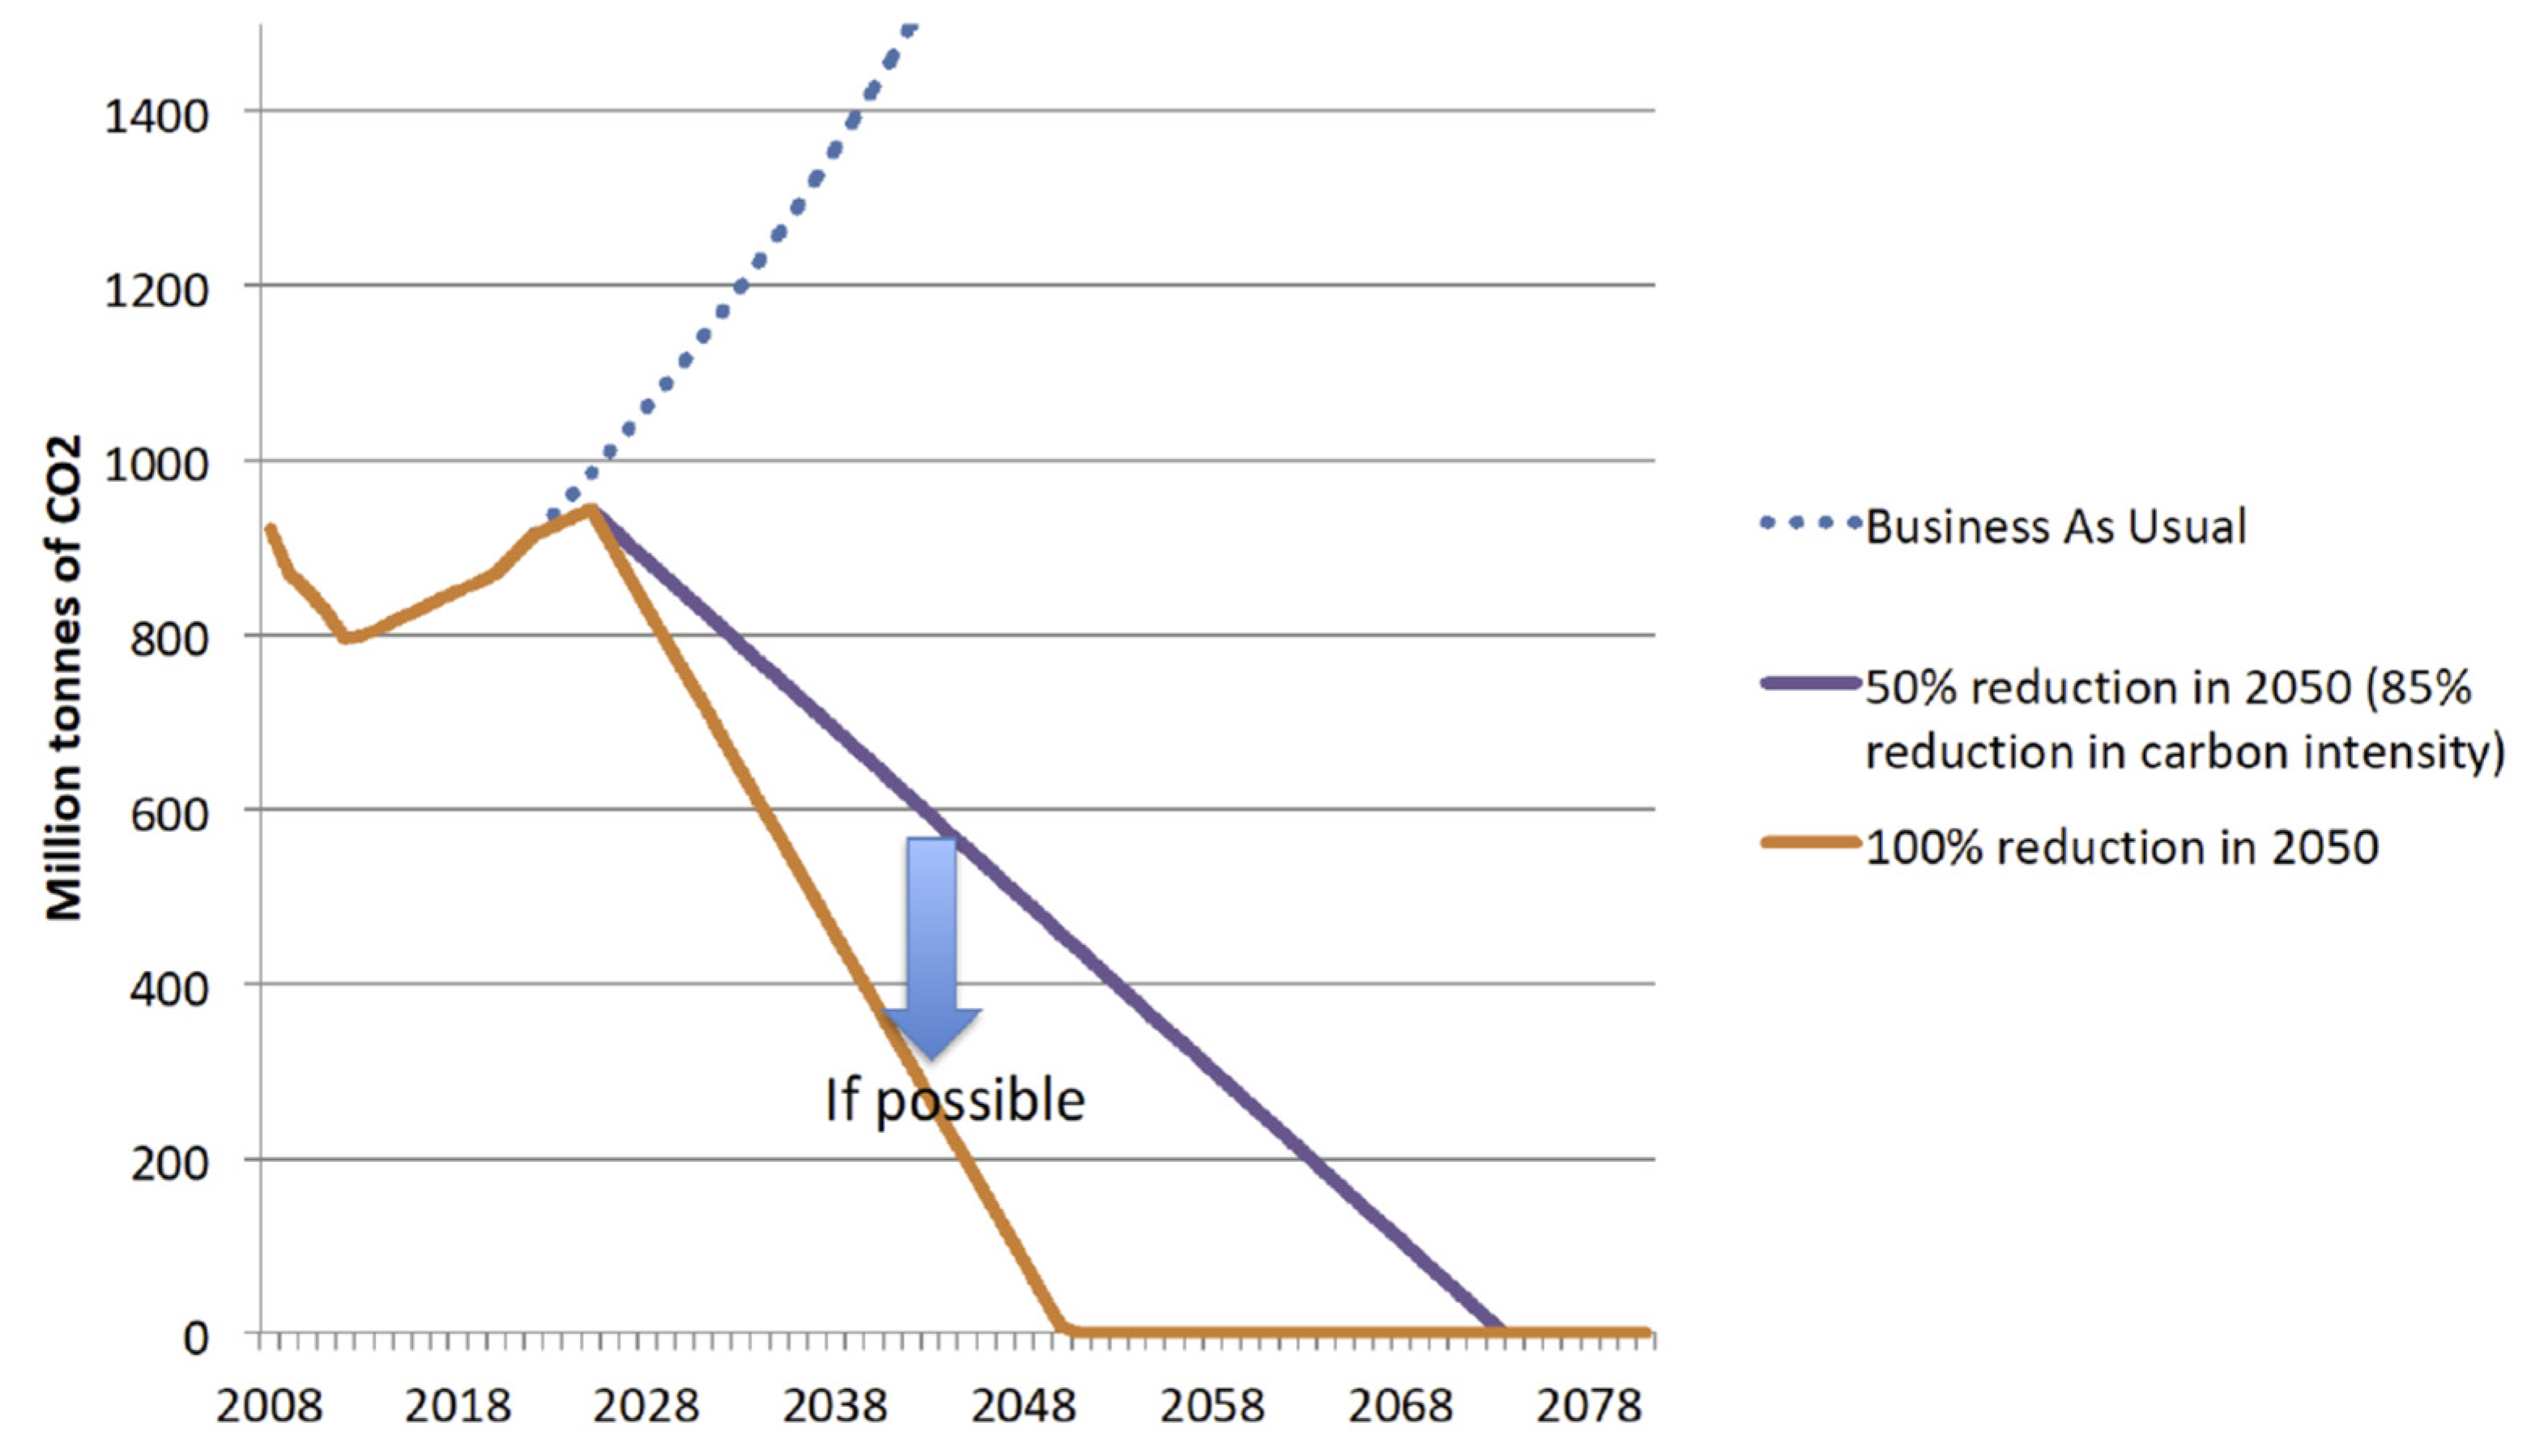
The extent of these cost increases for shipping will depend, among other things, on the current and future prices of alternative fuels and new technologies, as well as the unit cost of carbon, and the required speed of transition for achieving targets. The latter, of course, is a function of the regulatory context, as implemented by the IMO and regional authorities, such as the EU. Based on current and planned global regulations, the pathway to achieving current objectives for the decarbonization of the shipping industry is shown in Figure 5.
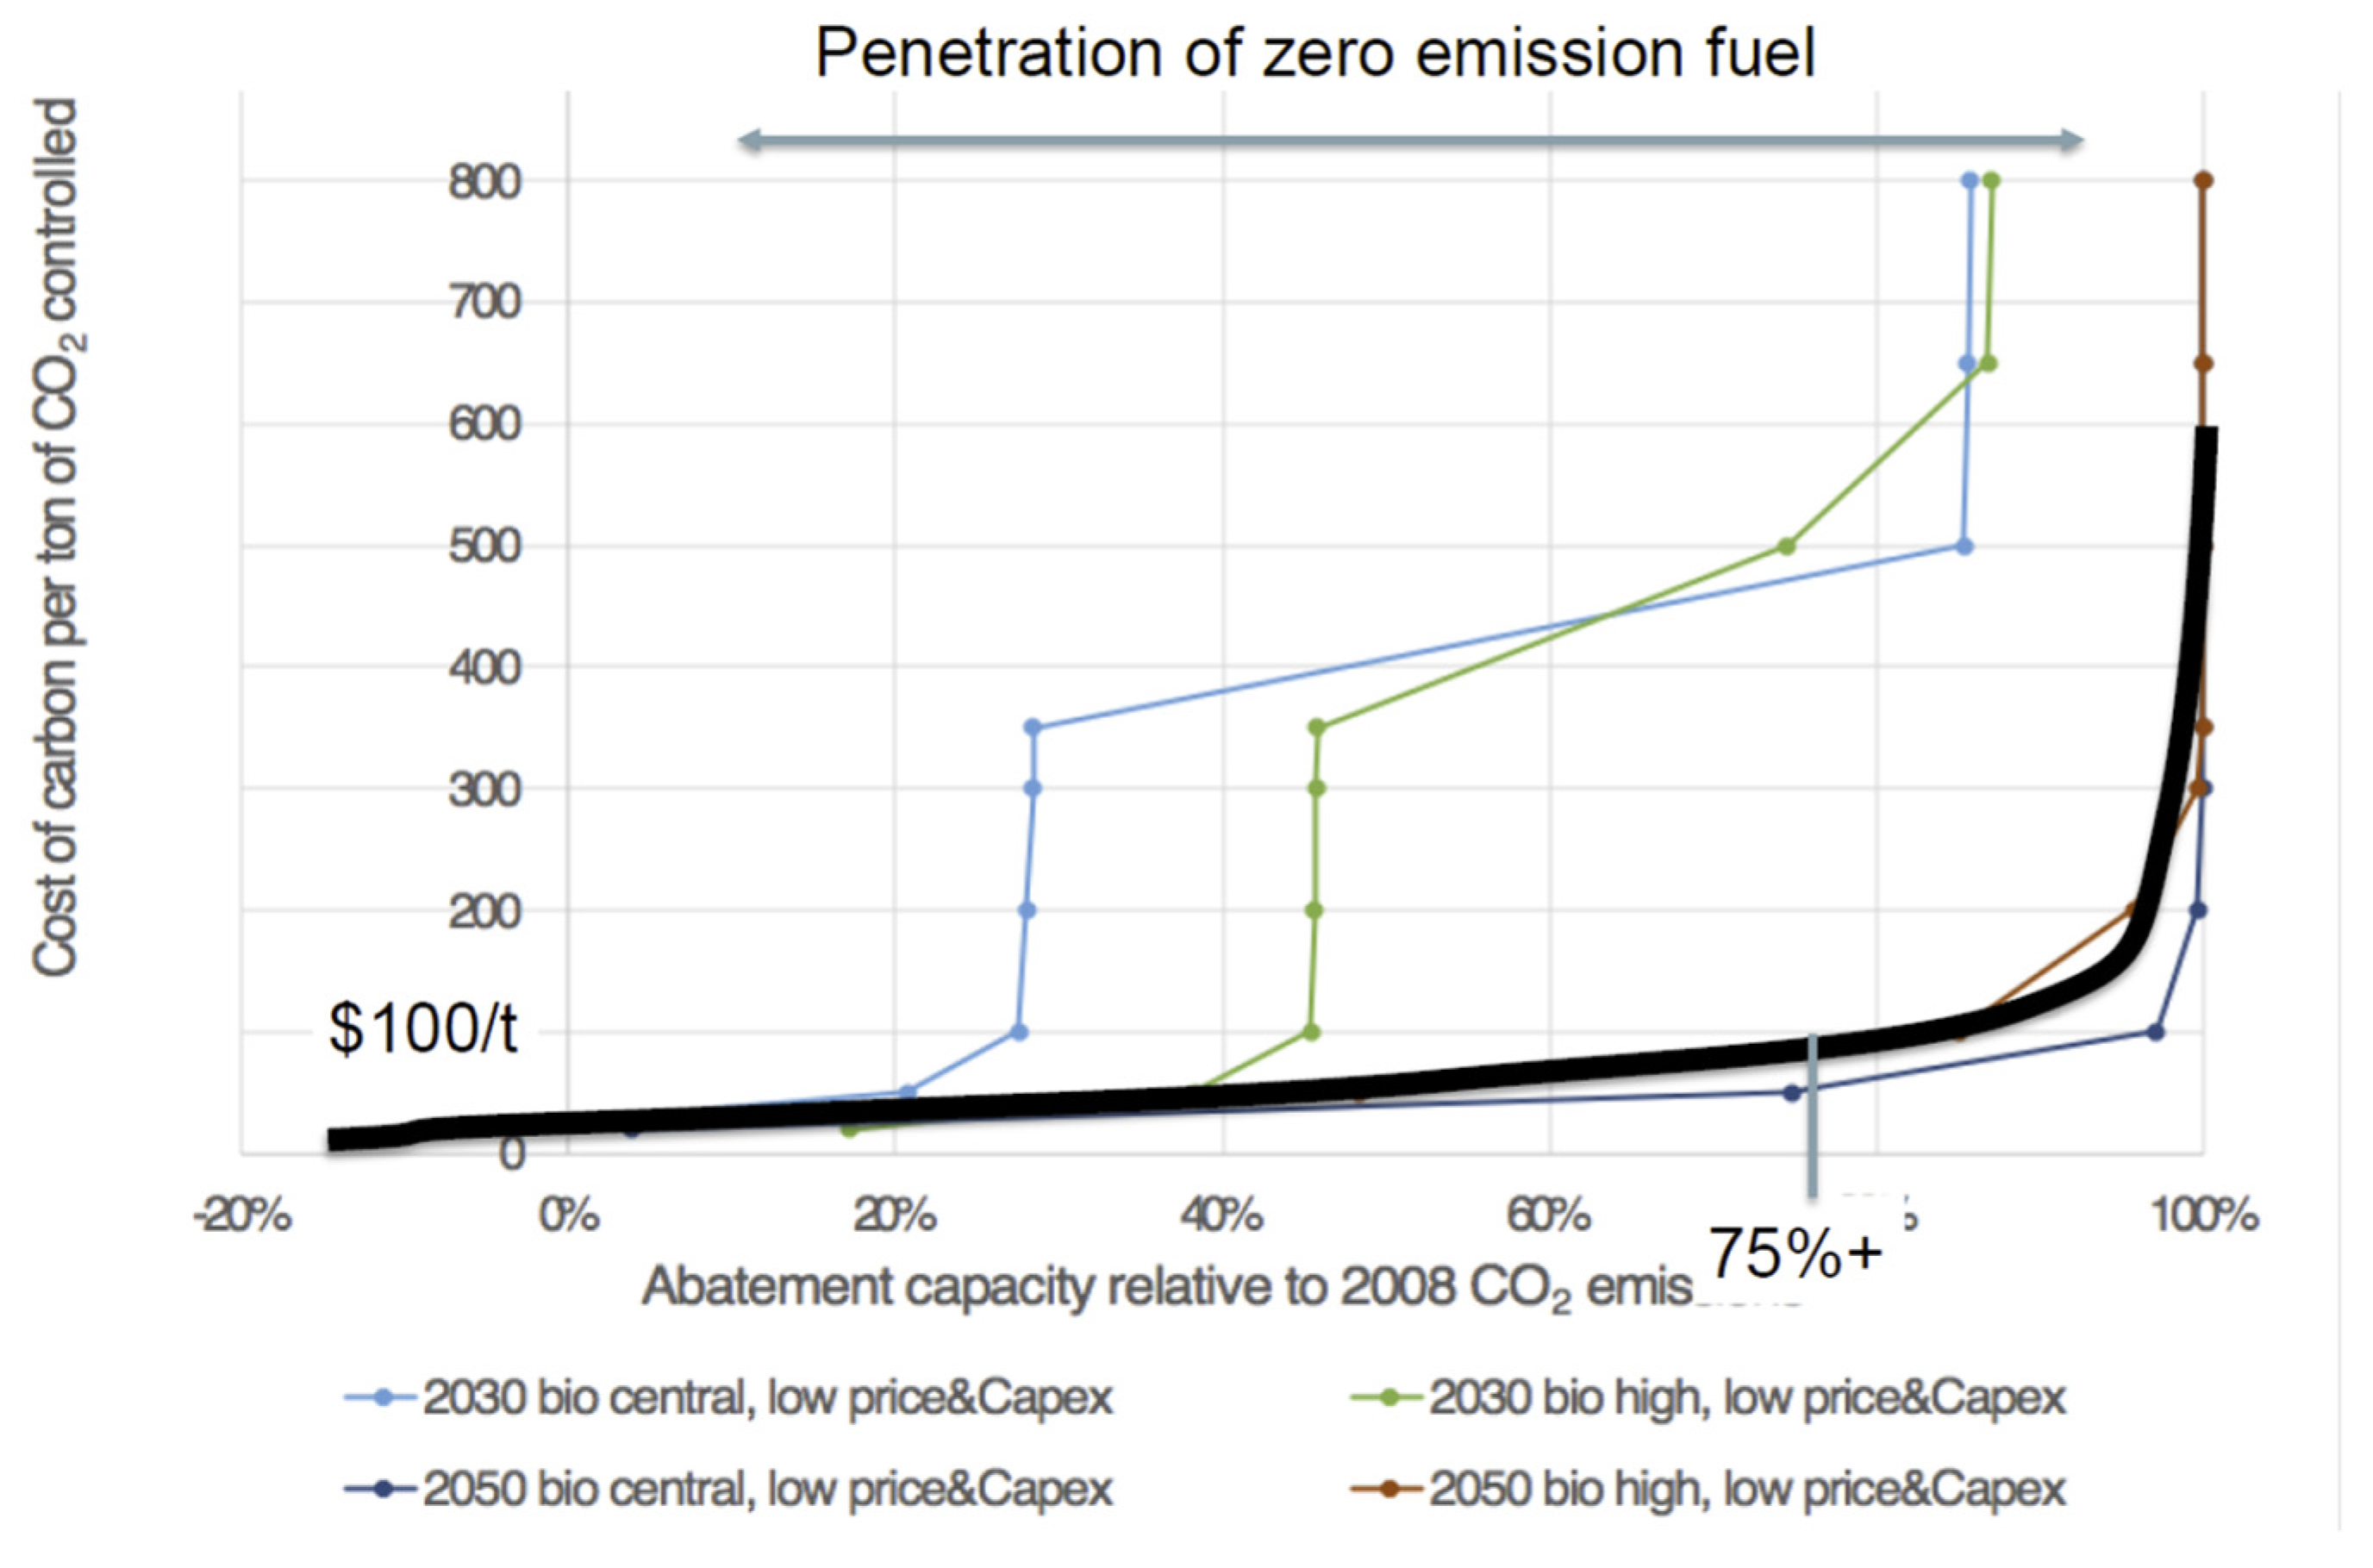
The IMO Fourth GHG Study (2020) presents an updated marginal abatement cost curve (MACC) for the industry based on the likely means available for improving the energy efficiency or carbon intensity of the shipping industry: energy-saving technologies; use of renewable energy; use of alternative fuels; and speed reduction. This updated industry MACC is shown in Figure 6. While it does account for all the planned changes to the EEDI regulations, it does not include the effect of the EEXI. On the basis of certain assumptions (particularly concerning the future prices of zero-carbon fuels), this updated MACC reveals that the objectives set within the IMO Initial Strategy are achievable, with approximately 64% of the total amount of CO2 reduction contributed to by the use of alternative fuels.
Given the perceived importance of alternative fuels (particularly zero-carbon alternative fuels) for achieving the decarbonization objectives set for the shipping industry, the future fuel mix, and the unit price of those fuels, is a critical factor. The currently perceived range of potential alternative fuels, together with their efficacy in reducing GHG emissions, is shown in Figure 7.
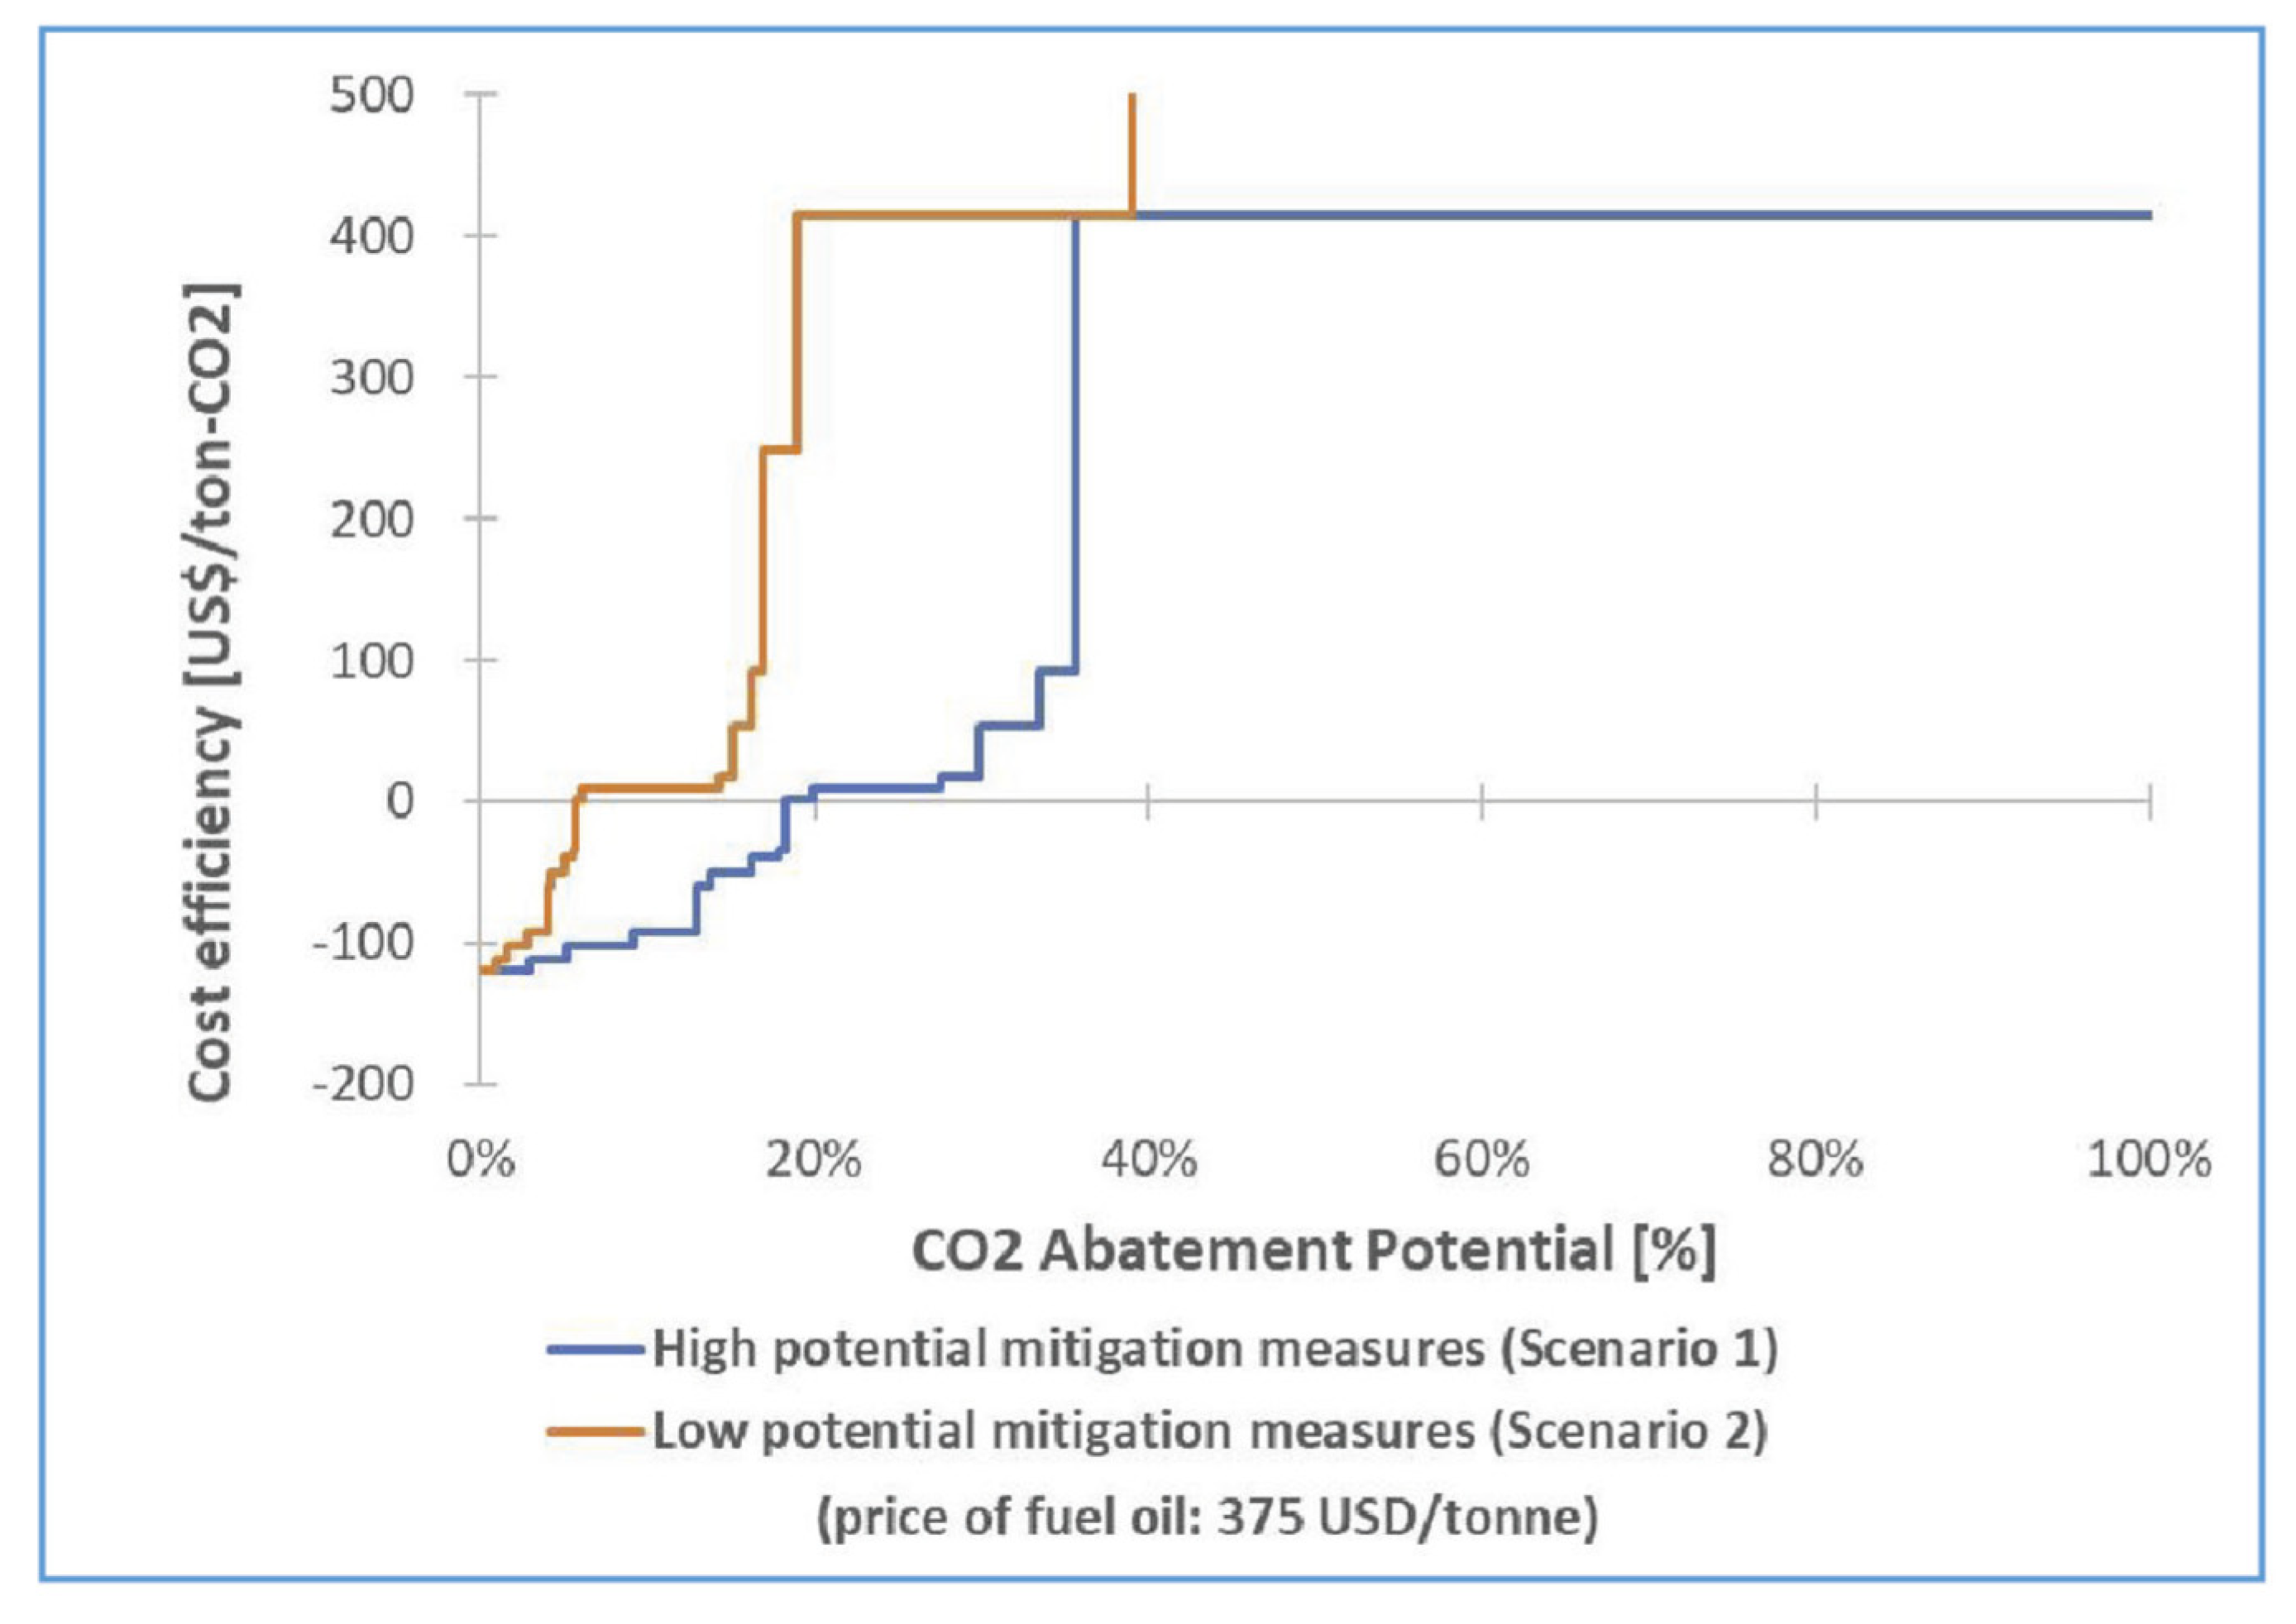
Of course, which of these possibilities actually emerges as viable fuels of the future for the shipping industry depends on a number of factors, such as their production costs, the volume of supply (availability), the cost of associated technology (new engines, etc.), and the demand from shipping and other industries, all of which will interact to influence the market price of each option, which will, in turn, influence take-up. Indeed, as indicated in Figure 8 and Figure 9, the unit price of alternative fuels is critical to the total cost incurred by the industry in meeting the IMO decarbonization objectives.
Between the limits of the future price of renewable fuels, shown in Figure 8 and Figure 9, the range of possible future scenarios would appear to be virtually limitless. Despite the difficulties involved, however, Smith et al. [37] tested a range of possible scenarios, as identified in Table 1, in order to determine the future evolution of the maritime fuel mix over time, up to 2050, as shown in the graphs in Figure 10 plotted for each of the scenarios.
The aggregate fuel cost profile that the shipping industry will face over the next few decades is a function of both the fuel mix used, and the average unit price of the individual fuels that comprise the mix as it transitions over time. Clearly, these two factors are not independent of each other, something which adds a further degree of complication in attempting to forecast future fuel prices. However, some attempts have been made in this respect, with the most influential presented in Table 2, Table 3 and Table 4.
In addition to future uncertainty over the evolution of the maritime fuel mix, and the future prices of the fuels that comprise it, it seems increasingly likely that a further cost will need to be incurred in terms of paying for the carbon that the industry emits. This has already been established in some parts of the world, and is about to be introduced in Europe with the inclusion of shipping in the EU ETS. As a consequence, the IMO is coming under increasing pressure to implement an appropriate market-based mechanism at the global level. Industry expectation, therefore, is that this will bring about not only increased fuel costs, but also both higher maintenance and capital costs.
The question also arises as to the future price of carbon that has to be paid, and how this will impact the costs for ship owners, the freight rates, and other costs payable by shippers and, ultimately, upon trade volumes, as a result of increased transport costs. Rojon et al. [40] provide a comprehensive review of a number of works looking at the impact of carbon pricing on freight costs [41,42,43,44,45,46,47]. The authors summarize the works reviewed by stating that, in all except one study, a carbon price on maritime transport would increase freight costs by between 0.4% and 16%, with most concluding that the increase would be less than 10%, with a corresponding impact on import prices of mostly less than 1%. This was even the case where the price of ETS allowances rose steeply, as in Anger et al. [45], but not so for ben Brahim et al. [47], who concluded that transport costs would double under such a circumstance, and that there would be a 6–8% increase in import prices as a response to a relatively high carbon price.
4. Discussion and Conclusions
On the basis of forecasts of a continuous growth in world trade, it is clear that operational measures will not provide a solution to the challenge of either reducing or, better yet, eliminating the GHG emissions of the shipping industry. This has justified the tightening of the regulatory environment, where plans are in place for even more stringent measures in the immediate future, particularly with the increasing imposition of market-based measures around the world at regional, national, and subnational levels.
Dessens et al. [48] found that, compared with the base scenario (i.e., using fossil fuels), a global ETS could reduce the CO2 and non-CO2 emissions of shipping by up to 65% from 2000 to 2050. The imminent inclusion of shipping within the EU ETS is the most radical industry intervention currently on the horizon, and has stimulated much more intense discussions within the IMO on the introduction of a global ETS for shipping. However, any efforts by the IMO to develop a global ETS for shipping will face significant challenges. Establishing a global scheme is much more difficult than a regional one, owing to the political obstacles that are faced [13]; in any case, such a scheme will never be perfect, as there will always be some countries or regions that suffer disadvantages [12]. For example, the pricing of carbon for the shipping industry is likely to increase the freight costs of ‘Small Island Developing States (SIDS)’ and ‘Least Developed Countries (LDCs)’, due to these countries tending to be far from major trading routes, and because port efficiency is low in these countries. For example, a 10% increase in per unit transport cost can lead to an 8.5–18.5% decrease in the quantity of exports from these counties [40].
Another issue for the IMO is that any global ETS it might develop and implement would necessarily apply only to the maritime industry (i.e., it would be a closed ETS). In an open ETS, carbon trading is allowed between different industries, while in a closed scheme, carbon emission allowances can only be traded between companies within the shipping sector. Wang et al. [14] have analyzed the impacts of an open ETS and a Maritime-only ETS on the container and dry bulk shipping markets. The former is found to be more likely to be a buyer of emissions allowances, while the dry bulk shipping sector has a high possibility of becoming a seller under both an open and a closed ETS. The spillover effects between different shipping markets, therefore, are significant under a closed system. In an open ETS, as has proved to be the case in California and China, for example, and as would probably be the case with the EU ETS, in an open ETS, the ability to trade CO2 (or wider GHG) allowances with other industries is expected to reduce the marginal emissions costs for the shipping industry and enhance market transparency [12]. On the other hand, Haites [13]) argues that an open scheme is more costly and time consuming, and that the international nature of the shipping industry, and the mobility of the asset base, makes it so different from others and that, therefore, it calls for a closed ETS. The EU, however, appears to be opting for the inclusion of shipping (as with aviation) into the currently open EU ETS. It anticipates that this will capture emissions of about 90 million tonnes of CO2 (or equivalent) a year, which, at the current market price of EUR 82 per tonne, would require shipping companies to surrender allowances to the value of EUR 7.38 billion per year once the scheme was fully up and running in 2026. Of course, one of the most important issues for the shipping industry is not just the sheer value of this cost increase, but also its uncertainty in that this cost will fluctuate in line with the price of carbon in the marketplace.
Irrespective of the potential of the IMO to implement a global ETS, many scholars argue that a carbon tax might be more efficient than an ETS ([22,49]). Mellin and Rydhed [50] report that commercial ports in Sweden were keen to implement regulations to reduce emissions, and that they were positive towards CO2-differentiated port dues (97%), slightly less in favor of a technical standard (92%) and CO2 taxation (84%), as well as shipping being included in the EU ETS (74%), even though some respondents believed that shipping would ultimately be included in the ETS. Wu et al. [51] argues that an ETS is more complicated than a carbon tax, and is more market-oriented, and that, therefore, it is not clear which one is better based on some simplified model. A well-designed carbon levy with a predictable price is expected to achieve the IMO 2050 ambition, with the collected funds expected to be used for research and development to reduce the buyer’s cost [52]. To test the efficacy of a carbon levy (tax), Kosmas and Acciaro [53] compared the effects of two different levies—a unit-tax of USD 10–300 per ton of fuel, and an ad valorem tax with charges of 5–80% per ton of bunker fuel. The study concludes that both levies lead to declining industry profits, and that the extent to which the additional cost can be passed on to customers depends on market characteristics.
Ultimately, under a ‘Business-as-Usual’ scenario, the aggregate GHG emissions of the shipping industry will continue to increase into the future, as trade and the sector itself continues to grow at such a rate that it overwhelms incremental operational and technological improvements to the energy efficiency of ships. IMO actions with respect to reducing or eliminating the GHG emissions of the shipping industry are generally perceived to be slow, too late, weak, and unambitious; a document of the European Parliament [54] asserts that “The efforts of the IMO are more than disappointing”. There is now significant pressure on the IMO to implement more ambitious objectives and rigorous action, particularly with respect to the implementation of market-based measures. Should a more stringent regulatory context emerge as a result, significantly greater pressure will be exerted on the shipping industry for compliance, and to hasten its pathway to full decarbonization. While there does exist some scope for greater efficiency in operations, and for technological innovation and investment, even the IMO itself acknowledges that the optimal pathway to the full decarbonization of the industry relies upon the development and use of low/zero-carbon alternative fuels, and that much of the technological innovation that will be seen over coming years will relate to installations, both aboard and ashore, that facilitate their deployment. Forecasting the future evolution of fuel mix, and the prices of the fuels comprising it, in tandem with the emergent price of maritime carbon emissions, are pivotal to gaining an understanding of the pace of change within the sector, and to the achievement of objectives.
Author Contributions
Conceptualization, K.C.; Data curation, J.Y.; Formal analysis, K.C. and J.Y.; Funding acquisition, K.C.; Investigation, J.Y.; Methodology, K.C. and J.Y.; Project administration, K.C.; Writing—original draft, K.C. and J.Y.; Writing—review & editing, K.C. All authors have read and agreed to the published version of the manuscript.
Funding
This research received no external funding.
Acknowledgments
The authors are grateful for the input of two anonymous reviewers that provided constructive feedback on an earlier draft of the paper.
Conflicts of Interest
The authors declare no conflict of interest.
| 1 | Alternative methods for estimating the industry’s carbon emissions (voyage-based and ship-based allocations) are implemented within The IMO Fourth GHG Study [3], which yield slightly lower estimates and growth rates. |
| 2 | Within the context of the IMO Fourth GHG Study [3], BAU forecasts refer to the fact that it is assumed that no new regulations are instigated during the forecast period that have an impact on the energy efficiency or carbon intensity of ships. |
References
- Zis, T.; Cullinane, K.P.B. The Desulphurisation of Shipping: Past, Present and the Future under a Global Cap. Transp. Res. D Transp. Environ. 2020, 82, 102316. [Google Scholar]
- World Bank. Carbon Pricing Dashboard. 2022. Available online: https://carbonpricingdashboard.worldbank.org/ (accessed on 28 June 2022).
- IMO. Fourth GHG Study. 2020. Available online: https://wwwcdn.imo.org/localresources/en/OurWork/Environment/Documents/Fourth%20IMO%20GHG%20Study%202020%20-%20Full%20report%20and%20annexes.pdf (accessed on 14 June 2022).
- Fricko, O.; Havlik, P.; Rogelj, J.; Klimont, Z.; Gusti, M.; Johnson, N.; Riahi, K. The marker quantification of the Shared Socioeconomic Pathway 2: A middle-of-the-road scenario for the 21st century. Glob. Environ. Change 2017, 42, 251–267. [Google Scholar] [CrossRef] [Green Version]
- Calvin, K.; Bond-Lamberty, B.; Clarke, L.; Edmonds, J.; Eom, J.; Hartin, C.; Wise, M. The SSP4: A world of deepening inequality. Glob. Environ. Change 2017, 42, 284–296. [Google Scholar] [CrossRef] [Green Version]
- O’Neill, B.C.; Kriegler, E.; Ebi, K.L.; Kemp-Benedict, E.; Riahi, K.; Rothman, D.S.; Solecki, W. The roads ahead: Narratives for shared socioeconomic pathways describing world futures in the 21st century. Glob. Environ. Change 2017, 42, 169–180. [Google Scholar] [CrossRef] [Green Version]
- Moss, R.H.; Edmonds, J.A.; Hibbard, K.A.; Manning, M.R.; Rose, S.K.; Van Vuuren, D.P.; Wilbanks, T.J. The next generation of scenarios for climate change research and assessment. Nature 2010, 463, 747–756. [Google Scholar] [CrossRef] [PubMed]
- Van Vuuren, D.P.; Edmonds, J.A.; Kainuma, M.; Riahi, K.; Weyant, J. A special issue on the RCPs. Clim. Change 2011, 109, 1–4. [Google Scholar] [CrossRef] [Green Version]
- Council of the European Union. Fit for 55. 2021. Available online: https://www.consilium.europa.eu/en/policies/green-deal/fit-for-55-the-eu-plan-for-a-green-transition/ (accessed on 22 April 2022).
- Sikora, A. European Green Deal – legal and financial challenges of the climate change. ERA Forum 2021, 21, 681–697. [Google Scholar] [CrossRef]
- European Commission. Regulation of the European Parliament and of the Council on the Use of Renewable and Low-Carbon Fuels in Maritime Transport and Amending Directive 2009/16/EC. 2021. Available online: https://eur-lex.europa.eu/legal-content/EN/TXT/?uri=CELEX:52021AE3630. (accessed on 24 April 2022).
- Miola, A.; Marra, M.; Ciuffo, B. Designing a climate change policy for the international maritime transport sector: Market-based measures and technological options for global and regional policy actions. Energy Policy 2011, 39, 5490–5498. [Google Scholar] [CrossRef]
- Haites, E. Linking emissions trading schemes for international aviation and shipping emissions. Clim. Policy 2009, 9, 415–430. [Google Scholar] [CrossRef]
- Wang, K.; Fu, X.; Luo, M. Modeling the impacts of alternative emission trading schemes on international shipping. Transp. Res. Part A Policy Pract. 2015, 77, 35–49. [Google Scholar] [CrossRef] [Green Version]
- Agnolucci, P.; Smith, T.; Rehmatulla, N. Energy efficiency and time charter rates: Energy efficiency savings recovered by ship owners in the Panamax market. Transp. Res. Part A Policy Pract. 2014, 66, 173–184. [Google Scholar] [CrossRef] [Green Version]
- Christodoulou, A.; Cullinane, K.P.B. Potential alternative fuel pathways for compliance with the ‘FuelEU Maritime Directive’. In Proceedings of the annual IAME International Conference, Busan, Korea, 14–16 September 2022. [Google Scholar]
- Christodoulou, A.; Dalaklis, D.; Ölçer, A.I.; Ghaforian Masodzadeh, P. Inclusion of Shipping in the EU-ETS: Assessing the Direct Costs for the Maritime Sector Using the MRV Data. Energies 2021, 14, 3915. [Google Scholar] [CrossRef]
- Hansson, J.; Brynolf, S.; Fridell, E.; Lehtveer, M. The Potential Role of Ammonia as Marine Fuel—Based on Energy Systems Modeling and Multi-Criteria Decision Analysis. Sustainability 2020, 12, 3265. [Google Scholar] [CrossRef] [Green Version]
- Lindstad, E.; Lagemann, B.; Rialland, A.; Gamlem, G.M.; Valland, A. Reduction of maritime GHG emissions and the potential role of E-fuels. Transportation Research Part D: Transp. Environ. 2021, 101, 103075. [Google Scholar] [CrossRef]
- Svanberg, M.; Ellis, J.; Lundgren, J.; Landälv, I. Renewable methanol as a fuel for the shipping industry. Renew. Sustain. Energy Rev. 2018, 94, 1217–1228. [Google Scholar] [CrossRef]
- Zincir, B.; Deniz, C. Methanol as a Fuel for Marine Diesel Engines. In Alcohol as an Alternative Fuel for Internal Combustion Engines; Shukla, P.C., Belgiorno, G., di Blasio, G., Agarwal, A.K., Eds.; Springer: Singapore, 2021; pp. 45–85. [Google Scholar] [CrossRef]
- Garcia, B.; Foerster, A.; Lin, J. Net Zero for the International Shipping Sector? An Analysis of the Implementation and Regulatory Challenges of the IMO Strategy on Reduction of GHG Emissions. J. Environ. Law 2020, 33, 85–112. [Google Scholar] [CrossRef]
- Huang, Z.; Shi, X.; Wu, J.; Hu, H.; Zhao, J. Optimal annual net income of a containership using CO2 reduction measures under a marine emissions trading scheme. Transp. Lett. 2015, 7, 24–34. [Google Scholar] [CrossRef]
- Yuan, J.; Nian, V.; He, J.; Yan, W. Cost-effectiveness analysis of energy efficiency measures for maritime shipping using a metamodel based approach with different data sources. Energy 2019, 189, 116205. [Google Scholar] [CrossRef]
- Halim, R.A.; Kirstein, L.; Merk, O.; Martinez, L.M. Decarbonization Pathways for International Maritime Transport: A Model-Based Policy Impact Assessment. Sustainability 2018, 10, 2243. [Google Scholar] [CrossRef] [Green Version]
- Woo, J.K.; Moon, D.S.H. The effects of slow steaming on the environmental performance in liner shipping. Marit. Policy Manag. 2014, 41, 176–191. [Google Scholar] [CrossRef]
- Schwartz, H.; Gustafsson, M.; Spohr, J. Emission abatement in shipping – is it possible to reduce carbon dioxide emissions profitably? J. Clean. Prod. 2020, 254, 120069. [Google Scholar] [CrossRef]
- Erbach, G.; Foukalova, N. Review of the EU ETS: ‘Fit for 55’ Package; EPRS, European Parliament: Brussels, Belgium, 2022.
- Bai, X.; Hou, Y.; Yang, D. Choose clean energy or green technology? Empirical evidence from global ships. Transp. Res. Part E Logist. Transp. Rev. 2021, 151, 102364. [Google Scholar] [CrossRef]
- Balcombe, P.; Brierley, J.; Lewis, C.; Skatvedt, L.; Speirs, J.; Hawkes, A.; Staffell, I. How to decarbonise international shipping: Options for fuels, technologies and policies. Energy Convers. Manag. 2019, 182, 72–88. [Google Scholar] [CrossRef]
- Lagouvardou, S.; Psaraftis, H.N.; Zis, T. A literature survey on market-based measures for the decarbonization of shipping. Sustainability 2020, 12, 3953. [Google Scholar] [CrossRef]
- Ampah, J.D.; Yusuf, A.A.; Afrane, S.; Jin, C.; Liu, H. Reviewing two decades of cleaner alternative marine fuels: Towards IMO’s decarbonization of the maritime transport sector. J. Clean. Prod. 2021, 320, 128871. [Google Scholar] [CrossRef]
- Mallouppas, G.; Yfantis, E.A. Decarbonization in shipping industry: A review of research, technology development, and innovation proposals. J. Mar. Sci. Eng. 2021, 9, 415. [Google Scholar] [CrossRef]
- Romano, A.; Yang, Z. Decarbonisation of shipping: A state of the art survey for 2000–2020. Ocean. Coast. Manag. 2021, 214, 105936. [Google Scholar] [CrossRef]
- Smith, T.; Halim, R.; Rojon, I. Maritime Transport Costs and Trade Flows, International Transport Forum, OECD. 2019. Available online: https://www.itf-oecd.org/maritime-transport-costs-and-trade-flows (accessed on 14 June 2022).
- Lindstad, E. Alternative Marine Fuels in Light of Carbon Emission Reduction Targets. 2021. Available online: https://solvangship.no/wp-content/uploads/2021/10/Alternative-Fuel-PATHWAYS-Dr-Elizabeth-Lindstad-Chief-Scientist-2-Juni-002.pdf (accessed on 2 April 2022).
- Smith, T.; Raucci, C.; Haji Hosseinloo, S.; Rojon, I.; Calleya, J.; Suárez de la Fuente, S.; Wu, P.; Palmer, K. CO2 Emissions from International Shipping. Possible Reduction Targets and their Associated Pathways; UMAS: London, UK, 2016. [Google Scholar]
- Lloyds Register and UMAS Techno-Economic Assessment of Zero-Carbon Fuels. 2020. Available online: https://www.lr.org/en/insights/global-marine-trends-2030/techno-economic-assessment-of-zero-carbon-fuels/ (accessed on 14 June 2022).
- DNV (2019) Reduksjon av Klimagassutslipp fra Innenriks Skipstrafikk (in Norwegian) Report No: 2019-0939 DNV·GL Hövik. Available online: https://www.miljodirektoratet.no/globalassets/publikasjoner/m1626/m1626.pdf (accessed on 2 April 2022).
- Rojon, I.; Lazarou, N.J.; Rehmatulla, N.; Smith, T. The impacts of carbon pricing on maritime transport costs and their implications for developing economies. Mar. Policy 2021, 132, 104653. [Google Scholar] [CrossRef]
- Faber, J.F.; Rensma, K. Left on the High Seas: Global Climate Policies for International Transport; CE Delft: Delft, The Netherlands, 2008. [Google Scholar]
- Kronbak, J.; Yang, D.; Chen, G. Effects on Sea Transport Cost Due to an International Fund for Greenhouse Gas Emissions from Ships; University of Southern Denmark: Odense, Denmark, 2009; p. 14. [Google Scholar]
- Faber, J.; Markowska, A.; Eyring, V.; Cionni, I.; Selstad, E. A Global Maritime Emissions Trading System. Design and Impacts on the Shipping Sector, Countries and Regions; CE Delft: Delft, The Netherlands, 2010. [Google Scholar]
- Grausz, S.; Purvis, N. Sink or Swim: The Economic Impacts of an International Maritime Emissions System for Greenhouse Gases on the United States; Brookings Institution: Washington, DC, USA, 2012; Available online: https://www.brookings.edu/research/sink-or-swim-the-economic-impacts-of-an-international-maritime-emissions-system-for-greenhouse-gases-on-the-united-states/ (accessed on 2 April 2022).
- Anger, A.; Faber, J.; Koopman, M.; van Velzen, A.; Long, K.; Pollitt, H.; Comberti, C.; Barker, T.; Fazekas, D.; Błachowicz, A. Research to Assess Impacts on Developing Countries of Measures to Address Emissions in the International Aviation and Shipping Sectors; Climate Strategies: London, UK, 2013. [Google Scholar]
- Sheng, Y.; Shi, X.; Su, B. Re-analyzing the economic impact of a global bunker emissions charge. Energy Econ. 2018, 74, 107–119. [Google Scholar] [CrossRef]
- Ben Brahim, T.; Wiese, F.; Münster, M. Pathways to climate-neutral shipping: A Danish case study. Energy 2019, 188, 116009. [Google Scholar] [CrossRef]
- Dessens, O.; Anger, A.; Barker, T.; Pyle, J. Effects of decarbonising international shipping and aviation on climate mitigation and air pollution. Environ. Sci. Policy 2014, 44, 1–10. [Google Scholar] [CrossRef]
- Kim, -J.H.; Chang, -T.Y. Analysis of an Intermodal Transportation Network in Korea from an Environmental Perspective. Transp. J. 2014, 53, 79–106. [Google Scholar] [CrossRef]
- Mellin, A.; Rydhed, H. Swedish ports’ attitudes towards regulations of the shipping sector’s emissions of CO2. Marit. Policy Manag. 2011, 38, 437–450. [Google Scholar] [CrossRef]
- Wu, M.; Li, K.X.; Xiao, Y.; Yuen, K.F. Carbon Emission Trading Scheme in the shipping sector: Drivers, challenges, and impacts. Mar. Policy 2022, 138, 104989. [Google Scholar] [CrossRef]
- BHP. BW, DNB, DNV GL (2019) Carbon Levy Evaluation. Available online: https://www.globalmaritimeforum.org/content/2019/10/Could-a-carbon-levy-in-shipping-be-an-effective-way-to-help-reach-the-IMO-greenhouse-gas-reduction-goals-DNV-BW-BHP-DNB.pdf (accessed on 2 April 2022).
- Kosmas, V.; Acciaro, M. Bunker levy schemes for greenhouse gas (GHG) emission reduction in international shipping. Transp. Res. Part D Transp. Environ. 2017, 57, 195–206. [Google Scholar] [CrossRef]
- European Parliament. 2022. Available online: https://www.europarl.europa.eu/doceo/document/A-9-2022-0162_EN.html (accessed on 14 June 2022).
Figure 1.
Overview of regional, national, and subnational carbon pricing initiatives. Source: World Bank [2].
Figure 1.
Overview of regional, national, and subnational carbon pricing initiatives. Source: World Bank [2].

Figure 2.
Average annual carbon intensity of individual ship types (2008–2018). Source: IMO Fourth GHG Study [3]. Note: ‘OP1′ and ‘OP2′ are the two alternative estimation methods; vessel-based in the case of OP1 and voyage-based in the case of OP2.
Figure 2.
Average annual carbon intensity of individual ship types (2008–2018). Source: IMO Fourth GHG Study [3]. Note: ‘OP1′ and ‘OP2′ are the two alternative estimation methods; vessel-based in the case of OP1 and voyage-based in the case of OP2.

Figure 3.
BAU forecasts of CO2 emissions from ships under different scenarios. Source: IMO Fourth GHG Study [3].
Figure 3.
BAU forecasts of CO2 emissions from ships under different scenarios. Source: IMO Fourth GHG Study [3].

Figure 4.
Factors that influence the costs for a ship owner.

Figure 5.
Projected pathways for the CO2 emissions of the shipping industry. Source: [35].
Figure 5.
Projected pathways for the CO2 emissions of the shipping industry. Source: [35].

Figure 6.
Marginal abatement cost curve for 2050. Source: [3].
Figure 6.
Marginal abatement cost curve for 2050. Source: [3].

Figure 7.
Assessment of fuels based on GHG reduction potential. Source: [36].
Figure 7.
Assessment of fuels based on GHG reduction potential. Source: [36].

Figure 8.
Unit cost of reducing emissions with a high renewable fuel price. Source: [35].
Figure 8.
Unit cost of reducing emissions with a high renewable fuel price. Source: [35].

Figure 9.
Unit cost of reducing emissions with a low renewable fuel price. Source: [35].
Figure 9.
Unit cost of reducing emissions with a low renewable fuel price. Source: [35].

Figure 10.
Scenario-based evolution of aggregate maritime fuel mix. Note: One petajoule (PJ) equals 1,000,000,000,000,000 joules (10 to the power of 15). A Joule is a unit of energy equaling 0.24 calories. 1 PJ = 31.6 million m³ of natural gas, or 278 million kilowatt hours of electricity. Source: [37].


Table 1.
Scenarios tested for determining emergent fuel mix.
| Regulation Scenario | Demand | Techno-Economic | |||||||||
|---|---|---|---|---|---|---|---|---|---|---|---|
| Fair Share Derived CO2 Budget (2010–2100) | MBM Start Year | Out-Sector Offsets | Trade Scenario | Fuels Option | Fuel Price | Bio Availability Scenario | Slow Steaming Constraint | NPV Year | b.tc | Technology Cost | |
| Scenario 1 | - | - | - | 2 degree SSP3 | All fuels excluding H2 | 2-degree price | Lower bound | Very limited | 3 | 50% | Full |
| Scenario 2 | - | - | - | 2 degree SSP3 | All fuels excluding H2 | 2-degree price | Lower bound | Very limited | 3 | 50% | Full |
| Scenario 3 | - | - | - | 2 degree SSP3 | All fuels excluding H2 | 2-degree price | Lower bound | Very limited | 3 | 50% | Full |
| Scenario 4 | 18 gt | 2025 | 0% | 2 degree SSP3 | All fuels | 2-degree price | Mid-range | Relaxed | 3 | 50% | Full |
| Scenario 5 | 23 gt | 2025 | 20% | 2 degree SSP3 | All fuels | 2-degree price | Mid-range | Limited | 3 | 50% | Full |
| Scenario 6 | 33 gt | 2030 | 20% | 2 degree SSP3 | All fuels | 2-degree price | Lower bound | Limited | 3 | 50% | Full |
| Scenario 7 | 33gt | 2030 | 20% | 2 degree SSP3 | All fuels | 2-degree price | Lower bound | Limited | 3 | 50% | 25% of full price |
| Scenario 8 | 33 gt | 2025 | 20% | 2 degree SSP3 | All fuels | 2-degree price | Mid-range | Limited | 3 | 50% | Full |
| Scenario 9 | 33 gt | 2025 | 50% | 2 degree SSP3 | All fuels excluding H2 | LNG low | Mid-range | Limited | 3 | 50% | Full |
| Scenario 10 | 79 gt | 2025 | 80% | 2 degree SSP3 | All fuels | LNG low | Higher bound | Relaxed | 5 | 80% | Full |
Source: Modified from [37].
Table 2.
Marine fuel price predictions from Lloyds Register and UMAS (2020) in USD/GJ.
| Primary Energy Source | Fuel | 2020 | 2030 | 2040 | 2050 |
|---|---|---|---|---|---|
| Oil | LSHFO | 8 | 11 | 11 | 11 |
| Biomass | Bio-diesel | 22 | 24 | 27 | 29 |
| Biomass | Bio-methanol wood | 23 | 25 | 27 | 30 |
| Biomass | Bio-methanol waste stream | 19 | 21 | 23 | 25 |
| Substitution price from biofuels | 9 | 19 | 26 | 33 | |
| Renewable electricity | E-diesel | 130 | 114 | 99 | 83 |
| Renewable electricity | E-methanol | 84 | 73 | 63 | 52 |
| Renewable electricity | E-LNG | 69 | 60 | 51 | 42 |
| Renewable electricity | E-ammonia | 55 | 47 | 39 | 30 |
| Renewable electricity | E-hydrogen | 52 | 44 | 36 | 28 |
| Natural gas | NG-ammonia | 28 | 26 | 24 | 23 |
| Natural gas | NG-hydrogen | 25 | 23 | 21 | 19 |
Source: Modified from [38].
Table 3.
Marine fuel price predictions from Lindstad (2021).
| Present | Future | |||||||||
|---|---|---|---|---|---|---|---|---|---|---|
| Annual operating hours with NG | 5000 | 5000 h | ||||||||
| Annual operating hours with electricity | 5000 | 5000 h | ||||||||
| Cost per KWh of NG | 0.025 | 0.025 USD/KWh | ||||||||
| Cost per KWh of electricity | 0.060 | 0.020 USD/KWh | ||||||||
| Capex and Opex DAC (direct carbon capture from air) | 0.2 | 0.01 USD per Kg of CO2 | ||||||||
| Operational energy needed for DAC | 2.6 | 1.50 per KWh/Kg of CO2 | ||||||||
| Input | Output | WTW Input/Output—MJ/MJ | Annual Capex + Opex | Annual Cost of Energy | Total Annual Cost | Cost per MWh | Present Cost USD/GJ | Future Cost USD/GJ | ||
| MGO | 510 per ton | 500 per toe | 43 | 12.0 | 12.0 | |||||
| VLSFO | 430 per ton | 440 per toe | 38 | 10.5 | 10.5 | |||||
| LNG | 445 per ton | 380 per toe | 32 | 9.0 | 9.0 | |||||
| NG | 345 per ton | 295 per toe | 25 | 7.0 | 7.0 | |||||
| Hydrogen | NG | 100% | 76% | 3.2 | 134 | 166 | 300 | 60 | 16.7 | 16.7 |
| Electricity | 100% | 60% | 3.5 | 103 | 435 | 538 | 108 | 29.9 | 13.8 | |
| Liquid Hydrogen | NG | 76% | 53% | 4.5 | 45 | 428 | 473 | 95 | 26.3 | 26.3 |
| Electricity | 69% | 48% | 5.0 | 42 | 768 | 810 | 162 | 45.0 | 22.0 | |
| Ammonia | NG | 76% | 63% | 3.8 | 113 | 361 | 474 | 95 | 26.4 | 26.4 |
| Electricity | 69% | 57% | 4.2 | 102 | 648 | 750 | 150 | 41.6 | 22.2 | |
| E-LNG | Electricity | 69% | 46% | 5.2 | 103 | 803 | 906 | 181 | ||
| DAC | 7% | 242 | 136 | 378 | 76 | |||||
| 69% | 40% | 6.1 | 939 | 1284 | 257 | 71.3 | 32.0 | |||
| E-Diesel | Electricity | 69% | 43% | 106 | 862 | 969 | 194 | |||
| DAC | 9% | 327 | 230 | 556 | 111 | |||||
| 69% | 34% | 7.1 | 1092 | 1525 | 305 | 84.7 | 36.3 | |||
| E-Methanol | Electricity | 69% | 46% | 5.2 | 68 | 810 | 878 | 176 | ||
| DAC | 9% | 316 | 191 | 507 | 101 | |||||
| 69% | 37% | 6.5 | 1001 | 1385 | 277 | 76.9 | 32.2 | |||
Source: Modified from [36].
Table 4.
Marine fuel price predictions from [39].
Table 4.
Marine fuel price predictions from [39].
| 2019 | 2020 | 2021 | 2022 | 2023 | 2024 | 2025 | 2026 | 2027 | 2028 | 2029 | 2030 | |
|---|---|---|---|---|---|---|---|---|---|---|---|---|
| H2 (350 Bar) | 65,000 | 64,090 | 63,180 | 62,270 | 61,360 | 60,450 | 59,550 | 58,640 | 57,730 | 56,820 | 55,910 | 55,000 |
| H2 (Liquid) | 77,350 | 76,267 | 75,184 | 74,101 | 73,018 | 71,936 | 70,865 | 69,782 | 68,699 | 67,616 | 66,533 | 65,450 |
| Ammonia (20 Bar) | 10,760 | 10,609 | 10,459 | 10,308 | 10,158 | 10,007 | 9858 | 9707 | 9557 | 9406 | 9255 | 9105 |
| MGO | 8852 | 8852 | 8852 | 8852 | 8852 | 8852 | 8852 | 8852 | 8852 | 8852 | 8852 | 8852 |
| LNG | 7912 | 7912 | 7912 | 7912 | 7912 | 7912 | 7912 | 7912 | 7912 | 7912 | 7912 | 7912 |
| LBG | 14,618 | 14,853 | 15,088 | 15,324 | 15,574 | 15,824 | 16,074 | 16,324 | 16,588 | 16,853 | 17,118 | 17,382 |
| Biodiesel | 14,026 | 14,128 | 14,385 | 14,615 | 14,769 | 15,192 | 15,423 | 15,654 | 15,897 | 16,038 | 16,167 | 16,308 |
| Electricity | 0.51 | 0.51 | 0.5 | 0.58 | 0.59 | 0.61 | 0.63 | 0.62 | 0.61 | 0.60 | 0.59 | 0.58 |
Notes: (1) Prices are those payable by businesses (i.e., including taxes, but excluding VAT) and are given in NOK per tonne of fuel, or NOK per kWh (electricity), and are assumed to be constant as of 2030. Source: Modified by the authors from [39]).
Publisher’s Note: MDPI stays neutral with regard to jurisdictional claims in published maps and institutional affiliations. |
© 2022 by the authors. Licensee MDPI, Basel, Switzerland. This article is an open access article distributed under the terms and conditions of the Creative Commons Attribution (CC BY) license (https://creativecommons.org/licenses/by/4.0/).
Share and Cite
MDPI and ACS Style
Cullinane, K.; Yang, J. Evaluating the Costs of Decarbonizing the Shipping Industry: A Review of the Literature. J. Mar. Sci. Eng. 2022, 10, 946. https://doi.org/10.3390/jmse10070946
AMA Style
Cullinane K, Yang J. Evaluating the Costs of Decarbonizing the Shipping Industry: A Review of the Literature. Journal of Marine Science and Engineering. 2022; 10(7):946. https://doi.org/10.3390/jmse10070946
Chicago/Turabian StyleCullinane, Kevin, and Jialin Yang. 2022. "Evaluating the Costs of Decarbonizing the Shipping Industry: A Review of the Literature" Journal of Marine Science and Engineering 10, no. 7: 946. https://doi.org/10.3390/jmse10070946
Note that from the first issue of 2016, this journal uses article numbers instead of page numbers. See further details here.