Article

The Role of Microplastics in Marine Pathogen Transmission: Retrospective Regression Analysis, Experimental Design, and Disease Modelling

1
Department of Applied Mathematics, Engineering School of Bilbao, University of the Basque Country (UPV/EHU), Plaza Ingeniero Torres Quevedo 1, 48013 Bilbao, Spain
2
Research Centre for Experimental Marine Biology & Biotechnology, Plentzia Marine Station, University of the Basque Country (PiE-UPV/EHU), Areatza Pasealekua, 48620 Plentzia, Spain
3
CITMAga, 15782 Santiago de Compostela, Spain
4
Department of Statistics and Operations Research, SIDOR Research Group, University of Vigo, 36310 Vigo, Spain
5
AZTI Marine Research, Basque Research and Technology Alliance (BRITA), Herrera Kaia, Portualdea z/g, 20110 Pasaia, Spain
6
Department of Plant Biology and Ecology, Faculty of Science and Technology, University of the Basque Country (UPV/EHU), Sarriena Auzoa z/g, 48940 Leioa, Spain
7
Department of Plant Biology and Ecology, Faculty of Pharmacy, University of the Basque Country (UPV/EHU), Paseo de la Universidad 7, 01006 Gasteiz, Spain
*
Author to whom correspondence should be addressed.
J. Mar. Sci. Eng. 2022, 10(12), 1837; https://doi.org/10.3390/jmse10121837
Submission received: 27 October 2022 / Revised: 24 November 2022 / Accepted: 24 November 2022 / Published: 30 November 2022
(This article belongs to the Special Issue Microplastic Pollution in the Ocean)

Abstract

:
Marine wildlife and aquaculture species can accumulate large amounts of marine microplastic debris (MMD) (<1 mm) carrying pathogens, thus threatening the health of marine ecosystems and posing a risk to food safety and human health. Here, we outline a theoretical three-perspective approach for studying the relationship between MMD and disease. First, we provide a framework for retrospective analysis of MMD and pathogen loads in marine animal tissues to assess the relationship between these and other environmental variables in order to decide whether a compound or pathogen should be considered an emerging substance or organism. Second, we describe an experimental design for testing the effects of a variety of microplastics on infection intensity in two model species (oysters and zebrafish). Finally, we create a theoretical susceptible–infected microplastic particle and pathogen transmission model for bivalves and fish. Overall, the experiments and models we propose will pave the way for future research designed to assess the role of MMD as a vector for marine and human pathogens. This multi-faceted approach needs to be an urgent priority of the EU Strategic Research Innovation Agenda for addressing marine disease challenges related to MMD.

1. Introduction

Marine microplastic debris (MMD; plastic particles <1 mm in diameter) is an emerging, human-induced threat to the world’s seas and oceans [1]. Annual plastic production continues to rise [2,3], and the continued degradation of larger plastic items [4] further increases the abundance of MMD and therefore the risk of wildlife being exposed to it [5]. Given the small size of microplastics, organisms from diverse trophic levels are capable of ingesting and accumulating these particles. In the marine food web, microplastics can be found in organisms ranging from zooplankton [6] to fish [7,8], including large pelagic fish [9] and whales [10]. The bioaccumulation of MMD is an emerging risk to the health of marine ecosystems, and, in turn, to food safety and human health [11,12,13]. Marine invertebrate filter-feeders such as bivalves [12,14,15] are particularly susceptible to MMD accumulation because they process large amounts of water while feeding [16].
In the last decade, large-scale policy recommendations and government-sponsored programs have increased public awareness of marine MMD. At the same time, most scientific investigations have primarily focused on the distribution of MMD in seas and oceans [17,18], its presence in diverse organisms, and its toxicology [19,20,21]. Diverse pathogens have been found in the ocean’s plastisphere, which is the microbial community that adheres to microplastics. This microbiome is distinct from the surrounding seawater and can include human, fish, and bivalve pathogens [22,23,24]. Nevertheless, little is known about the virulence and disease dynamics associated with pathogens attached to MMD, and a comprehensive risk assessment is still far away for marine ecosystems, food safety, and public health [25]. We believe that exploring the role of MMD in the transmission of marine and human pathogens across the diversity of marine biota from zooplankton to bivalves and fish should be an important component of future MMD research.
This first requires research on how MMD contributes to the emergence of marine diseases. Marine diseases may emerge as a result of novel introductions, climate change, changes in vector populations, and the introduction of novel vectors. The assessment and management of future disease risks depends on understanding the causes of historical and contemporary disease emergence events [26]. However, because MMD is a newly recognized form of environmental pollution, there is little information on the historical prevalence of MMD. Indeed, MMD monitoring programs were non-existent until recently [27,28], mostly due to the lack of methods for routine MMD quantification [29]. Researchers have recently attempted to quantify MMD in samples collected for zooplankton analysis; the results appear to be promising and could therefore provide low-cost methods for data collection on MMD in the water column [30].
Abundance and mass of MMD has importantly increased worldwide alongside the global increase in plastic production [31,32]. However, researchers have not yet confirmed a corresponding global increase in MMD concentrations in marine organisms. One approach to obtaining such confirmation would be performing a retrospective study on the occurrence of MMD and the prevalence of major pathogens in biological samples from environmental specimen banks. Such a study would allow for a better evaluation not only of the concrete threat posed by MMD and major pathogens but also of the effect of MMD on disease ecology.
The role of MMD in the transmission of marine pathogens also needs to be addressed by conducting experimental studies that explore both microplastic uptake by different organisms and disease transmission among these same organisms based on the understanding that microplastics can be carriers of chemicals and pathogens. For example, persistent chronic pollution has been linked to pathological alterations in bivalves and a higher prevalence and intensity of parasites, including Rickettsia/Chlamydia-like organisms (R/CLO) in shellfish [33]. Indeed, the uptake of chemicals from ingested MMD has been suggested to decrease the capacity of bivalves to fight off pathogenic bacteria [34]. Microplastic exposure also activates stress responses and suppresses immune function in corals [35,36]. Experiments also need to consider the plastic type and particle size [37]. These factors affect not only the biofilm formation rate [38] but also the rate at which marine organisms ingest and accumulate the plastic [12] as well the plastic’s toxicity [39]. Some of the pathogens within these plastisphere biofilms, including various Vibrio species, are extremely virulent [22,23,24] for both marine organisms (bivalves, fish, etc.) and humans [40,41,42,43].
The transmission of MMD-carried pathogens potentially poses a serious risk to wildlife, food safety, and human health. Based on these concerns and knowledge gaps, we here describe three key approaches for studying the role of MMD on marine disease transmission: (i) a retrospective analysis of the interaction between MMD and disease in the context of other environmental variables; (ii) an experimental design for studying the uptake of MMD-carrying pathogens by marine organisms and the associated effects on disease transmission; and (iii) a quantitative and theoretical basis for modelling disease processes associated with MMD ingestion in marine organisms. These three objectives need to be parallel, interconnected, and urgent research objectives in future EU research agendas. We also present some theoretical results that we discuss in relation to the potential mechanisms by which MMD ingestion affects pathogen transmission in marine organisms.

2. Materials and Methods

2.1. Retrospective Analysis

Data on historical MMD concentrations and pathogen loads in bivalves, as well as data on other environmental parameters (e.g., temperature), can be used to determine the environmental factors that facilitate and limit the exposure of filter feeders to MMD and pathogens. In this context, the environmental parameters act as inputs in multivariate regression models predicting MMD or pathogen load.
In a general way, a regression model describes the relationship between a response variable, Y, and some explanatory variables, X = ( X 1 ,..., X p ). The explanatory variables are also known as covariates. Such a multivariate model is defined as:
Y = m ( X ) + ε
where m ( · ) is the mean function and ε is the regression error.
The simplest form of regression analysis is a linear regression, which serves as a good jumping-off point for newer or advanced modelling approaches that generalize or extend this method. In a linear regression, the response variable is assumed to follow a normal distribution, and the effect of the covariates on the response is assumed to be linear. The problem with this simple model is that in most real-world contexts, including in the study of MMD prevalence, the response variable is not normally distributed. Instead, the response variable might follow a discrete distribution, such as a Poisson distribution. For these situations, generalized linear models (GLMs) [44,45] extend simple linear ones by allowing the use of other distribution families to model the response variable. In a GLM, the relationship between the mean response and the covariates is modelled by:
E [ Y | X ] = η ( β 0 + β 1 X 1 + + β p X p ) ,
where η ( · ) is a known monotonic function (the inverse of the link function). Once the distribution of the response variable has been determined, we must also determine whether the effect of the covariates on the response is linear. Although simple and generalized linear models have been widely used, their parametric assumption of linear effects is very restrictive and, in certain circumstances, not supported by the data. If the parametric model is inappropriate for the data, the conclusions from the model will be erroneous. In this case, nonparametric regression techniques can be used to model the dependence between Y and X without needing to specify in advance the function that links the covariates to the response. This family of models is called generalized additive models (GAMs) [46] and is defined by:
E [ Y | X ] = η ( α + f 1 ( X 1 ) + + f p ( X p ) ) ,
where η ( · ) is a known monotonic function (the inverse of link function) and f 1 , , and f p are smooth, unknown, continuous functions. A large body of literature has been devoted to finding techniques for estimating the regression model in Equation (1). Two of the most widely used approaches are splines [47,48] and kernel smoothers [49,50]. Spline smoothing involves modelling a regression function as a piecewise polynomial where the number of pieces is relatively high compared to the sample size. The performance of this technique is governed by the number and position of knots used to calculate the estimator. Despite considerable research effort [51], the difficult problem of knot selection has not been totally solved. Our continued research on the topic of marine microplastics includes the development of a new methodology that will allow us to estimate any type of unknown curve, compare the results with other existing estimation procedures, and use simulations to study the performance of our method in a finite sample.
Another option for fitting GAMs is local regression based on kernel smoothers; this method involves computing the fit at a point x 0 using only the nearby observations. A key advantage of kernel smoothers is their use of binning techniques [52], which greatly reduce the computational time and thus enable the model to be adequately solved in practical situations. However, kernel smoothers require the user to choose the bandwidth parameters, which can have a large effect on the obtained parameter estimates. Different studies have proposed various methods for choosing the optimal bandwidth, including generalized cross-validation [53], plug-in methods [54], and bootstrap techniques [55].
Variable selection is another important issue when developing a multivariate regression framework, especially when the number of covariates is large enough. Inferences based on models with only a few variables can be biased; conversely, models that use too many variables may result in a lack of precision or false-positive effects. The so-called model selection problem arises from the need to ensure that a model is neither under- nor over-fitted [56]. The literature describes several procedures for solving this problem and choosing the optimal set of variables; these methods can include shrinkage regression (e.g., the Lasso [57,58]), Bayesian approaches [59,60,61], iterative procedures such as stepwise selection based on the use of some information criteria [62,63,64], or the use a full information-criteria-based approach [65].
The multivariate regression methodology described above can easily be used to investigate the abundance of MMD in bivalves, both at present and over time, with the aim of determining the environmental and food-chain-associated human health risks of MMD. For example, such a regression could be applied to retrospective data on microplastic concentrations and pathogen prevalence in bivalve tissue samples from biospecimen banks spanning the last few decades. For this analysis, MMD abundance could be determined in bivalve tissues using polarized light microscopy following the recommendations of recent studies [66]. In addition, the prevalence of shellfish and human pathogens, as well as histopathological alterations, could be scored using either quantitative or semi-quantitative scales [67]. The results of this retrospective study would help assess current and historical trends in the accumulation of microplastics and pathogens in marine filter-feeders as well as the relationship between microplastic accumulation and pathogen prevalence. When combined with information on the ecotoxicology and pathogenicity of a given pathogen, these exposure and prevalence data can be helpful for deciding whether a compound or pathogen must be considered as an emerging substance or organism.
In addition to the multivariate regression modelling approach predicting both MMD and pathogen loads in bivalves based on a suite of environmental variables, some industry evolution data can be included in the predictor data pool. This final model could be evaluated using a specific stepwise method; in this case, we suggest a forward stepwise-based selection procedure that both (i) selects the best combination of variables and (ii) determines the optimal number of covariates to include in the model. This type of analysis would provide valuable information for understanding which factors or variables from the plastic industry, in addition to the physiochemical environment, are involved in the temporal trends of microplastic occurrence and pathogen prevalence in marine animals. The results from such a model would also have important implications for future studies of the ecological and seafood-related risks of microplastics.
In this study, we present an example of this type of analysis by GAMs to analyse (i) the effect of different environmental variables on microplastic abundance (number of occurrences of microplastics g 1 ) and infection intensity (number of occurrences of pathogens g 1 ) in mussels and (ii) the relationship between microplastic abundance and infection intensity. Explanatory variables in the first model included river flow rate (m 3 s 1 ), salinity, temperature (°C), dissolved oxygen (%, percent dissolved oxygen saturation), salinity stratification index, and chlorophyll concentrations (mg m 3 ). These data were obtained from monthly samplings from 1998 to 2015 on the Basque coast (estuaries of Bilbao and Urdaibai), north Spain (43 ° 24.2 N 2 ° 41.7 W), using the material and methods described in Iriarte et al. [68]. The response variables were constructed theoretically. We used the log function as a link and thin plate regression splines as a smoothing basis. The optimal number of degrees of freedom was chosen via (generalised) cross-validation [69], and parameter estimation was performed using the mgcv package [70] in R [71].

2.2. Experimental Studies

To better understand the global risks of MMD particles as disease vectors, basic experimental research is needed on how MMD–pathogen interaction affects emerging marine disease dynamics. Such studies are essential for generating the knowledge needed to mitigate both marine ecosystem degradation and the human health risks of marine pathogens.

2.2.1. Oysters as an Experimental Model

In the context of MMD, bivalves and other filter-feeders are distinct because they can filter out and therefore accumulate MMD from the water column [72], making them particularly susceptible to pathogens [41]. They are also important vectors for seafood-borne human pathogens [73] that are adhered to microplastics [74]. Due to their tremendous filtration capacity (up to 8 litres of seawater per hour [16]), oysters are one of the best model organisms for experimental studies exploring how marine organisms uptake MMD and the role of microplastics in pathogen transmission.
The experimental setup may emphasize one or more of the following aspects of MMD (Figure 1A): (1) the role of microplastic size or type on its uptake in bivalves; the relationship of this uptake with (2) the in vivo accumulation or removal of pathogens (e.g., the phagocytic activity of hemocytes); and (3) the infection intensity of bivalve pathogens. Microplastic types and sizes for the experiments can be chosen from irregular polyethylene and polyethylene terephthalate fragments in the shape of fibres, spheroids, granules, pellets, flakes, or beads. Particle sizes should be in the range of 0.1–5000 μ m.
For the study design, oysters should be deployed in tanks and exposed to MMD for 1–5 weeks to obtain stressed oysters for subsequent trials. Stress in oysters can be assessed by studying a variety of stress responses such as tissue alteration, immune alteration, DNA damage, oxidative stress, altered lipid and glucose metabolism, and a reduced clearance rate of pathogenic organisms [75,76]. By comparing MMD-stressed and non-stressed oysters, researchers can evaluate how the uptake of chemicals adhered to the surface of MMD may affect the oysters’ capacity to remove (or resist) pathogenic bacteria [34,35,36]. In this theoretical experimental setting, three important experimental trials can be conducted. First, oysters can be exposed to microplastics of different types and sizes at varying concentrations (e.g., 10 and 1000 μ g L 1 ) (Figure 1A, top panel) and for different periods of time (e.g., 1–5 weeks). This exposure would be performed under static conditions using similar protocols as [76]. Second, oysters can be exposed to different Vibrio spp. concentrations in the water column (from 10 3 to 10 7 cells L 1 ) (Figure 1A, mid panel). By analysing the bacterial load of oyster samples at the end of the exposure period (e.g., as culturable Vibrio counts), researchers can assess the incidence of Vibrio in terms of pathogen infection intensity. Third, oysters can be exposed to microplastics with adhered Vibrio spp. (Figure 1A, bottom panel) and then assessed for the incidence of Vibrio as in the second experiment. These three trials would ideally be conducted for both stressed and non-stressed oysters at varying temperatures and oyster densities. These trials could also be performed in systems that include non-focal hosts such as tunicates (T in Figure 1B) in order to assess the disease-diluting effect of other filter-feeders in the same ecosystem [77].

2.2.2. Zebrafish as an Experimental Model

Another valuable model system for studying the role of microplastics in pathogen transmission is the zebrafish (Danio rerio). Zebrafish are already one of the most important models in environmental toxicology and developmental biology and are rapidly becoming a major model in studies of animal and human health and disease. The zebrafish has a long and extremely successful history as a model organism for many biological processes ranging from development to bacterial pathogenesis [79,80], including the pathogenesis of aquatic pathogens such as Vibrio spp. [43,81,82]. Other studies have also investigated the uptake and accumulation of polystyrene microplastics in zebrafish tissue, e.g., [83]. Experimentally studying the role of microplastics as vectors of aquatic pathogens in such a well-established model system is particularly valuable because the biology of zebrafish is already thoroughly understood, allowing researchers to easily identify the risks posed by these various processes. Moreover, because zebrafish larvae are transparent, researchers can visualize the in vivo uptake and accumulation of microplastics and pathogens using fluorescently labelled pathogens and microplastic particles. These observations may be crucial for studying the behaviour of the host–microplastic–pathogen system.
Overall, studies using zebrafish could determine whether the uptake and transmission of pathogens in fish is affected by the presence of microplastics. Future experiments in the zebrafish model should address the basic but unanswered questions about host–microplastic–pathogen dynamics; for example, will microplastics alter the bioavailability, uptake route, or transmission of pathogens such as Vibro spp.? Will the transmission of pathogens through microplastics be similar for different types and sizes of plastic? Will it be similar in adult fish and larvae?
To analyse the behaviour, accumulation, and transfer of microplastic-associated pathogens in adult and larval zebrafish, researchers can use different sizes and types of fluorescently labelled microplastics as well as a model pathogen (carrying a plasmid that encodes green fluorescent protein) representative of aquatic bacterial pathogens. Six-month old zebrafish are sufficient for experiments with adult zebrafish, and zebrafish at five days post-fertilization may be suitable for the larval experiments. Microplastic accumulation could be assessed in the gills, gut, and intestines based on fluorescence intensity. In parallel, pathogen infection levels can be assessed with histological analyses in adults and fluorescence tracking in larvae. By taking advantage of the transparency of zebrafish larvae and using a genetically engineered fluorescent model pathogen, researchers can observe the active uptake and colonization of MMD-associated pathogens.
As in the oyster model, the zebrafish model could use a similar combination of microplastic types/sizes, microplastic concentrations, experimental durations, treatment types, and pathogen concentrations (Figure 2A). As a result, the zebrafish experiment will investigate the role of microplastic size and type on the plastic uptake and accumulation rate as well as the relationships between microplastic uptake, pathogen accumulation, and infection intensity in both adults and larvae. Alternative experiments could investigate the transmission of MMD and pathogens through the food chain by feeding zebrafish with brine shrimp (Artemia nauplii) that have already accumulated MMD and pathogens.

2.3. Disease Transmission Modelling

The results obtained from these controlled experimental studies, in combination with previously published data, would provide the empirical and theoretical information needed to understand the role of microplastics as a transmission vector for bivalve, fish, and human pathogens. Specifically, these data can be used to develop and parameterize epizootiological and epidemiological models. In this study, we use continuous-time compartmental models adapted from previous susceptible–infected-particle-filtration-type disease dynamic models, e.g., [77,84]. Note that by using a combination of empirical data and disease transmission models, researchers can also build relationship models to describe the links between microplastic pollution, microplastic uptake, toxicological effects, and Vibrio infections.

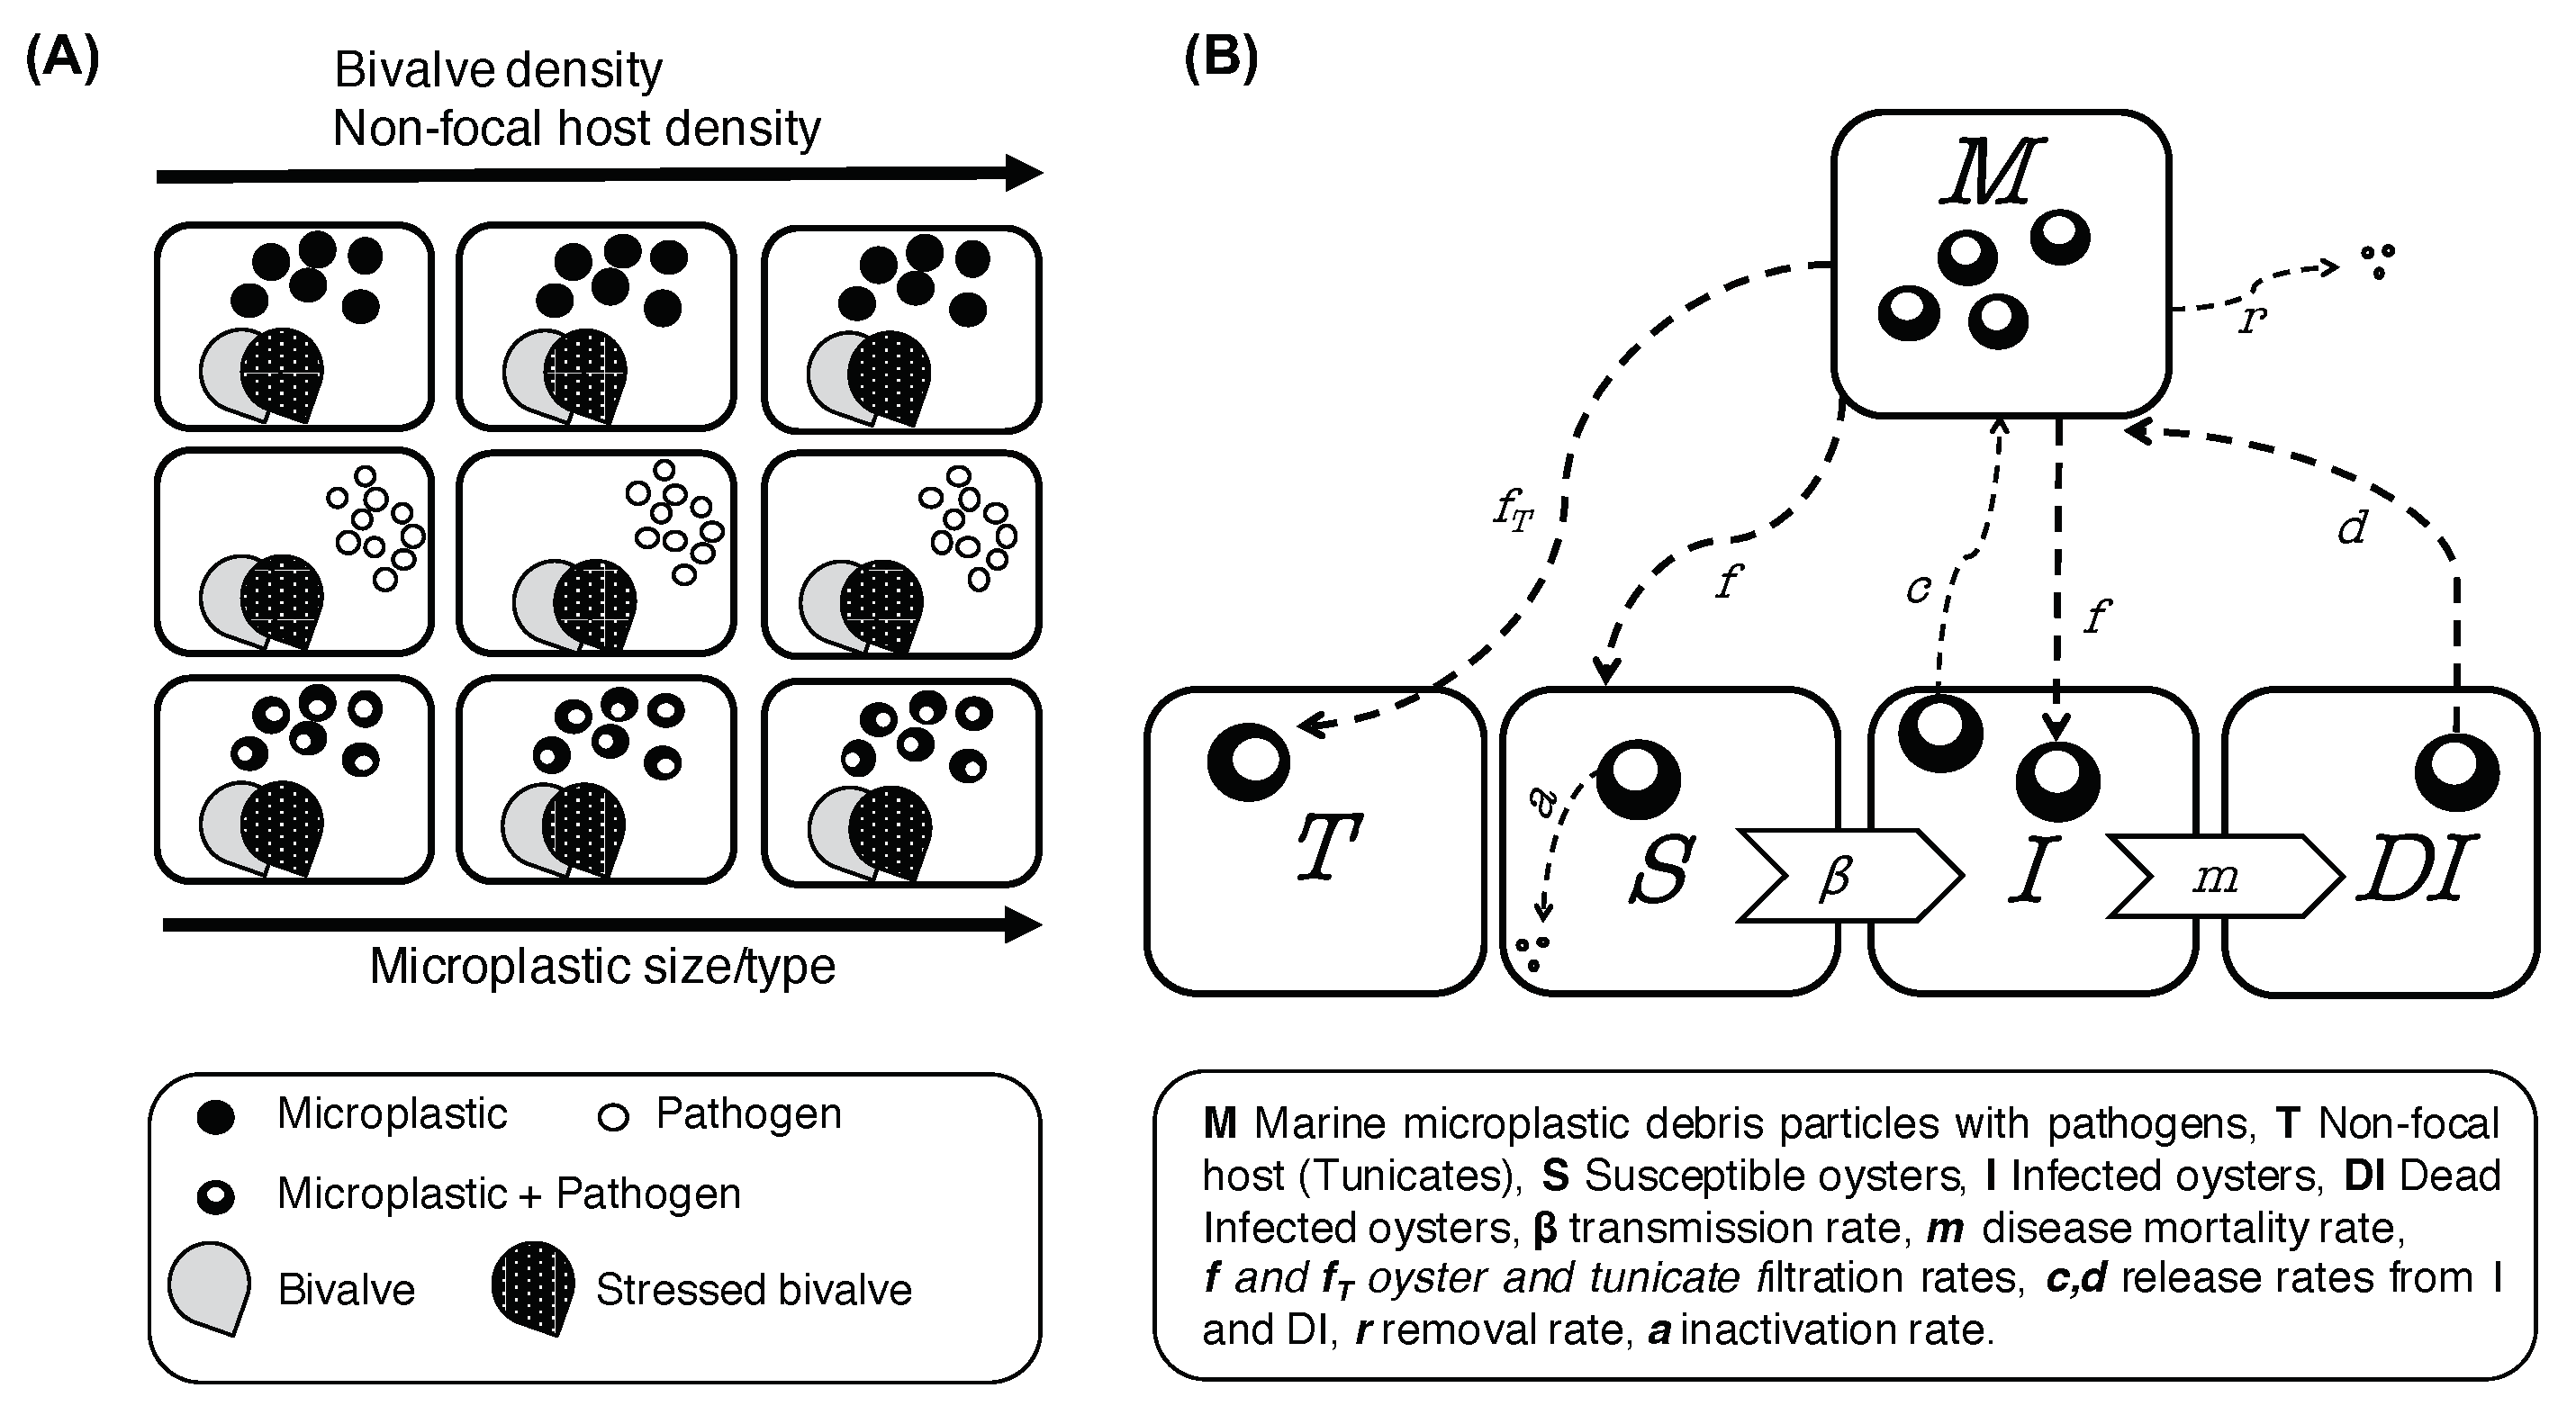
2.3.1. Model Schemes

Figure 1B and Figure 2B show flow diagrams of the disease transmission models for suspension bivalves and fish, respectively, highlighting the important processes involved in disease transmission. We refer to these models as the bivalve–microplastic–Vibrio and fish–microplastic–Vibrio disease transmission models, respectively.
In both compartmental susceptible/infected-type models, the pathogen is attached to particles of M M D ; these particles are represented by M in the models. The pathogen is then transmitted to the susceptible population S at a rate β through either filtration or ingestion of M at a rate f. Infected animals I die according to a disease mortality rate m. Particles are removed in vivo from individuals in each population at a rate a by internal inactivation processes, and particles are removed from the water column at a rate r by diffusion/advection and decay processes. The bivalve model includes a non-target host population (T) that is immune to and importantly inactivates pathogens. The zebrafish model includes adult (subindex A) and larvae (subindex L) subpopulations. A detailed description of the variables, parameters, and units for each model can be found in Table 1 and Table 2.
The two theoretical models described here (bivalve and zebrafish) are different from each other because they include the differentiated mechanisms and processes involved in disease transmission in each organism. The main differences are the following: (1) In the bivalve model (Figure 1), an alternative host, tunicates T, competes for waterborne pathogens with the susceptible host. This alternative host is resistant to the disease and does not release particles to the water. Pathogens filtered by T are assumed to be inactivated by the immune system or by diapedesis. (2) In the zebrafish model (Figure 2), populations are subdivided into adults and larvae. The modelled processes are allowed to occur at different rates for fish adults (subindex A) and larvae (subindex L), and larvae mature into adults at a rate g.

2.3.2. Model Assumptions

The two disease transmission models track waterborne environmental pathogens attached to microplastic particles. The pathogen–microplastic complex drifts through the water and is either filtered (by bivalves) or ingested (by fish). For simplicity, the model assumes no natural mortality for hosts; infected individuals only die due to disease. Background mortality could be incorporated in more complex models for slow-progression diseases. The model also assumes no natural mortality and total inactivation of particles in the non-focal hosts T.
The models also assume that populations are closed (i.e., demographic turnover processes such as reproduction and migration are not included in either model). In addition, the models assume that no animals recover from the disease once infected. Indeed, there are only a few examples of disease recovery in the marine realm [85,86,87]. Finally, parameterization of the model is standardized to represent (i) a square meter of the environment for bivalves and (ii) a cubic meter of the environment for particles and fishes. As a result, units in the bivalve model are individuals per square meter and units for population size are individuals per cubic meter, as in [84]. The variables and parameters of the model related to the host can be adapted to experimental information as the level of stress of oysters in the case for which they are exposed to microplastics prior to being exposed to microplastics with pathogens.

3. Results

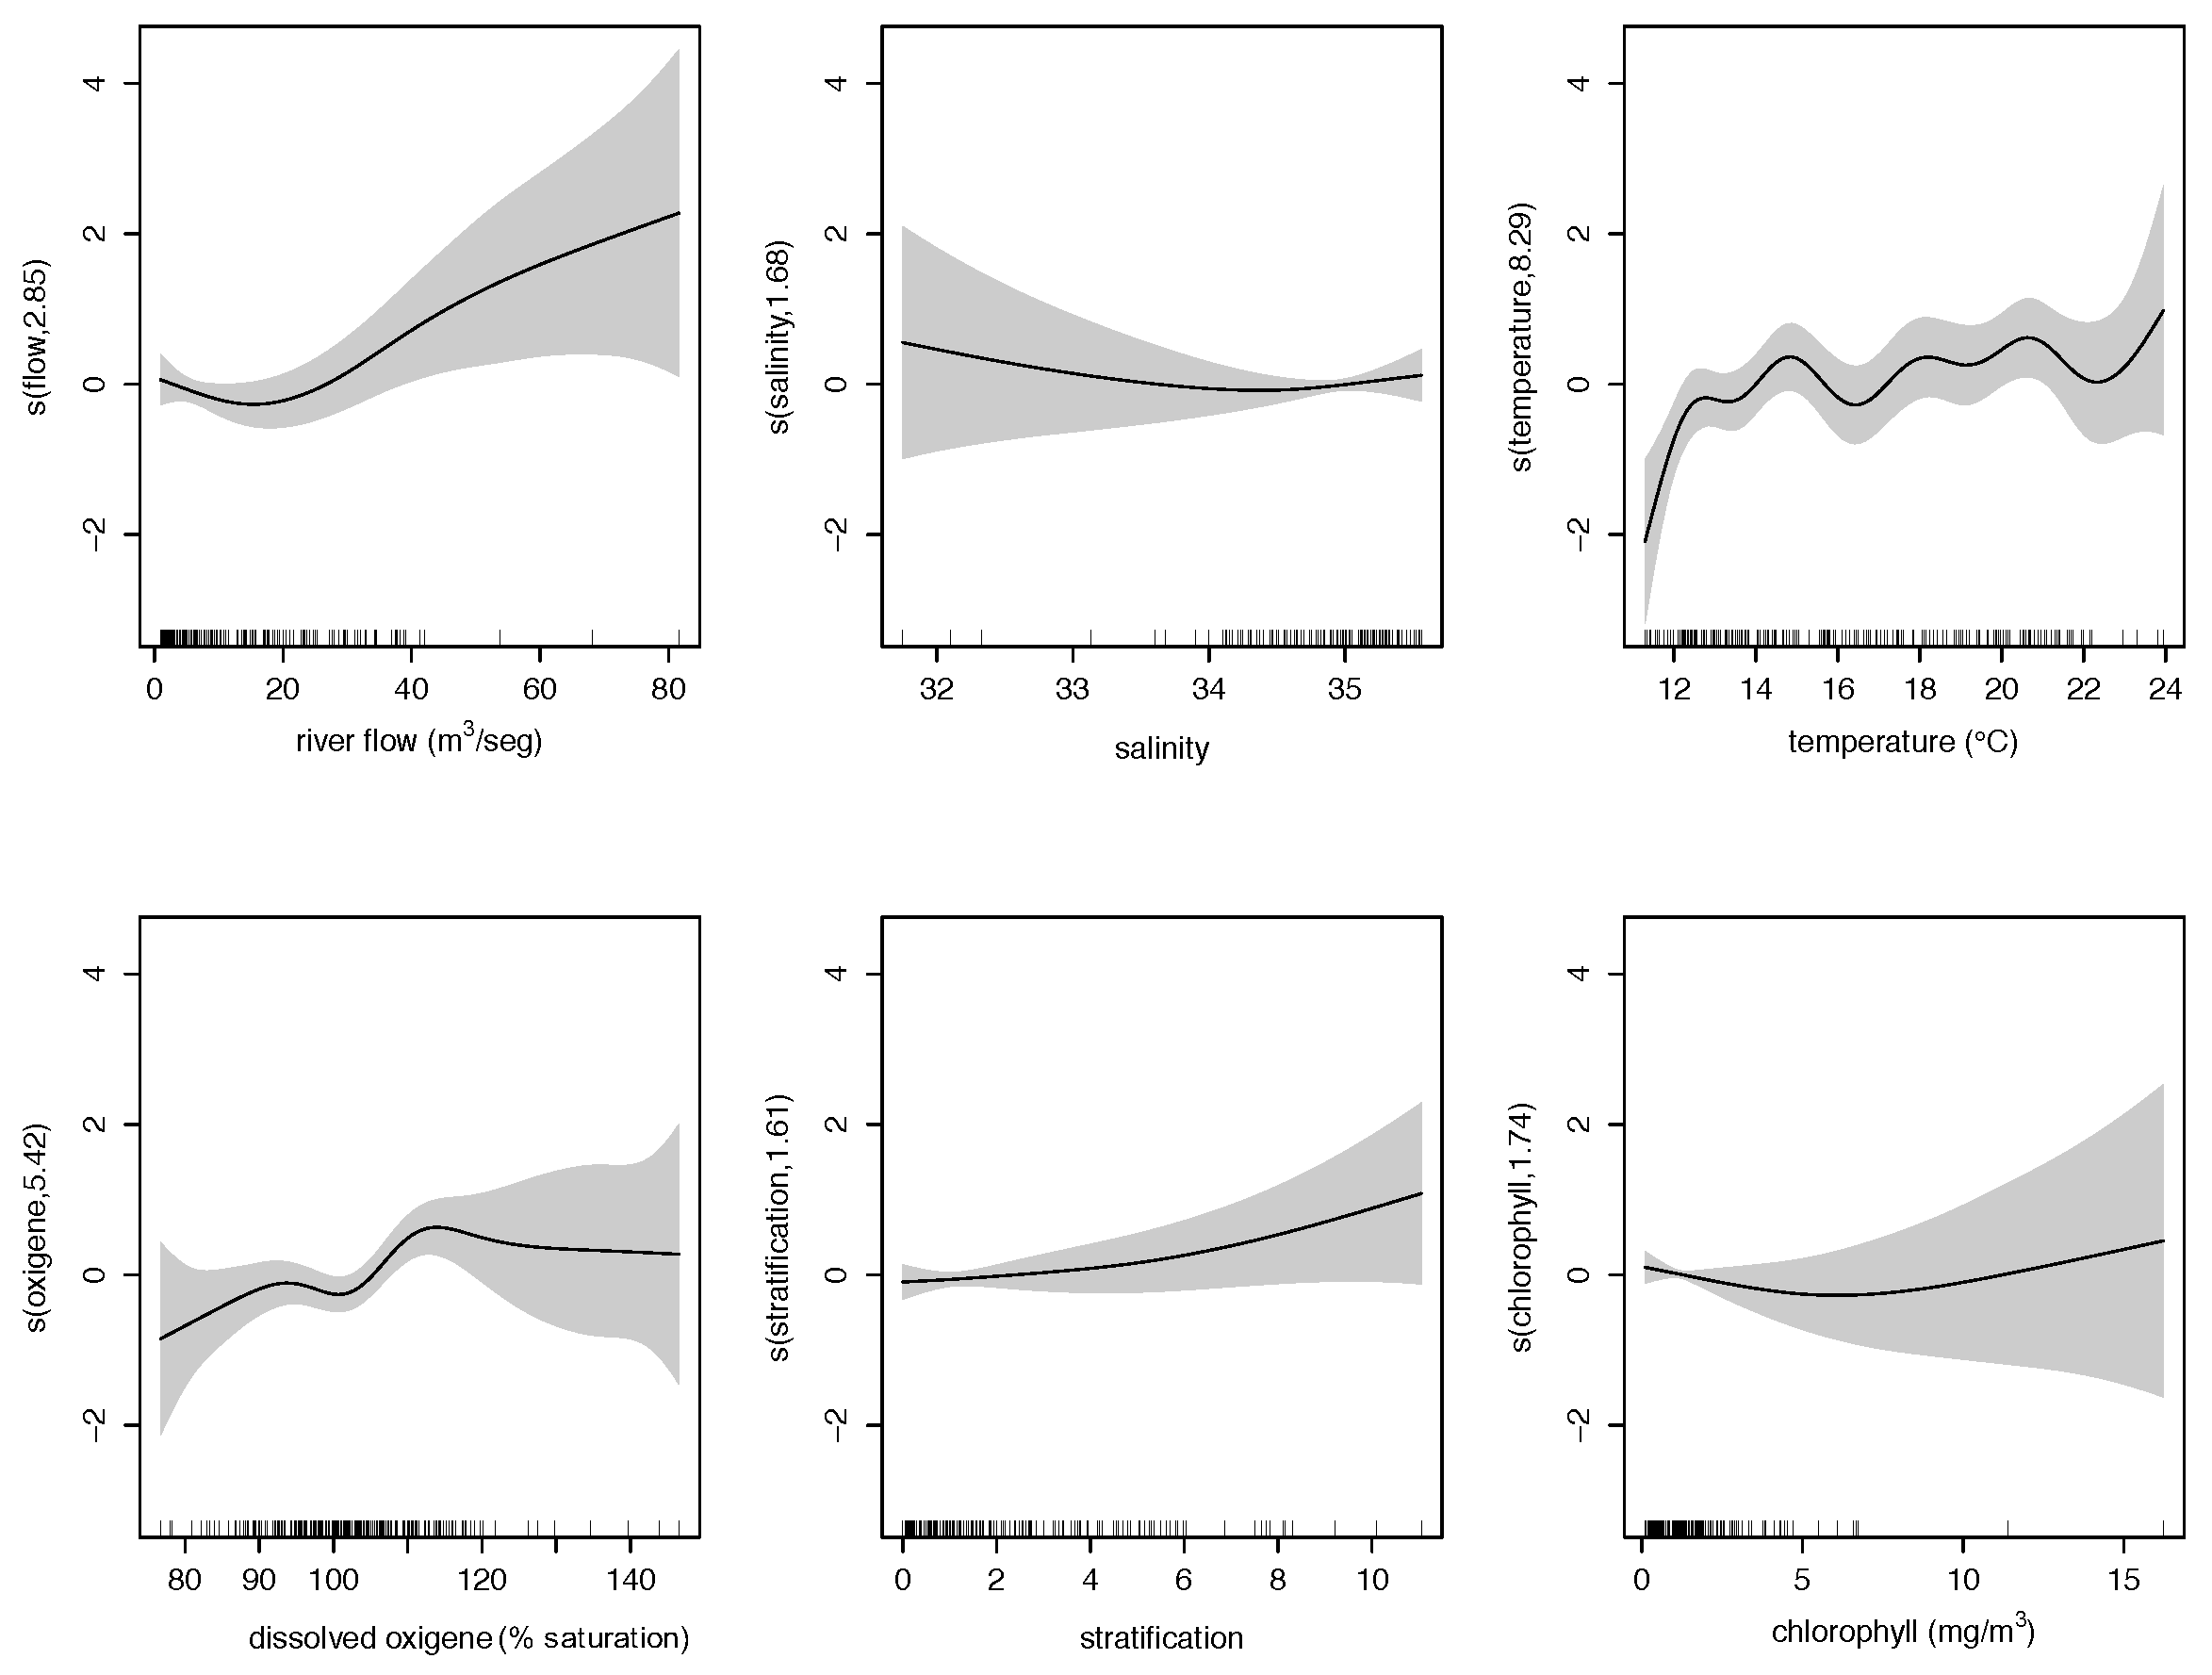
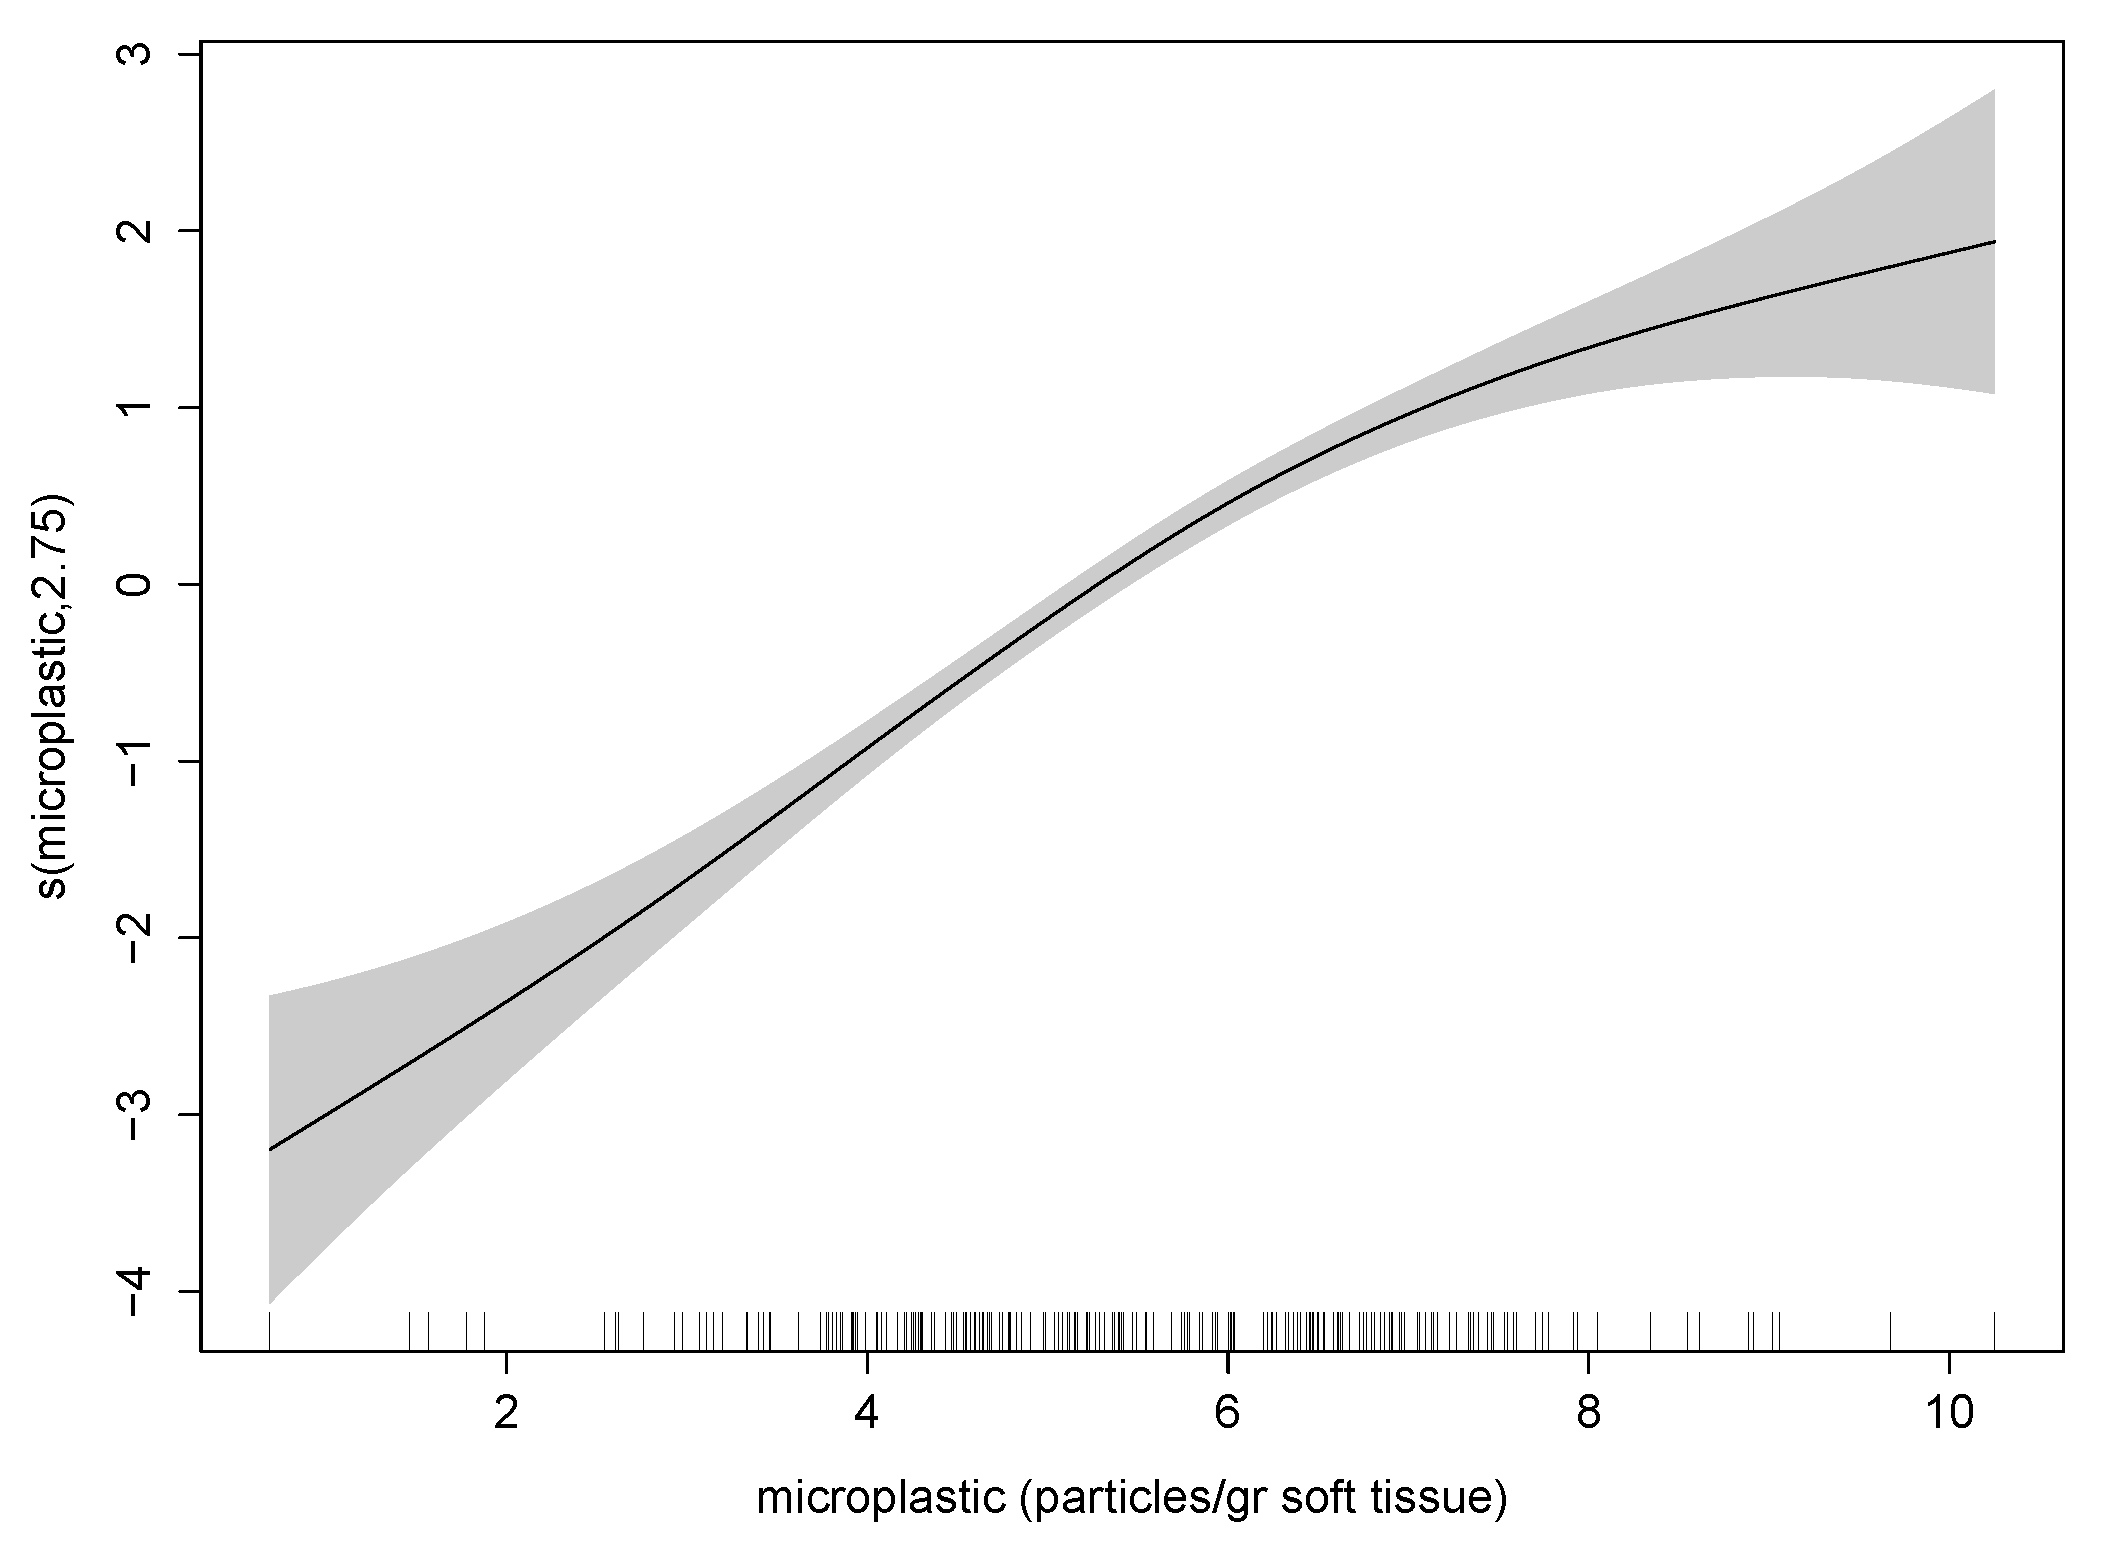
3.1. Retrospective Multivariate Modelling

Figure 3, Figure 4 and Figure 5 show the response plots from our theoretical GAM examples. The output shown in these figures allows researchers to study the relationship between the various environmental variables and the response variables (either the abundance of microplastics in the organisms (Figure 3) or infection intensity (Figure 4). In our models, salinity, temperature, dissolved oxygen, and especially the stratification index showed a positive relationship with microplastic abundance (Figure 3). River flow rate and chlorophyll concentrations also had an overall positive effect on microplastic abundance, with relative maximums or minimums observed along the measured ranges of the two variables (Figure 3).
With the exception of salinity, all the explanatory variables that we considered also had a positive effect on infection intensity. In the case of dissolved oxygen and temperature, infection intensity increased as these variables increased but then reached a maximum beyond which it remained within a range of high values with little oscillation (Figure 4).
Lastly, we analysed the relationship between the two response variables (microplastic abundance and infection intensity) (Figure 5). This relationship was significantly positive, with infection intensity increasing alongside microplastic abundance, though the relationship was weaker at higher values of microplastic abundance. Continued empirical retrospective studies of this relationship are critical for gaining further insight into the emergence of diseases due to the transmission of pathogens adhered to MMD.

3.2. Pathogen Transmission Modelling

The host and pathogen states or subpopulations (variables) of bivalve– and fish–microplastic-Vibrio models satisfy a system of ordinary differential equations describing the dynamics of the host–pathogen association. The variables and parameters for these models are described in Table 1 and Table 2. We programmed the numerical models for these systems in MATLAB and solved them with a fourth-order predictor corrector scheme using the Adams–Bashforth predictor and the Adams–Moulton corrector. The system of differential equations in each of the two models comprises the following differential equations:

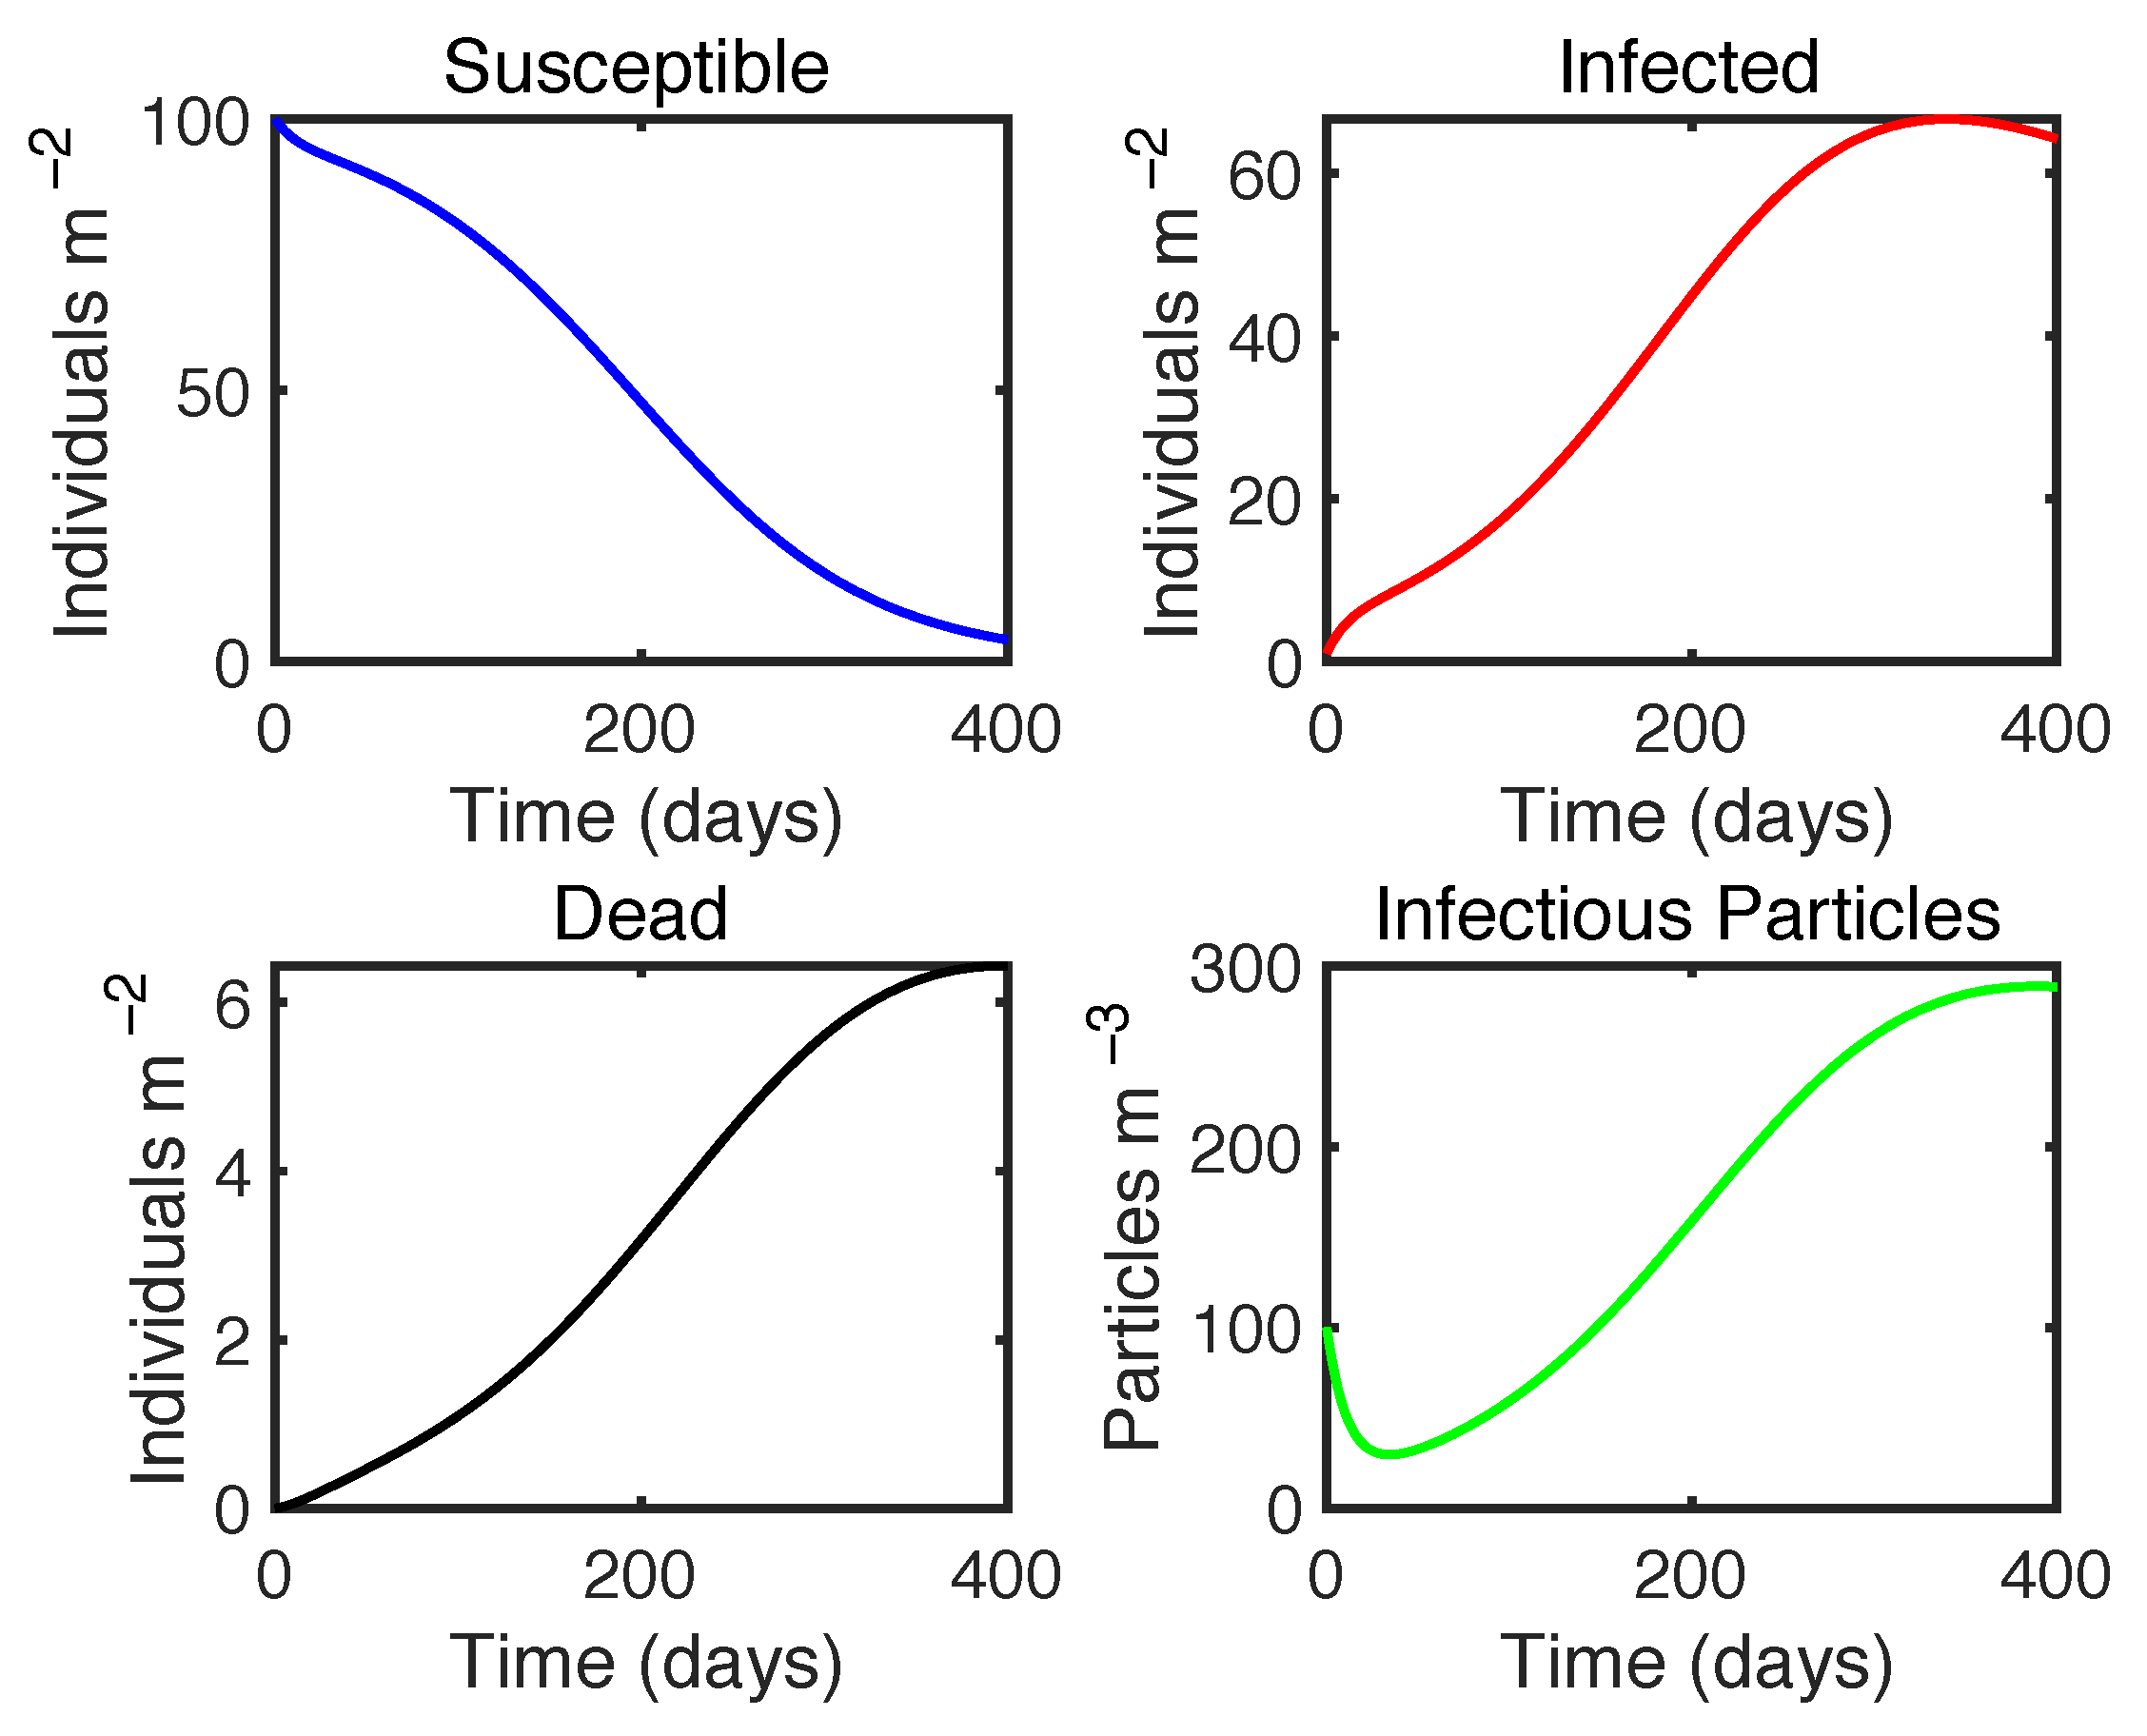
3.2.1. Bivalve–Microplastic–Vibrio Disease Model

d S d t = β f M S + S R C S
d I d t = ( β a ) f M S m I
d D I d t = m I d D I
d M d t = ( 1 a ) c b I I + ( 1 a T ) c T b T T + b D I d D I f M ( S + I ) f T M T r M + S R C M
d T d t = T + S R C T
Our bivalve–microplastic–Vibrio model simulations (Figure 6) detected the effect of MMD-adhered pathogens on disease transmission. The size of the susceptible subpopulation decreased as more individuals became infected by filtering infectious MMD, thereby increasing the size of the infected population. The size of the dead/infected subpopulation increased, in turn, as individuals from the infected pool died (Figure 6; S, I, D plots). The number of MMD particles with adhered pathogens initially decreased as the susceptible and infected populations filtered MMD out of the seawater (Figure 6; infectious particle plot); however, this initial decrease was followed by a rapid increase as more MMD particles entered the water column from external water masses and from the infected and dead subpopulations. The overall infection rate for this model (Figure 7) shows an initial decrease as MMD particles are filtered out of the water column, followed by an increase due to the release of particles from infected and dead subpopulations. The infection rate decreases to zero once all susceptible individuals have become infected and infected individuals continue to die out.

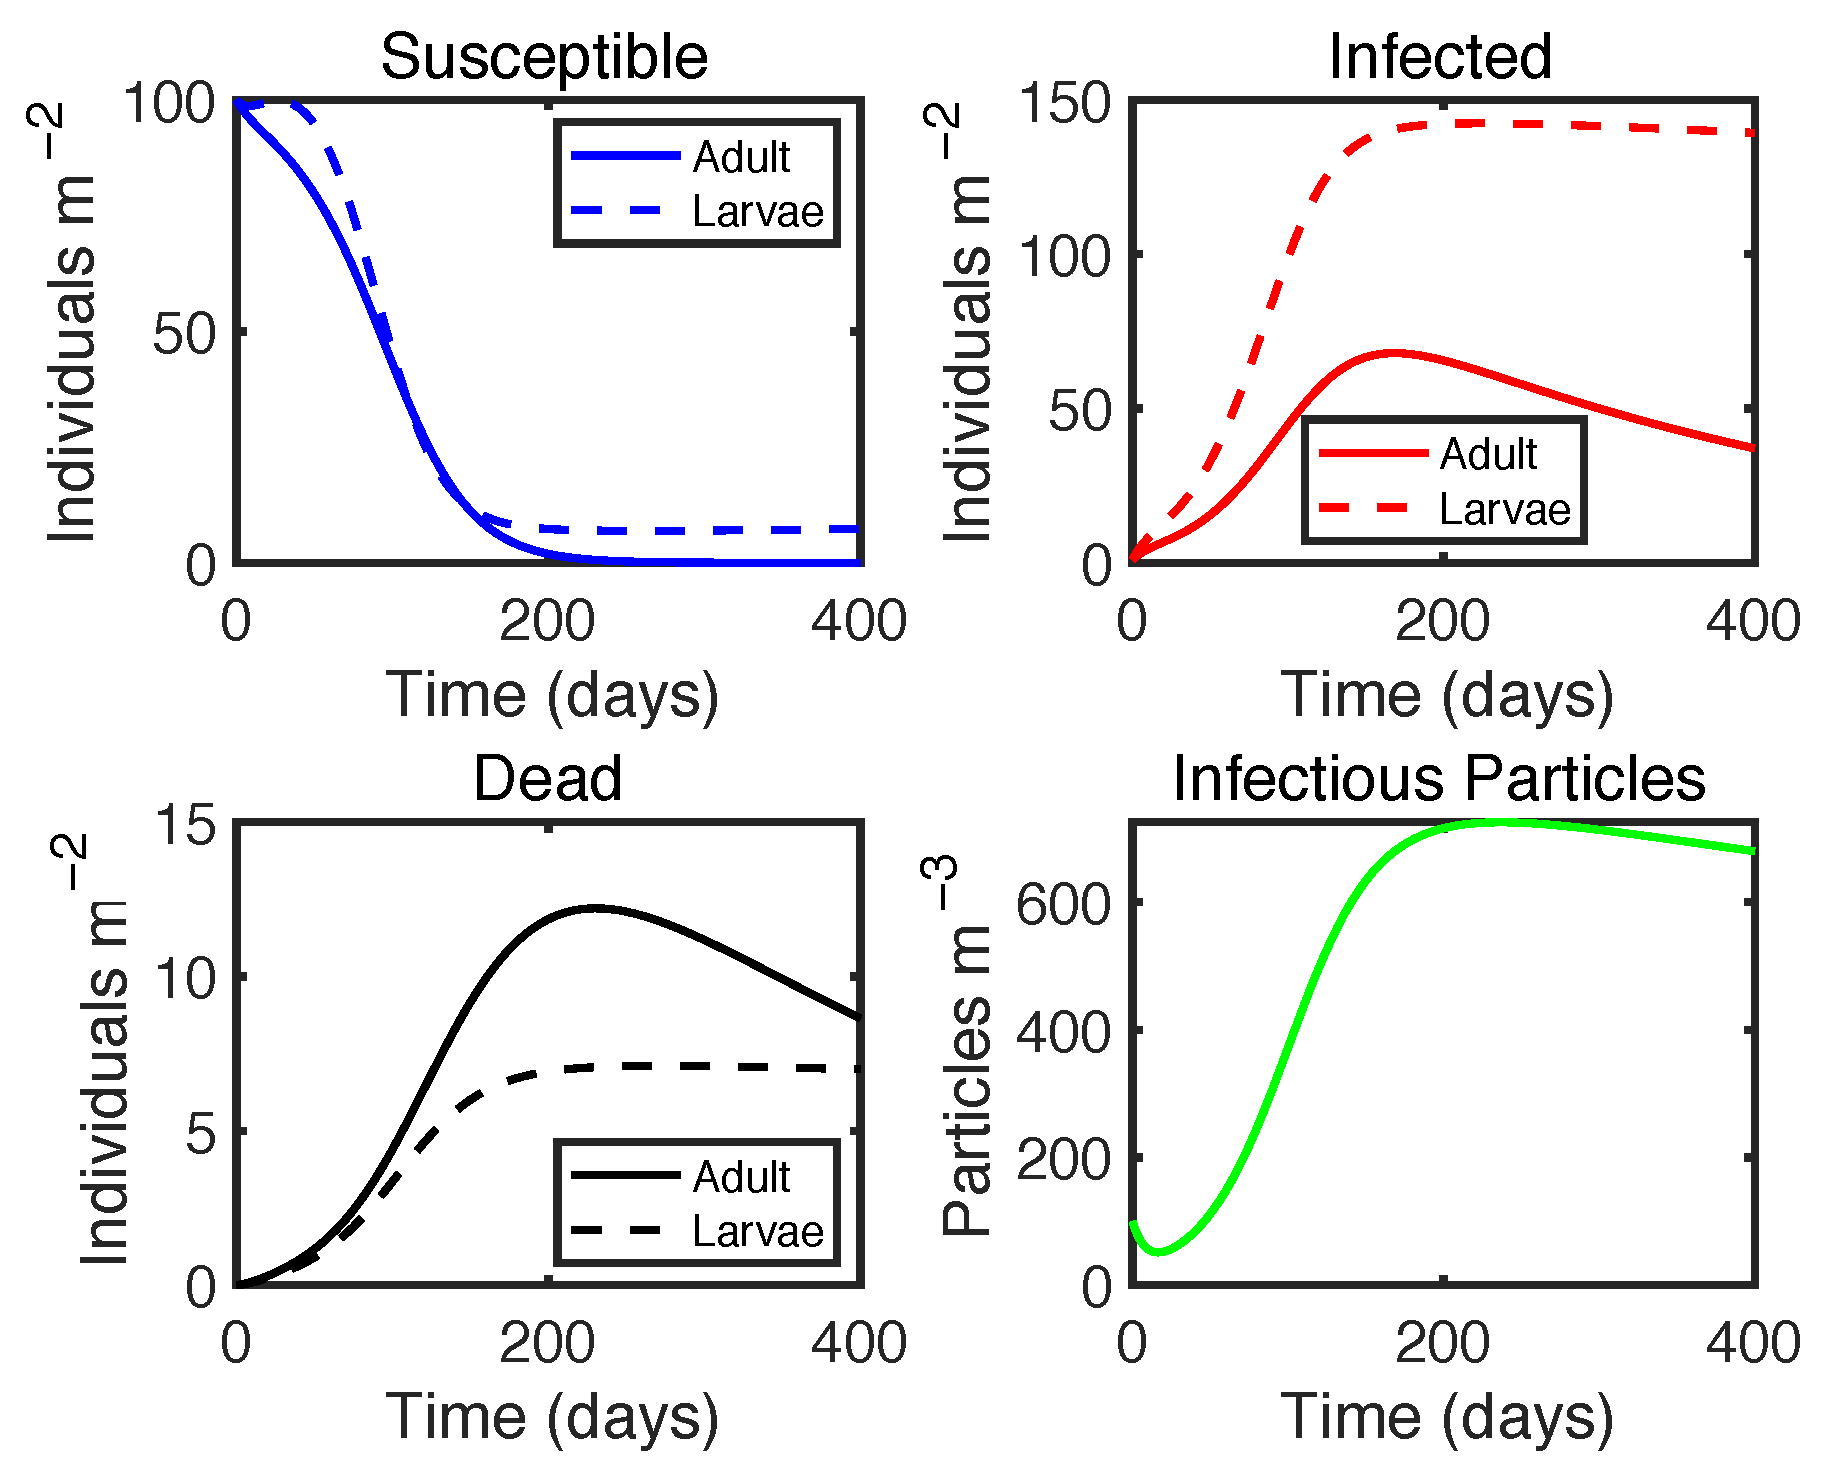
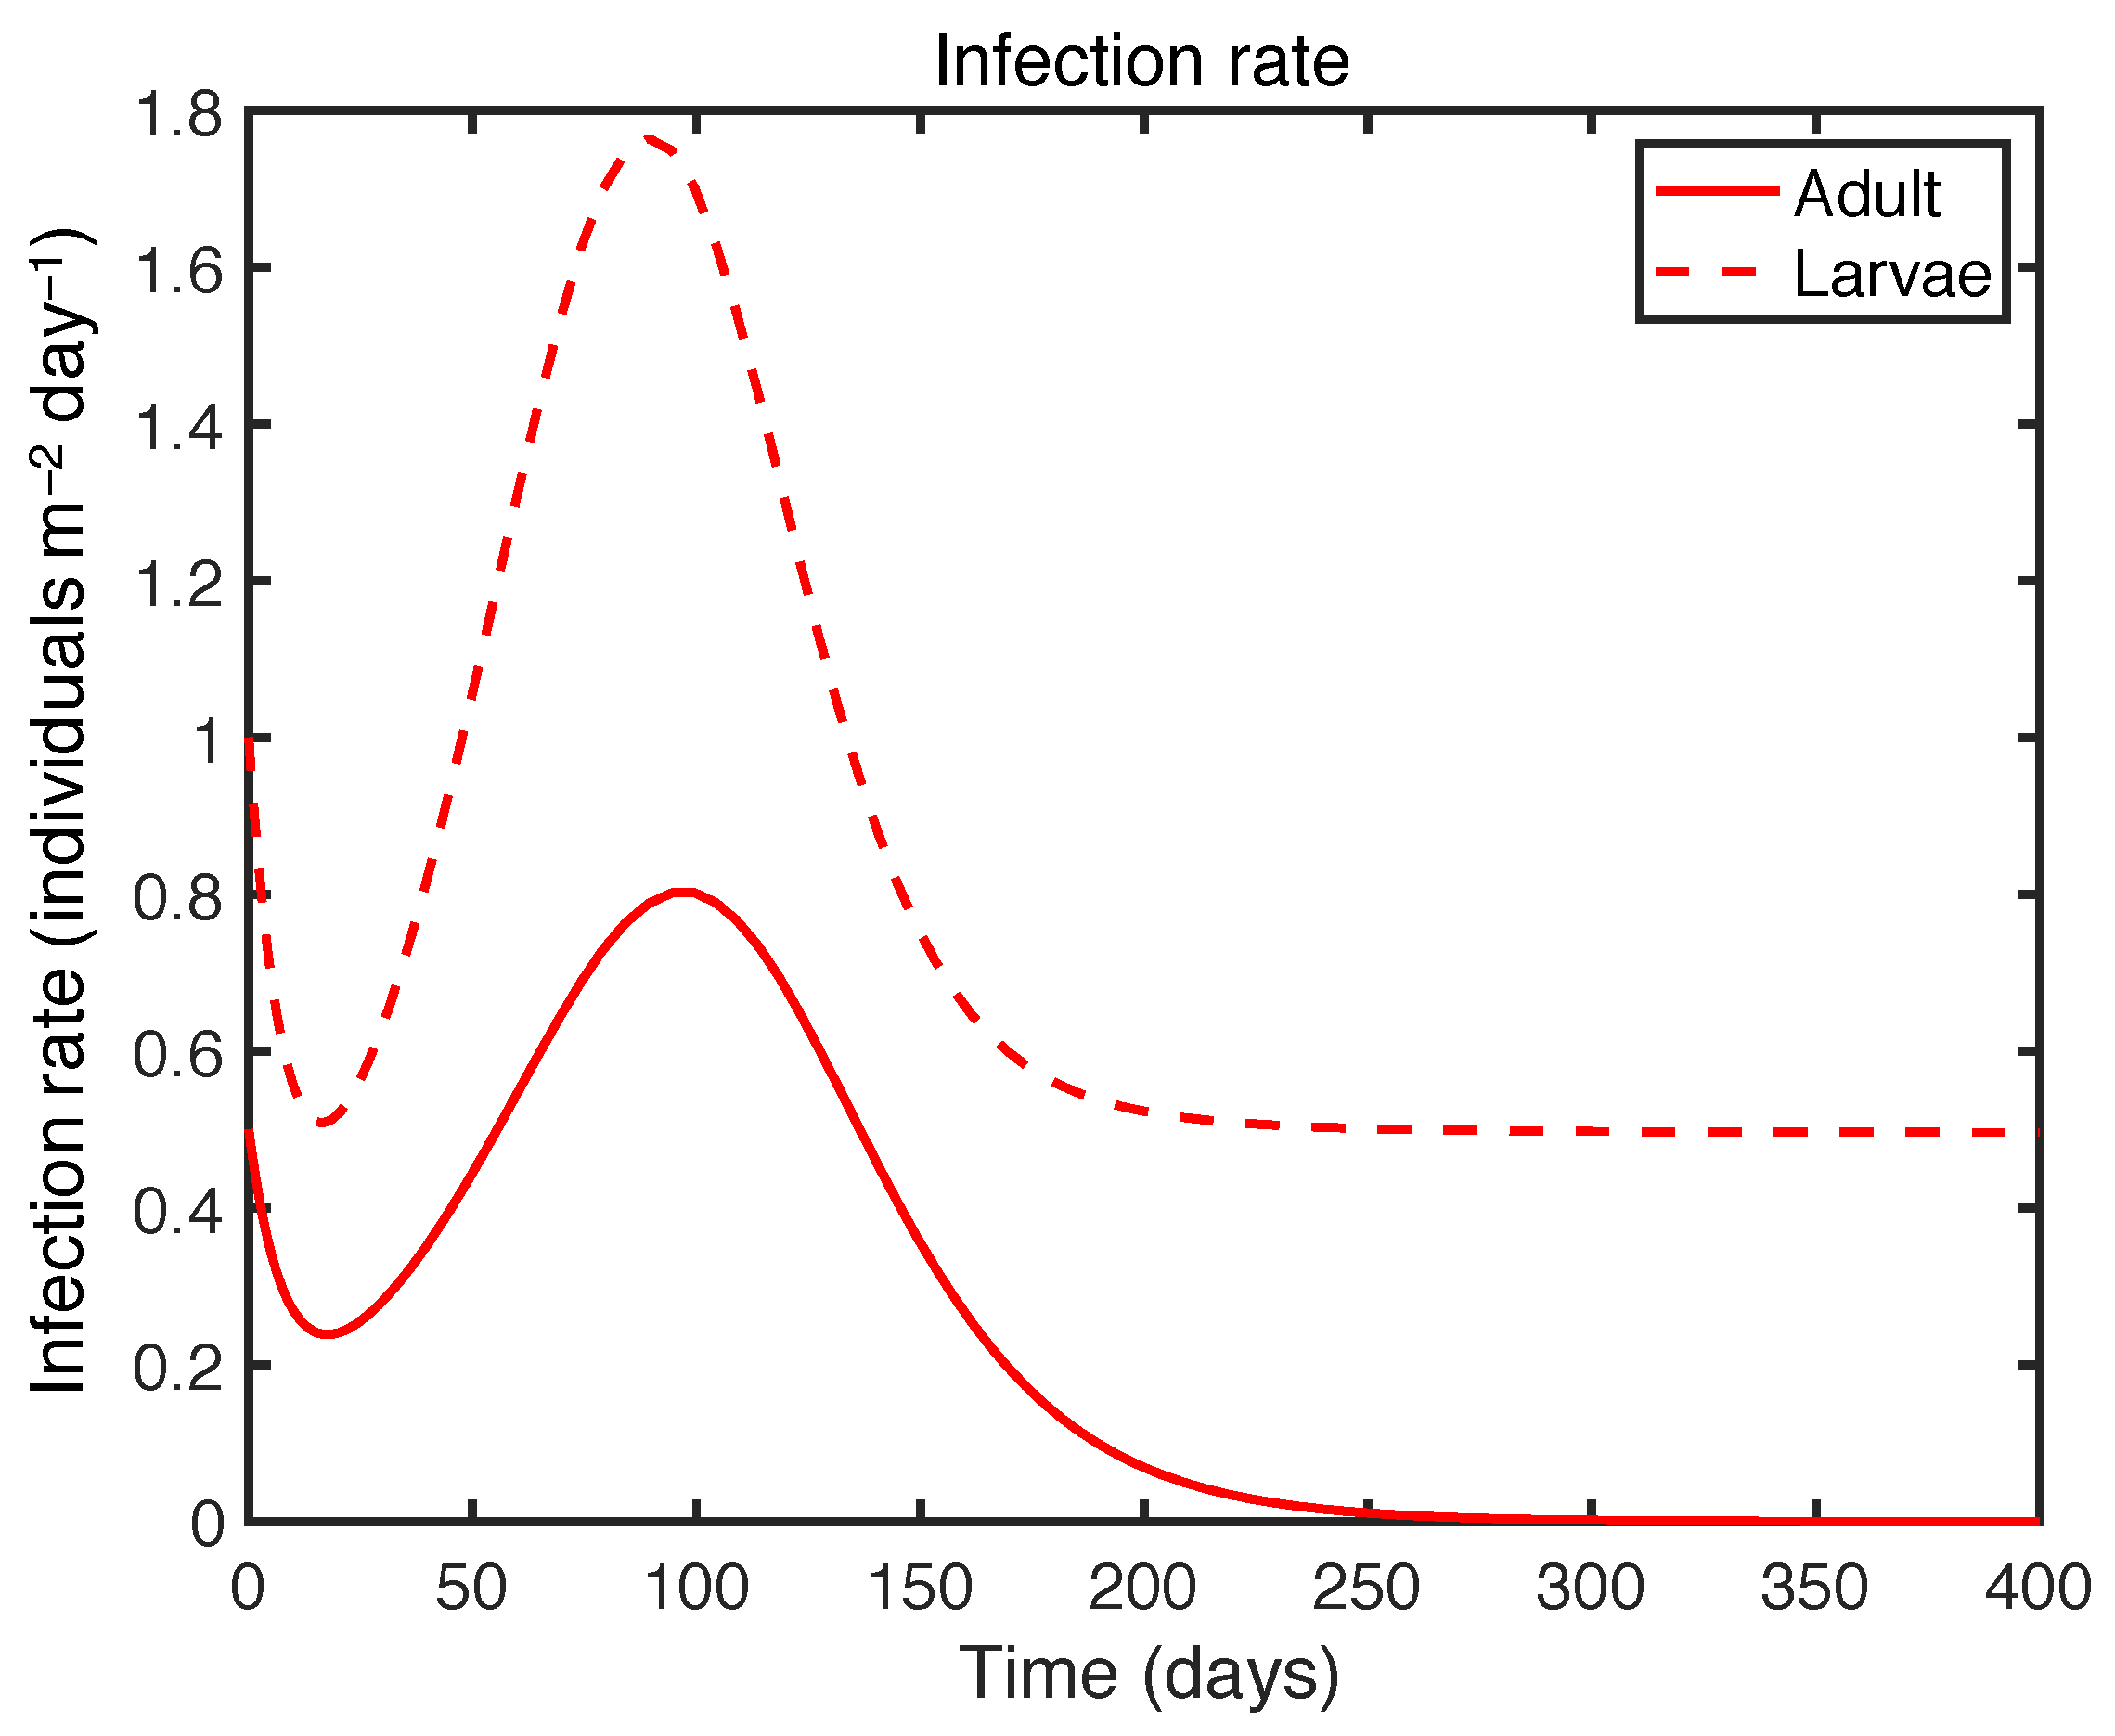
3.2.2. Fish–Microplastic–Vibrio Disease Model

d S L d t = β L f L M S L g S L + S R C S L
d S A d t = β A f A M S A + g S L + S R C S A
d I L d t = ( β L a L ) f L M S L g I L m L I L
d I A d t = ( β A a A ) f A M S A + g I L m A I A
d D I L d t = m L I L d A D I L
d D I A d t = m A I A d L D I A
d M d t = ( 1 a L ) c L b I L I L + ( 1 a A ) c A b I A I A + b D I L d L D I L + b D I A d A D I A f L M ( S L + I L ) f A M ( S A + I A ) r M + S R C M
Like the bivalve models, the fish–microplastic–Vibrio model simulations (Figure 8) also detected the effect of MMD-adhered pathogens on disease transmission in fish adults and larvae. The size of the susceptible adult and larvae subpopulations decreased as individuals became infected by feeding on infectious particles; infected individuals were transferred to the infected subpopulation, causing the size of the infected adult and larval populations to increase. The infected larvae population increased more rapidly due to the higher infection rate for larvae (Figure 8).
The plot for the susceptible population also shows the effect of a continuous source of larvae coming from other regions ( S R C S L = 0.5) (Figure 8, S plot, in blue). By day 200, all susceptible adults had become infected, but new susceptible larvae enter the system from external sources. The dead adult subpopulation increased to a higher level than the dead larvae population because the dead larvae decay rate is faster than the decay rate for adults. At the same time, the concentration of MMD particles increased to a maximum as particles were both released and entered the system from external sources (Figure 8, particle plot, in green). After reaching this maximum, the concentration of MMD particles then decreased, as all susceptible individuals had become infected; as infected individuals started dying, MMD particles were removed from the system through decay processes.
The behaviour of the infection rate for this model is similar to that observed for the bivalve model (Figure 9). In the fish model, the curve of the larvae infection rate is well above the curve of the adult infection rate, adequately mirroring the higher infection rate considered for the larvae with respect to adult fish.

4. Discussion

The three-part analytical approach described here (retrospective regression analysis, in vivo experiments, and disease modelling) provides a suitable framework for thoroughly exploring the role of microplastics on marine pathogen transmission.
The theoretical results from the retrospective analysis described here demonstrate that retrospective regression using biological samples from environmental specimen banks can offer a valuable perspective of the past and expected future trends of MMD exposure in different marine organisms, as well as the relationship between MMD exposure and pathogen prevalence. This approach could be of interest when combined data from peer-reviewed literature, publicly available data, and new data sets suggest an important increase in MMD. For example, an increase by two orders of magnitude in the abundance and mass of microplastics occurred in the North Pacific Subtropical Gyre during both the period from 1972 to 1987 and again between 1999 and 2010 [31]. Additionally, North Atlantic and North Sea surface samples collected by a continuous plankton recorder suggest that the frequency with which microplastics have been encountered during surveys has been steadily increasing along with the increase in global plastic production [32].
Based on the results of retrospective regressions and the relationships among modelled variables, organisms with higher MMD exposure and a higher incidence of pathogens can be considered for in vivo experiments and disease modelling. For example, the experimental approach outlined here is designed to determine the effect of the MMD–pathogen interaction on disease transmission. To achieve this, our proposed experimental design includes treatments with non-infectious microplastics, microplastics with adhered pathogens, and free-floating pathogens. Such an experimental approach is particularly timely because recent experiments have used microplastics with adhered pathogens to assess whether microplastics may facilitate pathogen entry into marine food webs [88]. For designing adequate experiments looking for answers about the role of MMD in marine disease transmission, recent studies suggest that experiments in this regard should focus on fibres instead of spherical MMD and lower particle concentration levels for long-term exposure studies [37]. In addition, Baroja et al. [37] point out the need for consensus on environmental microplastic sizes and concentrations for this type of laboratory experiment.
Together, retrospective analysis and in vivo experimental results can provide essential information on the key parameters involved in the mechanisms and processes of disease transmission through microplastic exposure. In this study, as in [78], we developed the theoretical basis for modelling these MMD–pathogen systems for bivalves and fishes. Our models can be parameterized with realistic values obtained from previous retrospective and experimental analyses. Preliminary theoretical model results here conform to the expectations of mathematical theory and behaviour and population dynamics. Most importantly, our models incorporate the effect of microplastic particles with adhered pathogens on disease transmission and mortality. In the age-dependent fish–microplastic–Vibrio model, the effect of infectious microplastics could be observed separately for both adult and larval zebrafish. In the future, models based on the experimental design and models described here can be developed to further explore the role of microplastic-derived stress on the transmission of both free-living and MMD-adhered pathogens [35]. For this, the experiments designed here will result in valuable information for model parameters since they contemplate treatments including stressed organisms exposed to MMD with adhered pathogens.
Studying the combined risks from microplastic pollution and disease represents a novel approach to the study of marine disease ecology. Future studies along this line of research could involve a linked experiment–disease modelling approach that would allow us to understand the complex organism–microplastic–pathogen system from a predictive and epizootiological perspective. This perspective is inherently interdisciplinary, with research teams possessing a unique mixture of expertise in bivalve and zebrafish microplastic toxicology, histopathology, immunology, and marine disease modelling. Moreover, the interdisciplinary and predictive aspects of this project are essential for making progress towards the long-term objectives of this research, which focus on understanding the rate at which organisms encounter microplastics (e.g., via ocean models) and the physical, chemical, biological, and interactive risks these encounters pose to different organisms at different spatial scales and through bioaccumulation at different trophic levels. Overall, this proposed study will generate the knowledge needed to guide advanced seafood safety studies in commercial bivalves, and it will be applicable to other ecologically relevant suspension-feeders such as corals, while always considering the potential limitations of the approach presented here.
Particularly, the experiments and models here are a simplification of reality and may result in an underestimation of the role of MMD on pathogen transmission since they are dealing with multiple dimensions and latent covariates. The experimental design here can be considered model-based. In this sense, it has been demonstrated that the nature of mathematical models poses challenges for experimental design [89]: (i) models can be complex as biological processes and mechanisms are added, with many parameters that cannot be defined adequately; (ii) the selection of relevant/irrelevant mechanisms can vary among experiments/treatments and is a critical step to consider; and (iii) the model will fail when experimental design can obtain relevant details that are omitted from the model [89].

5. Conclusions

The importance of the prospective and theoretical results of this work lie in the fact that they support research regarding the factors involved in the emergence and transmission of pathogens adhered to MMD in marine organisms and the impact on human health. First, time series of MMD and pathogen loads in marine animal tissues and correlational analysis with environmental variables is crucial for understanding the emergence and persistence of this binomial in marine systems. Since microplastic fragments represent a potential reservoir of animal and human pathogens, resulting time series and correlational analysis with varying MMD types and sizes will show the relative importance of MMD with regard to emergent pathogens. This, in turn, will allow selection of the most critical systems for designing laboratory experiments that will eventually permit more knowledge about the processes and mechanisms of this type of pathogen transmission. Finally, although robust parameterization, adaptation, and validation of the transmission models presented here and their predictions are needed, initial results and evaluation show the potential of modelling MMD–pathogen transmission dynamics. Understanding the details of these dynamics is critical for improved planning for ecosystem, aquaculture, and human health risk management. The application of multiperspective approaches such as the one presented here should be an urgent priority of the EU Strategic Research Innovation Agenda [90], as it will build a body of knowledge essential for addressing marine disease and food safety challenges related to MMD.

Author Contributions

Conceptualization, G.B., P.L.L. and M.S.; methodology, G.B., P.L.L., M.S., I.U., A.I. and F.V.; software, G.B. and M.S.: formal analysis, G.B., M.S., P.L.L., I.U, A.I. and F.V.; original draft preparation, G.B., M.S., P.L.L., I.U, A.I. and F.V.; review and editing, G.B., M.S., P.L.L., I.U., A.I. and F.V.; supervision, G.B. and P.L.L. All authors have read and agreed to the published version of the manuscript.

Funding

This work was conceived under the research framework outlined by the National Science Foundation Evolution and Ecology of Infectious Diseases (EEID) Program, grant OCE-1216220. Funding was provided by the University of the Basque Country (UPV/EHU, GIU19/059) and the Basque Government (PIBA2020-1-0028). We appreciate this support.

Institutional Review Board Statement

Not applicable.

Informed Consent Statement

Not applicable.

Data Availability Statement

Queries about the terms of use and requests for data should be addressed to the principal investigator of the research team, Fernando Villate ([email protected]).

Conflicts of Interest

The authors declare no conflict of interest.

References

  1. Cózar, A.; Echevarría, F.; González-Gordillo, J.I.; Irigoien, X.; Úbeda, B.; Hernández-León, S.; Palma, Á.T.; Navarro, S.; García-de Lomas, J.; Ruiz, A.; et al. Plastic debris in the open ocean. Proc. Natl. Acad. Sci. USA 2014, 111, 10239–10244. [Google Scholar] [CrossRef] [PubMed] [Green Version]
  2. UNEP. Emerging Issues in our Global Environment: Plastic Debris in the Ocean; UNEP Year Book 2014; United Nations Environment Programme: Nairobi, Kenya, 2014. [Google Scholar]
  3. Plastic Europe. Plastics—The Facts 2014/2015: An Analysis of European Plastics Production Demand; Plastics Europe: Brussels, Belgium, 2015. [Google Scholar]
  4. Cole, M.; Lindeque, P.; Halsband, C.; Galloway, T.S. Microplastics as contaminants in the marine environment: A review. Mar. Pollut. Bull. 2011, 62, 2588–2597. [Google Scholar] [CrossRef] [PubMed]
  5. Shim, W.J.; Thomposon, R.C. Microplastics in the ocean. Arch. Environ. Contam. Toxicol. 2015, 69, 265–268. [Google Scholar] [CrossRef] [PubMed] [Green Version]
  6. Cole, M.; Lindeque, P.; Fileman, E.; Halsband, C.; Goodhead, R.; Moger, J.; Galloway, T.S. Microplastic ingestion by zooplankton. Environ. Sci. Technol. 2013, 47, 6646–6655. [Google Scholar] [CrossRef] [PubMed]
  7. Murphy, F.; Russell, M.; Ewins, C.; Quinn, B. The uptake of macroplastic & microplastic by demersal & pelagic fish in the Northeast Atlantic around Scotland. Mar. Pollut. Bull. 2017, 122, 353–359. [Google Scholar] [PubMed] [Green Version]
  8. Sequeira, I.F.; Prata, J.C.; da Costa, J.P.; Duarte, A.C.; Rocha-Santos, T. Worldwide contamination of fish with microplastics: A brief global overview. Mar. Pollut. Bull. 2020, 160, 111681. [Google Scholar] [CrossRef]
  9. Romeo, T.; Pietro, B.; Pedà, C.; Consoli, P.; Andaloro, F.; Fossi, M.C. First evidence of presence of plastic debris in stomach of large pelagic fish in the Mediterranean Sea. Mar. Pollut. Bull. 2015, 95, 358–361. [Google Scholar] [CrossRef]
  10. Besseling, E.; Foekema, E.; Van Franeker, J.; Leopold, M.; Kühn, S.; Rebolledo, E.B.; Heße, E.; Mielke, L.; IJzer, J.; Kamminga, P.; et al. Microplastic in a macro filter feeder: Humpback whale Megaptera novaeangliae. Mar. Pollut. Bull. 2015, 95, 248–252. [Google Scholar] [CrossRef]
  11. Smith, M.; Love, D.C.; Rochman, C.M.; Neff, R.A. Microplastics in seafood and the implications for human health. Curr. Environ. Health Rep. 2018, 5, 375–386. [Google Scholar] [CrossRef] [Green Version]
  12. Van Cauwenberghe, L.; Janssen, C.R. Microplastics in bivalves cultured for human consumption. Environ. Pollut. 2014, 193, 65–70. [Google Scholar] [CrossRef]
  13. Prata, J.C.; da Costa, J.P.; Lopes, I.; Duarte, A.C.; Rocha-Santos, T. Environmental exposure to microplastics: An overview on possible human health effects. Sci. Total Environ. 2020, 702, 134455. [Google Scholar] [CrossRef]
  14. Li, J.; Yang, D.; Li, L.; Jabeen, K.; Shi, H. Microplastics in commercial bivalves from China. Environ. Pollut. 2015, 207, 190–195. [Google Scholar] [CrossRef]
  15. Van Cauwenberghe, L.; Claessens, M.; Vandegehuchte, M.B.; Janssen, C.R. Microplastics are taken up by mussels (Mytilus edulis) and lugworms (Arenicola marina) living in natural habitats. Environ. Pollut. 2015, 199, 10–17. [Google Scholar] [CrossRef]
  16. Powell, E.; Hofmann, E.; Klinck, J.; Ray, S. Modeling Oyster Populations: I. A Commentary on Filtration Rate. Is Faster Always Better? Texas A&M University: College Station, TX, USA, 1992. [Google Scholar]
  17. Guzzetti, E.; Sureda, A.; Tejada, S.; Faggio, C. Microplastic in marine organism: Environmental and toxicological effects. Environ. Toxicol. Pharmacol. 2018, 64, 164–171. [Google Scholar] [CrossRef]
  18. Zhang, F.; Man, Y.B.; Mo, W.Y.; Man, K.Y.; Wong, M.H. Direct and indirect effects of microplastics on bivalves, with a focus on edible species: A mini-review. Crit. Rev. Environ. Sci. Technol. 2020, 50, 2109–2143. [Google Scholar] [CrossRef]
  19. Hardesty, B.D.; Harari, J.; Isobe, A.; Lebreton, L.; Maximenko, N.; Potemra, J.; Van Sebille, E.; Vethaak, A.D.; Wilcox, C. Using numerical model simulations to improve the understanding of micro-plastic distribution and pathways in the marine environment. Front. Mar. Sci. 2017, 4, 30. [Google Scholar] [CrossRef] [Green Version]
  20. Law, K.L.; Thompson, R.C. Microplastics in the seas. Science 2014, 345, 144–145. [Google Scholar] [CrossRef]
  21. Lusher, A. Microplastics in the marine environment: Distribution, interactions and effects. In Marine Anthropogenic Litter; Springer: Cham, Switzerland, 2015; pp. 245–307. [Google Scholar]
  22. Zettler, E.R.; Mincer, T.J.; Amaral-Zettler, L.A. Life in the “plastisphere”: Microbial communities on plastic marine debris. Environ. Sci. Technol. 2013, 47, 7137–7146. [Google Scholar] [CrossRef]
  23. Kirstein, I.V.; Kirmizi, S.; Wichels, A.; Garin-Fernandez, A.; Erler, R.; Löder, M.; Gerdts, G. Dangerous hitchhikers? Evidence for potentially pathogenic Vibrio spp. on microplastic particles. Mar. Environ. Res. 2016, 120, 1–8. [Google Scholar] [CrossRef] [Green Version]
  24. Kesy, K.; Labrenz, M.; Scales, B.S.; Kreikemeyer, B.; Oberbeckmann, S. Vibrio Colonization Is Highly Dynamic in Early Microplastic-Associated Biofilms as Well as on Field-Collected Microplastics. Microorganisms 2021, 9, 76. [Google Scholar] [CrossRef]
  25. Vethaak, A.D.; Legler, J. Microplastics and human health. Science 2021, 371, 672–674. [Google Scholar] [CrossRef] [PubMed]
  26. Zeilinger, A.R.; Rapacciuolo, G.; Turek, D.; Oboyski, P.T.; Almeida, R.P.; Roderick, G.K. Museum specimen data reveal emergence of a plant disease may be linked to increases in the insect vector population. Ecol. Appl. 2017, 27, 1827–1837. [Google Scholar] [CrossRef] [PubMed] [Green Version]
  27. Directive, S.F. Guidance on Monitoring of Marine Litter in European Seas; Publications Office of the European Union: Luxembourg, 2013; Volume 10, p. 99475. [Google Scholar]
  28. Galgani, F.; Claro, F.; Depledge, M.; Fossi, C. Monitoring the impact of litter in large vertebrates in the Mediterranean Sea within the European Marine Strategy Framework Directive (MSFD): Constraints, specificities and recommendations. Mar. Environ. Res. 2014, 100, 3–9. [Google Scholar] [CrossRef] [PubMed] [Green Version]
  29. Gorokhova, E. Screening for microplastic particles in plankton samples: How to integrate marine litter assessment into existing monitoring programs? Mar. Pollut. Bull. 2015, 99, 271–275. [Google Scholar] [CrossRef] [PubMed]
  30. Frias, J.; Otero, V.; Sobral, P. Evidence of microplastics in samples of zooplankton from Portuguese coastal waters. Mar. Environ. Res. 2014, 95, 89–95. [Google Scholar] [CrossRef]
  31. Goldstein, M.C.; Rosenberg, M.; Cheng, L. Increased oceanic microplastic debris enhances oviposition in an endemic pelagic insect. Biol. Lett. 2012, 8, 817–820. [Google Scholar] [CrossRef] [Green Version]
  32. Thompson, R.C.; Olsen, Y.; Mitchell, R.P.; Davis, A.; Rowland, S.J.; John, A.W.; McGonigle, D.; Russell, A.E. Lost at sea: Where is all the plastic? Science 2004, 304, 838. [Google Scholar] [CrossRef]
  33. Garmendia, L.; Soto, M.; Vicario, U.; Kim, Y.; Cajaraville, M.P.; Marigómez, I. Application of a battery of biomarkers in mussel digestive gland to assess long-term effects of the Prestige oil spill in Galicia and Bay of Biscay: Tissue-level biomarkers and histopathology. J. Environ. Monit. 2011, 13, 915–932. [Google Scholar] [CrossRef]
  34. Browne, M.A.; Dissanayake, A.; Galloway, T.S.; Lowe, D.M.; Thompson, R.C. Ingested microscopic plastic translocates to the circulatory system of the mussel, Mytilus edulis (L.). Environ. Sci. Technol. 2008, 42, 5026–5031. [Google Scholar] [CrossRef]
  35. Lamb, J.B.; Willis, B.L.; Fiorenza, E.A.; Couch, C.S.; Howard, R.; Rader, D.N.; True, J.D.; Kelly, L.A.; Ahmad, A.; Jompa, J.; et al. Plastic waste associated with disease on coral reefs. Science 2018, 359, 460–462. [Google Scholar] [CrossRef]
  36. Tang, J.; Ni, X.; Zhou, Z.; Wang, L.; Lin, S. Acute microplastic exposure raises stress response and suppresses detoxification and immune capacities in the scleractinian coral Pocillopora damicornis. Environ. Pollut. 2018, 243, 66–74. [Google Scholar] [CrossRef]
  37. Baroja, E.; Christoforou, E.; Lindström, J.; Spatharis, S. Effects of microplastics on bivalves: Are experimental settings reflecting conditions in the field? Mar. Pollut. Bull. 2021, 171, 112696. [Google Scholar] [CrossRef]
  38. Carson, H.S.; Nerheim, M.S.; Carroll, K.A.; Eriksen, M. The plastic-associated microorganisms of the North Pacific Gyre. Mar. Pollut. Bull. 2013, 75, 126–132. [Google Scholar] [CrossRef]
  39. Koelmans, A.A.; Besseling, E.; Foekema, E.M. Leaching of plastic additives to marine organisms. Environ. Pollut. 2014, 187, 49–54. [Google Scholar] [CrossRef]
  40. Matte, G.R.; Matte, M.H.; Rivera, I.G.; Martins, M.T. Distribution of potentially pathogenic vibrios in oysters from a tropical region. J. Food Prot. 1994, 57, 870–873. [Google Scholar] [CrossRef]
  41. Lacoste, A.; Jalabert, F.; Malham, S.; Cueff, A.; Gelebart, F.; Cordevant, C.; Lange, M.; Poulet, S. A Vibrio splendidus strain is associated with summer mortality of juvenile oysters Crassostrea gigas in the Bay of Morlaix (North Brittany, France). Dis. Aquat. Org. 2001, 46, 139–145. [Google Scholar] [CrossRef] [Green Version]
  42. Toranzo, A.E.; Magariños, B.; Romalde, J.L. A review of the main bacterial fish diseases in mariculture systems. Aquaculture 2005, 246, 37–61. [Google Scholar] [CrossRef]
  43. Zhang, Q.; Dong, X.; Chen, B.; Zhang, Y.; Zu, Y.; Li, W. Zebrafish as a useful model for zoonotic Vibrio parahaemolyticus pathogenicity in fish and human. Dev. Comp. Immunol. 2016, 55, 159–168. [Google Scholar] [CrossRef]
  44. Nelder, J.A.; Wedderbum, R.W.M. Generalized linear models. J. R. Stat. Soc. Ser. A 1972, 135, 370–384. [Google Scholar] [CrossRef]
  45. McCullagh, P.; Nelder, J.A. Generalized Linear Models, 2nd ed.; Chapman & Hall: London, UK, 1989; p. 500. [Google Scholar]
  46. Hastie, T.; Tibshirani, R. Generalized Additive Models; Chapman and Hall: London, UK, 1990. [Google Scholar]
  47. Eubank, R. Monotone Regression Splines in Action: Comment. Stat. Sci. 1988, 3, 446–450. [Google Scholar] [CrossRef]
  48. Wahba, G. Spline Models for Observational Data; Society for Industrial and Applied Mathematics: Philadelphia, PA, USA, 1990. [Google Scholar]
  49. Fan, J.; Gijbels, I. Local Polynomial Modelling and Its Applications; Number 66 in Monographs on Statistics and Applied Probability Series; Chapman & Hall: London, UK, 1996. [Google Scholar]
  50. Wand, M.P.; Jones, M.C. Kernel Smoothing; Chapman & Hall: London, UK, 1995. [Google Scholar]
  51. Wand, M.P. A comparison of regression spline smoothing procedures. Comput. Stat. 2000, 15, 443–462. [Google Scholar] [CrossRef]
  52. Fan, J.; Marron, J. Fast implementation of nonparametric curve estimators. J. Comput. Graph. Stat. 1994, 3, 35–56. [Google Scholar]
  53. Golub, G.; Heath, M.; Wahba, G. Generalized cross-validation as a method for choosing a good ridge parameter. Technometrics 1979, 21, 215–223. [Google Scholar] [CrossRef]
  54. Ruppert, D.; Sheather, S.J.; Wand, M.P. An Effective Bandwidth Selector for Local Least Squares Regression. J. Am. Stat. Assoc. 1995, 90, 1257–1270. [Google Scholar] [CrossRef]
  55. Marron, J.S. Bootstrap bandwidth selection. In Exploring the Limits of Bootstrap; LePage, R., Billard, L., Eds.; Wiley-Interscience: Hoboken, NJ, USA, 1992; pp. 249–262. [Google Scholar]
  56. Forster, M.R. Key Concepts in Model Selection: Performance and Generalizability. J. Math. Psychol. 2000, 44, 205–231. [Google Scholar] [CrossRef] [Green Version]
  57. Tibshirani, R. Regression shrinkage and selection via the Lasso. J. R. Stat. Soc. B 1996, 58, 267–288. [Google Scholar] [CrossRef]
  58. Hastie, T.; Tibshirani, R.; Friedman, J.H. The Elements of Statistical Learning; Springer: New York, NY, USA, 2003. [Google Scholar]
  59. Green, P.J. Reversible jump Markov chain Monte Carlo computation and Bayesian model determination. Biometrika 1995, 82, 711–732. [Google Scholar] [CrossRef]
  60. Kuo, L.; Mallick, B. Variable selection for regression models. Indian J. Stat. (Spec. Issue Bayesian Anal.) 1998, 60, 65–81. [Google Scholar]
  61. Park, T.; Casella, G. The Bayesian Lasso. J. Am. Stat. Assoc. 2008, 103, 681–686. [Google Scholar] [CrossRef]
  62. Venables, W.N.; Ripley, B.D. Modern Applied Statistics with S-Plus, 2nd ed.; Springer: New York, NY, USA, 1997. [Google Scholar]
  63. Miller, A. Subset Selection in Regression; Chapman and Hall/CRC: Boca Raton, FL, USA, 2002. [Google Scholar]
  64. Sestelo, M.; Villanueva, N.M.; Meira-Machado, L.; Roca-Pardiñas, J. FWDselect: An R Package for Variable Selection in Regression Models. R J. 2016, 8, 132–148. [Google Scholar] [CrossRef]
  65. Calcagno, V.; de Mazancourt, C. glmulti: An R package for easy automated model selection with (Generalized) Linear Models. J. Stat. Softw. 2010, 34, 1–29. [Google Scholar] [CrossRef] [Green Version]
  66. Wang, R.; Mou, H.; Lin, X.; Zhu, H.; Li, B.; Wang, J.; Junaid, M.; Wang, J. Microplastics in Mollusks: Research Progress, Current Contamination Status, Analysis Approaches, and Future Perspectives. Front. Mar. Sci. 2021, 62, 1671. [Google Scholar] [CrossRef]
  67. Kim, Y.; Ashton-Alcox, K.A.; Powell, E.N. Histological Techniques for Marine Bivalve Molluscs: Update; OAA/National Centers for Coastal Ocean Science: Bethlehem, PA, USA, 2006. [Google Scholar]
  68. Iriarte, A.; Villate, F.; Uriarte, I.; Bidegain, G.; Barroeta, Z. Shifts in neritic copepod communities off the Basque coast (southeastern Bay of Biscay) between 1998 and 2015. ICES J. Mar. Sci. 2022, 79, 830–843. [Google Scholar] [CrossRef]
  69. Wood, S.N. Stable and efficient multiple smoothing parameter estimation for generalized additive models. J. Am. Stat. Assoc. 2004, 99, 673–686. [Google Scholar] [CrossRef] [Green Version]
  70. Wood, S.; Pya, N.; Safken, B. Smoothing parameter and model selection for general smooth models (with discussion). J. Am. Stat. Assoc. 2016, 111, 1548–1575. [Google Scholar] [CrossRef]
  71. R Core Team. R: A Language and Environment for Statistical Computing; R Foundation for Statistical Computing: Vienna, Austria, 2022. [Google Scholar]
  72. Ben-Horin, T.; Bidegain, G.; Huey, L.; Nárvaez, D.A.; Bushek, D. Parasite transmission through suspension feeding. J. Invertebr. Pathol. 2015, 131, 155–176. [Google Scholar] [CrossRef] [Green Version]
  73. Cantet, F.; Hervio-Heath, D.; Caro, A.; Le Mennec, C.; Monteil, C.; Quéméré, C.; Jolivet-Gougeon, A.; Colwell, R.R.; Monfort, P. Quantification of Vibrio parahaemolyticus, Vibrio vulnificus and Vibrio cholerae in French Mediterranean coastal lagoons. Res. Microbiol. 2013, 164, 867–874. [Google Scholar] [CrossRef] [Green Version]
  74. Wu, X.; Pan, J.; Li, M.; Li, Y.; Bartlam, M.; Wang, Y. Selective enrichment of bacterial pathogens by microplastic biofilm. Water Res. 2019, 165, 114979. [Google Scholar] [CrossRef]
  75. Revel, M.; Châtel, A.; Perrein-Ettajani, H.; Bruneau, M.; Akcha, F.; Sussarellu, R.; Rouxel, J.; Costil, K.; Decottignies, P.; Cognie, B.; et al. Realistic environmental exposure to microplastics does not induce biological effects in the Pacific oyster Crassostrea gigas. Mar. Pollut. Bull. 2020, 150, 110627. [Google Scholar] [CrossRef]
  76. Teng, J.; Zhao, J.; Zhu, X.; Shan, E.; Wang, Q. Oxidative stress biomarkers, physiological responses and proteomic profiling in oyster (Crassostrea gigas) exposed to microplastics with irregular-shaped PE and PET microplastic. Sci. Total Environ. 2021, 786, 147425. [Google Scholar] [CrossRef]
  77. Bidegain, G.; Powell, E.E.; Klinck, J.M.; Ben-Horin, T.; Hofmann, E.E. Microparasitic disease dynamics in benthic suspension feeders: Infective dose, non-focal hosts, and particle diffusion. Ecol. Model. 2016, 328, 44–61. [Google Scholar] [CrossRef] [Green Version]
  78. Bidegain, G.; Powell, E.E.; Klinck, J.M.; Ben-Horin, T.; Hofmann, E.E. Marine infectious disease dynamics and outbreak thresholds: Contact, transmission, pandemic infection, and the potential role of filter feeders. Ecosphere 2016, 7, e1286. [Google Scholar] [CrossRef]
  79. Allen, J.P.; Neely, M.N. Trolling for the ideal model host: Zebrafish take the bait. Future Microbiol. 2010, 5, 563–569. [Google Scholar] [CrossRef] [PubMed] [Green Version]
  80. Sullivan, C.; Kim, C.H. Zebrafish as a model for infectious disease and immune function. Fish Shellfish. Immunol. 2008, 25, 341–350. [Google Scholar] [CrossRef] [PubMed]
  81. Rowe, H.M.; Withey, J.H.; Neely, M.N. Zebrafish as a model for zoonotic aquatic pathogens. Dev. Comp. Immunol. 2014, 46, 96–107. [Google Scholar] [CrossRef] [PubMed] [Green Version]
  82. Runft, D.L.; Mitchell, K.C.; Abuaita, B.H.; Allen, J.P.; Bajer, S.; Ginsburg, K.; Neely, M.N.; Withey, J.H. Zebrafish as a natural host model for Vibrio cholerae colonization and transmission. Appl. Environ. Microbiol. 2014, 80, 1710–1717. [Google Scholar] [CrossRef] [Green Version]
  83. Lu, Y.; Zhang, Y.; Deng, Y.; Jiang, W.; Zhao, Y.; Geng, J.; Ding, L.; Ren, H. Uptake and accumulation of polystyrene microplastics in zebrafish (Danio rerio) and toxic effects in liver. Environ. Sci. Technol. 2016, 50, 4054–4060. [Google Scholar] [CrossRef]
  84. Bidegain, G.; Powell, E.; Klinck, J.; Hofmann, E.; Ben-Horin, T.; Bushek, D.; Ford, S.; Munroe, D.; Guo, X. Modeling the transmission of Perkinsus marinus in the Eastern oyster Crassostrea virginica. Fish. Res. 2017, 186, 82–93. [Google Scholar] [CrossRef]
  85. Gilmour, J.P.; Smith, L.D.; Heyward, A.J.; Baird, A.H.; Pratchett, M.S. Recovery of an isolated coral reef system following severe disturbance. Science 2013, 340, 69–71. [Google Scholar] [CrossRef]
  86. Paillard, C.; Jean, F.; Ford, S.E.; Powell, E.N.; Klinck, J.M.; Hofmann, E.E.; Flye-Sainte-Marie, J. A theoretical individual-based model of brown ring disease in Manila clams Venerupis philippinarum. J. Sea Res. 2014, 91, 15–34. [Google Scholar] [CrossRef]
  87. Vega Thurber, R.L.; Burkepile, D.E.; Fuchs, C.; Shantz, A.A.; McMinds, R.; Zaneveld, J.R. Chronic nutrient enrichment increases prevalence and severity of coral disease and bleaching. Glob. Chang. Biol. 2014, 20, 544–554. [Google Scholar] [CrossRef]
  88. Zhang, E.; Kim, M.; Rueda, L.; Rochman, C.; VanWormer, E.; Moore, J.; Shapiro, K. Association of zoonotic protozoan parasites with microplastics in seawater and implications for human and wildlife health. Sci. Rep. 2022, 12, 6532. [Google Scholar] [CrossRef]
  89. White, A.; Tolman, M.; Thames, H.D.; Withers, H.R.; Mason, K.A.; Transtrum, M.K. The limitations of model-based experimental design and parameter estimation in sloppy systems. PLoS Comput. Biol. 2016, 12, e1005227. [Google Scholar] [CrossRef] [Green Version]
  90. Bowley, J.; Baker-Austin, C.; Porter, A.; Hartnell, R.; Lewis, C. Oceanic hitchhikers–assessing pathogen risks from marine microplastic. Trends Microbiol. 2021, 29, 107–116. [Google Scholar] [CrossRef]
Figure 1. Experimental design for bivalves. The proposed experiment (A) can evaluate different microplastic types/sizes and different oyster and non-focal host densities to determine the effect of these variables on MMD uptake and accumulation in oysters and the relationships between MMD uptake and pathogen (i.e., Vibrio spp.) occurrence and disease responses. The conceptual disease model (B) represents a simplified scheme of subpopulations, parameters, and processes that will be incorporated into an ordinary differential equation system (as in [78]). This system comprises the `bivalve–microplastic–Vibrio’ disease model.
Jmse 10 01837 g001
Figure 2. Experimental and model design for zebrafish. The proposed experiment (A) can evaluate different microplastic types/sizes to determine their effect on MMD uptake and accumulation in both adult fish and larvae, as well as the relationship between MMD uptake and pathogen (i.e., Vibrio spp.) occurrence and disease responses. The conceptual disease model (B) represents a simplified scheme of subpopulations, parameters, and processes that will be incorporated into an ordinary differential equation system referred to as the fish–microplastic–Vibrio disease model.
Jmse 10 01837 g002
Figure 3. Partial effects from the fitted GAM predicting microplastic abundance (number of occurrences of microplastics g 1 ) in an organism (for example bivalves or oysters) as a function of river flow (m 3 s 1 ), salinity, temperature ( C ), dissolved oxygen (%, percent dissolved oxygen saturation), salinity stratification index, and chlorophyll concentration (mg m 3 ). The degrees of freedom for smoothed fits are indicated in parentheses on the y-axis. Tick marks above the x-axis indicate the distribution of observations. The shaded area represents the 95% confidence intervals of partial effects.
Jmse 10 01837 g003
Figure 4. Partial effects from the fitted GAM predicting infection intensity (number of occurrences of the pathogen g 1 ) as a function of river flow (m 3 s 1 ), salinity, temperature ( C), dissolved oxygen (%, percent dissolved oxygen saturation), salinity stratification index, and chlorophyll concentration (mg m 3 ). The degrees of freedom for smoothed fits are indicated in parentheses on the y-axis. Tick marks above the x-axis indicate the distribution of observations. The shaded area represents the 95% confidence intervals of partial effects.
Jmse 10 01837 g004
Figure 5. Partial effect from the fitted GAM predicting infection intensity number of occurrences of the pathogen g 1 ) as a function of microplastic abundance (number of occurrences of microplastics g 1 ). The degrees of freedom for smoothed fits are indicated in parentheses on the y-axis. Tick marks above the x-axis indicate the distribution of observations. The shaded area represents the 95% confidence interval.
Jmse 10 01837 g005
Figure 6. Pathogen transmission simulation involving oysters (as a representative filter-feeder) and microplastics with adhered pathogens (infectious particles). Oysters were divided into three subpopulations (susceptible, infected, and dead/infected), and simulations were run based on an initial population of 100 susceptible oysters, 1 infected oyster, and 100 infectious particles. Parameter values for the simulations were as follows: β = 5 × 10⁻⁵, f = 2.5 × 10⁻⁴, m = 2 × 10⁻³, d = 2 × 10⁻², c = 2.5 × 10⁻², r = 5 × 10⁻², b I = 10, b D I = 20, a = 0, a T = 1 , S R C S = 0, S R C T = 0, and S R C M = 1. For this example, all rates associated with the non-competent host (T), such as particle uptake and pathogen inactivation, were considered null.
Jmse 10 01837 g006
Figure 7. Infection rate dynamics for a simulated oyster population (as an example of filter-feeders) filtering infectious microplastic particles. The simulation began with an initial population of 100 susceptible oysters, 1 infected oyster, and 100 infectious particles. Parameter values for the simulation were the same as for Figure 6.
Jmse 10 01837 g007
Figure 8. Pathogen transmission simulation involving zebrafish and microplastics with adhered pathogens (infectious particles). Zebrafish were divided into subpopulations that were further divided into adult and larval populations (i.e., susceptible adults and larvae, infected adults and larvae, and dead/infected adults and larvae). Simulations were run based on an initial population of 100 susceptible adults, 100 susceptible larvae, 1 infected adult, 1 infected larva, and 100 infectious particles. Parameter values for simulations were as follows: β A = 5 × 10⁻⁵, β L = 10 × 10−5, g = 0.001, f A = 2.5 × 10⁻⁴, f L = 1.25 × 10⁻⁴, m A = 2 × 10⁻³, m L = 4 × 10⁻³, d A = 2 × 10⁻², d L = 4 × 10⁻², c A and c L = 2.5 × 10⁻², r = 5 × 10⁻², b I A and b I L =10, b D I A and b D I L = 20, a = 0, S R C S A = 0, S R C S L = 0.5, S R C M = 2.
Jmse 10 01837 g008
Figure 9. Infection rate dynamics for fish (as an example of filter-feeder) filtering infectious microplastic particles. This simulation used an initial population of 100 susceptible adults, 100 susceptible larvae, 1 infected adult, 1 infected larva, and 100 infectious particles. Parameter values for this simulation were the same as for Figure 6.
Jmse 10 01837 g009
Table 1. Variables in the bivalve– and fish–microplastic–Vibrio models. There is no subindex for the oyster population, whereas the A and L subindexes in the fish model represent adult and larvae subpopulations, respectively. Note that the model has an implicit surface area for the host subpopulations and an implicit volume for the pathogens.
VariableDefinitionUnit
S , S A , S L Susceptible hosts in the populationNumber of individuals
I , I A , I L Infected individuals in the populationNumber of individuals
D I , D I A , D I L Dead infected individuals in the populationNumber of individuals
MMarine microplastic debris particles with adhered pathogensNumber of particles
TAlternate non-competent reservoir hostsNumber of individuals
Table 2. Parameters of the bivalve– and fish–microplastic–Vibrio disease transmission models. Note that the models implicitly include a surface area (in m 2 ) for oysters and volume (in m 3 ) for fish and microplastic particles. In the fish model, the subindex A represents adult fish and the subindex L represents fish larvae.
ParameterDefinitionUnit
β Transmission rate in oystersindividual 1 day 1
β A , β L Transmission rates in fishindividual 1 day 1
mDisease mortality rate in oystersday 1
m A , m L Disease mortality rate in fishday 1
gGrowth rate from larvae to adultday 1
d , d A , d L Removal rate of dead individuals by scavengers or decayday 1
b I , b I A , b I L Average number of M M D per IMMD particles
b I T Average number of M M D per TMMD particles
b D I Average M M D per D I MMD particles
c , c A , L Release rate of particles from Iday 1
c T Release rate of particles from Tday 1
c D I , c D I A , c D I L Release rate of particles from DIday 1
rLoss rate of MMD particles from the local environmentday 1
f , f A , f L Filtration/feeding rate of S and Im 3 individual 1 day 1
f T Filtration/feeding rate of Tm 3 individual 1 day 1
a , a A , a L Inactivation of pathogens in S and Iday 1
a T Inactivation of pathogens in Tday 1
Publisher’s Note: MDPI stays neutral with regard to jurisdictional claims in published maps and institutional affiliations.

