
Probabilistic Collapse Design and Safety Assessment of Sandwich Pipelines


Centre for Marine Technology and Ocean Engineering (CENTEC), Instituto Superior Técnico, Universidade de Lisboa, 1049-001 Lisbon, Portugal
*
Author to whom correspondence should be addressed.
J. Mar. Sci. Eng. 2022, 10(10), 1435; https://doi.org/10.3390/jmse10101435
Submission received: 26 August 2022
/
Revised: 26 September 2022
/
Accepted: 29 September 2022
/
Published: 5 October 2022
(This article belongs to the Special Issue Subsea Pipelines)
Abstract
:This paper presents an approach for probabilistic design and safety assessment of sandwich pipelines under external pressure. The methodology consists of the categorisation of sandwich pipeline collapse strength models based on interlayer adhesion conditions. The models are validated by comparing their predictions against collapse test data of sandwich pipelines. The accuracy of the strength models and their prediction uncertainty are used to select the best model in each category. Regarding interlayer adhesion categories, uncertainty propagation of models’ predictions over a wide range is assessed by the Monte Carlo simulation method. The proposed methodology is demonstrated using a case study of a sandwich pipeline with adequate probabilistic modelling of the basic random variables. Different limit states are defined for three categories of sandwich pipelines, based on which structural reliability indices are estimated. In employing the First Order Reliability Method for sensitivity analysis, the importance of basic variables of the limit states is evaluated. Later, a parametric analysis is conducted, presenting reliability variations for several design and operational scenarios of sandwich pipelines. Finally, to achieve a uniform level of structural reliability of sandwich pipelines, a few suggestions are provided, and practical partial safety factors are calculated. The results of the present analysis can provide guidance on the probabilistic design and operational safety assessment of sandwich pipelines.
1. Introduction
As the oil and gas industries move to ultra-deep waters and arctic conditions for hydrocarbon exploitation, they face challenges in designing well-insulated pipelines and risers proficient at enduring extreme operating conditions. In such cases, the pipelines are subjected to extreme hydrostatic pressure and are designed mainly to resist to collapse. The Pipe-in-Pipe (PiP) system has been seen as the most feasible solution to such problems [1]. A PiP system consists of two concentric pipes, where the annulus either is filled with non-structural insulating material, or it may carry water or an umbilical cable, among others. Some significant design guidance for PiPs can be tracked from DNV–ST–F101 [2] as the failure modes described are also applicable to them. The focus of the PiP system is to increase the insulation capacity to prevent any blockage of the pipe due to temperature falling below the temperature of paraffin or hydrate forming. Sandwich pipelines (SP) are a special case of PiP in which the cavity between pipes is filled with a structural core. In modern SPs, the thermal and structural requirements are dealt with from an overall perspective implying that the core material provides thermal insulation as well as structural resistance against the burst of the inner pipe and collapse of the outer pipe [3]. Thereby, greater strength with adequate flow assurance can be obtained in the case of SPs.
An SP may also be constituted by multiple layers of material bonded together over the main pipe, contributing to their single property as a global structural response. However, the present study is limited to two layered SPs (outer and inner metallic pipe). Figure 1 presents a sample of the SP specimen and geometry considered in this study. As far as the operating conditions of SPs are concerned, local buckling or simply collapse under external pressure is presumably the most dominating failure mode among all possible structural failures. Therefore, the collapse behaviour of SPs (two-layered) has been widely investigated through analytical, numerical, and experimental works [4,5,6,7]. In particular, the factors and circumstances governing collapse and buckle propagation of PiPs [8] and SPs [9,10] have been extensively studied.
The structural safety of SPs with an objective to support maintenance decisions can be assessed through a probabilistic analysis with duly defined uncertainty associated with the design variables. For conventional single-walled pipelines, probabilistic analyses using different burst failure models [12,13,14] are commonly conducted, whereas reliability assessment under external pressure is less frequent [15]. As per the literature review [4,5,6,7], collapse failure is the main concern of SP, and hence, an accurate collapse strength prediction is of utmost importance to the conceptual design process and for subsequent maintenance planning during the operational life of the SP system. Nonetheless, challenges exist regarding the prediction of the collapse pressure of SPs as it depends on the material and geometric properties of each layer (inner and outer pipe) and the extent of inter-layer adhesion [16]. A considerable amount of research work has been carried out analytically and numerically to deduce the collapse strength models for SPs. These studies have comprehended a broad variety of SP design configurations with different core materials and bonding conditions of the layers. However, the differences lie in theories, assumptions and idealisations of the failure behaviour adopted in developing these models. In the absence of dedicated codes for SPs, a few relevant models available in the literature can be adopted for design and reliability assessments.
Among the pioneer models, Sato and Patel [17] have developed a model for elastic buckling of SPs with a perfect bonded inter-layer relation. Their model can also be used for unbonded relation of SP layers. Early development in the last decade has indicated the greater significance of interlayer adhesion conditions on the collapse strength. In particular, Arjomandi and Taheri [16] have advocated four conditions of inter-layer relation: (i) the core layer is fully bonded to the inner and outer layer; (ii) the outer layer is bonded to the core, while the inner layer is free to slide in the tangential direction; (iii) the inner layer is bonded to the core, while the outer layer is free to slide; and (iv) the core is unbounded to both layers. They utilised the shell theory and developed kinematic relations for inner and outer pipes. Furthermore, this kinematic relation was applied linearly to the core layer. These simplifications of the collapse phenomenon, however, neglect radial and shear strain in the layers and nonlinear strain in the core layer. Hashemian and Mohareb [18,19] have used this nonlinearity in the formation of a complex kinematic relation to all the layers and developed an eigenvalue solution for SP. The models developed by them are rather complicated and arduous to use for quick prediction of collapse strength.
Due to the inherent complexity of the collapse phenomenon of SPs, there is always a compromise between the accuracy and simplicity of the models. Some of the complexities in the above-mentioned models arise due to the assumption of perfect geometry, elasticity, shell theory, and inter-layer adhesion, among others. Obviously, because of certain idealisation of the problem at hand in model formulations, their predictions deviate from reality in a wider range of SP configuration. As SP is a novel concept in pipeline technology, its mechanical behaviour is still not fully understood, not to mention the inherent reliability level during operation. As per the best of the authors’ knowledge, there is a scarcity of such an approach for SP that contributes to its structural safety and subsequent design. When the structural reliability analysis is required to be carried out, a target safety level should be deliberated to ensure that a certain safety level is always achieved. Moreover, to avoid unnecessary conservatism, accurate partial safety factors are to be calculated.
In accounting for the above facts, the present study assesses the structural safety of SP for collapse failure and reliability-based design probabilistically. The remainder of the paper is organised as follows. Section 2 describes the methodology comprising a discussion about the adopted collapse strength models and the approach for deterministic and probabilistic assessment of the collapse of SPs. In Section 3, a case study is developed to demonstrate the application of the methodology and the results are discussed. Following the results, important conclusions are drawn.
2. Methodology
This section describes the methodology adopted in this paper for holistic probabilistic analysis for safety assessment of SPs against collapse failure and reliability-based design. The present work follows up on the authors’ previous work [20], where the focus was to perceive and quantify the uncertainty among the collapse strength predictions of SPs. However, the present work concentrates on a methodology on how to assess the safety level in SP with uncertainty-associated and reliability-based design, as shown in Figure 2. The main steps and sub-steps of the proposed methodology are also presented in Figure 2. In the absence of a dedicated design code for SP, available strength models are identified. As collapse is the most potential failure mode, the collapse strength models are the appropriate choice for assessment. Further, these models are classified as per the interlayer adhesion conditions. The next step focuses on the assessment of uncertainty in the model’s predictions. The results of these analyses would help in selecting the best model in each category for ultimate limit state formulation. In using appropriate probabilistic modelling of limit state variables, reliability against collapse is assessed. Finally, for a target reliability level, a design case is conceptualised, and safety factors are estimated for safer operations. The steps are detailed in the following sub-sections.
2.1. Collapse Strength Models for SP
The collapse failure of SPs has become the focus of recent studies in which various aspects have been dealt with [9,21]. Especially, Castello et al. [11,22,23,24] have investigated the strength of SPs in different circumstances. These numerical studies are very useful yet specific to circumstances. So, they may not be used in general for collapse strength prediction. For the design and maintenance activities, the accurate and quick prediction of collapse strength is paramount. With such an objective, researchers have proposed several equations (also called strength models) with analytical or numerical methods with empirical techniques. Appendix A details the various collapse models of SP used in this study. Following a comprehensive analytical study, Sato and Patel [17] have proposed a model assuming that the core occupies the entire cavity. Using finite element simulations, Arjomandi and Taheri [16,25,26,27] have proposed a number of models depending on SP inter-layer adhesion conditions. In their recent study with nearly 12,000 finite element simulations [27], they recommended 12 models for three kinds of core material (soft, moderate, and hardcore). He et al. [28] have numerically investigated the effect of inter-layer adhesion strength, the relative angle between the main axis of the inner and outer pipes, with geometrical and material properties on the collapse strength of polypropylene cored SP. Recently, using cementitious composite, Yang et al. [4,5] conducted an experimental study followed by comprehensive numerical simulations for SP configurations resulting in a novel model. Additionally, they have used a model formed through automatic machine learning software EUREQA [29]. It should be noted that some of the above-mentioned models are very specific to the core material; however, for the sake of comparison, they are used in the present study. Moreover, it would also be interesting to know the importance of the basic variables in such models through sensitivity analysis.
2.2. Classification of Models
After a deep study and review of the collapse strength models, the authors propose to group the models into three categories, based on the inter-layer adhesion condition, i.e., (1) fully bonded core (FB) with the inner and outer layer, (2) partially bonded (PB) core that comprises core bonded with the inner and outer layer and core bonded with certain shear strength among layers and (3) unbonded core (UB) that can freely slide among layers (Appendix A). The category PB further has a few sub-classes as inner layer bonded to the core (IB), outer layer bonded to the core (OB), with a given shear stress of 1.5 (1.5) or 15 (15) MPa as evident with He et al. models [28].
The collapse strength models for SP are presented with their notations in Appendix A, showing few deviations in their structure. It should be noted that for the sake of consistency and simplification, the representation of the models in Appendix A may differ from that of the corresponding reference. The present study simplifies and modifies transcription, typesetting, and other issues.
The models’ symbols are improvised in the present study based on the model developer and interlayer adhesion condition specified under bracket—(). For example, models developed by Sato and Patel [17] are denoted by SP(FB) and SP(UB) for fully bonded and unbonded core conditions. Arjomandi and Taheri [16,25,26,27] have proposed a set of models starting with T1(FB) for fully bonded conditions, T2 and T3(FB,IB,OB,UB) based on different interlayer adhesion conditions and finally, 12 models according to adhesion and core elasticity. He et al. models [28] are denoted as HT(1.5) and HT(15). Finally, the two models developed by Yang et al. [4,5] for unbonded core are denoted as Yg(UB) and EQ(UB)—developed by EUREQA.
Due to their complexity and computational difficulty in further reliability formulation, the Hashemian and Mohareb [18,19] models are not incorporated here. It should also be noted that the present study only considers models for two layered SPs.
For the sake of consistency, all analyses are performed in the three categories of interlayer adhesion conditions to distinguish the results clearly.
2.3. Error Assessment
After selecting the collapse strength models (Appendix A), they are compared with collapse test data obtained from the literature (shown in Appendix B). All analyses are categorised into three sets of inter-layer adhesion conditions, as described above. Two important statistical parameters used in this paper to investigate the collapse strength models performance against test data are the absolute mean error (i.e., relative error on average) and its standard deviation, as shown below:
where denotes the calculated collapse pressure from a model, is experimental collapse pressure, and N is the total number of experiments.
In the previous work [20], it was revealed that a very high level of uncertainty is propagated while using model uncertainty factors. Therefore, they are not derived and used here. Moreover, more experimental data specific to each bonding condition is required to account for models’ uncertainty properly.
2.4. Deterministic Evaluation of Uncertainty
The deterministic collapse strength predictions from the collapse models are compared in a range of different SP design configurations. The variation in collapse strength is illustrated by the variation in these design variables. Uncertainty in terms of coefficient of variation (COV) among the different prediction models in each category is evaluated.
2.5. Probabilistic Assessment
Next, a practical SP case study is formulated, and stochastic properties are given to the basic design variables. The uncertainty propagation from the models is conducted using Monte Carlo simulation that generates a vector of independent random variables X to characterise the uncertainty on the mathematical modelling, loading, dimensions, and material properties of pipelines. This allows assessing the uncertainty in the model output (collapse pressure) due to the uncertainty in input variables (material and geometrical variables). The present study also assumes all variables to be mutually independent. If two or more basic variables are dependent, transformation methods such as Nataf or Rosenblatt may be used [30].
Later, the collapse strength models are used to formulate the limit state functions, which are used to evaluate the structural reliability of SPs. Based on the generalised form of limit state function formulated, the probability of a limit state violation, typically referred to as probability of failure (Pf), can be calculated as:
where is the joint probability density function of the vector X of random variables. Failure occurs when is less than or equal to zero. This region is called a failure region, whereas > 0 represents the safe region. Multidimensional integration is required to solve Equation (3), where the dimension of the integral is equal to the number of variables. The direct calculation of Pf from the integral is rather complicated, and computational techniques are often unfeasible. Therefore, approximate reliability methods such as the Monte Carlo Simulation (MCS) method or the First/Second-Order Reliability Methods (FORM/SORM) are frequently used.
The First Order Reliability Method (FORM) uses a first-order Taylor series expansion (linearisation in a standard normal space) of the limit state function about a point known as the most likely failure point or design point (u*). The first phase in this method consists of transforming non-normal variables into standard normal variables (see, e.g., Ditlevsen & Madsen [31] for further details on the transformation methods). The design point is obtained by solving a constrained optimisation problem that involves finding the point located on the limit-state surface, which has the minimum distance to the origin in the standard normal space. The smallest distance between the origin and this specific point on the limit state surface is known as the reliability index (). For linear and close-to-linear limit state functions, this solution is judiciously accurate. The Second Order Reliability Method (SORM) is mainly beneficial when the limit state function is nonlinear. The normal way is to approximate the failure surface by a quadratic hyper-surface rather than by a hyper-plane. If the limit state function is not too highly nonlinear, the failure possibility can be assessed from the limit state surface curvatures () at the FORM design point.
where is the ith principal curvature of the limit state surface g(u*) = 0 at u*. The above formulation is recognised as an asymptotic approximation which is accurate when . In other cases, some improvement terms are also added to the probability of failure. More formal discussion and derivations are accessible at [31]. Further details about the basic concepts and their applications of these approaches can be referred to in [30]. In the present study, FORM and SORM are adopted for reliability evaluation using the formulated limit state functions.
Furthermore, the present study examines the significance of the basic limit state variables on the reliability indices through a sensitivity analysis. The sensitivity measure or factor () can be calculated using the FORM approach [32], as:
with i = 1,2,3……m being the index related to each random variable involved in reliability analysis. The partial derivatives are estimated at the FORM design point u*, which represents the most probable failure point of the design random variables in the standard Gaussian space. The positive value indicates that the random variable (i) contributes positively (i.e., increases safety level or when it increases) and vice versa. In the present study, the sensitivity analysis is performed for the adopted SP collapse models.
Structural reliability methods have been extensively applied for code calibration. For an implicit safety level of SP, a consistent reliability level is required that can be assessed from partial safety factors. The partial safety factors in the design formats, such as the load and resistance partial safety factor design (LRFD) method, are expressed as:
where γL and γR are the partial safety factors for load (L) and resistance (R) characteristic values (variablec), respectively.
From the probabilistic models for the load and resistance terms, the partial safety factors can be calculated through the following equation:
where variable* are the design points obtained by FORM and variablec are the specified characteristic values. The characteristic values are fractiles of the corresponding probability distribution functions. In addition, by multiplication of the two partial safety factors, the design safety factor “k” can be obtained:
k = γL·γR
It is obvious that the reliability of pipes may be described as a function of the design variable. Unlike single-walled pipes, SPs have a greater number of significant design variables. So, the safety of SPs may become case specific; thus, parametric studies are conducted by varying the random variables of the basic case to different design and operational scenarios. The objective is to investigate the effect of variation of basic design variables on the reliability indices estimated with different strength models.
3. Results and Discussion
3.1. Experimental Validation of Strength Models
Some of the models are purely analytical, while others are empirical and based on numerical simulations. Though these models are validated with small-scale tests, it could be debated the applicability of these models’ predictions over a wider range. This section investigates the validity of these models (Appendix A) through a comparison with collapse tests reported in the literature [5,6,9,33].
A set of 24 collapse tests with geometric and material properties is presented in Appendix B, which are conducted on steel and aluminium prototypes. Models’ prediction with the experimental test comparison is presented in Figure 3. To assess the overall accuracy of models’ prediction, Equation (1) is used; moreover, the scatter can be estimated with Equation (2). The results are displayed in terms of mean and their variation in Figure 3. As T1(FB) and Yg(UB) exhibit very high deviation, they are not included in the figure. By means of minimum error T3(FB) followed by HT(15) are the best models, while with minimum variations T3(OB) is the most consistent one. It is important to note that the minimum error is still very high for all the models in all categories. The present statistical results have revealed the complexity of the problem that it is almost inviable to achieve an accurate prediction at all configurations of an SP. In other words, the use of these models may be better under a limited parametric range to keep conservatism or overestimation to a minimum. This would require a thorough parametric analysis performed in the next section.
3.2. Deterministic Assessment of SP Collapse Strength Models
This section aims to compare the performance of the adopted SP models’ collapse strength prediction parametrically. Despite the fact that some parametric studies have been presented by the models’ developers, it is imperative to witness such empirical equations’ (models) predictions under a common set of geometric and material parameters. The range of parameters used in present deterministic assessment (the parameters assume constant values) are shown in Table 1. The results of such analyses are particularly important to measure the applicability and shortcoming of these models for a broader range of design parameters. Appendix B presents the range of parameters for deterministic assessment (the parameters assume constant values). It is to be noted that the studied range is similar to that used in practical engineering design cases. The Poisson ratio of pipe and core materials are assumed to be constant as it remains constant for steel pipe, while Arjomandi and Taheri [26] have advocated that variation in the Poisson ratio of the core material has an insignificant influence on collapse pressure. In the present study, outer and inner pipes are made up of the same material (steel). However, for the core material, an appreciable elasticity range is assumed.
3.2.1. Effect of Outer Pipe Thickness
Undoubtedly, the thickness of the outer pipe is an important design parameter, so it is varied, and corresponding collapse strengths are evaluated from the adopted models. The results are presented in terms of collapse pressure (Pc) of SPs as a function of t1/r1 in Figure 4. The other parameters are assumed as Ec/Ep = 0.01, t2/r2 = 0.026, tc/rc = 0.23.
In the fully bonded core category (Figure 4a), T1(FB) becomes overestimated after a small increase in outer pipe thickness (t1/r1 > 0.03); T3(FB) remains almost constant in collapse strength with increasing thickness. T2(FB) and SP(FB) characterise a nearly linear increasing trend in collapse pressure with outer pipe thickness.
For partial bonded core models, three sets of patterns are observed, as presented in Figure 4b. T3(IB) and T3(OB) present close predictions that show a small increase in limit collapse pressure. The greatest increase in Pc vs t1/r1 with a similar prediction is shown by T2(IB) and T2 (OB). The collapse capacity predictions by HT models fall in between the other two trends.
Lastly, for unbonded core, Yg(UB and EQ(UB)) predict constant collapse pressure at all t1 while T3(UB) shows little rise in collapse strength. However, EQ(UB) is highly over-estimative in this category, followed by SP(UB). T2(UB) seems to provide a better correlation between Pc with an increase in t1/r1. In the present scheme of analyses, core thickness has been considered constant; however, if the inner pipe thickness is kept constant instead, analogous trends of Pc variation with outer pipe thickness would have been obtained.
3.2.2. Effect of Core Thickness
In this subsection, the influence of core thickness on the collapse strength of SPs is assessed and plotted in Figure 5 in the three categories of inner-layer adhesion. For this assessment other parameters are kept in the following ratio as Ec/Ep = 0.01, t1/r1 = 0.04, r2/r1 = 0.75. Figure 5a presents the effect of core thickness on the collapse capacity of SP for a fully bonded core. SP(FB) and T1(FB) are the models independent of expression for core thickness and thus provide a constant reading. Prediction by T2(FB) shows increasing linear trends while T3(FB) shows a near quadratic rise with an increase in core thickness.
As shown in Figure 5b, for the case of partially bonded models, three sets of increasing trends are observed (similar to the previous section). T2(OB) and T2(IB) prediction trends are fairly close and increase rapidly with core thickness. T3(OB) and T3(IB) prediction trends overlap and also show a steeper rise at higher core thickness. For both HT models, trends are similar (with minor differences), but their prediction is higher at a lower core thickness ratio (tc/rc < 0.15), but at higher thickness, lower predictions are observed (tc/rc > 0.3).
Under the category of unbonded core models, T3(UB) and Yg(UB) show little increase, while T2(UB) shows relatively higher collapse strength estimates as the core thickness increases. From the overall assessment of the results presented in this section, tc/rc has a significant effect approximately when tc/rc > 0.25.
3.2.3. Effect of Inner Pipe Thickness
For the collapse of SP, inner pipe geometry is not as significant as the outer pipe. In fact, it is a crucial factor when estimating the burst strength of the inner pipe and subsequently of SP. Yet, it is interesting to note the extent of influence of inner pipe thickness on Pc, as presented in Figure 6. The ratios, Ec/Ep = 0.01, t1/r1 = 0.03, r2/r1 = 0.75 are set for the present analysis.
Figure 6a presents the collapse pressure trends for fully bonded models. The effect of t2 on collapse capacity is nearly nil, as exhibited by all the models in this category. For partially bonded core, a little fall followed by a little increase in Pc is observed for most of the models. The little decrement in collapse strength is due to the compromise in core thickness while increasing the inner pipe thickness. SP(UB) and Yg(UB) models do not acknowledge any effect of t2/r2 on the Pc in their model formulation. Surprisingly, EQ(UB) show the negative impact of increasing inner pipe thickness. T2(UB) and T3(UB) perceive a slight rise in the collapse strength at a higher thickness of the inner pipe. This section has indicated that the inner pipe has very little effect on the Pc.
3.2.4. Effect of Core Material Elasticity
One of the typical features of SP is the core material being a structural element of the entire system. In this context, the importance of its structural property on the overall strength of SP is significant. This section reveals that different models’ predictions are influenced by core material elasticity. To trace only elasticity effect on predictions, other parameters are kept constant as t1/r1 = 0.04, t2/r2 = 0.27, r2/r1 = 0.74. tc/rc = 0.23.
For the sake of comparison, two scenarios of SPs are assumed. The first case is when the core is non-structural, implying Ec = 0, the corresponding collapse strength of SP will be equal to that of a single walled pipe. The collapse pressure of a single-walled pipe can be calculated by the following equation from DNV [2]:
where = elastic pressure; = plastic pressure; D = maximum diameter of pipe; t = maximum thickness of pipe and = ovality of pipe (≥0.005).
where E = Young’s modulus of elasticity of the pipe material and = Poisson ratio.
where σ = yield strength of the pipe.
The collapse pressure for the first case (Ec = 0) with t = t1, D = D1 and E = Ep in Equation (9) is calculated 3.569 MPa. Similarly, an upper bound can be established (Ec/Ep = 1). For this case, the collapse strength of SP can be calculated by Equation (9), with t = t1 + tc + t2, D = D1 and E = Ep. The collapse strength calculated for this case is 119.27 MPa using Equation (9).
As seen in Figure 7, all models in all categories exhibit a nearly linear trend for change in Pc with Ec/Ep. Another important observation is that many models predict near zero strength when Ec reaches zero, which should be equal to collapse strength in the first case. Surprisingly, many models predict far greater strength than the upper bound of collapse strength way before the point Ec/Ep = 1.
As per Figure 7a in fully bonded core models, the SP(FB) and T2(FB) predictions have a large bearing on Ec as they become highly over estimative for Ec/Ep > 0.02, which may not be admissible. The model T1(FB) also shows a higher increase in Pc after this level.
In the category of partial bonded condition (Figure 7b), T2(IB) and T2(OB) have a very close prediction that provides high estimates of collapse capacity. T3(IB) and T3(OB) again show similar trends that seem more reasonable in this category. Accounting similar findings in Figure 7c, T2(UB) and T3(UB) also show reasonable maximum strength trends.
HT(1.5), HT(15), EQ(UB) and Yg(UB) models were developed with specific core material, so their predictions are unbiased with changes in Ec.
The inference of this section is that the SP models are vastly dependent on the core material structural property, and their validity lies in a specific range of Ec only. For example, fully bonded models should not be applied when Ec/Ep > 0.01. Other models are also to be used under Ec/Ep < 0.1 since a linear extrapolation will lead to erroneous results.
3.3. Probabilistic Analysis
The above sections have explored the performance of the models and their distinct behaviour with observed data and have identified some extreme behaviour of models’ predictions at different configurations. An SP case study is developed based on a test case from literature with slight modifications for better utilisation [4]. The parameters’ uncertainties are provided from the literature, e.g., some variabilities (for diameter, thickness, and strength) are adopted following the probabilistic distributions adopted by Teixeira et al. [15]. Similarly, the stochastic model for pipe and core elasticity follows from Ref. [34]. Poisson ratios for pipe and core material have been provided minimum COV as that of diameter and assumed normally distributed. All the basic random variables and their probabilistic models are shown in Table 2. Log-normal (LN) parameters are also presented for respective distribution.
It is obvious that an SP is superior in structural strength as compared to an equivalent single-walled pipe. In other words, the collapse strength of an SP must be greater than that of an equivalent single-walled pipe. An equivalent pipe can be conceptualised from SP using an equal amount of steel used and has the same functional requirement (equal inner diameter of inner pipe of an SP). The collapse capability for single-walled equivalent (Peq) pipe is calculated from Equation (9).
3.3.1. Uncertainty Propagation
In order to assess the uncertainty of the SP models, the Monte Carlo simulation method is used, which generates the number of output samples using the probabilistic properties of input variables. In this study, 10,000 simulations are performed using the probabilistic framework outlined in Table 2. The uncertainty in collapse strength in terms of COV is estimated for each model, as presented in Figure 8. Additionally, the figure also illustrates the average model prediction (Pc) normalised with Peq. Monte Carlo simulation is an approximate method, and therefore their predictions are always associated with some error. However, by increasing the number of simulations, the error can be minimised. Figure 9 provides the prediction error (PE in %) of the normalised mean collapse pressure calculated from the 95% confidence interval of the mean. Interestingly, in the present simulations, the error stays less than 0.1% for all the models.
Interestingly, the collapse strength predicted by some unbonded core models—Yg(UB) and T2(UB)—is quite close to that of the equivalent pipe. SP(UB) and EQ(UB) models are exceptional at predicting the collapse pressure in this category. T3(UB) is the only model that under-predicts the collapse strength. Subsequently, the partially bonded models are capable of larger collapse capability (at least twice) of that of an equivalent pipe. In the fully bonded core category, the models’ predictions are notably greater (at least 3.5 times) than of an equivalent pipe. In this category, T1(FB) is over-predictive as the same behaviour seen in previous sections. These findings corroborate the fact that the SPs are always operationally superior and beneficial compared to a single-walled pipe (with the same basic functional requirement).
Minimum COV is associated with EQ(UB) and Yg(UB) models, however, this is due to their relatively lesser dependence on the basic design parameters. For most of the models in all categories, the COV lies between 0.045 to 0.05, except for T1(FB).
3.3.2. Estimation of Reliability Indices
The collapse strength (resistance for external over pressure) of SP has been the focus so far in this study. Furthermore, for the structural reliability analysis of SP, the limit state function is formed from loading and resistance. In SP, the loading is the hydrostatic pressure acting externally on the outer surface of SP. The external pressure is considered acting alone on the SP while the other loads are neglected.
For the present study, the external pressure on the sandwich pipe is assumed to be the maximum capacity of an equivalent single-walled pipe. The characteristic value of the external pressure () can be calculated by DNV [2] requirement for an intact single-walled pipe under external pressure.
where Pmin is the minimum internal pressure assumed nil, γm and γSC are the factors accounting for material resistance and safety class, respectively, adopted from DNV [2].
From the analysis conducted so far, some significant conclusions can be drawn for selecting the most appropriate strength model. Clearly, T3 models are the most stable and reasonable in each category and thus adopted for design and reliability analysis.
It is evident from the above section that the partially and fully bonded core condition offers higher collapse pressure than unbonded core. More specifically, in the previous section, it was shown that sandwich pipes with a fully bonded and partially bonded core show at least thrice and twice the collapse capacity with respect to the equivalent pipe and should be realised under higher loading for optimisation.
From Figure 8, T3(FB) has 3.5 times higher strength than a similar equivalent pipe; in the partial bonded category, T3(IB) and T3(OB) provide 2 and 2.1 times the strength. T3(UB) is the only model that predicts inferior strength (around 0.6 times) to the equivalent pipe. Considering this fact and accounting for the additional strength in reliability results, the present study adopts that the loading on three categories of sandwich pipelines are to be multiplied by an over-strength factor. This results in four forms of limit state functions in each category given as:
The statistical properties of basic design variables are taken from Table 2 with their characteristic values. The characteristic values of diameters, thickness, Poisson ratio and Young’s modulus assume their 50 percentiles, while for the strength parameters, it is assumed to be the 5 percentiles. The probabilistic model for Pext is derived similarly to that by Teixeira et al. [15] and is given below in Table 3.
In probabilistic analysis, it is seldom necessary to introduce model deviations in terms of model uncertainty factors. However, with the limited data set and very high deviations for some models, as clearly observed in Figure 3, model uncertainty factors are not derived. Moreover, the previous study [20] has clearly indicated their inadequacy for the present case.
The reliability index (β) of the outer pipe collapse failure mode due to external pressure is estimated by the SORM method (described in Section 3) and shown in Table 4. The SORM method is deliberately used here to capture the effect of nonlinearity of the limit state function.
The reliability results are fairly in concordance for the three categories of SPs as comparable reliability indices are obtained. In particular, T3(FB) prescribes the highest reliability, while T3(IB) is associated with the minimum reliability. The aim here is to understand the peculiarities associated with the structural reliability of SP. The results presented here do not claim to be the actual reliability of an operational SP as the external pressure at the installation must be used in limit state function. However, in the present study, external pressure is proportional to the collapse capacity of an equivalent single-walled pipe. Thus, the information displayed in Table 4 signifies the high reliabilities of SP with respect to an equivalent pipe.
3.3.3. Sensitivity Analysis
SP involves several design parameters, and it is always interesting to note which parameters have a greater influence on reliability. In the present section, sensitivity analysis is conducted (using Equation (5)) to quantify the relative importance of each random variable on limit state functions by different models. The importance of each variable to the uncertainty of the limit state functions with corresponding models is assessed using FORM and presented in Table 5 with respect to each model. The highest sensitivity factor is found for Pext for almost all the models in all categories. All models reflect the second highest importance for Ep, which is an important material property. A negative sign in sensitivity factors for a variable implies that an increase in the variable reduces the reliability. Surprisingly, inner pipe geometrical parameters (D2 and t2 in some models) contribute negatively. σ1 and σ2 have negligible impact on limit state functions.
3.3.4. Design Case for Target Reliability
As for single-walled pipelines, the required safety level of SP can be obtained from the DNV code [2]. SPs are specialised pipes used for extreme conditions, and hence designers should consider high safety class.
A target reliability index of 4.265 (probability of failure = 10−5) is adopted as the design target to satisfy the safety class—high and against the ultimate limit state of SPs. The analysis starts by identifying an adequate operational condition for SPs with different core adhesion conditions in the case study for the target safety level. Table 6 presents the safe depths for SP with different core bonding states. Fully bonded core SP having the highest collapse strength can be operational at around 2900 m; for the same dimensions, partially bonded core SPs can work safely at around 1600 m, while unbonded core SPs are suitable for 489 m.
3.3.5. Partial Safety Factors
The partial safety factors are interpreted as a factor that should be applied to the characteristic values of the variables to obtain a uniform safety level. This section aims to derive partial safety factors based on the target reliability level. As a continuation of the analysis from the previous section, this section explores the partial safety factors for the load and resistance for maintaining the target reliability. In using Equations (6) and (7), partial safety factors for load and resistance are calculated. In addition, the overall safety factor (k) is also calculated using Equation (8). Table 7 summarises the results of the partial safety factors estimated for design variables for three categories of SPs.
It is obvious that the models are limited and associated with very high prediction uncertainty. Still, the present approach has indicated means to assess adequate reliability levels and safety factors. Moreover, with more data and research advancement, the present approach can be better utilised.
3.4. Parametric Analysis
In this section, several parametric analyses are performed by varying the design variables, and operating parameters of the limit state functions and corresponding reliabilities are estimated for models in three categories of SPs. Different design and operational scenarios are thus constituted, and the performance of models is observed accordingly. It is to be noted that the characteristic collapse pressure trends for SP are far different from conventional single-walled pipes due to the existence of higher uncertainties (as discussed above in Section 3.2).
3.4.1. Reliability Variation with Outer Pipe Thickness
As for SP, the outer pipe thickness is the most significant design variable, some scenarios around the base case study are depicted by varying t1. Figure 10 shows the β calculated for three categories of SPs as a function of t1/r1. It is observed that the reliability decreases and then increases with the increase in pipe thickness, which can be easily explained by the fact that r1 also increases with t1. The t1 seems to make more impact in unbounded core models as the trends take a higher curve after t1/r1 = 0.02. In the category of partially bonded core models, the reliability tends to change slightly after t1/r1 = 0.02. It is clear from Section 3.2.3 that the inner pipe thickness has barely any effect on the collapse capacity of the pipe; consequently, it would have a negligible effect on reliability indices, and thus it is not accounted for.
3.4.2. Reliability Variation with Core Thickness
As the structural core is a distinct feature of SPs, it is believed necessary to observe the effect of its thickness on the reliability of SPs. Figure 11 presents the trends for β estimated from three categories with increasing core thickness at the compensation of inner pipe thickness. Interestingly, increasing linear trends can be perceived for three categories (4 models). For partially bonded conditions, after tc/rc = 0.32, no improvement in reliability can be obtained with a further increase in core thickness. Core thickness is the predominant variable as a 3 mm increase in core thickness improves reliability indices by 4.63 for T3(FB), 4.52 for T3(OB), 4.68 for T3(IB), and 5.51 for T3(UB).
3.4.3. Reliability Variation with External Pressure
Finally, Figure 12 illustrates β as a function of external pressure. As expected, increasing the external pressure on SP would significantly decrease their reliability. The results trends are rather linear in the three sets of SP design configurations, influencing the reliability to almost the same extent. It should be acknowledged that the reliability indices are very contextual to the design case under consideration. However, the analysis of the trends is important as the models’ behaviour is deemed to remain the same. A 40% increase in external pressure reduces the reliability of SP by 74% for T3(FB), 73% for T3(OB), 74% for T3(IB), and 76% for T3(UB).
The geometric imperfections are not considered in the present study because neither they are design parameters nor are significant with respect to analytical importance.
4. Conclusions
This paper has contributed with a comprehensive probabilistic assessment for collapse failure of sandwich pipelines with available strength models. First, the adopted methodology is illustrated, outlining the main steps of a comprehensive assessment. All results are distinguished in fully bonded, partially bonded and unbonded core categories based on SP interlayer adhesion conditions. In order to verify the validity of adopted collapse strength models, they are compared against experimental data. It is found that all the models deviate significantly from test data, and further research is required for accurate predictions of the collapse strength of SPs.
Later, a detailed deterministic-based analysis is carried out to illustrate prediction capability at different SP design configurations. Outer pipe and core thickness have much influence on collapse strength, while inner pipe thickness has negligible impact. Young’s modulus of the core is a very important parameter, and most of the models must be utilised under a given range of Young’s modulus for correct predictions. Uncertainty among models’ predictions is perceived in different SP design cases.
Probabilistic modelling is applied to the basic random variables, and uncertainty in collapse strength is assessed through the Monte Carlo simulation method. For most of the models in all categories, the COV lies between 0.045 to 0.050.
For the safety assessment of sandwich pipelines, four limit state functions are formulated under external pressure. For the base case scenario, reliability is estimated with Second Order Reliability Methods. Fully bonded core models result in a reliability index of 4.65; in partially bonded conditions, reliability is estimated at around 4.3; and a high-reliability index (4.5) is associated with unbonded core models. Through First Order Reliability Method-based sensitivity analysis, external pressure is found to be the most important parameter for safety, followed by Young’s modulus of elasticity. In the absence of a standard or code, the present study defines the target safety level, and the design safety factors are derived accordingly. Some parametric studies evaluating reliability are conducted for different design and operational scenarios.
The objective of the present analysis is to demonstrate that even with limited data and models, it is possible to apply explicit safety standards to SPs.
Author Contributions
Conceptualization, U.B., A.P.T. and C.G.S.; methodology, U.B. and A.P.T.; software, U.B.; validation, U.B.; formal analysis, U.B.; investigation, U.B.; resources, A.P.T. and C.G.S.; data curation, U.B. and A.P.T.; writing—original draft preparation, U.B.; writing—review and editing, A.P.T. and C.G.S.; visualization, U.B.; supervision, A.P.T. and C.G.S.; project administration, C.G.S.; funding acquisition, C.G.S. All authors have read and agreed to the published version of the manuscript.
Funding
This work contributes to the project “Cementitious cork composites for improved thermal performance of pipelines for ultradeep waters—SUPBSEAPIPE, with the reference n.° POCI-01-0145-FEDER-031011 funded by European Regional Development Fund (FEDER) through COMPETE2020—Operational Program Competitiveness and Internationalisation (POCI) and with financial support from the Portuguese Foundation for Science and Technology (Fundação para a Ciência e Tecnologia—FCT), through national funds. This study also contributes to the Strategic Research Plan of the Centre for Marine Technology and Ocean Engineering, which is financed by Portuguese Foundation for Science and Technology (Fundação para a Ciência e Tecnologia—FCT), under contract UIDB/UIDP/00134/2020.
Institutional Review Board Statement
Not applicable.
Informed Consent Statement
Not applicable.
Data Availability Statement
Not applicable.
Conflicts of Interest
The authors declare no conflict of interest.
Nomenclature and Symbols
| Symbols | Description |
| Sensitivity measure or factor | |
| Collapse pressure | |
| Calibrated model prediction | |
| Collapse pressure of outer pipe | |
| Elastic pressure | |
| Experimental collapse pressure | |
| Plastic pressure | |
| Joint probability density function | |
| Ovality of pipe | |
| Limit state surface curvatures | |
| Yield strength of outer (1) and inner pipe (2) | |
| a, b, c, d, e, f, g, h, i, j, k, l, m | Coefficients in T3 model |
| COV | Coefficient of variation |
| D1,2 | Outer diameter of outer (1) and inner pipe (2) |
| Ep,c | Young’s modulus of pipe (p) and core (c) |
| EQ() | EUREQA model |
| FB | Fully bonded core |
| FORM | First Order Reliability Method |
| h1–16 | Coefficients in HT model |
| HT() | Models by He et al. |
| k | Design safety factor |
| L | Load |
| LN | Log Normal distribution |
| LRFD | Load and resistance partial safety factor design |
| MCS | Monte Carlo Simulation |
| N | Normal distribution |
| N | Number of experiments |
| n | Buckling mode number |
| PB | Partially bonded core |
| Peq | Collapse capability for single walled equivalent pipe |
| Pf | Probability of failure |
| PiP | Pipe in Pipe |
| Pmin | Minimum internal pressure |
| R | Resistance |
| r1,2, c | Maximum radius of outer (1), inner pipe (2) and core (c) |
| s | Standard deviation |
| SORM | Second Order Reliability Method |
| SP | Sandwich pipelines |
| SP() | Models by Sato and Patel |
| t1,2, c | Maximum thickness for outer (1), inner pipe (2) and core (c) layers of SP |
| T1,2,3() | Models by Arjomandi and Taheri |
| u* | Design point |
| UB | Unbonded core |
| vp,c | Poisson ratio of pipe (p) and core (c) |
| Xc | Model uncertainty factor |
| Yg() | Models by Yang et al. |
| γL, γR | Partial safety factors for load (L) and resistance (R) |
| γm and γSC | Factors accounting for material resistance (m) and safety class (SC) |
| θ0–15 | Coefficients in Yang et al. model |
| κ, α1–2, γ1–3, ξ1–4 | Coefficients in T2 model |
| μ | Absolute mean error |
| Limit state function | |
| Reliability index | |
| PE | Prediction Error |
Appendix A

Table A1.
Collapse strength models for sandwich pipes.
| Model Description | Symbol Ref. | ||||||||||
|---|---|---|---|---|---|---|---|---|---|---|---|
| 1. | Fully bonded | ||||||||||
| SP(FB) [17] | |||||||||||
| T1(FB) [25] | |||||||||||
| T2(FB) [26] | |||||||||||
| κ | α1 | α2 | γ1 | γ2 | γ3 | ξ1 | ξ2 | ξ3 | ξ4 | ||
| 0.9844 | −0.5444 | 0.1 | 0.474 | 0.98 | 1.062 | 0.43 | 0.079 | −0.1031 | 2.8 | ||
| T3(FB) [27] | |||||||||||
| a | b | c | d | e | f | g | |||||
| (Ec = 0.1) | 2.032 | 0.909 | 0.377 | 1.055 | 0.759 | 0.152 | 0.884 | ||||
| (Ec = 0.01) | 0.765 | 1.068 | 0.253 | 0.89 | 0.422 | 0.148 | 0.947 | ||||
| (Ec = 0.001) | 1.406 | 2.102 | −0.134 | 0.747 | 0.231 | −0.016 | 2.742 | ||||
| h | i | j | k | l | m | ||||||
| (Ec = 0.1) | −0.224 | 1.021 | 7.25 × 10⁻² | −0.067 | −0.094 | 3.833 | |||||
| (Ec = 0.01) | 0.112 | 0.777 | 6.02 × 10⁻² | −0.943 | −0.689 | 3.871 | |||||
| (Ec = 0.001) | −0.515 | 0.317 | 2.46 × 10⁻² | −0.244 | 0.206 | 1.133 | |||||
| 2. | Partially bonded core | ||||||||||
| a | Outer bonded | ||||||||||
| Pc same as T2(FB), coefficient given below | T2(OB) [26] | ||||||||||
| κ | α1 | α2 | γ1 | γ2 | γ3 | ξ1 | ξ2 | ξ3 | ξ4 | ||
| 1.019 | 0.2461 | −0.0904 | 0.816 | 0.982 | 3.146 | 0.1792 | 0.0329 | −0.1062 | 2.929 | ||
| Pc same as T3(FB), coefficient given below | T3(OB) [27] | ||||||||||
| b | c | d | e | f | g | ||||||
| (Ec = 0.1) | 0.773 | 1.757 | −1.018 | 1.148 | 0.182 | −0.032 | 0.648 | ||||
| (Ec = 0.01) | 5.21 | 2.552 | −0.083 | 0.795 | 3.029 | 0.026 | 2.391 | ||||
| (Ec = 0.001) | 3.071 | 2.617 | −0.111 | 0.662 | 0.102 | −0.234 | 2.695 | ||||
| h | i | j | k | l | m | ||||||
| (Ec = 0.1) | 0.964 | 0.586 | 3.40 × 10⁻² | −0.341 | −0.198 | 4.444 | |||||
| (Ec = 0.01) | −0.039 | 0.741 | 2.42 × 10⁻³ | −0.153 | −0.033 | 2.622 | |||||
| (Ec = 0.001) | −0.093 | 0.176 | 1.59 × 10⁻³ | −0.043 | 0.033 | 3.272 | |||||
| b | Inner bonded | ||||||||||
| Pc same as T2(FB), coefficient given below | T2(IB) [26] | ||||||||||
| κ | α1 | α2 | γ1 | γ2 | γ3 | ξ1 | ξ2 | ξ3 | ξ4 | ||
| 0.9814 | 1.3922 | 0.083 | 0.712 | 0.962 | 2.827 | 0.202 | 0.041 | −0.188 | 2.913 | ||
| Pc same as T3(FB), coefficient given below | T3(IB) [27] | ||||||||||
| a | b | c | d | e | f | g | |||||
| (Ec = 0.1) | 1.26 | 0.63 | 1.54 | 0.81 | 0.01 | 0.52 | 0.48 | ||||
| (Ec = 0.01) | 1.45 | 2.14 | 0.14 | 0.66 | 4.85 | −0.01 | 2.71 | ||||
| (Ec = 0.001) | 1.29 | 2.33 | 0.03 | 0.6 | 0.01 | −0.47 | 0.69 | ||||
| h | i | j | k | l | m | ||||||
| (Ec = 0.1) | −1.25 | 0.75 | 4.02 × 10⁻² | −0.06 | −0.29 | 3.95 | |||||
| (Ec = 0.01) | −0.17 | 0.77 | 1.74 × 10⁻³ | −0.12 | −0.21 | 2.8 | |||||
| (Ec= 0.001) | 2.27 | 0.45 | 3.66 × 10⁻² | −0.25 | 3.11 | −0.46 | |||||
| c | Inter−layer adhesion | ||||||||||
| HT (1.5) [28] | |||||||||||
| h1 | h2 | h3 | h4 | h5 | h6 | h7 | h8 | ||||
| 28.538 | 4.249 | 1.191 | −0.028 | 0.341 | 0.744 | −0.002 | 0.085 | ||||
| h9 | h10 | h11 | h12 | h13 | h14 | h15 | h16 | ||||
| 2.472 | 0.585 | −0.176 | 9.54 × 10⁻⁶ | 0.286 | −3.071 | −0.094 | −0.359 | ||||
| Pc same as above, coefficient given below | HT (15) [28] | ||||||||||
| h1 | h2 | h3 | h4 | h5 | h6 | h7 | h8 | ||||
| 31.791 | 3.04 | 0.701 | −0.126 | 0.915 | 0.059 | 0.163 | −0.221 | ||||
| h9 | h10 | h11 | h12 | h13 | h14 | h15 | h16 | ||||
| 1.138 | 0.53 | −0.136 | 7.29 × 10⁻⁶ | 0.038 | −3.993 | −0.319 | −0.077 | ||||
| 3. | Core unbounded | ||||||||||
| SP(UB) [17] | |||||||||||
| Pc same as T2(FB), coefficient given below | T2(UB) [26] | ||||||||||
| κ | α1 | α2 | γ1 | γ2 | γ3 | ξ1 | ξ2 | ξ3 | ξ4 | ||
| 0.9833 | 1.106 | −0.0945 | 0.336 | 0.966 | 3.631 | 0.1589 | 0.0184 | −0.0837 | 3.01 | ||
| Pc same as T3(FB), coefficient given below | T3(UB) [27] | ||||||||||
| a | b | c | d | e | f | g | |||||
| (Ec = 0.1) | 3.42 | 3.26 | −0.5 | 0.59 | 0.06 | −0.15 | −0.12 | ||||
| (Ec = 0.01) | 0.77 | 2.63 | −0.21 | 0.47 | 0.02 | −0.04 | −0.12 | ||||
| (Ec = 0.001) | 2.14 | 2.7 | −0.04 | 0.54 | 0.19 | −0.06 | 0.27 | ||||
| h | i | j | k | l | m | ||||||
| (Ec = 0.1) | 3.12 | 0.3 | 0.00697 | 0.07 | 2.87 | −1.53 | |||||
| (Ec = 0.01) | 3.21 | 0.4 | 0.0766 | −0.03 | 2.91 | −0.27 | |||||
| (Ec = 0.001) | 4.48 | 0.6 | 0.0675 | −0.2 | 3.03 | −0.21 | |||||
| Yg(UB) [4] | |||||||||||
| θ0 | θ1 | θ2 | θ3 | θ4 | θ5 | θ6 | θ7 | ||||
| −5.8433 | 7.65762 | −0.0226 | −0.0877 | 0.42328 | 3.240446 | −0.6458 | 0.56457 | ||||
| θ8 | θ9 | θ10 | θ11 | θ12 | θ13 | θ14 | θ15 | ||||
| 14.115 | 0.72154 | 0.8829 | 0.36618 | 23.4687 | 4.2532 | −0.7719 | 0.29961 | ||||
| EQ(UB) [4] | |||||||||||
Appendix B
| SP | D1 | t1 | tc | D2 | t2 | Pexp (MPa) |
|---|---|---|---|---|---|---|
| Steel pipe, Cementitious core | 203.2 | 2 | 23.4 | 152.4 | 2 | 37.68 |
| 203.2 | 2 | 23.4 | 152.4 | 2 | 35.96 | |
| 203.2 | 2 | 23.4 | 152.4 | 2 | 35.23 | |
| 203.2 | 2 | 23.4 | 152.4 | 2 | 37.18 | |
| 203.2 | 2 | 23.4 | 152.4 | 2 | 36.92 | |
| 219.08 | 2.77 | 22.63 | 168.28 | 2.77 | 38.71 | |
| 219.08 | 2.77 | 22.63 | 168.28 | 2.77 | 34.29 | |
| 219.08 | 2.77 | 22.63 | 168.28 | 2.77 | 37.57 | |
| 219.08 | 2.77 | 22.63 | 168.28 | 2.77 | 39.05 | |
| Aluminium pipe, Polypropylene core | 74.97 | 1.62 | 11.29 | 49.15 | 1.62 | 43.35 |
| 75.92 | 1.65 | 11.13 | 50.36 | 1.63 | 34.09 | |
| 62.16 | 1.47 | 4.23 | 50.76 | 1.68 | 10.98 | |
| 62.25 | 1.47 | 4.3 | 50.71 | 1.67 | 12.11 | |
| 75.4 | 1.62 | 11.26 | 49.64 | 1.68 | 37.64 | |
| 75.18 | 1.61 | 11.1 | 49.76 | 1.62 | 31.14 | |
| 62.1 | 1.46 | 4.62 | 49.94 | 1.7 | 20.31 | |
| 62.39 | 1.49 | 4.69 | 50.03 | 1.69 | 17.13 | |
| Aluminium pipe, Polypropylene core | 69.44 | 3.34 | 5.5 | 50.96 | 3.19 | 4.9 |
| 70 | 3 | 5.33 | 50.96 | 3.08 | 11.52 | |
| 70 | 3 | 5.33 | 50.96 | 4.08 | 13.1 | |
| 70 | 3 | 5.33 | 50.96 | 5.08 | 11.06 | |
| Steel pipe, Cementitious core | 202.8 | 2 | 23.2 | 152.4 | 1.8 | 30.5 |
| 203 | 2 | 23.2 | 152.6 | 1.8 | 30.6 | |
| 203 | 2 | 23.2 | 152.6 | 1.8 | 29.7 |
References
- Bhardwaj, U.; Teixeira, A.P.; Guedes Soares, C. Reliability Assessment of a Subsea Pipe-in-Pipe System for Major Failure Modes. Int. J. Press. Vessel. Pip. 2020, 188, 104177. [Google Scholar] [CrossRef]
- Standard-ST-F101; Submarine Pipeline Systems. DNV: Byrum, Norway, 2021; Det Norske Veritas Elendom AS.
- Netto, T.A.; Santos, J.M.C.; Estefen, S.F. Sandwich Pipes for Ultra-Deep Waters. In Proceedings of the 2002 4th International Pipeline Conference, Calgary, AB, Canada, 29 September–3 October 2002; pp. 2093–2101. [Google Scholar] [CrossRef]
- Yang, J.; Estefen, S.F.; Fu, G.; Paz, C.M.; Lourenço, M.I. Collapse Pressure of Sandwich Pipes with Strain-Hardening Cementitious Composite-Part 2: A Suitable Prediction Equation. Thin-Walled Struct. 2020, 148, 106606. [Google Scholar] [CrossRef]
- Yang, J.; Paz, C.M.; Estefen, S.F.; Fu, G.; Lourenço, M.I. Collapse Pressure of Sandwich Pipes with Strain-Hardening Cementitious Composite-Part 1: Experiments and Parametric Study. Thin-Walled Struct. 2020, 148, 106605. [Google Scholar] [CrossRef]
- An, C.; Duan, M.; Toledo Filho, R.D.; Estefen, S.F. Collapse of Sandwich Pipes with PVA Fiber Reinforced Cementitious Composites Core under External Pressure. Ocean Eng. 2014, 82, 1–13. [Google Scholar] [CrossRef]
- Castello, X.; Estefen, S.F.; Leon, H.R.; Fritz, M. Collapse of Sandwich Pipes with Different Annular Materials. In Proceedings of the IBP-Rio Pipeline Conference & Exposition, Rio de Janeiro, Brazil, 2–4 October 2007. [Google Scholar] [CrossRef]
- Alrsai, M.; Karampour, H.; Albermani, F. Numerical Study and Parametric Analysis of the Propagation Buckling Behaviour of Subsea Pipe-in-Pipe Systems. Thin-Walled Struct. 2018, 125, 119–128. [Google Scholar] [CrossRef] [Green Version]
- Estefen, S.F.; Netto, T.A.; Pasqualino, I.P. Strength Analyses of Sandwich Pipes for Ultra Deepwaters. ASME J. Appl. Mech. 2005, 72, 599–608. [Google Scholar] [CrossRef]
- Xu, Q.; Gong, S.; Hu, Q. Collapse Analyses of Sandwich Pipes under External Pressure Considering Inter-Layer Adhesion Behaviour. Mar. Struct. 2016, 50, 72–94. [Google Scholar] [CrossRef]
- Castello, X.; Estefen, S.F. Adhesion Effect on the Ultimate Strength of Sandwich Pipes. In Proceedings of the 25th International Conference on Offshore Mechanics and Arctic Engineering, Hamburg, Germany, 4–9 June 2006. ASME Paper No. OMAE2006-92481. [Google Scholar]
- Teixeira, A.P.; Zayed, A.; Guedes Soares, C. Reliability of Pipelines with Non-Uniform Corrosion. J. Ocean Sh. Technol. 2010, 1, 12–30. [Google Scholar]
- Teixeira, A.P.; Guedes Soares, C.; Netto, T.A.; Estefen, S.F. Reliability of Pipelines with Corrosion Defects. Int. J. Press. Vessel. Pip. 2008, 85, 228–237. [Google Scholar] [CrossRef]
- Bhardwaj, U.; Teixeira, A.P.; Guedes Soares, C.; Azad, M.S.; Punurai, W.; Asavadorndeja, P. Reliability Assessment of Thick High Strength Pipelines with Corrosion Defects. Int. J. Press. Vessel. Pip. 2019, 177, 103982. [Google Scholar] [CrossRef]
- Teixeira, A.P.; Palencia, O.G.; Guedes Soares, C. Reliability Analysis of Pipelines with Local Corrosion Defects under External Pressure. ASME J. Offshore Mech. Arct. Eng. 2018, 141, 051601. [Google Scholar] [CrossRef]
- Arjomandi, K.; Taheri, F. Elastic Buckling Capacity of Bonded and Unbonded Sandwich Pipes under External Hydrostatic Pressure. J. Mech. Mater. Struct. 2010, 5, 391–408. [Google Scholar] [CrossRef]
- Sato, M.; Patel, M.H. Exact and Simplified Estimations for Elastic Buckling Pressures of Structural Pipe-in-Pipe Cross Sections under External Hydrostatic Pressure. J. Mar. Sci. Technol. 2007, 12, 251–262. [Google Scholar] [CrossRef]
- Hashemian, R.; Mohareb, M. Buckling Finite Element Formulation for Sandwich Pipes under External Pressure. Int. J. Press. Vessel. Pip. 2016, 147, 41–54. [Google Scholar] [CrossRef]
- Hashemian, R.; Mohareb, M. Finite Difference Model for the Buckling Analysis of Sandwich Pipes under External Pressure. Ocean Eng. 2016, 122, 172–185. [Google Scholar] [CrossRef]
- Bhardwaj, U.; Teixeira, A.; Guedes Soares, C. Uncertainty in Collapse Strength Prediction of Sandwich Pipelines. J. Offshore Mech. Arct. Eng. 2022, 144, 041702. [Google Scholar] [CrossRef]
- Pasqualino, I.P.; Pinheiro, B.C.; Estefen, S.F. Comparative Structural Analyses between Sandwich and Steel Pipelines for Ultra-Deep Water. In Proceedings of the ASME 2002 21st International Conference on Offshore Mechanics and Arctic Engineering, Oslo, Norway, 23–28 June 2002. ASME Paper No. OMAE2002-28455. [Google Scholar]
- Castello, X.; Estefen, S.F.; Leon, H.R.; Chad, L.C.; Souza, J. Design Aspects and Benefits of Sandwich Pipes for Ultra Deepwaters. In Proceedings of the ASME 2009 28th International Conference on Ocean, Offshore and Arctic Engineering, Honolulu, HI, USA, 31 May–5 June 2009; Volume 3, pp. 453–459. [Google Scholar] [CrossRef]
- Castello, X.; Estefen, S.F. Limit Strength and Reeling Effects of Sandwich Pipes with Bonded Layers. Int. J. Mech. Sci. 2007, 49, 577–588. [Google Scholar] [CrossRef]
- Castello, X.; Estefen, S.F. Sandwich Pipes for Ultra Deepwater Applications. In Proceedings of the Offshore Technology Conference, Houston, TX, USA, 5–8 May 2008. [Google Scholar] [CrossRef]
- Arjomandi, K.; Taheri, F. A New Look at the External Pressure Capacity of Sandwich Pipes. Mar. Struct. 2011, 24, 23–42. [Google Scholar] [CrossRef]
- Arjomandi, K.; Taheri, F. Stability and Post-Buckling Response of Sandwich Pipes under Hydrostatic External Pressure. Int. J. Press. Vessel. Pip. 2011, 88, 138–148. [Google Scholar] [CrossRef]
- Arjomandi, K.; Taheri, F. The Influence of Intra-Layer Adhesion Configuration on the Pressure Capacity and Optimized Configuration of Sandwich Pipes. Ocean Eng. 2011, 38, 1869–1882. [Google Scholar] [CrossRef]
- He, T.; Duan, M.; Wang, J.; Lv, S.; An, C. On the External Pressure Capacity of Deepwater Sandwich Pipes with Inter-Layer Adhesion Conditions. Appl. Ocean Res. 2015, 52, 115–124. [Google Scholar] [CrossRef]
- SMLH Eureqa Version 0.98 Beta. Available online: https://www.nutonian.com (accessed on 25 May 2022).
- Melchers, R.E.; Beck, A.T. Structural Reliability—Analysis and Prediction; Melchers, R.E., Beck, A.T., Eds.; John Wiley & Sons Ltd.: Chichester, UK, 2018; ISBN 9781119266105. [Google Scholar]
- Ditlevsen, O.; Madsen, H.O. Structural Reliability Methods; John Wiley & Sons Ltd.: Chichester, UK, 2005. [Google Scholar]
- Ang, A.H.S.; Tang, W.H. Probability Concepts in Engineering: Emphasis on Applications to Civil and Environmental Engineering; John Wiley & Sons Inc.: Hoboken, NJ, USA, 2006. [Google Scholar]
- Gong, S.; Wang, X.; Zhang, T.; Liu, C. Buckle Propagation of Sandwich Pipes under External Pressure. Eng. Struct. 2018, 175, 339–354. [Google Scholar] [CrossRef]
- Blake, J.I.R.; Shenoi, R.A.; Das, P.K.; Yang, N. The Application of Reliability Methods in the Design of Stiffened FRP Composite Panels for Marine Vessels. Ships Offshore Struct. 2009, 4, 287–297. [Google Scholar] [CrossRef]
Figure 1.
Illustration of SP specimen and geometry [11].
Figure 1.
Illustration of SP specimen and geometry [11].
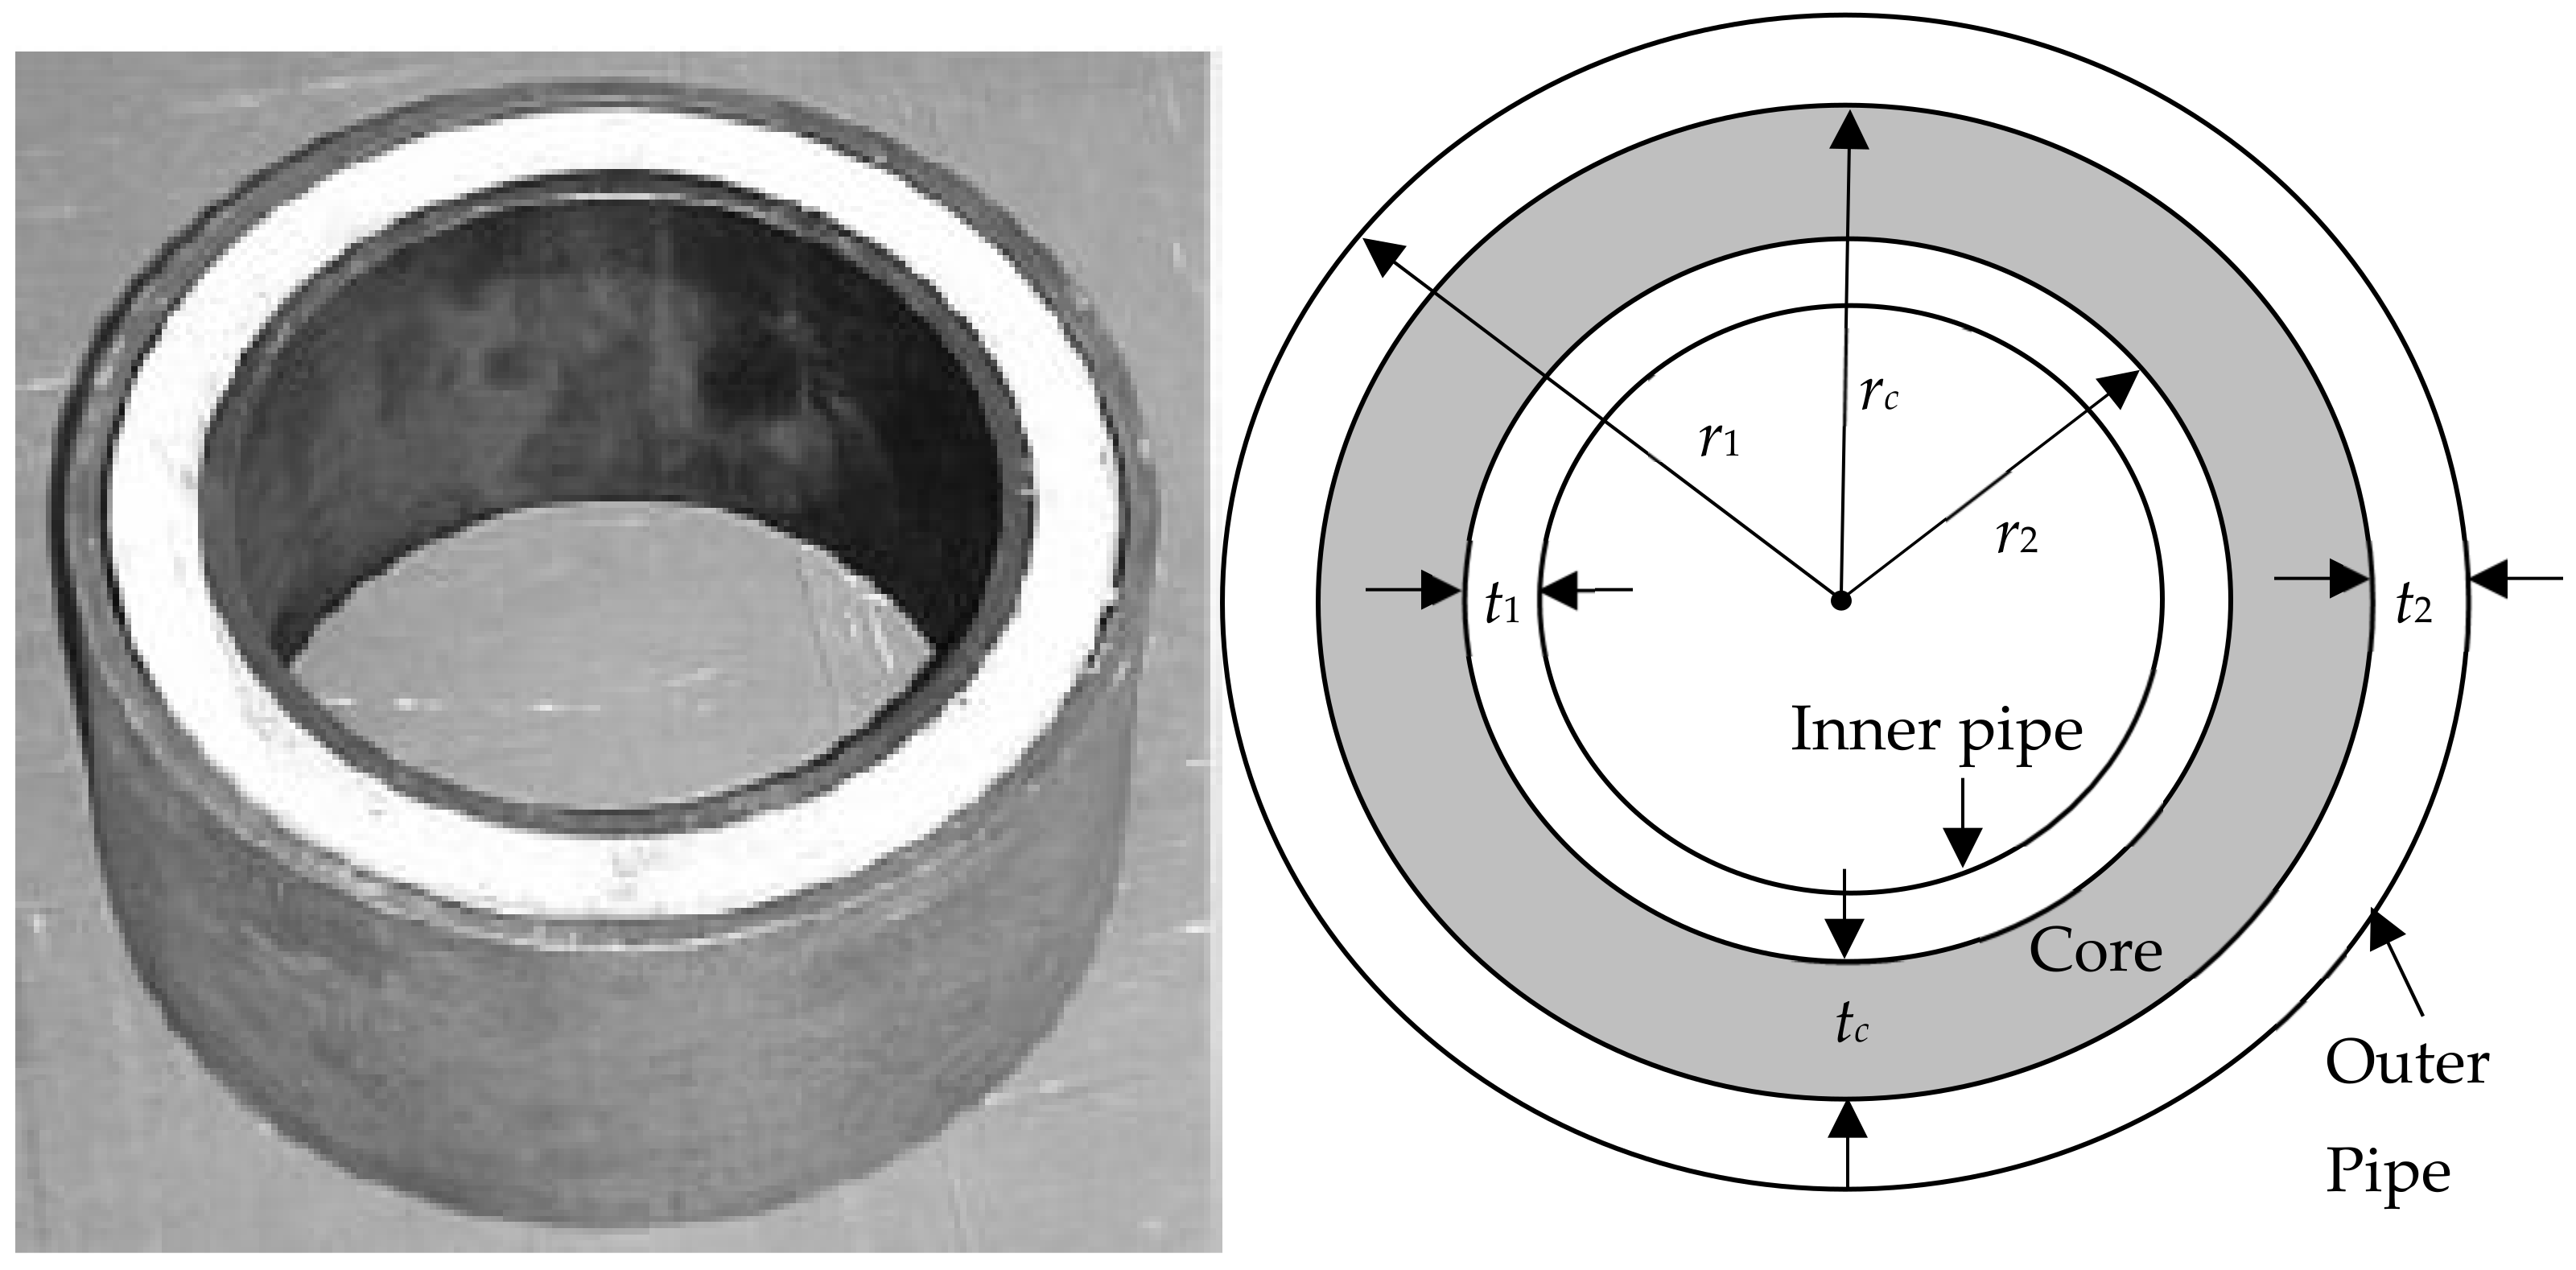
Figure 2.
Outline of the main steps and sub steps in the proposed methodology.
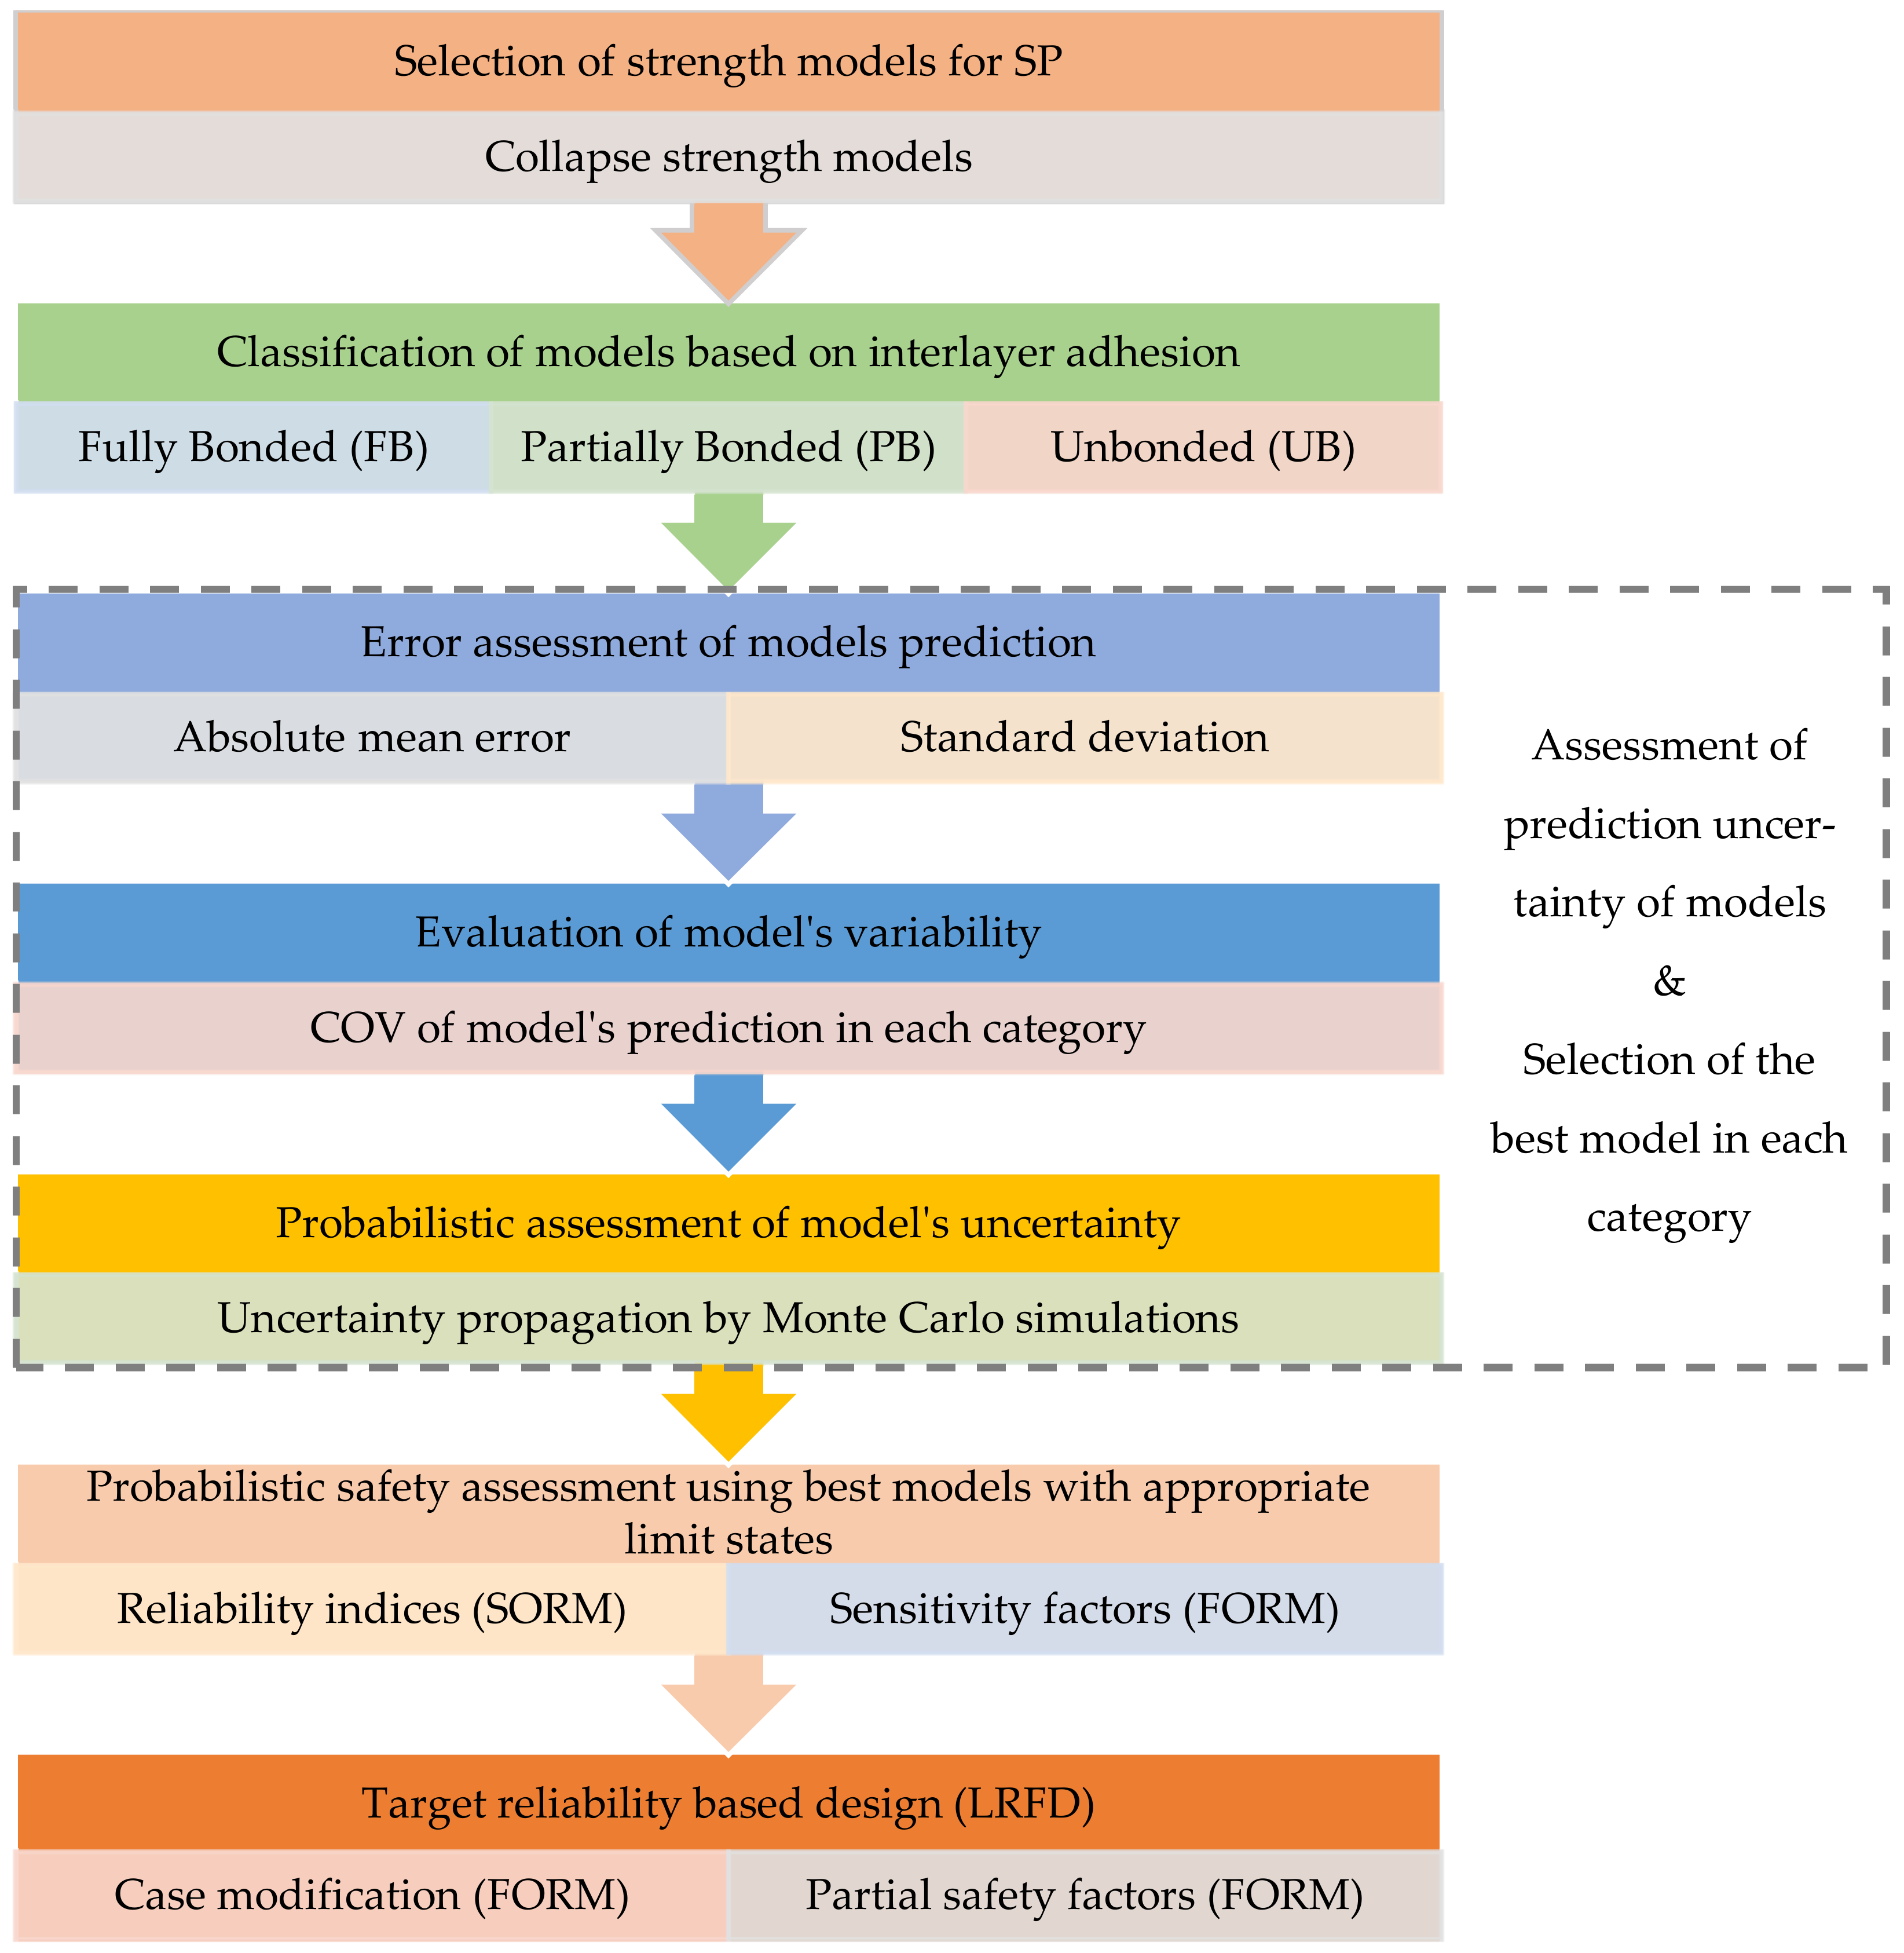
Figure 3.
Mean error and their variation for collapse strength models against test data.
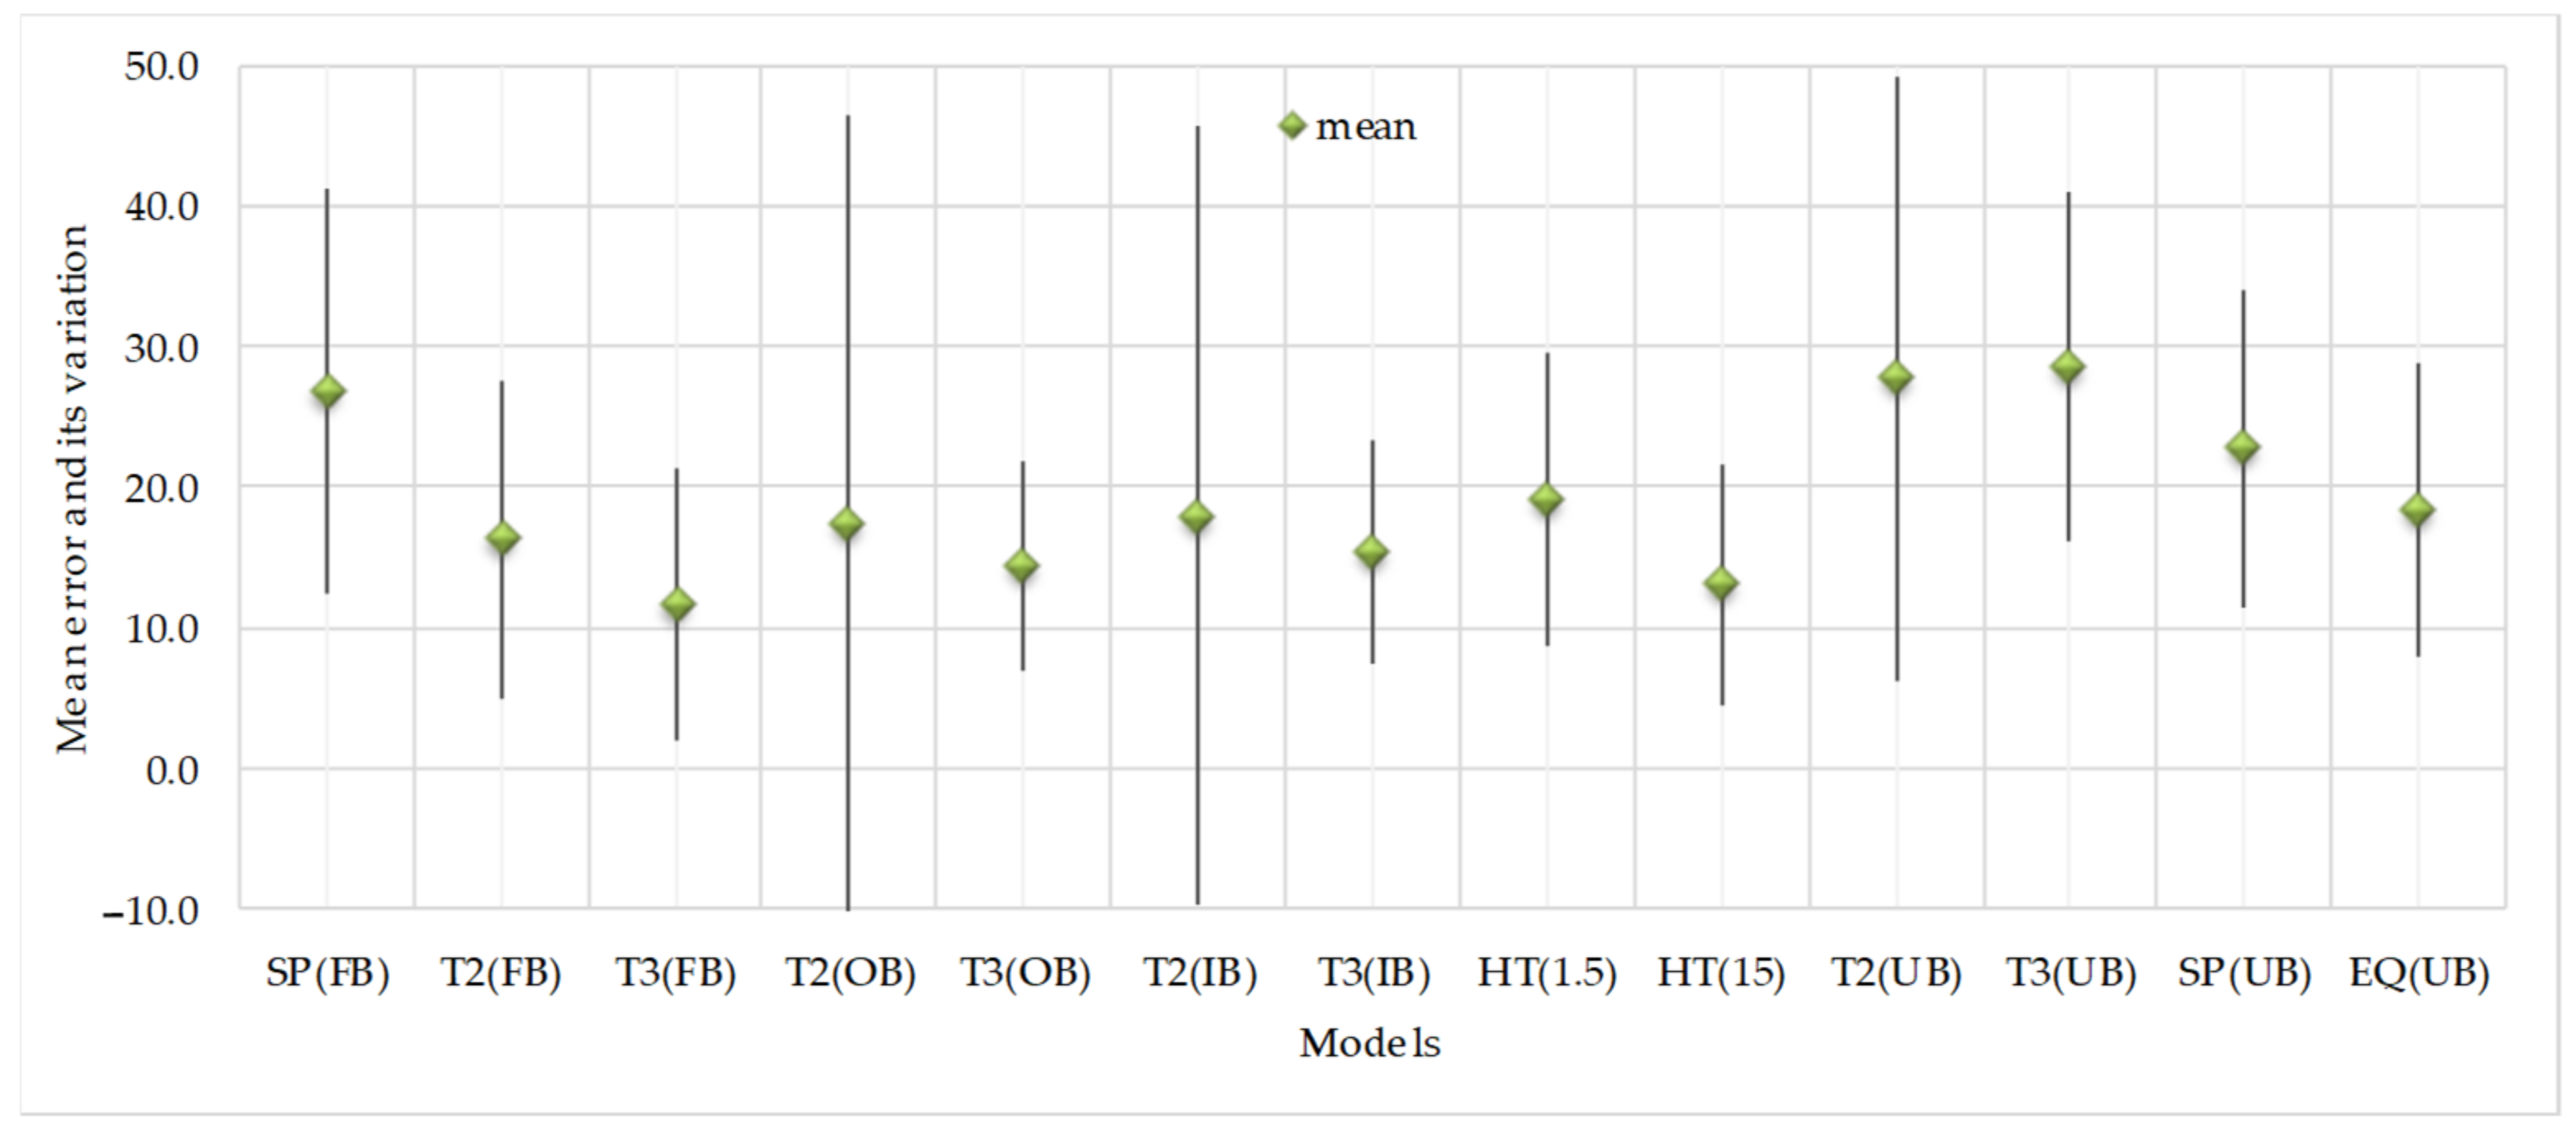
Figure 4.
Variation of Pc with t1/r1 for (a) Fully bonded, (b) Partially bonded, and (c) Unbonded core.
Figure 4.
Variation of Pc with t1/r1 for (a) Fully bonded, (b) Partially bonded, and (c) Unbonded core.

Figure 5.
Variation of Pc with tc/rc (a) Fully bonded, (b) Partially bonded, and (c) Unbonded core.
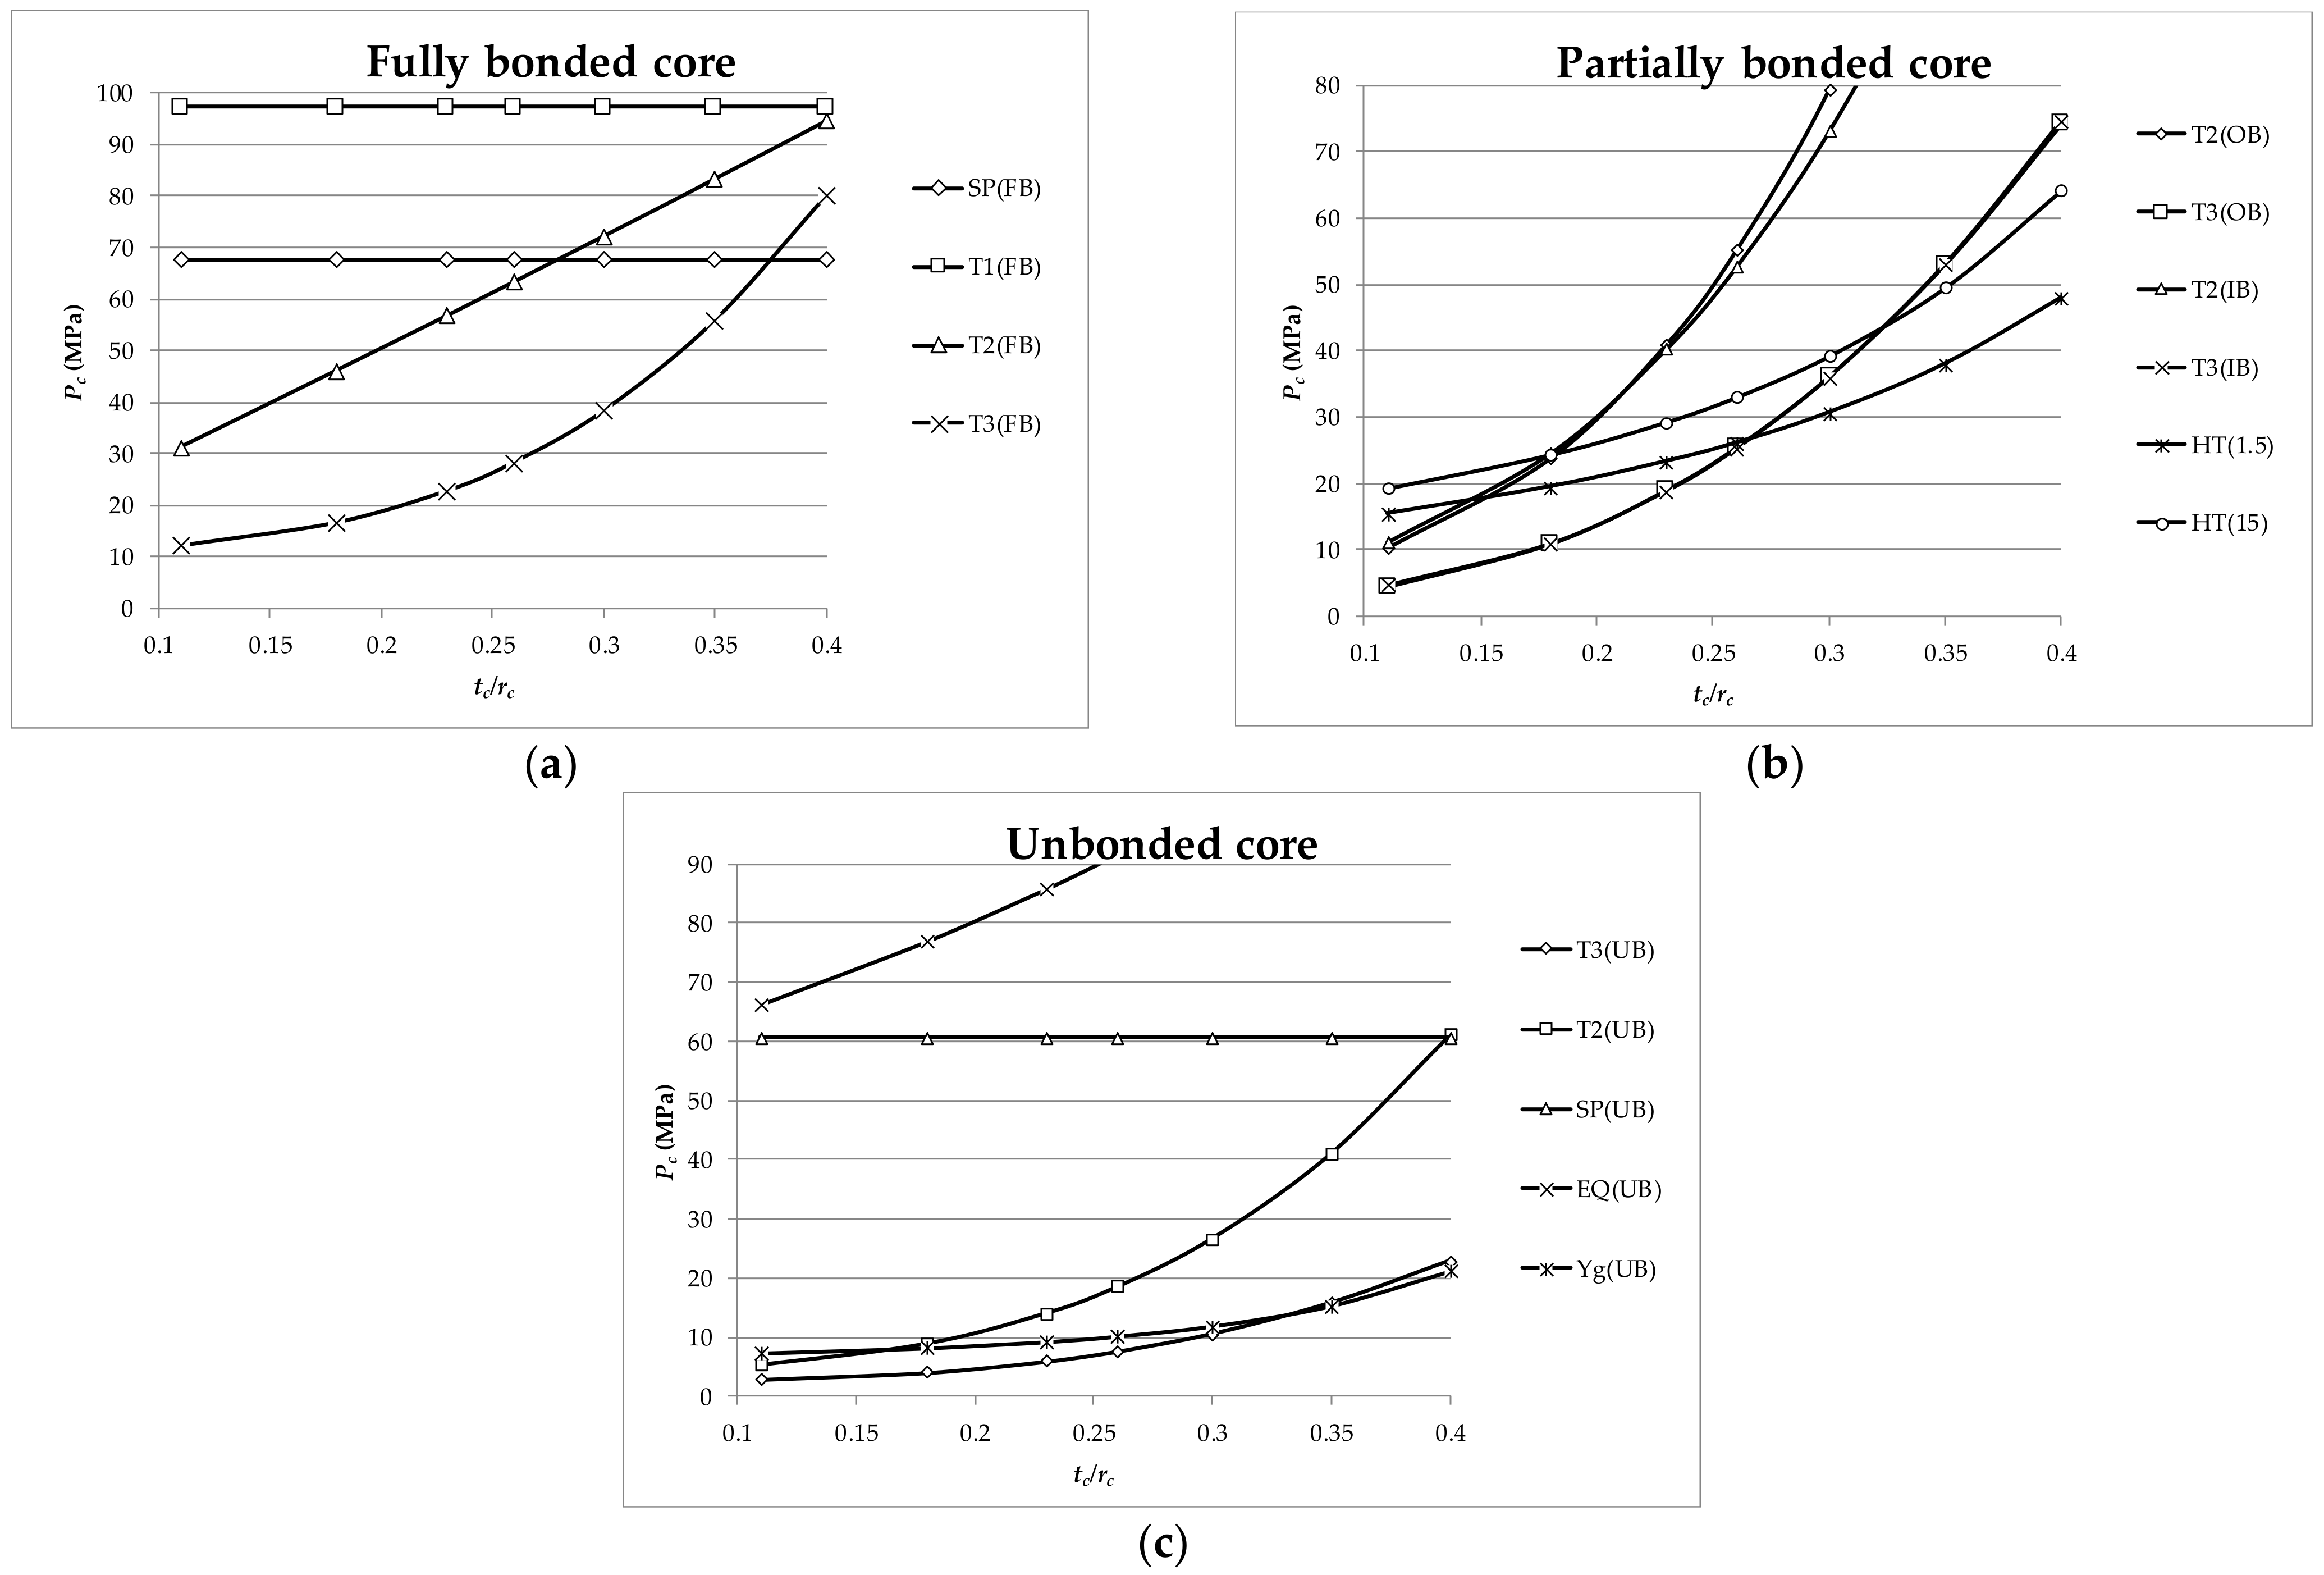
Figure 6.
Variation of Pc with t2/r2 (a) Fully bonded, (b) Partially bonded, and (c) Unbonded core.
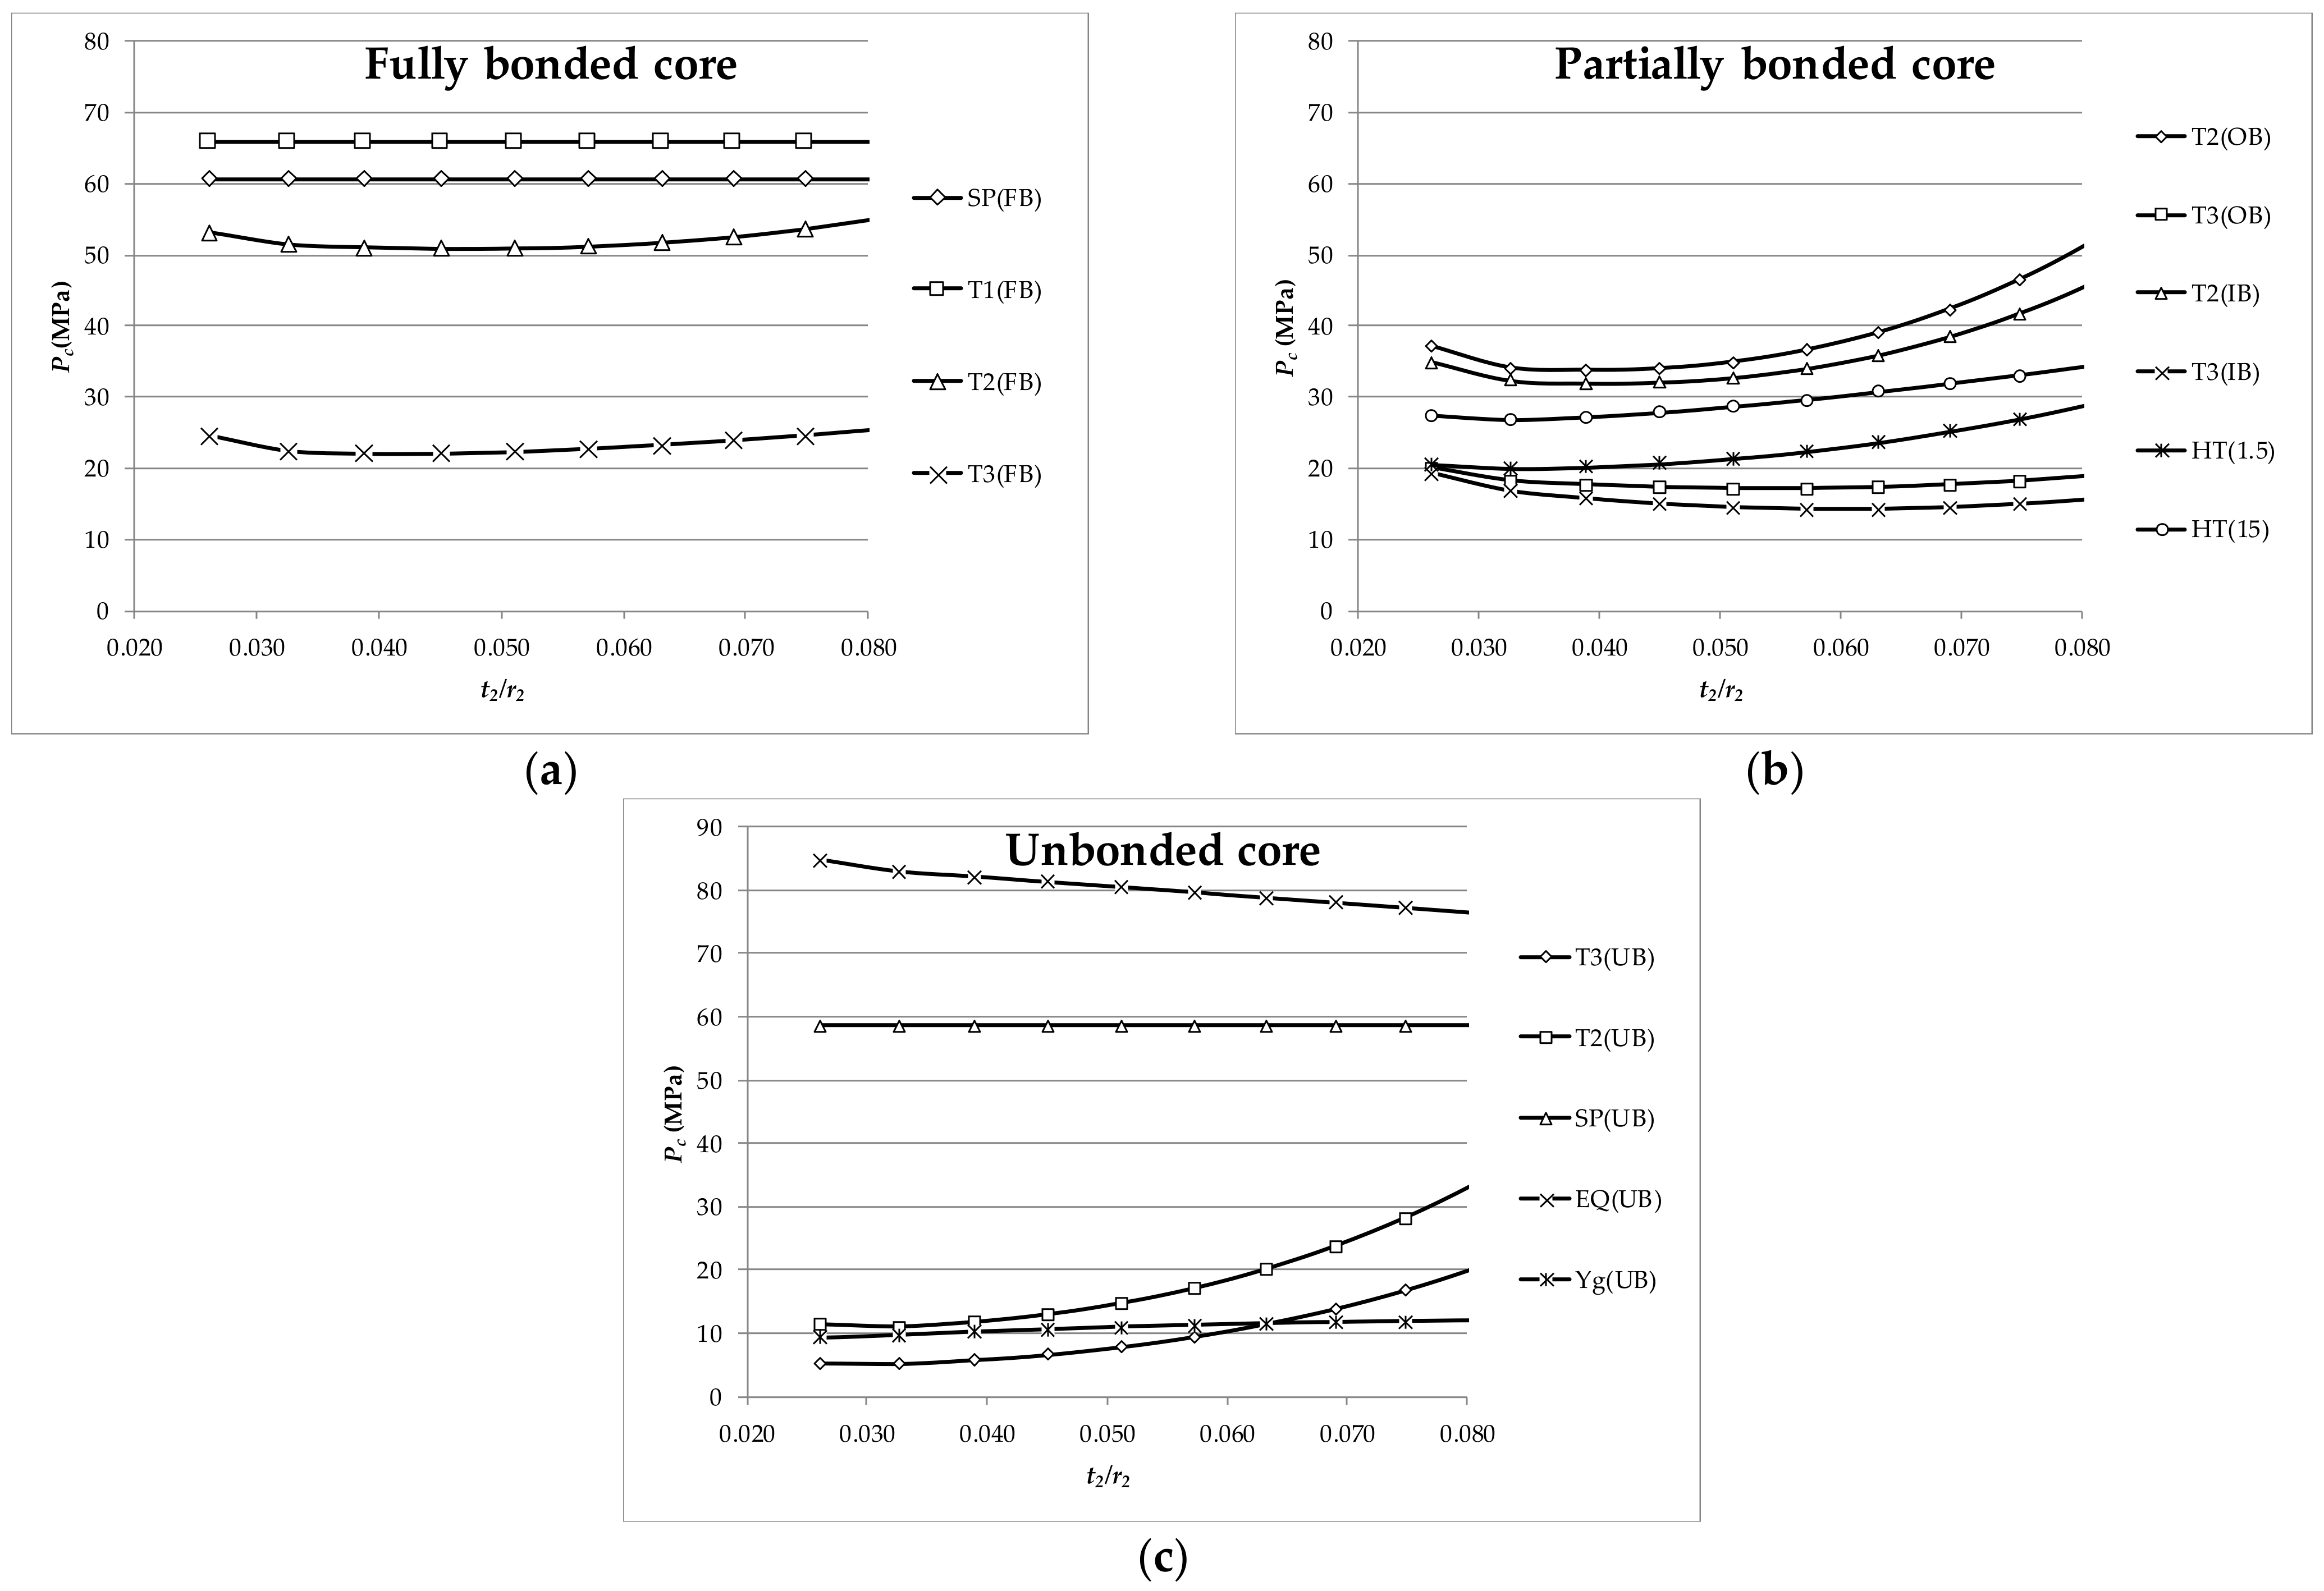
Figure 7.
Variation of Pc with Ec/Ep (a) Fully bonded, (b) Partially bonded, and (c) Unbonded core.
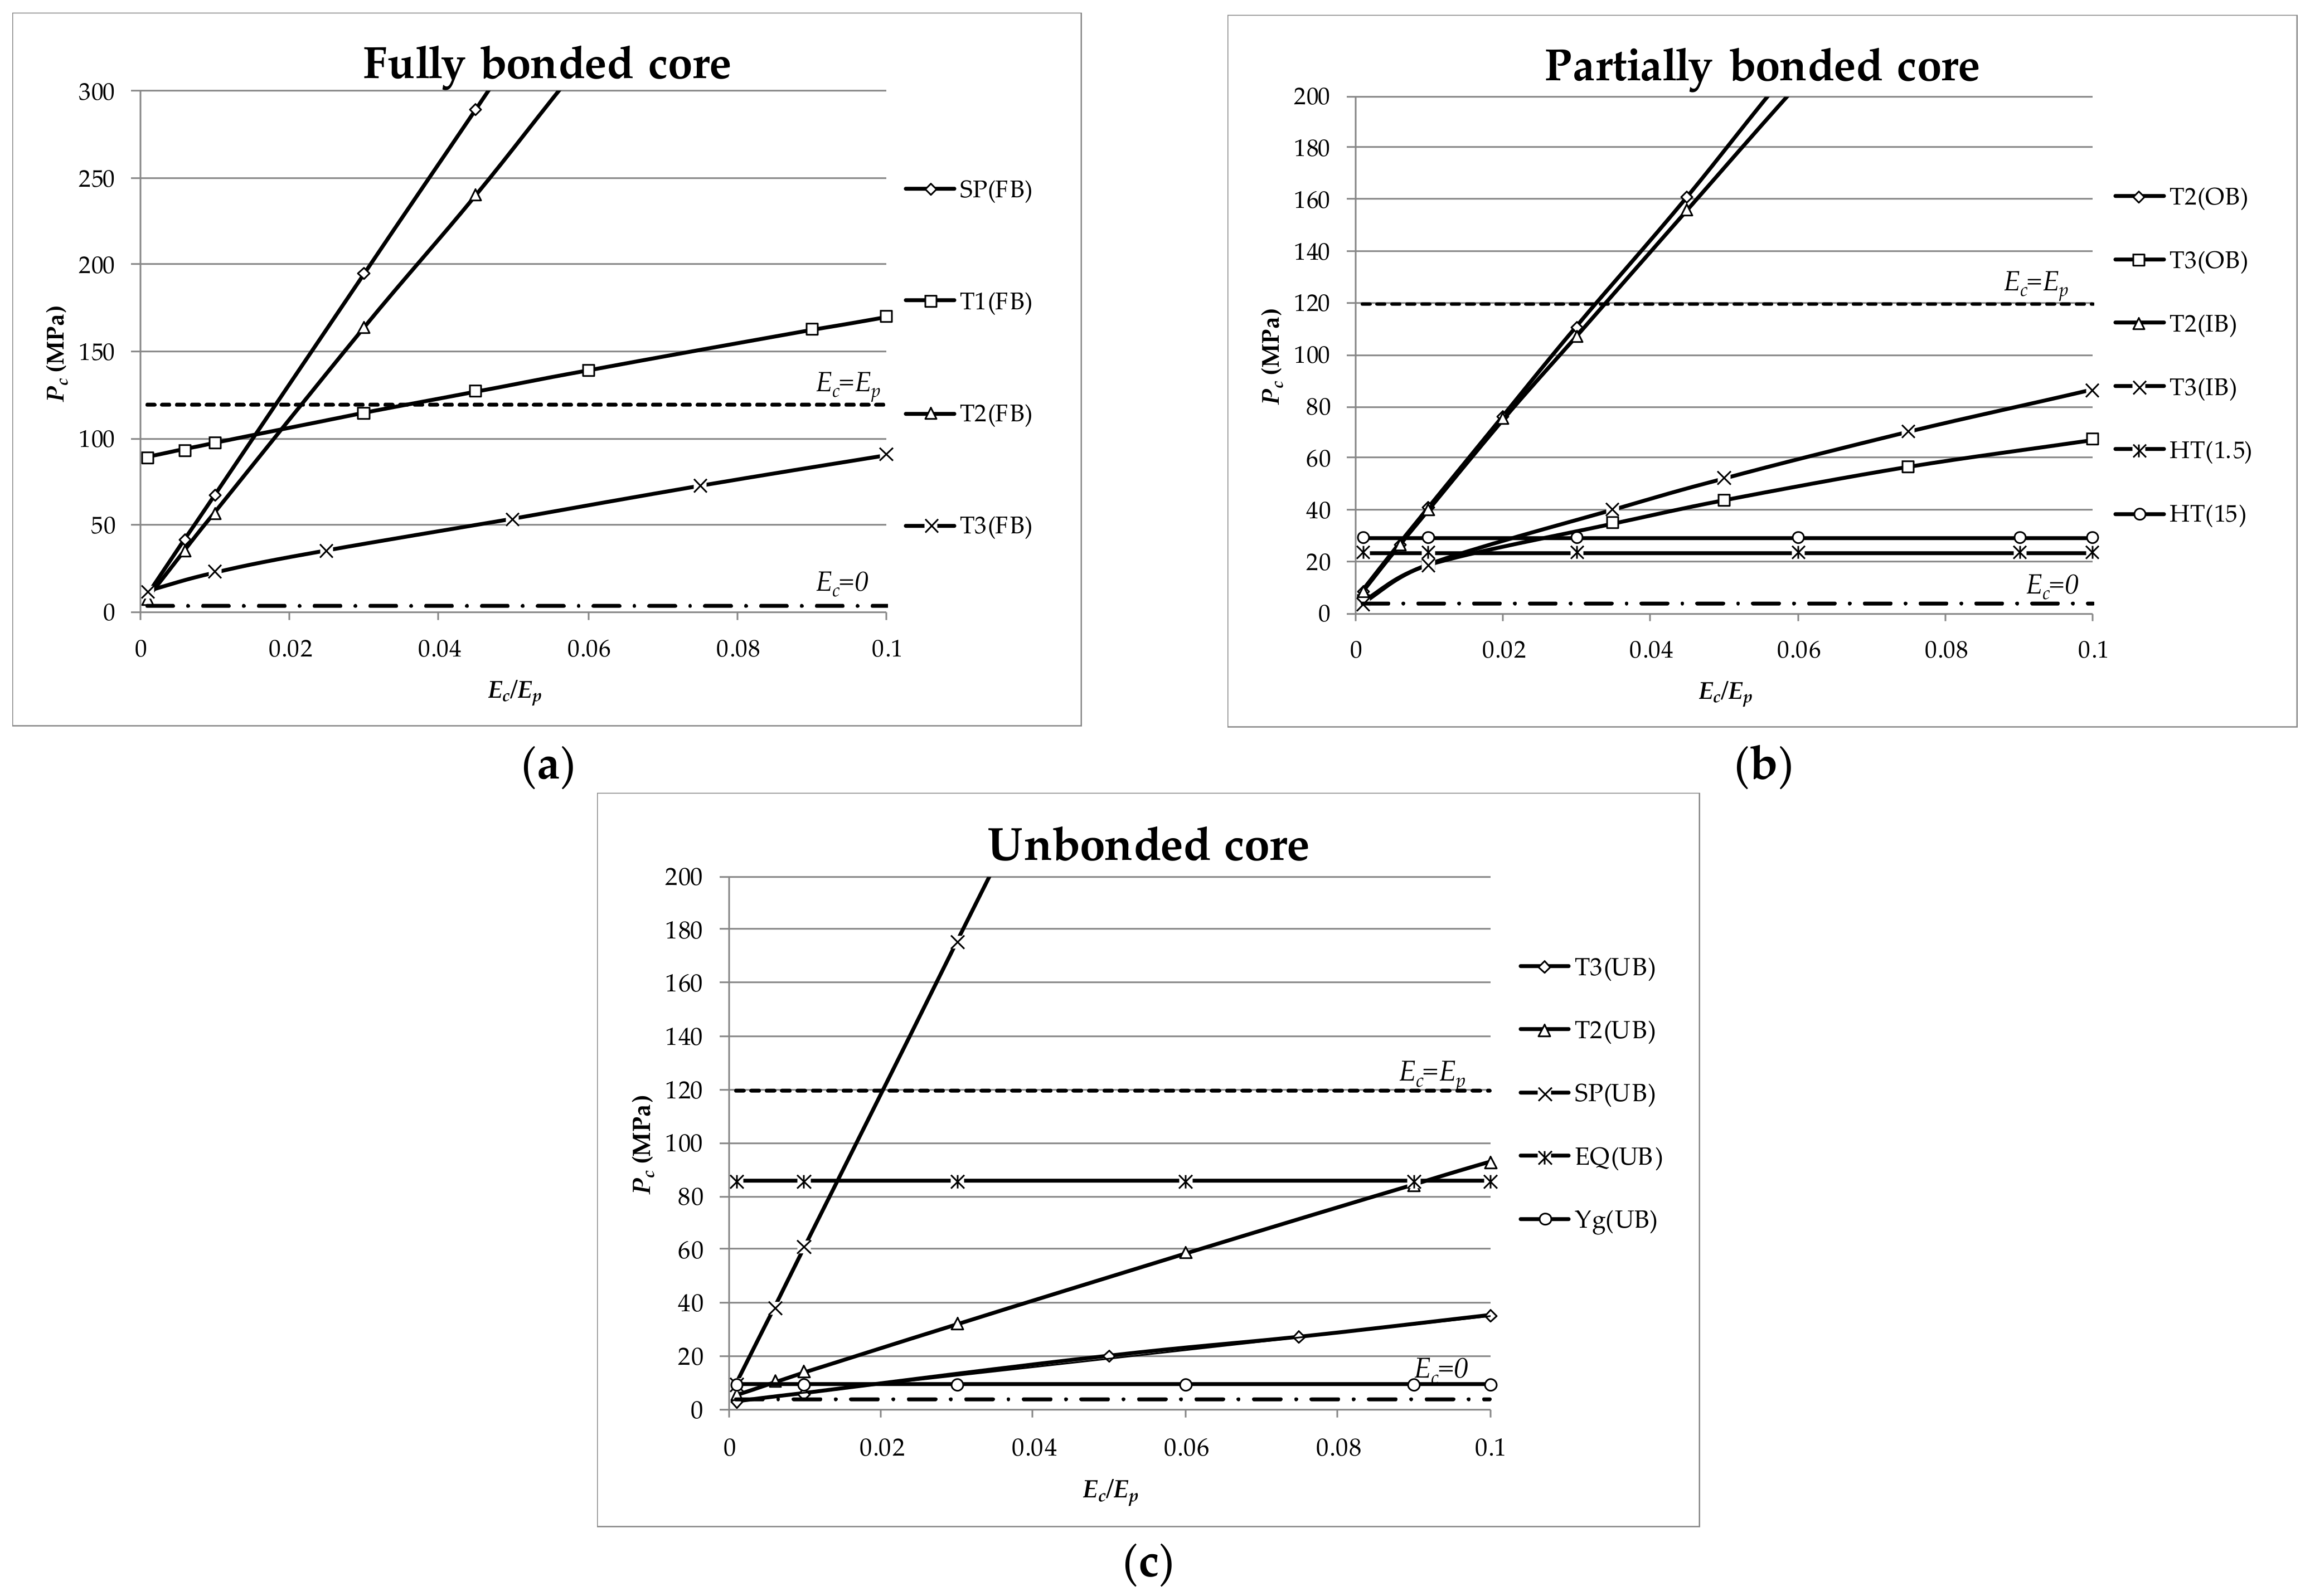
Figure 8.
COV and Pc/Peq for SP collapse strength models.
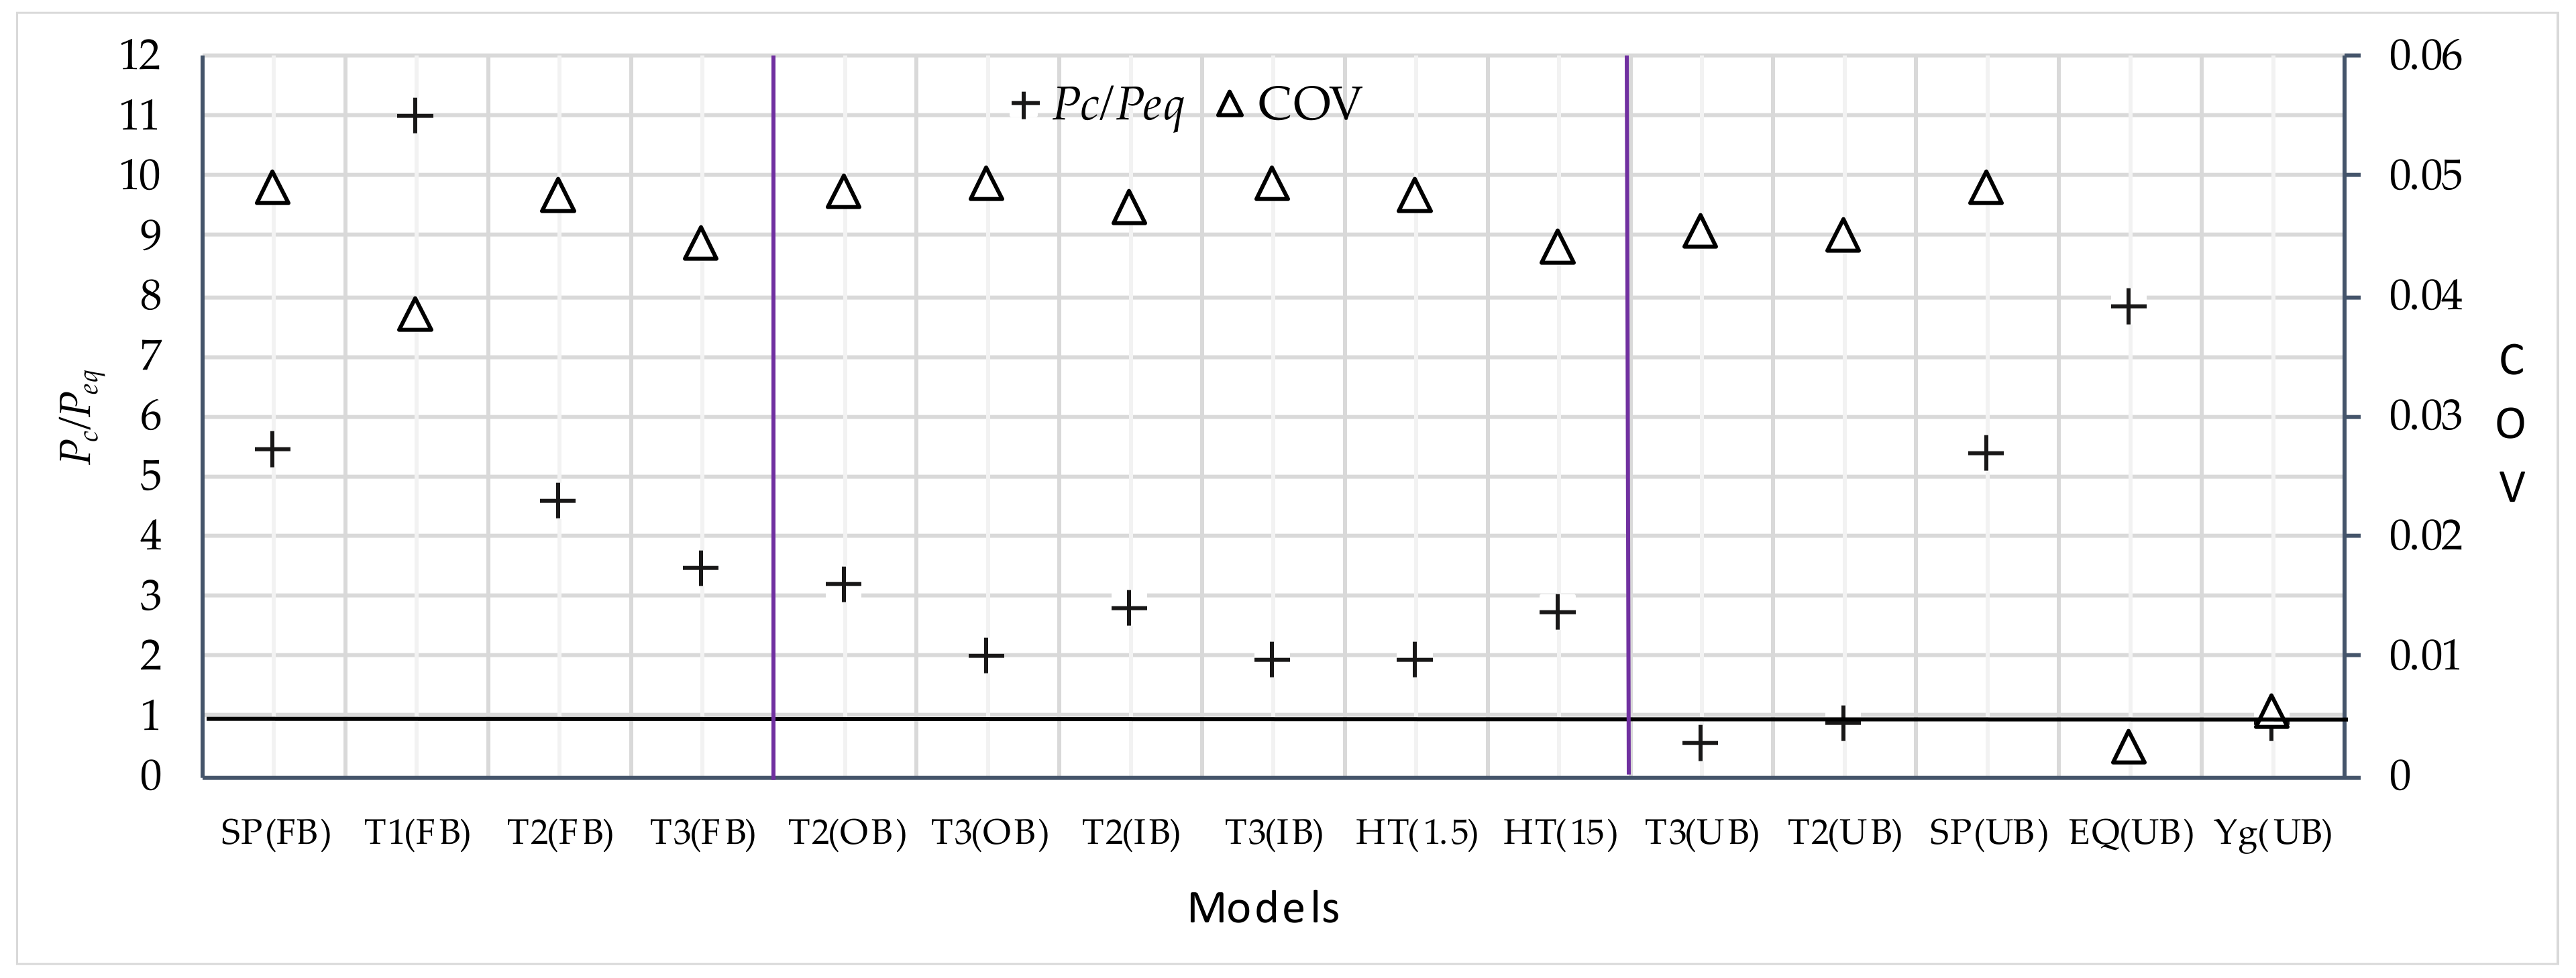
Figure 9.
Prediction error (PE in %) of the normalised mean collapse pressure calculated from 95% confidence interval of the mean.
Figure 9.
Prediction error (PE in %) of the normalised mean collapse pressure calculated from 95% confidence interval of the mean.
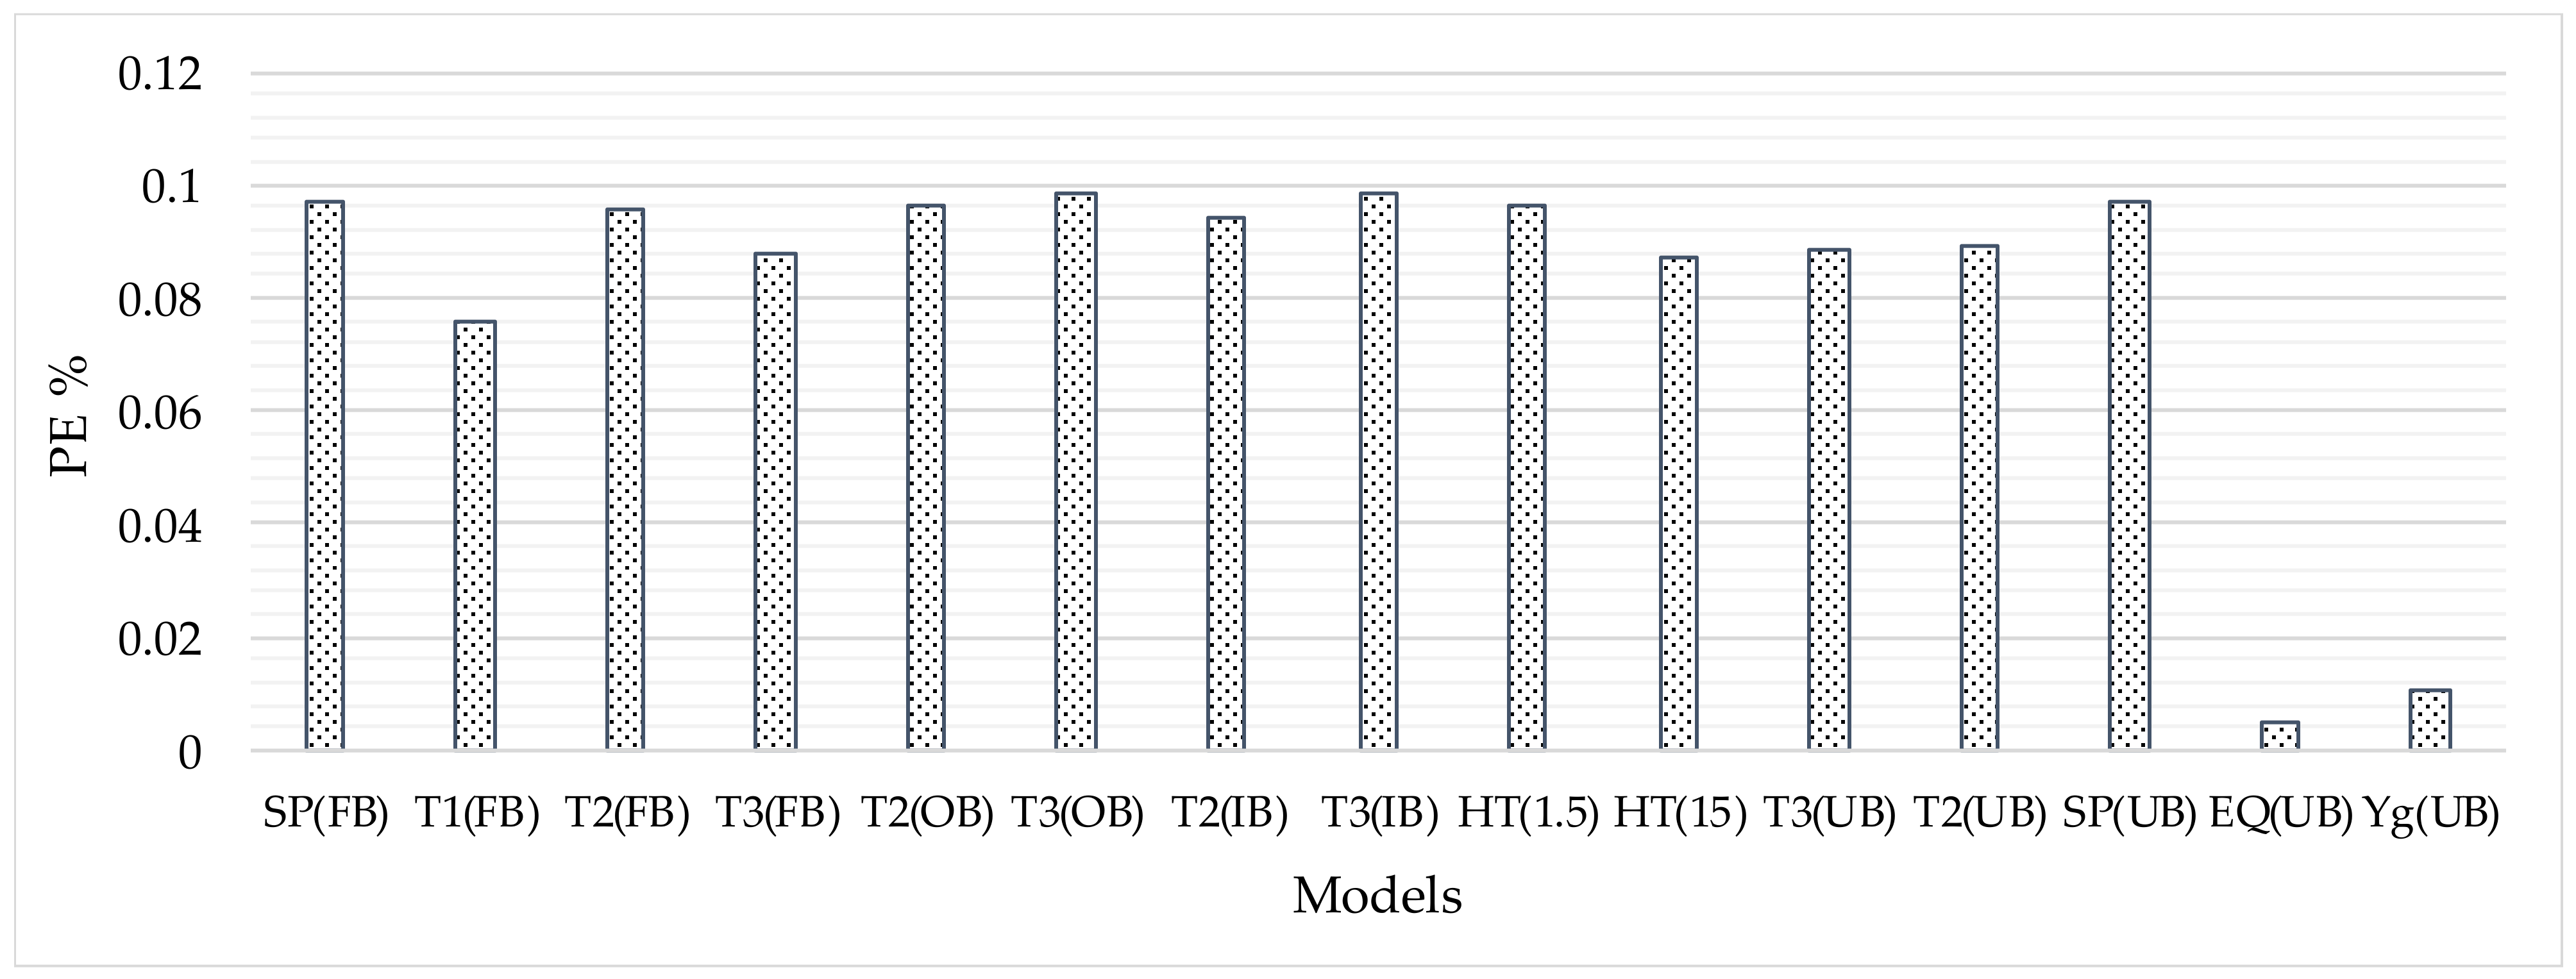
Figure 10.
β as a function of outer pipe thickness (t1/r1).
Figure 11.
β as a function of core thickness ratio (tc/rc).
Figure 12.
β as a function of external pressure.
Table 1.
Range of parameters used in deterministic assessment.
| σ1 = σ2 | vc | vp | Ec/Ep | t1/r1 | t2/r2 | r2/r1 | tc/rc |
|---|---|---|---|---|---|---|---|
| 205 MPa | 0.4 | 0.3 | 0.001–0.1 | 0.02–0.08 | 0.026–0.097 | 0.6–0.8 | 0.1–0.4 |
Table 2.
Probabilistic models for basic random variables of SP case study.
| σ1= σ2 (MPa) | vc | vp | Ec (GPa) | Ep (GPa) | D1 (mm) | t1 (mm) | D2 (mm) | t2 (mm) | ||
|---|---|---|---|---|---|---|---|---|---|---|
| Mean | 413 | {19.836} | 0.4 | 0.3 | 2 | 200 | 202.8 | 2 | 152.4 | 1.8 |
| COV | 8 | {0.0799} | 0.1 | 0.1 | 5 | 5 | 0.1 | 1 | 0.1 | 1 |
| Distribution | LN | N | N | N | N | N | N | N | N | |
| Reference | [15] | Assumed | Assumed | [34] | [34] | [15] | [15] | [15] | [15] | |
N—Normal, LN—Log-normal, {} lognormal parameters.
Table 3.
Probabilistic model for external pressure.
| Random Variable | Distribution | Mean | Standard Deviation | COV(%) | Characteristic Value(Xc), Pr (x < Xc) |
|---|---|---|---|---|---|
| Pext (MPa) | Gumbel | 8.19 {8.09} | 0.246 {0.192} | 3 | 8.649 (95% percentile) |
Gumbel parameters are in {}.
Table 4.
Reliability indices for SPs with different core adhesion models.
| Fully Bonded Core | Partially Bonded Core | Unbonded Core | |
|---|---|---|---|
| T3(FB) | T3(OB) | T3(IB) | T3(UB) |
| 4.65 | 4.31 | 4.28 | 4.50 |
Table 5.
Sensitivity factors (αi) for the basic variables for the SP models.
| Variables | Fully Bonded Core | Partially Bonded Core | Unbonded Core | |
|---|---|---|---|---|
| T3(FB) | T3(OB) | T3(IB) | T3(UB) | |
| σ1 | 0.079 | 0.012 | 0.012 | 0.003 |
| σ2 | 0.066 | 0.011 | 0.012 | 0.266 |
| Ep | 0.414 | 0.505 | 0.560 | 0.318 |
| D1 | 0.092 | 0.151 | 0.105 | 0.097 |
| t1 | −0.076 | −0.187 | −0.125 | -0.105 |
| D2 | −0.079 | −0.117 | −0.082 | -0.079 |
| t2 | −0.055 | −0.034 | −0.101 | -0.078 |
| Pext | −0.891 | −0.819 | −0.780 | -0.892 |
Table 6.
Installation depth of various SPs in regard to target reliability.
| Fully Bonded Core | Partially Bonded Core | Unbonded Core | ||
|---|---|---|---|---|
| T3(FB) | T3(OB) | T3(IB) | T3(UB) | |
| Water depth (m) | 2912.3 | 1674.2 | 1601.7 | 489.6 |
Table 7.
Partial safety factors for SP for different inter-layer adhesion condition.
| Variables | Fully Bonded Core | Partially Bonded Core | Unbonded Core | |
|---|---|---|---|---|
| T3(FB) | T3(OB) | T3(IB) | T3(UB) | |
| γR | 1.148 | 1.179 | 1.175 | 1.139 |
| γL | 1.109 | 1.11 | 1.11 | 1.119 |
| k | 1.273 | 1.308 | 1.304 | 1.275 |
Publisher’s Note: MDPI stays neutral with regard to jurisdictional claims in published maps and institutional affiliations. |
© 2022 by the authors. Licensee MDPI, Basel, Switzerland. This article is an open access article distributed under the terms and conditions of the Creative Commons Attribution (CC BY) license (https://creativecommons.org/licenses/by/4.0/).
Share and Cite
MDPI and ACS Style
Bhardwaj, U.; Teixeira, A.P.; Guedes Soares, C. Probabilistic Collapse Design and Safety Assessment of Sandwich Pipelines. J. Mar. Sci. Eng. 2022, 10, 1435. https://doi.org/10.3390/jmse10101435
AMA Style
Bhardwaj U, Teixeira AP, Guedes Soares C. Probabilistic Collapse Design and Safety Assessment of Sandwich Pipelines. Journal of Marine Science and Engineering. 2022; 10(10):1435. https://doi.org/10.3390/jmse10101435
Chicago/Turabian StyleBhardwaj, Utkarsh, Angelo Palos Teixeira, and C. Guedes Soares. 2022. "Probabilistic Collapse Design and Safety Assessment of Sandwich Pipelines" Journal of Marine Science and Engineering 10, no. 10: 1435. https://doi.org/10.3390/jmse10101435
Note that from the first issue of 2016, this journal uses article numbers instead of page numbers. See further details here.