Linking Sustainability with Geographical Proximity in Food Supply Chains. An Indicator Selection Framework


Department of Agriculture, Food and Environment, University of Pisa, 80 via del Borghetto, 56124 Pisa, Italy
*
Author to whom correspondence should be addressed.
Agriculture 2018, 8(9), 130; https://doi.org/10.3390/agriculture8090130
Submission received: 15 July 2018
/
Revised: 15 August 2018
/
Accepted: 22 August 2018
/
Published: 24 August 2018
Abstract
:Despite policymakers’ promotion of food relocalization strategies for burden mitigation, the assumption that local food chains are more sustainable than the global ones might not hold. This literature review tries to highlight a possible framework for exploratory analyses that aim at associating sustainability with the geographical proximity of food supply chains. The purpose of the article is identifying a set of communicative and information-dense indicators for use by evaluators. Bread is the selected test food, given its importance in human nutrition and the relevance of some of its life cycle phases for land use (cereal farming) and trade (cereal commercialization). Article searching (including keyword selection, explicit inclusion/exclusion criteria, and computer-assisted screening using the NVivo® software) was carried out over the Scopus, Web of Science, and Google Scholar databases, and returned 29 documents (refereed and non-refereed publications). The retrieved literature shows varied research focus, methods, and depth of analyses. The review highlighted 39 environmental, 36 economic, and 27 social indicators, along the food chain. Indicators’ reporting chains are heterogeneous; even the comparison of standard procedures, e.g., Life Cycle Assessment, is not straightforward. Holistic approaches are missing.
1. Introduction
Food supply chains are the sequences of the activities (steps) associated with food production, processing, distribution, consumption, and end-of-life disposal [1,2] (in this article, the terms “food supply chain” and “food chain” are used interchangeably). The geographical proximity of chain steps is a criterion for classifying food supply chains based on the distance among the firms that carry out those processes [3]; food supply chains can be classified as global, national, or local, when the involved steps are respectively located internationally, nationally, or subnationally [1,2]. Since the early 2000s, the local–global dichotomy has informed the scientific debate around the sustainability of local and global food chains [4,5,6]. Food (re)localization was born as a policy strategy to improve food chain sustainability via the mitigation of some of the drawbacks of global food chains [7]. The governments of affluent countries (e.g., the United States, European Union) supported food relocalization as a sustainability-oriented strategy [3,7,8]; however, the assumption of the superior sustainability of local food chains may not hold [9]. The local vs global dispute is still open [10,11]. To the best of our knowledge, comprehensive evaluation frameworks are missing for use in comparative sustainability assessments of local and global food chains [10]. To contribute to that debate, this article anchors to a worldwide staple food, i.e., bread, for four main reasons: (1) there is spatial variability in consumption and production patterns; (2) wheat (the main raw material) is a commodity subject to market price volatility; (3) unpredictable international events linked bread price with political change [12,13,14]; (4) information about wheat cropping location can be lost throughout the supply chain [15]. Via a literature review, this article aims at providing evaluators with a set of communicative and information-dense sustainability indicators, that allow comparing food chains that differ for their geographical proximity. After this introduction, the article starts by reviewing the research approaches to sustainability assessment in agri-food chains (Section 2). Then, the research design is presented in Section 3, including keyword selection, explicit inclusion/exclusion criteria, and computer-assisted screening using the NVivo® software (QRS International, Melbourne, Australia). The results of the literature review are presented and discussed, respectively, in Section 4 and Section 5.
2. Literature Review
The evaluation of sustainability and related policies in the agri-food sector may involve monetary or non-monetary analyses [16].
In monetary analyses, the costs and benefits of the system under study are given monetary values, and their performance is evaluated using a benchmarking procedure, with the benchmark being provided by some wealth indexes of the measure of the private/public stream of social costs and benefits of alternative systems [17]. Major monetary evaluations are generally based on cost–benefit and cost–effectiveness analyses. The former involves the comparative assessment of outcome variables, such as, e.g., social welfare, before and after policy implementation. The latter evaluates whether public money was appropriately invested by measuring a series of indexes, such as, e.g., social wellbeing [17]. The intrinsic value of agricultural produce increases along the supply chain; then, monetary assessments may consider the extent to which the income of food chain players is subject to change, as well as how the distribution of value among those players is likely to change [18]. Another strand of literature addresses consumers’ willingness to pay for experience and credence attributes of local and global food. According to those authors, consumers’ willingness to pay may be higher for local than for non-local food [19,20]. This can be due to the general increase in social worries about food origin and the higher popularity of local food chains, which boosted origin labeling [21]. Authors with higher interest in the environmental impact of food supply chains are more concerned with the total economic value of natural resources involved in the chain itself, and estimate the non-use value of those resources via the stated or revealed preferences of consumers [22]. The benefit transfer is an additional research framework, relying on place and time-specific information to infer the economic value of goods and services in different places and times [23] (see also a special issue of Ecological Economics [24]). Disentangling the economic, environmental, and social impacts harden monetary evaluations of food chain sustainability; extending the scope of the assessment to consider the geographical proximity of food chain steps is even more complex.
Non-monetary assessments rely on sustainability indicators, i.e., measurable approximations of phenomena that occur at the economic, environmental, and social level, such as, e.g., social utility [25] or stakeholders’ utility [26]. Product-based indicators (e.g., calculated using the Life Cycle Assessment (LCA) tool) supplement sustainability assessments with the impact associated with the geographical extension of the food supply chain which, in turn, is approximated by the “farm-to-fork” supply chain [27]. The set of indicators tend to vary across methodologies [28,29,30]. Within this framework, multicriteria analysis is a widespread methodology that deals with the economic, environmental, and social impacts that are perceived, as such, by stakeholders in the food chain [31]; the collected stakeholder preferences are synthesized through modeling algorithms [25]. When it comes to delivering general judgments around sustainability, cost–benefit analysis is superior to multicriteria analysis, considering population rather than stakeholder preferences [32]. According to some authors, cost–benefit analysis allows a more impartial consideration of social preferences than multicriteria analysis [22]. Both cost–benefit and multicriteria analyses struggle with the quantification of intangible benefits, such as, e.g., animal welfare [33], as well as with the disclosure of stakeholders’ willingness to pay, and the distribution of costs and benefits along the chain. Indeed, multiple processing steps and reduced collaboration among stakeholders harden all assessments based on stakeholder preferences [34]. Demand or supply side approaches to cut down on the environmental burden of agricultural production of food include the sustainable intensification of agriculture, the adoption of circular economy practices, e.g., for treating biowaste, and the promotion consumption-driven production shifts, towards the least-emitting foods or production methods/locations [35]. The most popular methodology for assessing the sustainability of ecological innovation in agricultural practices or technologies is LCA (ISO 14040:2006, ISO 14044:2006). The method provides evaluators with data about material flows and many environmental impacts at each stage of the food chain, while targeting interventions towards the most impacting stages, or hotspots [36]. Life cycle analyses are popular approaches to sustainability assessments, when evaluators need information about material flows and environmental impacts at each stage of the food supply chain [36]. LCA results consider many impact categories (midpoint or endpoint) covering the depletion of natural resources and the damage to the environment and human health. LCA-based evaluations of single issues (e.g., global warming potential) are known as footprints; especially, carbon and water footprints are popular formalized methods (ISO 14064 and ISO 14046, respectively). LCA can be combined with economic (Life Cycle Costing) and social (Social LCA) assessments to cover the three dimensions of sustainability [37], provided that they share the same system boundaries [38]. Ideally, the three methods should be based on the same data inventory [39]. This is generally not an issue for the combination of LCA and Life Cycle Costing, the latter accounting for all the costs associated with all processes throughout the products’ life cycle [38]. However, Social LCA relies more on activity variables, such as, e.g., working hours [39]. Social impacts are the consequences of behaviors, socioeconomic decisions, and human, social, and cultural capitals, occurring at the process level (production, processing, distribution, consumption, disposal), which generate positive or negative pressures on social wellbeing [39]. The assessment is carried out at the stakeholder level (workers, local community, society, consumers, supply chain actors) and encompasses the following impact categories: human rights, working conditions, health and safety, cultural heritage, governance, and socioeconomic repercussions [39]. The combination of the three-dimensional life cycle techniques in the Life Cycle Sustainability Assessment raised the interest of policymakers [40,41,42]. Policy applications of data generated via LCA involve, e.g., extended producer responsibility or certification and labeling schemes to reduce information asymmetry business-to-consumer [43].
Identifying cause–effect relationships between the geographical proximity of food chain steps and their overall sustainability is a hard and risky task, with the comparative sustainability of global, national, or local food chains being the subject of a wide debate. For example, food miles may not greatly contribute to the overall economic and environmental impact of marketed food, compared to food production or processing methods [44,45]. Moreover, the definition of the boundaries of the system under study is crucial. For example, the geographical proximity of food consumption depends of on product distribution channels (e.g., farmers’ markets, direct online sales, retailers) and on consumer preferred channels [46].
3. Materials and Methods
This article is part of a broad case study research, included in an EU-funded research project, with the overarching objective of improving the scientific knowledge about the impact of food supply chains differing by their geographical proximity, to promote evidence-based public policies and private strategies for increasing food chain sustainability, while informing consumer purchases [47]. Real-world food chains with different geographical proximity were selected across European countries, to cover the cereal, horticulture, fruit, dairy, and meat sectors [48]. The present paragraph is based on the Italian case study. A global and two local bread supply chains were analyzed. The global chain refers to soft bread, available at retailers’ stores; plastic seal packaging allows for around 30 days shelf life. One of the two local chains is a vertically integrated firm (farm to product sale); the other involves the production and distribution of bread under a geographical indication scheme; the final product is available at retailers’ stores. The two local chains refer to freshly baked bread, sold in unsealed paper bags, with a few days shelf life. Other differences among the three chains involved wheat origin and cultivar, farming method, public support by the EU Common Agricultural Policy schemes, scale, governance, degree of integration, number of intermediaries, target consumer segment, and marketing strategy. A detailed description of the three chains is available from the case study report [49]. Readers may refer to [50,51] for further insights. Besides the literature review, the case study research included interviews with key informants and an interdisciplinary collaboration with food scientists. The different research components of the case study research were carried out by different members of the research team, with the purpose of allowing the cross-fertilization among research components. Details about the EU project and full access to reports are available from [47,48]. This section of the article provides essential information about the interviews and extensively describe the design and implementation of the literature review.
3.1. Interviews with Key Informants
The purpose of interviews was identifying case study-specific sustainability issues and proposed solutions by food chain stakeholders and experts. Based on that, we used a snowballing procedure to select key informants to cover the research, industry, and retail sectors. Twelve key informants agreed to participate in the project, including university professors, business operators, producers’ associations, independent consultants, and company managers (Table 1).
To allow for cross-country comparability, the questionnaire design was based on a general draft shared with all European case studies that drew on a wide theoretical framework, relying on media analysis and a Delphi survey [52]. Each research team adapted the questionnaire based on the case studies, to address a set of food-specific critical issues, identified by the theoretical framework [52]. A sample questionnaire is available from the case study report [49].
Besides basic information about the respondent, different questionnaires were administered to supply chain stakeholders and experts. Supply chain stakeholders were asked to map and discuss supply chain steps, including their geographical proximity, their importance to allow supply chain viability, and their criticalities. A set of questions aimed at describing firm scale, production methods, material and resource use, and end-of-life disposal. Other questions addressed environmental, economic, and sustainability issues associated with firm management and operations, and possible approaches to problem solving. Compared to supply chain stakeholders, the structured questionnaire administered to experts was more flexible, to bridge knowledge gaps. Experts were asked to give theoretical and practical explanations about the environmental, economic, and social issues (or benefits) associated with the practices and technologies adopted by the three supply chains. Addressed topics were as follows: seed selection, farming, milling and processing methods and machineries; marketing strategies and distribution channels, including the adoption of labeling schemes (environmental labeling, geographical indication); packaging material and technology; waste management options.
Semi-structured interviews were carried out, face-to-face, with the twelve key informants. Meetings were arranged with all respondents, and structured questionnaire templates were filled in on the spot by one of the researchers in charge of the interview. Additionally, all meetings were recorded to check for the accuracy of template filling during questionnaire analysis.
The main bread chain phases were wheat farming, kernel milling, and baking.
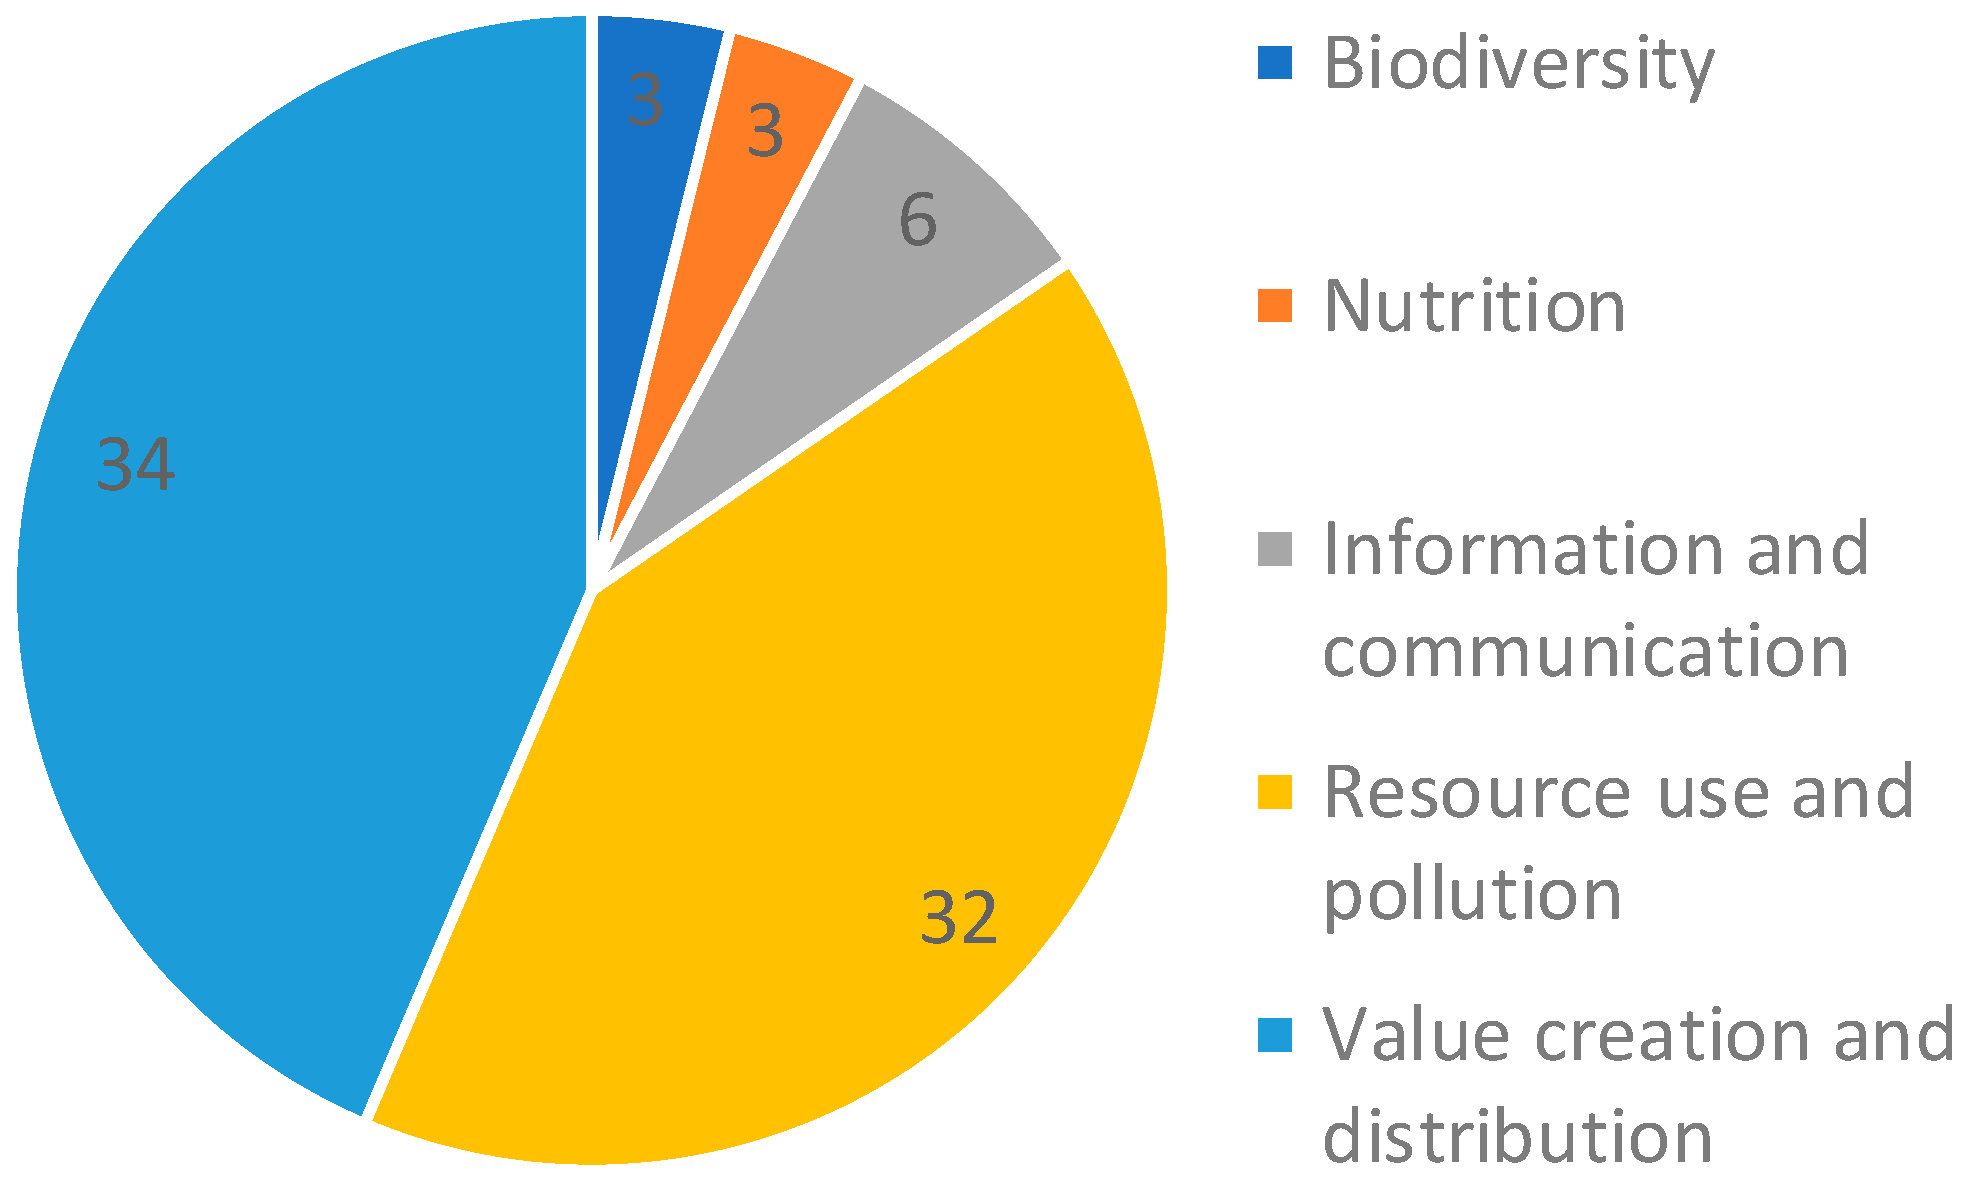
Critical issues specific to the case study were biodiversity (via seed mix selection), technological innovation (to reduce impacts on the environment and human health, and improve product shelf life and quality), nutrition (e.g., through recipe and leavening process), information and communication (nutritional and health claims, environmental labeling, geographical indication), resource use and pollution (organic and low input farming, impact monitoring via LCA), and value creation and distribution (e.g., via contract farming, contracts with retailers, direct sale).
3.2. Design and Implementation of the Literature Review
Research literature reviews are a widespread tool for managing knowledge diversity, when trying to answer specific research questions [53], allowing for highlighting of knowledge gaps and to create directions for future research [54]. Designing a research literature review implies making explicit, its objectives, concepts, and methods, including paper selection [38], to allow study replication and evaluation. The research question should drive papers’ selection strategy, which, in turn, needs be validated. Implementing research steps at the research team level, or comparing the research design with refereed literature, are examples of validation methods [26]. The search strategy is a stepwise procedure that involves identifying suitable bibliographic sources and exploring them using keywords associated with the research question, combining keywords into a string using Boolean operators, as well as creating and applying practical screening criteria for including or excluding papers, also with the aid of qualitative data analysis software [37]. Many scientific articles, e.g., [53,54], and academic books, e.g., [55,56,57], guide researchers throughout the review process. Additional support is available from web sources, most notably, the Preferred Reporting Items for Systematic Reviews and Meta-Analyses website [58]. Conditional on research aims and scope, the existing literature review frameworks allow authors some flexibility, as long as they document the stepwise process [59]. The reader may refer to the existing literature for methodological details. This paragraph reports on the design and implementation of this literature review, a process involving six consecutive steps.
3.2.1. Selection of Bibliographic Sources
For refereed literature, Elsevier Scopus® and Web of ScienceTM are the source databases. For non-refereed literature, Google ScholarTM is the source database.
3.2.2. Keywords and Search
The string “(sustainability OR sustainable) AND (bread OR grain OR wheat OR food) AND (local OR global) AND chain” was run over the fields title, abstract, and keywords of academic databases; different combinations of string terms were run over Google Scholar. A total of 2229 records were collected via EndNote® citation manager.
3.2.3. Creation and Application of Inclusion/Exclusion Criteria
No cut-off criteria were applied to research methods, quality, and time span. Only the academic database search was limited to journal articles and reviews written in English. Two exclusion and one inclusion criteria were consecutively applied. The first exclusion criterion involved journal selection: papers were excluded if journal aims and scope did not relate to agricultural economics, rural studies, or agricultural multidisciplinary. As an applied science, agricultural economics research covers heterogeneous fields, such as, e.g., farm management, production economics, environmental and resource economics, or food and consumer economics. The research area of rural studies is broad as well, being mainly concerned with the sociological aspects of access to environmental resources and vulnerability, including food and nutrition security. This category is linked with agricultural economics, especially when farm management and issues associated with food production and availability are the topics under study [60]. Agricultural multidisciplinary is not an academic discipline, but a category of Web of ScienceTM, including 56 journals dealing with heterogenous topics, e.g., engineering, economics, genetics, food science, or consumer studies, among others. The exclusion criterion based on journal aims and scope was carried out manually, based on journal websites and personal experience. Journals in the field of medical sciences were not excluded a priori, being not many (around 40), as the related disciplines are often associated with food and consumers economics and food sociology, especially when dealing with life cycle impacts of food production and consumption [60]. After the application of the first exclusion criterion, 1827 records were discarded. The second exclusion criterion aimed at the exclusion of double counts in EndNote®, and allowed 112 records to be discarded. The inclusion criterion relied on the manual scanning of abstracts; papers were included if they addressed the sustainability of food supply chains. This criterion allowed the exclusion of 66 records. The availability of full texts through authors’ university library system further limited the number of papers to 135. The full texts of those articles were retrieved and manually screened. Having highlighted the presence of very technical articles, especially agronomy or food science studies presenting field or laboratory experiments, we decided to implement a simple computer-assisted text analysis over the 135 full texts, using the Nvivo® qualitative data analysis software. This step was carried out by three out of the four authors. The rationale behind the computer-assisted screening was highlighting the possibility of extracting sustainability indicators from the retrieved documents, by isolating constructs that incorporated relevant terms associated with the research question. A text search query was formulated to create paper–paper connections based on word proximity; specifically, i.e., the term “indicator” had to appeared within three words from the terms “environment/environmental” OR “economy/economic” OR “society/social” OR “sustainability/sustainable”. Connected papers [29] were selected as the units of analysis and retrieved for review. Nvivo® screening markedly reduced the number of documents under review; some of those documents might be relevant for the study. This is a drawback of the computer-assisted screening; manual screening may have led to different results. Using a different qualitative data analysis software may have led to different results, as well, each software having a different structure. We opted for the automated, rather than for the manual, text analysis to improve screening objectivity, thereby reducing researcher bias associated with this step.
3.2.4. Validation of the Review Process
3.2.5. Material Description and Evaluation
This is the focus of the results section.
The retrieved papers are described based on key attributes and patterns [63]. Attributes are paper aim, object, and country of analysis, research method, and addressed dimension(s) of sustainability. Patterns refer to the concept of geographical proximity and to system boundaries. Patterns are identified, deductively, based on the existing literature [63]. The definitions for geographical proximity patterns were inductively created after paper review. Instead, system boundary definitions were based on the existing literature (deductive). The combination of deductive with inductive approaches ensures the external (the existing literature) and internal (the literature under study) validity of the identified categories [64]. Table 2 shows the patterns and their relative definitions.
The patterns for geographical proximity are four, i.e., global, national, local, and farm. The first three patterns were identified and defined based of the location of the activities involved in supply chain processes [1,2]. The fourth pattern, i.e., farm, was inductively created for flagging those articles that were focusing on farm-level performance. The patterns for system boundary are three, i.e., cradle-to-grave, cradle-to-retail, and gate-to-gate, and based on the common LCA terminology, (see e.g., [65]).
Indicators used in the retrieved literature were extracted and classified under environment, economy, and society, based on their application in the original paper (type of research and researcher perspective). Based on the critical issues presented in the previous section, the indicators were clustered under biodiversity, technological innovation, nutrition, resource use and pollution, information, and communication. Though aiming at objectivity, the authors’ judgement may have affected indicator allocation among sustainability dimensions and critical issues.
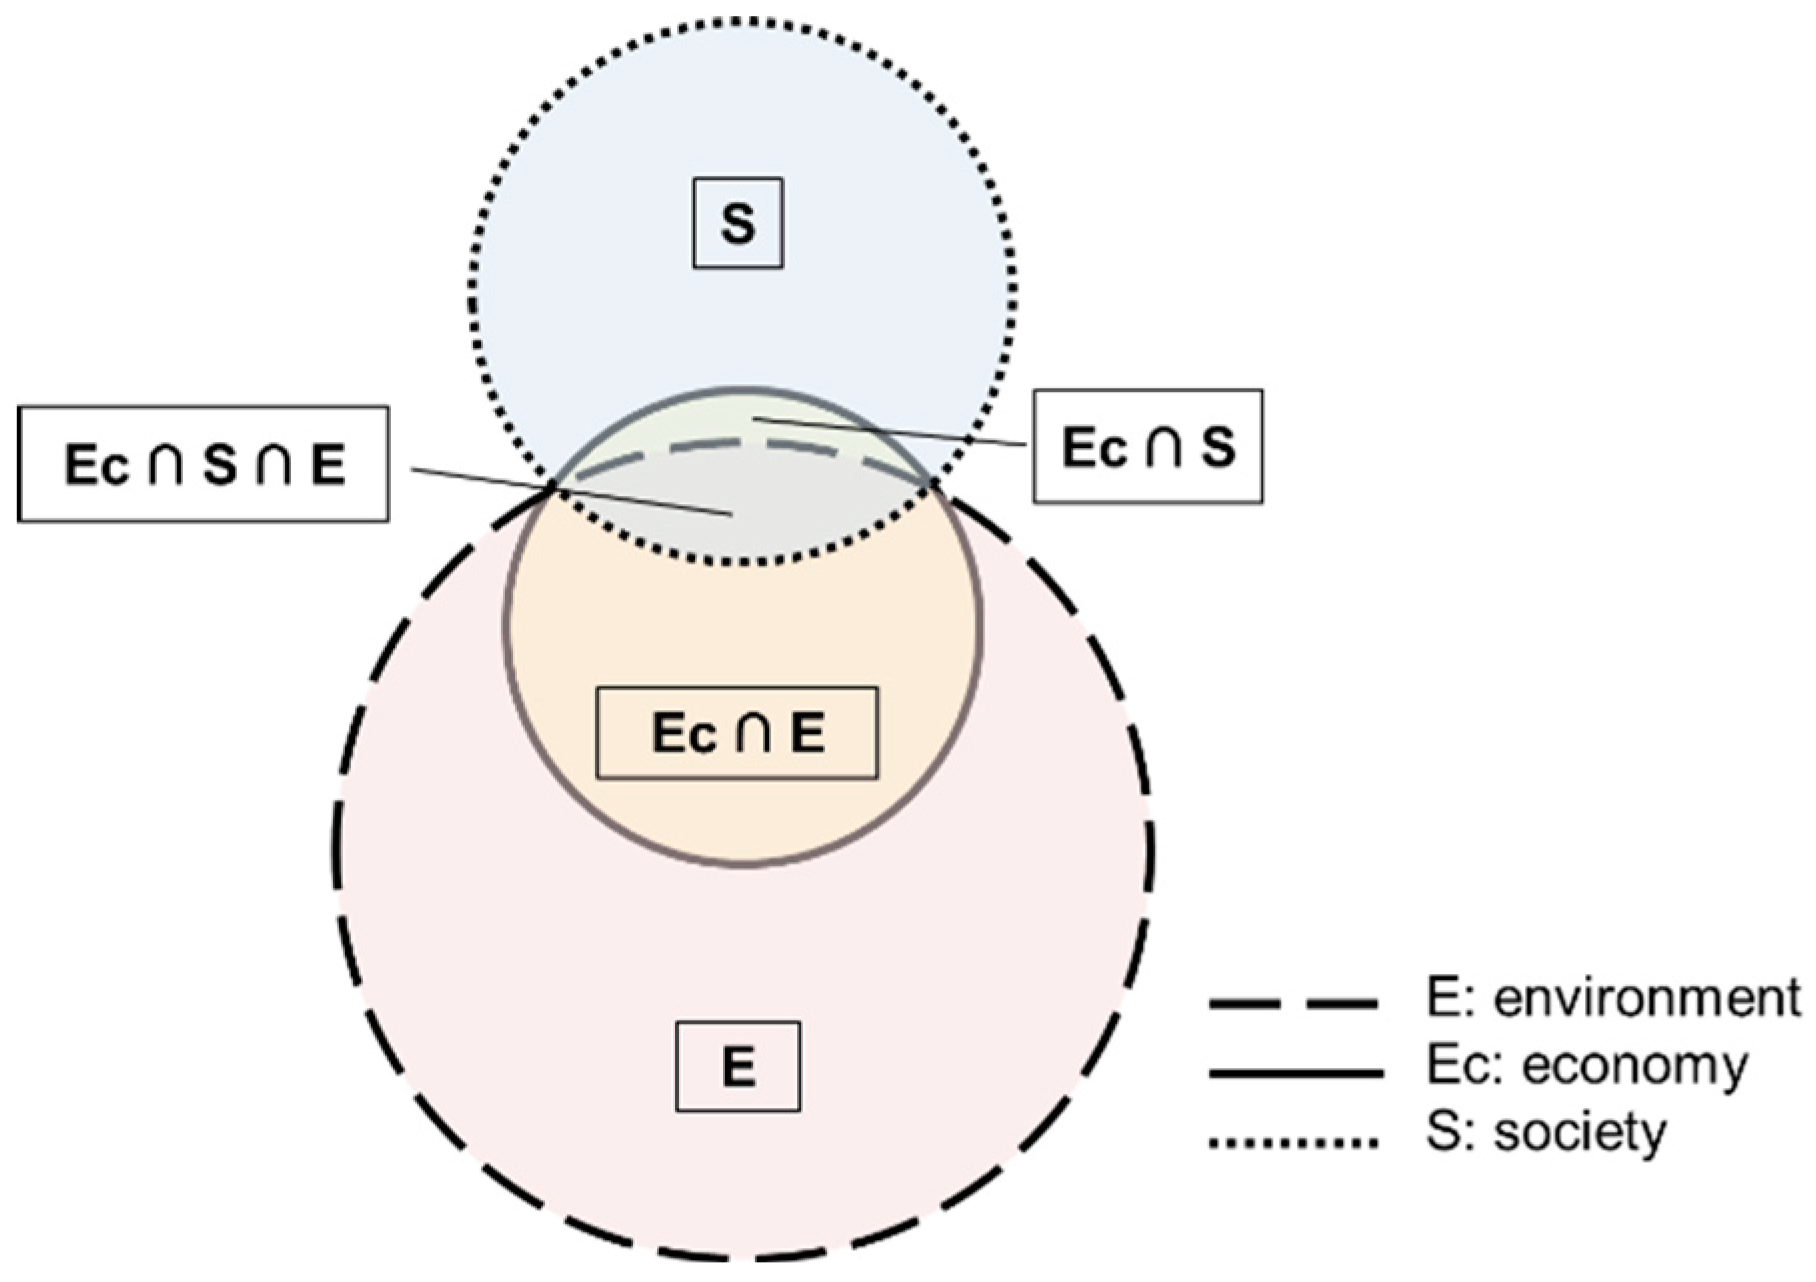
Sustainability can be represented and studied using quantitative, conceptual, standardizing, physical, or pictorial visualization approaches, differing for data requirements, level of integration among dimensions, type of outputs, and target audience [66]. Based on the preliminary literature overview, the pictorial visualization approach was selected to classify the indicators proposed by the units of analysis based on the dimension(s) addressed by the proposed indicator(s). Different pictorial visualization tools are available, each of them having known advantages and limitations [67]. The adopted pictorial visualization tool is the Venn diagram model. This step of the review is critical, given the risk of bias by researchers’ view and approach to model selection; different research teams may opt for different models, thereby generating different research outputs. We adopted the integrated perspective of sustainability, and selected that specific model to classify the indicators extracted by each record, given the marked heterogeneity of the units of analysis, especially with respect to research fields, methodologies, and investigated systems. In addition, model simplicity and popularity offer immediate understanding to readers, irrespective of their background [68]. The model is based on a three-overlapping circle symbolism, each circle representing a dimension of sustainability, namely environment (protection of natural resources and ecosystem health), economy (sector, business and people livelihood viability) and society (equity, health); sustainability may be achieved when all three circles overlap [69]. Under this framework, tridimensional indicators were identified and selected. Venn diagrams were built for visualizing the extracted indicators, and the relative importance of each dimension and dimension combination. Despite the computer-assisted screening, not all papers under review explicitly flag the proposed indicators as owing to the environmental, economic, and/or social dimension(s) of sustainability. This is due to the specific text syntax. When the dimension was not explicit, we contextualized indicator allocation to one or more of the three dimensions. Our attempt was to be as objective and transparent as possible; however, a certain degree of subjectivity may have affected indicator allocation.
3.2.6. Interpretation
Results’ interpretation is based on the outputs of the application of the Venn diagram model to the extracted indicators. This is the subject of the discussion paragraph, which is structured towards the identified set of indicators.
4. Results
4.1. Material Description
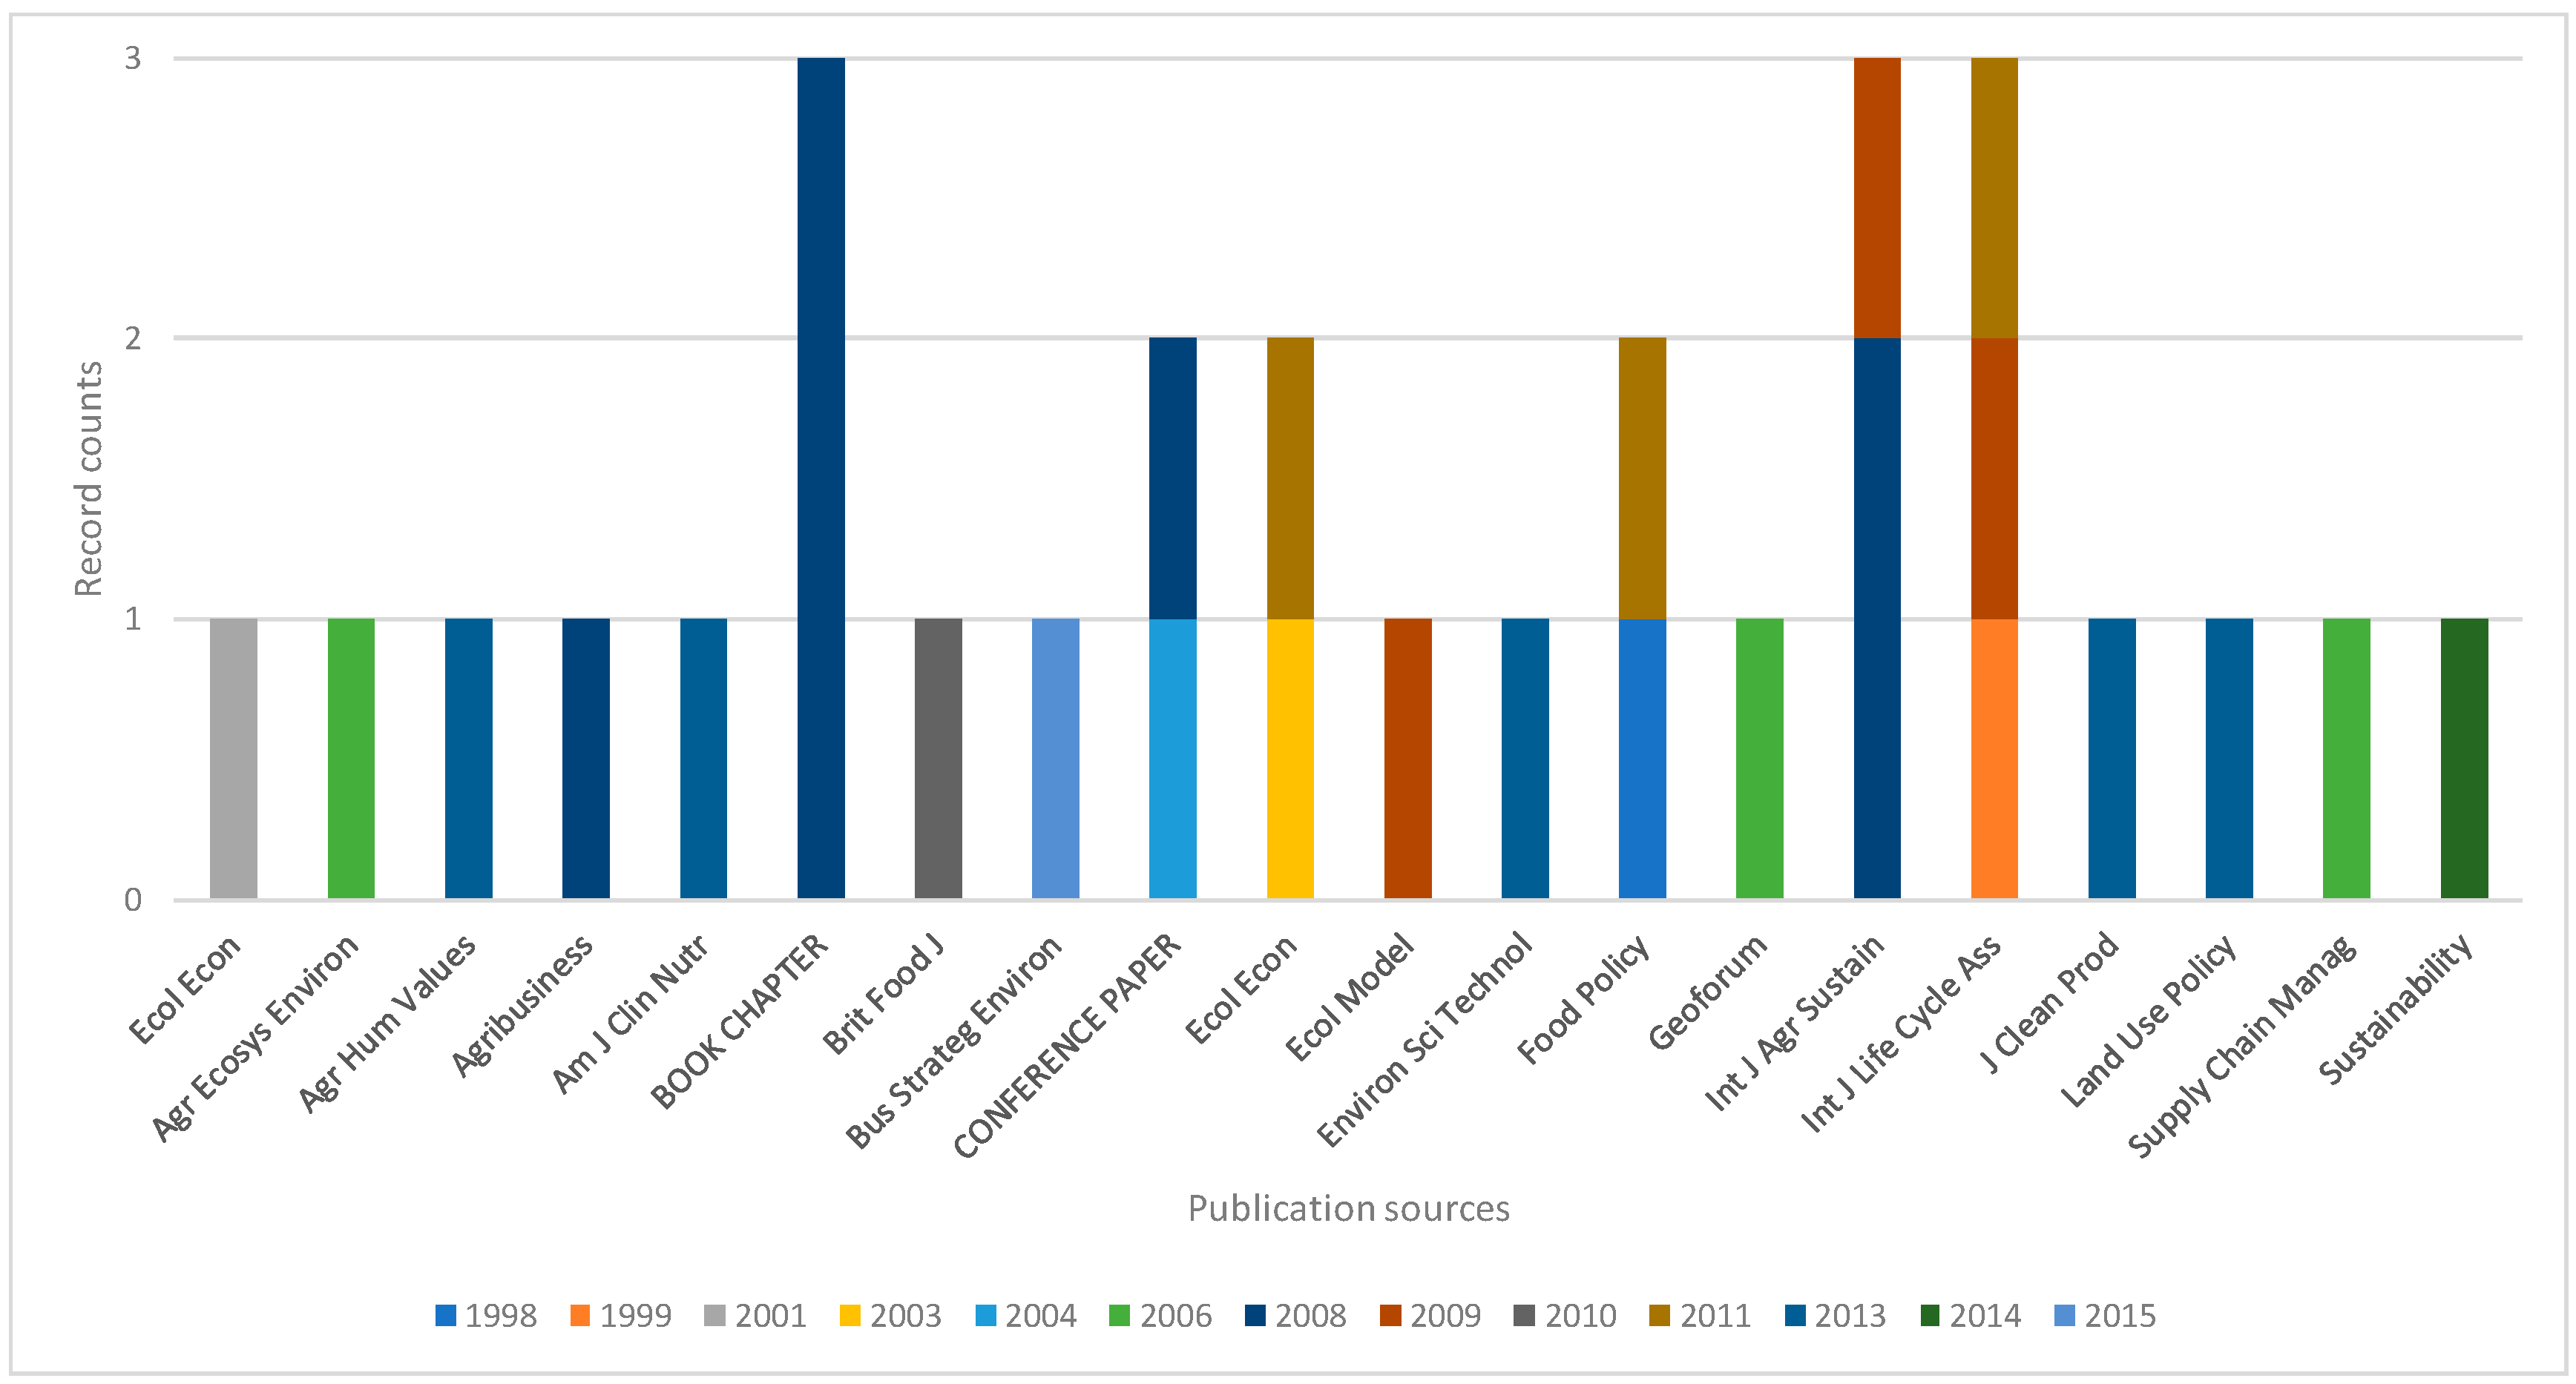
The units of analysis cover 16 years (1998–2014) and are distributed among heterogeneous publication sources, most of them being represented by one paper (Appendix A, Figure A1). The most represented journals are the International Journal of Agricultural Sustainability, the International Journal of Life Cycle Assessment. Three papers are book chapters, and two are extracted from conference proceedings. Research aims vary considerably throughout the analyzed literature (Table 3).
Three articles address food chain localization strategies, six deliver impact assessments of food chain steps, six focus on sustainability strategies at the business or organizational level, and four concentrate on ethical traceability. Additionally, two papers address life cycle impacts of diets, two focus on ecological aspects of different food chains, one concentrates on stakeholder perceptions of sustainability, and three more articles concentrate on methodological aspects of impact assessments. Concerning the addressed dimensions of sustainability, fifteen papers concentrate on environmental issues and seven add the economic and/or social dimension. Social issues are the focus of six papers. The economic dimension tends to be associated with other dimensions. Quantitative and qualitative researches have similar purposes, but differ for data gathering, handling, and reporting. Mainly, quantitative research designs (17 papers) rely on LCA-based techniques (6 papers), including carbon footprint and life cycle inventory, or on alternative life cycle impact calculation methods (7 papers). Qualitative studies propose literature reviews (6 papers) or analysis of interview-based information (5 papers). Nine documents focus on bread, twelve on primary or processed foodstuffs different from bread, and eight assess sustainability at the retailer, diet, meal, food chain, or farm level. Geographic settings are diverse, with the United Kingdom (7 papers) and Scandinavian states (5 papers) being the most investigated ones. Moving to geographical proximity patterns, most articles study national supply chains (20 papers), followed by local supply chains (8 papers); six papers analyze supply chains with different geographical proximity and two deliver farm-level evaluations. System boundaries are fairly evenly distributed among the three patterns, i.e., cradle-to-grave, cradle-to-retail, and gate-to-gate, with the latter accounting for a slightly larger number of articles.
Paper analysis returned 78 indicators addressing single and multiple dimensions of sustainability: environment (39 indicators); economy (36 indicators); society (27 indicators); environment and economy (4 indicators); environment and society (7 indicators); economy and society (6 indicators); and environment, economy, and society (5 indicators) (Appendix B, Table A1). As far as possible, indicators with a similar purpose or definition were flagged under the same label, though proposed by different authors and used under different research frameworks. Five out of six critical issues are represented (Figure 1).
None of the identified indicators explicitly targets the impacts of technological innovation. Compared to resource use and pollution, and value creation and distribution, the number of indicators aimed at delivering measures about biodiversity, nutrition and information, and communication, is reduced. While some articles relate supply chain sustainability with geographical proximity, no single indicator explicitly provides a measure of that relationship. The identified indicators deliver (and are based on) qualitative and quantitative information, with heterogeneous measuring systems. This may prevent objective judgements. Environmental indicators include measures of impact on the physical or biologic environment; they are generally very specific and require detailed measures, especially when compared to social indicators. At times, information delivered by some environmental indicators tends to overlap (e.g., “land use” vs “total land requirements”), which may slow down the process of indicator selection for decision-making purposes. Mainly, economic indicators address firms’ ability to deal with appropriate investments and to optimally allocate resources, while social indicators focus on human health environmental assessments generally follow standard data collection procedures, to allow for replicability. This may not be the case when gathering information form people via interviews or surveys, with increased risk of researcher bias.
4.2. Material Evaluation
This subsection draws on the application of the Venn diagram model to the retrieved literature. At the article level, the environmental dimension has the greatest importance, followed by the social (Figure 2).
Stand-alone economic assessments are missing, being frequently combined with environmental analyses. This suggests a general trend towards the evaluation of the economic viability of the strategies for improving the environmental performance of food supply chains. For life cycle analyses, this trend could benefit from the similar data requirements of environmental and economic assessments. The integration of social aspects into multidimensional assessments is reduced. This may be due to the large use of qualitative data analyses by social scientists, especially when dealing with case study-specific data. This suggests the need for a greater research effort towards the application and the development three-dimensional assessment frameworks (such as, e.g., the Life Cycle Sustainability Assessment).
Moving to the identified indicators, the trade-off between the evaluation of environmental and economic issues is reduced (Figure 3).
The reduced area of the social dimension suggests the need for more research towards the development of social impact indicators and of multidimensional indicators, which may facilitate the work of evaluators. Five indicators show up where all three circles overlap, i.e., breeding effectiveness (b1), product/process certifications (i2), water use intensity/savings (r32), waste generation/reduction (r31), and business uncertainty (v3) (Table 4).
The five indicators were identified from eight papers and cover four critical issues, i.e., biodiversity, information and communication, resource use and pollution, and value creation and distribution (cf. Table A1). Three out of five indicators are used for the simultaneous assessment of multiple sustainability dimensions in the original paper. Instead, the two indicators addressing issues associated with resource use and pollution are sometimes used for purely environmental evaluations. In the original papers, indicator selection mainly relied on the existing literature, though sometimes authors supplemented the literature with stakeholder consultations. Just two out of eight papers measured the indicator using primary data sources. For quantitative applications, indicators are expressed by some physical property of object of analysis. For qualitative applications, the value of indicators is expressed in relative terms, by means of author-defined ranking scales or binary variables, such as, e.g., the presence/absence of a sustainability label.
5. Discussion
5.1. Water Use Intensity/Savings
The LCA tool offers the only comprehensive indicator, i.e., the volume of water consumed over product life cycle per functional unit (L/kg bread ready for consumption at home). However, the cost of an LCA may be prohibitive for smaller food manufactures [43,85]. Wheat farming, consumer, waste, and transport phases are not a water-intensive phase, contrary to wheat-to-bread processing [98]. A measure of the rough annual water consumption (e.g., based on water bills) at the bakery level may provide a proxy for water use sustainability. Concerning chain’s geographical extension, generally, local bakeries have a smaller scale compared to the global ones, which distribute bread internationally. Due to economies of scale, bigger facilities are expected to display more efficient water use that smaller ones. Water use efficiency indicators are expected to be lower for local bakeries.
5.2. Waste Generation/Reduction
Waste refers to unsold bread and packaging. Besides energy consumption, resource wastage on farm may encompass harvest losses due to adverse weather conditions or human error. Waste occurs at the mill phase as well. Generally, the baking phase shows the highest waste production in the wheat-to-bread chain [79]. However, most waste is produced beyond the bakery gate, at the consumer and retail phases [99]. The total weight of unsold bread, including packaging per unit area of retail stores and per household (e.g., using data form official statistics) may be useful for the sustainability assessment of bread supply chains. The shorter the shelf life, the greater the expected quantities of food and packaging waste and the higher the GHG emissions [79]. Short shelf-life bread is likely to be produced, traded, and consumed locally. Local products tend to be characterized by cultural and community embeddedness. This may prevent the generation of food waste generation; e.g., the Italian gastronomy offers countless ways for cooking stale bread. The waste efficiency indicator may display poorer performance as chain’s geographical proximity decreases. Energy and/or nutrients may be recovered from bread, being organic waste; packaging (paper or plastic) may undergo the recycling process. Plausible indicators may consider the ratio between the weight of bread diverted to either biomass-to-energy or composting plants, and the weight of bread sent to landfill per unit area of the retail store or per household. Again, the smaller the geographic extension of the chain, the better the expected chain’s performance.
5.3. Breeding Effectiveness
Wheat breeds differ for their resistance to biological and environmental stresses, yield, and nutritional properties, especially gluten content and glycemic index. Healthier nutritional properties decrease with yield, which in turn, increases with mineral inputs [100]. Large scale wheat cropping, for selling on the commodity market, generally rely on high yield and nutrient intensive seeds to ensure business stability. Productivity maximization needs (quasi-)optimal soil and climatic conditions, as well as wide land extension, which may limit the competitiveness of, e.g., hilly or mountain regions. Farmers producing for smaller scale markets in suboptimal farm conditions may benefit from locally adapted or heritage wheat varieties, given their hardiness. This may also help biodiversity conservation locally. Those hardy varieties are more suitable to low input farming than mainstream high-yield varieties, despite their higher variability in yield and technological quality of kernels [15]. One of the strengths of food (re)localization strategies is giving “diverse” food a market [71]. For example, a sustainability indicator may be the ratio between the income generated by cultivating (or baking with) non-mainstream and mainstream breeds, measured at the regional, national, and supernational levels. That indicator may capture the ability of those (re)localization strategies to allow the viability of “alternative” bread chains.
5.4. Product/Process Certifications
From a buyer perspective, product labeling (e.g., carbon footprint, water footprint, sustainable farming, fair trade) is the easiest way to know about product or process sustainability. From a food producer perspective, meeting certification requirements may constrain business performances, though, entrepreneurs acknowledge the marketing value added by sustainability labeling [71,95]. Certifications generally involve traceability systems, which need collaboration among chain partners and fees, which tend to be a barrier for local food producers. The availability of sustainability labeling is a proxy for chains’ sustainability, which may show more positive values for more geographically extended chains.
5.5. Business Uncertainty
Pursuing sustainability goals at the firm level—e.g., while deciding on business development or resource allocation—requires considering social, economic, and environmental aspects. Economic aspects are priorities [95]. Indicators of the economic performance of a business are many, e.g., focusing on profitability, competitiveness, or risk. Just a few of those indicators can capture the differences associated with the geographical extension of bread supply chains, which, in turn, may depend on stakeholders’ priorities [101]. For example, boosting profitability while reducing uncertainty is the priority, when it comes to deciding to participate in a supply chain with a given geographical extension [95]. On farms, decisions about the crop mix and farming practices depend on the degree of business uncertainty. Yield stability of low-input or hardier breeds and the availability of financial support for implementing low-input farming practices may approximate for reduced business uncertainty for farmers. Concerning downstream phases, marketing strategies dedicated to the promotion of flour and bread from low-input (or hardier) grains or originated from low-input farming may reduce business uncertainty. Given the general higher market shares, business uncertainty may be expected to be lower for bread companies with wider geographic extension.
6. Conclusions
Using the example of bread, this paper links sustainability with the geographical extension of the food chain, by means of a literature review. Results show that sustainability assessments rarely and simultaneously cover environmental, economic, and social dimensions, with the latter being the most disadvantaged dimension. A significant share of papers proposes LCAs. Those studies may not consider the opportunity cost of resource use or identify the connections and interdependences among chain phases and, thus, miss proposing solutions for improving resource use efficiency.
The task of synthetizing social preferences adds complexity to sustainability assessments of the food chain, because preferences depend on cultural factors, media, and marketing strategies, among others. Moreover, available information about the food chain is often asymmetric. Stakeholders’ opportunistic and/or irrational behavior make the task even harder. Results suggest that reliable sustainability assessments of the food chain should highlight areas of consensus or disagreement, to allow the use of assessment’s outcomes for reducing uncertainty in decision-making. The authors’ research field is likely to influence method selection, as well as the prospected study outcomes. At times, different research approaches are used to address the same issues within the same dimensions of sustainability (overlapping). Decision-makers in charge of delivering judgements about food chain sustainability need synthetic information about food chains’ complexity, and about existing balancing or reinforcing loops, and trade-offs among stakeholder preferences. Knowing the opportunity costs of allocating investments and distributing resources across chain stakeholders (and phases) is also required. The lack of comprehensive evaluations of the economic, environmental, and social sustainability of the food chain hinders the delivery of judgements. Besides raw indicator measures, decision-makers should know social preferences and perceptions, because path and context dependency, and the influence of media, can alter the value of available information.
To overcome the methodological limitations of this study, further research may focus more on the integration of manual with computer-assisted text analysis, especially when it comes to paper selection based on textual constructs. Further research may improve the understanding of the sustainability of different technological advancements over food life cycle, including single process sustainability, for example, by means of Life Cycle Sustainability Assessment models. Social and, especially, consumer preferences for foodstuffs belonging to supply chains with different geographical extension are worth being integrated in future assessments, as well as the opportunity cost of allocating financial resources to different chain phases for improving the life cycle sustainability performance. Regionalized Life Cycle Sustainability Assessment may help integrate the geographical dimension in sustainability indicators. Supplementing life cycle with systems dynamics studies is a possible way for considering feedback loops, when evaluating the sustainability of alternative food chains.
Author Contributions
Conceptualization, O.G., F.G. and F.B.; Methodology, O.G.; Software, F.B.; Validation, F.G. and F.B.; Formal Analysis, O.G.; Investigation, F.G.; Resources, F.G.; Data Curation, F.G.; Writing-Original Draft Preparation, O.G.; Writing-Review & Editing, O.G.; Visualization, F.B.; Supervision, G.B.; Project Administration, G.B.; Funding Acquisition, G.B.
Funding
This research was funded by European Commission 7th Framework Program for research, technological development and demonstration under Grant No. 311778.
Conflicts of Interest
The authors declare no conflict of interest. The funders had no role in the design of the study; in the collection, analyses, or interpretation of data; in the writing of the manuscript, and in the decision to publish the results.
Appendix A
Figure A1.
Year-source distribution of the articles subject to review. Book chapters are all published in [102]. Conference papers are available from the proceedings of the 4th Life Cycle Assessment (LCA) Food Conference [103] and the 12th Congress of the European Association of Agricultural Economists [104]. Source: authors’ own elaboration.

Appendix B

Table A1.
Identified indicators per dimension of sustainability (E: Environment; Ec: economy; S: Social). Source: authors’ own elaboration.
Table A1.
Identified indicators per dimension of sustainability (E: Environment; Ec: economy; S: Social). Source: authors’ own elaboration.
| Critical Issues (Interviews) | Indicator | Code | Sustainability Dimensions | ||
|---|---|---|---|---|---|
| Environ | Economy | Society | |||
| Biodiversity | Breeding effectiveness | b1 | X | X | X |
| Breeding intensity | b2 | X | |||
| Farmland biodiversity | b3 | X | X | ||
| Nutrition | Dietary energy density | n1 | X | X | |
| Food/water safety and quality | n2 | X | |||
| Mean adequacy/excess ratio | n3 | X | |||
| Information and communication | Personal bonds among chain stakeholders | i1 | X | ||
| Product/process certifications | i2 | X | X | X | |
| Quality/frequency of communication | i3 | X | X | ||
| Supplier/buyer satisfaction | i4 | X | |||
| Traceability system | i5 | X | |||
| Trust | i6 | X | |||
| Resource use and pollution | Acidification potential | r1 | X | ||
| Agricultural intensification | r2 | X | |||
| Ammonia emissions | r3 | X | X | ||
| Carbon dioxide efficiency | r4 | X | |||
| Cumulative energy demand | r5 | X | |||
| Eco-indicator | r6 | X | |||
| Ecological scarcity | r7 | X | |||
| Eco-toxicity | r8 | X | X | ||
| Energy efficiency | r9 | X | X | ||
| Energy self sufficiency | r10 | X | |||
| Environmental risk | r11 | X | |||
| Eutrophication potential | r12 | X | |||
| Farming intensity | r13 | X | |||
| Global warming potential | r14 | X | |||
| Good agricultural management | r15 | X | |||
| Greenhouse gas emissions and mitigation potential | r16 | X | |||
| Human toxicity | r17 | X | X | ||
| Land quality | r18 | X | |||
| Land use | r19 | X | |||
| Mitigation of dust emissions | r20 | X | X | ||
| Natural resource intensity | r21 | X | X | ||
| Nutrient fluxes | r22 | X | |||
| Nutrient input intensity | r23 | X | |||
| Nutrient sequestration potential | r24 | X | |||
| Ozone generation/depletion | r25 | X | |||
| Photo-oxidant formation | r26 | X | |||
| Primary energy use | r27 | X | |||
| Total land requirement | r28 | X | |||
| Transport intensity | r29 | X | |||
| Virtual land use | r30 | X | X | ||
| Waste generation/reduction | r31 | X | X | X | |
| Water use intensity/savings | r32 | X | X | X | |
| Value creation and distribution | Agri-environmental payments | v1 | X | ||
| Barriers to chain localization | v2 | X | X | ||
| Business uncertainty | v3 | X | X | X | |
| Chain stakeholders’ power | v4 | X | |||
| Community and local interests | v5 | X | |||
| Income distribution across the chain | v6 | X | X | ||
| Innovation (management) | v7 | X | X | ||
| Input/raw material price | v8 | X | X | ||
| Institutional efficiency | v9 | X | |||
| Interest in shifting from commodity marketing to value chain approach | v10 | X | |||
| Labor safety | v11 | X | |||
| Job creation | v12 | X | |||
| Local embeddedness | v13 | ||||
| Logistics system | v14 | X | X | ||
| Management system | v15 | X | |||
| Market competition | v16 | X | |||
| Market requirements | v17 | X | |||
| Market share | v18 | X | |||
| Marketing strategy | v19 | X | |||
| Maximum sustainable retail price increase | v20 | X | |||
| Number of employees | v21 | X | X | ||
| Number of shareholders | v22 | X | |||
| Number of stores | v23 | X | |||
| Personnel management | v24 | X | |||
| Production cost | v25 | ||||
| Profitability | v26 | X | |||
| Raw material quality | v27 | X | |||
| Relationships across the chain | v28 | X | |||
| Retail price | v29 | X | |||
| Revenues from sales | v30 | X | |||
| Skilled personnel | v31 | X | |||
| Store wideness | v32 | X | |||
| Tax paid | v33 | X | |||
| Turnover | v34 | X | |||
References
- King, R.P.; Hand, M.S.; Di Giacomo, G.; Clancy, K.; Gómez, M.I.; Hardesty, S.D.; Lev, L.; McLaughlin, E.W. Comparing the Structure, Size, and Performance of Local and Mainstream Food Supply Chains; U.S. Department of Agriculture, Economic Research Service: Washington, DC, USA, 2010.
- Kremer, P.; DeLiberty, T.L. Local food practices and growing potential: Mapping the case of Philadelphia. Appl. Geogr. 2011, 31, 1252–1261. [Google Scholar] [CrossRef]
- Kneafsey, M.; Eyden-Wood, T.; Bos, E.; Sutton, G.; Santini, F.; Gomez y Paloma, S.; Venn, L.; Schmutz, U.; Balázs, B.; Trenchard, L.; et al. Short Food Supply Chains and Local Food Systems in the EU: A State of Play of Their Socio-Economic Characteristics; Joint Research Centre—Institute for Prospective Technological Studies; Publication Office of the European Union: Luxembourg, 2013; ISBN 9789279292880. [Google Scholar]
- Marsden, T.; Banks, J.; Bristow, G. Food supply chain approaches: Exploring their role in rural development. Sociol. Rural. 2000, 40, 424–438. [Google Scholar] [CrossRef]
- Edwards-Jones, G.; Milà i Canals, L.; Hounsome, N.; Truninger, M.; Koerber, G.; Hounsome, B.; Cross, P.; York, E.H.; Hospido, A.; Plassmann, K.; et al. Testing the assertion that ‘local food is best’: The challenges of an evidence-based approach. Trends Food Sci. Technol. 2008, 19, 265–274. [Google Scholar] [CrossRef]
- Wilhelmina, Q.; Joost, J.; George, E.; Guido, R. Globalization vs. localization: Global food challenges and local solutions. Int. J. Consum. Stud. 2010, 34, 357–366. [Google Scholar] [CrossRef]
- Hinrichs, C.C. The practice and politics of food system localization. J. Rural Stud. 2003, 19, 33–45. [Google Scholar] [CrossRef]
- Martinez, S.; Hand, M.; Da Pra, M.; Pollack, S.; Ralston, K.; Smith, T.; Vogel, S.; Clark, S.; Lohr, L.; Low, S.; et al. Local Food Systems: Concepts, Impacts, and Issues; U.S. Department of Agriculture, Economic Research Service: Washington, DC, USA, 2010.
- Born, B.; Purcell, M. Avoiding the Local Trap: Scale and Food Systems in Planning Research. J. Plan. Educ. Res. 2006, 26, 195–207. [Google Scholar] [CrossRef]
- Schader, C.; Grenz, J.; Meier, M.S.; Stolze, M. Scope and precision of sustainability assessment approaches to food systems. Ecol. Soc. 2014, 19, 42. [Google Scholar] [CrossRef]
- Lamine, C. Sustainability and Resilience in Agrifood Systems: Reconnecting Agriculture, Food and the Environment: Sustainability and resilience in agrifood systems. Sociol. Rural. 2015, 55, 41–61. [Google Scholar] [CrossRef]
- Mason, N.M.; Jayne, T.S.; Chapoto, A.; Donovan, C. Putting the 2007/2008 global food crisis in longer-term perspective: Trends in staple food affordability in urban Zambia and Kenya. Food Policy 2011, 36, 350–367. [Google Scholar] [CrossRef]
- Sternberg, T. Chinese drought, bread and the Arab Spring. Appl. Geogr. 2012, 34, 519–524. [Google Scholar] [CrossRef]
- Urruty, N.; Tailliez-Lefebvre, D.; Huyghe, C. Stability, robustness, vulnerability and resilience of agricultural systems. A review. Agron. Sustain. Dev. 2016, 36, 1–15. [Google Scholar] [CrossRef]
- Hills, K.M.; Goldberger, J.R.; Jones, S.S. Commercial bakers and the relocalization of wheat in western Washington State. Agric. Hum. Values 2013, 30, 365–378. [Google Scholar] [CrossRef]
- Manos, B.; Bournaris, T.; Moulogianni, C.; Arampatzis, S. IA tools applied to impact assessment of EU policies in agriculture and environment. Int. J. Environ. Sustain. Dev. 2013, 12, 103–123. [Google Scholar] [CrossRef]
- Kopp, R.; Krupnick, A.; Toman, M. Cost-benefit analysis and regulatory reform. Hum. Ecol. Risk Assess. Int. J. 1997, 3, 787–852. [Google Scholar] [CrossRef]
- Porter, J.; Costanza, R.; Sandhu, H.; Sigsgaard, L.; Wratten, S. The Value of Producing Food, Energy, and Ecosystem Services within an Agro-Ecosystem. AMBIO 2009, 38, 186–193. [Google Scholar] [CrossRef] [PubMed]
- Burton, M. Consumer attitudes to genetically modified organisms in food in the UK. Eur. Rev. Agric. Econ. 2001, 28, 479–498. [Google Scholar] [CrossRef]
- Van Wezemael, L.; Caputo, V.; Nayga, R.M.; Chryssochoidis, G.; Verbeke, W. European consumer preferences for beef with nutrition and health claims: A multi-country investigation using discrete choice experiments. Food Policy 2014, 44, 167–176. [Google Scholar] [CrossRef]
- Caputo, V.; Vassilopoulos, A.; Nayga, R.M.; Canavari, M. Welfare Effects of Food Miles Labels: Welfare Effects of Food Miles Labels. J. Consum. Aff. 2013, 47, 311–327. [Google Scholar] [CrossRef]
- Pearce, D.W.; Turner, R.K. Economics of Natural Resources and the Environment; Johns Hopkins University Press: Baltimore, MD, USA, 1990; ISBN 9780801839863. [Google Scholar]
- Loomis, J.B. The evolution of a more rigorous approach to benefit transfer: Benefit function transfer. Water Resour. Res. 1992, 28, 701–705. [Google Scholar] [CrossRef]
- Environmental Benefits Transfer: Methods, Applications and New Directions Benefits Transfer. Ecol. Econ. 2006, 60, 335–482. Available online: http://www.sciencedirect.com/science/journal/09218009/60/2 (accessed on 2 August 2018).
- Bartolini, F.; Viaggi, D. Recent developments in multi-criteria evaluation of regulations: Recent developments in multi-criteria evaluation. Qual. Assur. Saf. Crop. Foods 2010, 2, 182–196. [Google Scholar] [CrossRef]
- Nesheim, M.C.; Oria, M.; Yih, P.T. A Framework for Assessing the Effects of the Food System; National Research Council (U.S.)/Institute of Medicine (U.S.)/National Academies Press: Washington, DC, USA, 2015; ISBN 9780309307802. [Google Scholar]
- Halberg, N.; van der Werf, H.M.G.; Basset-Mens, C.; Dalgaard, R.; de Boer, I.J.M. Environmental assessment tools for the evaluation and improvement of European livestock production systems. Livest. Prod. Sci. 2005, 96, 33–50. [Google Scholar] [CrossRef] [Green Version]
- Seuring, S.; Müller, M. From a literature review to a conceptual framework for sustainable supply chain management. J. Clean. Prod. 2008, 16, 1699–1710. [Google Scholar] [CrossRef]
- Singh, R.K.; Murty, H.R.; Gupta, S.K.; Dikshit, A.K. An overview of sustainability assessment methodologies. Ecol. Indic. 2012, 15, 281–299. [Google Scholar] [CrossRef]
- Hassini, E.; Surti, C.; Searcy, C. A literature review and a case study of sustainable supply chains with a focus on metrics. Int. J. Prod. Econ. 2012, 140, 69–82. [Google Scholar] [CrossRef]
- French, S. A manifesto for the new MCDA era. J. Multi-Criteria Decis. Anal. 1993, 2, 125–127. [Google Scholar] [CrossRef]
- Munda, G. Social multi-criteria evaluation: Methodological foundations and operational consequences. Eur. J. Oper. Res. 2004, 158, 662–677. [Google Scholar] [CrossRef]
- Mann, S.; Wüstemann, H. Multifunctionality and a new focus on externalities. J. Socio-Econ. 2008, 37, 293–307. [Google Scholar] [CrossRef]
- Van der Vorst, J.G.A.J.; Tromp, S.-O.; van der Zee, D.-J. Simulation modelling for food supply chain redesign; integrated decision making on product quality, sustainability and logistics. Int. J. Prod. Res. 2009, 47, 6611–6631. [Google Scholar] [CrossRef] [Green Version]
- Castellani, V.; Sala, S.; Benini, L. Hotspots analysis and critical interpretation of food life cycle assessment studies for selecting eco-innovation options and for policy support. J. Clean. Prod. 2017, 140, 556–568. [Google Scholar] [CrossRef]
- Roy, P.; Nei, D.; Orikasa, T.; Xu, Q.; Okadome, H.; Nakamura, N.; Shiina, T. A review of life cycle assessment (LCA) on some food products. J. Food Eng. 2009, 90, 1–10. [Google Scholar] [CrossRef]
- Ness, B.; Urbel-Piirsalu, E.; Anderberg, S.; Olsson, L. Categorising tools for sustainability assessment. Ecol. Econ. 2007, 60, 498–508. [Google Scholar] [CrossRef]
- Kloepffer, W. Life cycle sustainability assessment of products: (with Comments by Helias A. Udo de Haes, p. 95). Int. J. Life Cycle Assess. 2008, 13, 89–95. [Google Scholar] [CrossRef]
- UNEP. Guidelines for Social Life Cycle Assessment of Products; United Nations Environment Programme: Paris, France, 2009; ISBN 978-92-807-3021-0. [Google Scholar]
- Finkbeiner, M.; Schau, E.M.; Lehmann, A.; Traverso, M. Towards life cycle sustainability assessment. Sustainability 2010, 2, 3309–3322. [Google Scholar] [CrossRef]
- Zamagni, A. Life cycle sustainability assessment. Int. J. Life Cycle Assess. 2012, 17, 373–376. [Google Scholar] [CrossRef] [Green Version]
- Valdivia, S.; Ugaya, C.M.; Hildenbrand, J.; Traverso, M.; Mazijn, B.; Sonnemann, G. A UNEP/SETAC approach towards a life cycle sustainability assessment—Our contribution to Rio+ 20. Int. J. Life Cycle Assess. 2013, 18, 1673–1685. [Google Scholar] [CrossRef]
- Rajagopal, D.; Vanderghem, C.; MacLean, H.L. Life Cycle Assessment for Economists. Annu. Rev. Resour. Econ. 2017, 9, 361–381. [Google Scholar] [CrossRef]
- Devers, L.; Kleynhans, T.E.; Mathijs, E. Comparative life cycle assessment of Flemish and Western Cape pork production. Agrekon 2012, 51, 105–128. [Google Scholar] [CrossRef]
- Brodt, S.; Kramer, K.J.; Kendall, A.; Feenstra, G. Comparing environmental impacts of regional and national-scale food supply chains: A case study of processed tomatoes. Food Policy 2013, 42, 106–114. [Google Scholar] [CrossRef]
- Janakiraman, R.; Niraj, R. The Impact of Geographic Proximity on What to Buy, How to Buy, and Where to Buy: Evidence from High-Tech Durable Goods Market*: Janakiraman and Niraj. Decis. Sci. 2011, 42, 889–919. [Google Scholar] [CrossRef]
- GLAMUR EU. Global and Local Food Assessment: A Multidimensional Performance-Based Approach. Available online: http://glamur.eu/ (accessed on 15 August 2018).
- Brunori, G.; Galli, F.; Barjolle, D.; van Broekhuizen, R.; Colombo, L.; Giampietro, M.; Kirwan, J.; Lang, T.; Mathijs, E.; Maye, D.; et al. Are Local Food Chains More Sustainable than Global Food Chains? Considerations for Assessment. Sustainability 2016, 8, 449. [Google Scholar] [CrossRef] [Green Version]
- Galli, F.; Gava, O.; Bartolini, F.; Marescotti, A.; Brunori, G. Global and Local Wheat-to-Bread Supply Chains. Italian Case Study Report (Task 3.5). Glamur Project Fondazione Italiana per la Ricerca in Agricoltura Biologica Biodinamica, Italy, 2015. Available online: http://glamur.eu/wp-content/uploads/2015/04/glamur-wp3-italy-bread-3-cases.pdf (accessed on 15 August 2018).
- Galli, F.; Bartolini, F.; Brunori, G.; Colombo, L.; Gava, O.; Grando, S.; Marescotti, A. Sustainability assessment of food supply chains: An application to local and global bread in Italy. Agric. Food Econ. 2015, 3, 21. [Google Scholar] [CrossRef]
- Galli, F.; Venturi, F.; Bartolini, F.; Gava, O.; Zinnai, A.; Sanmartin, C.; Andrich, G.; Brunori, G. Shaping food systems towards improved nutrition: A case study on Tuscan Bread Protected Designation of Origin. Int. Food Agribus. Manag. Rev. 2017, 20, 533–552. [Google Scholar] [CrossRef]
- Kirwan, J.; Maye, D.; Bundhoo, D.; Keech, D.; Brunori, G. Glamur wp2-Scoping/Framing General Comparative Report on Food Chain Performance (Deliverable 2.3); Countryside and Community Research Institute, University of Gloucestershire: Gloucestershire, UK, 2014; Available online: http://glamur.eu/wp-content/uploads/2014/11/d-2.3-scoping-framing-general-comparative-report-on-food-chain-performance.pdf (accessed on 15 August 2018).
- Tranfield, D.; Denyer, D.; Smart, P. Towards a Methodology for Developing Evidence-Informed Management Knowledge by Means of Systematic Review. Br. J. Manag. 2003, 14, 207–222. [Google Scholar] [CrossRef] [Green Version]
- Webster, J.; Watson, R.T. Analyzing the Past to Prepare for the Future: Writing a Literature Review. Manag. Inf. Syst. Q. 2002, 26, 13–23. [Google Scholar]
- Cooper, H.M.; Cooper, H.M. Synthesizing Research: A Guide for Literature Reviews, 3rd ed.; Applied Social Research Methods Series; Sage Publications: Thousand Oaks, CA, USA, 1998; ISBN 9780761913474. [Google Scholar]
- Petticrew, M.; Roberts, H. Systematic Reviews in the Social Sciences: A Practical Guide; Blackwell Pub: Malden, MA, USA, 2006; ISBN 9781405121101. [Google Scholar]
- Fink, A. Conducting Research Literature Reviews: From the Internet to Paper, 4th ed.; SAGE: Thousand Oaks, CA, USA, 2014; ISBN 9781452259499. [Google Scholar]
- PRISMA. Available online: http://prisma-statement.org/ (accessed on 2 August 2018).
- Hagen-Zanker, J.; Mallett, R. How to Do a Rigorous, Evidence-Focused Literature Review in International Development: A Guidance Note; Overseas Development Institute: London, UK, 2013; pp. 1–18. [Google Scholar]
- Carolan, M.S. The Sociology of Food and Agriculture; Routledge: London, UK; New York, NY, USA, 2012; ISBN 9780415698511. [Google Scholar]
- Doucerain, M.; Fellows, L.K. Eating Right: Linking Food-Related Decision-Making Concepts from Neuroscience, Psychology, and Education: Matthias Doucerain and Lesley K. Fellows. Mind Brain Educ. 2012, 6, 206–219. [Google Scholar] [CrossRef]
- Pfau, S.; Hagens, J.; Dankbaar, B.; Smits, A. Visions of Sustainability in Bioeconomy Research. Sustainability 2014, 6, 1222–1249. [Google Scholar] [CrossRef] [Green Version]
- Saldaña, J. The Coding Manual for Qualitative Researchers, 2nd ed.; SAGE: Los Angeles, CA, USA, 2013; ISBN 9781446247365. [Google Scholar]
- Beske, P.; Land, A.; Seuring, S. Sustainable supply chain management practices and dynamic capabilities in the food industry: A critical analysis of the literature. Int. J. Prod. Econ. 2014, 152, 131–143. [Google Scholar] [CrossRef]
- European Commission—Joint Research Centre—Institute for Environment and Sustainability. International Reference Life Cycle Data System (ILCD) Handbook—General Guide for Life Cycle Assessment—Detailed Guidance, 1st ed.; EUR 24708 EN; Publications Office of the European Union: Luxembourg, 2010. [Google Scholar]
- Todorov, V.; Marinova, D. Modelling sustainability. Math. Comput. Simul. 2011, 81, 1397–1408. [Google Scholar] [CrossRef] [Green Version]
- Lozano, R. Envisioning sustainability three-dimensionally. J. Clean. Prod. 2008, 16, 1838–1846. [Google Scholar] [CrossRef]
- Schnotz, W. Commentary: Towards an Integrated View of Learning from Text and Visual Displays. Educ. Psychol. Rev. 2002, 14, 101–120. [Google Scholar] [CrossRef]
- Flint, R.W. Practice of Sustainable Community Development; Springer: New York, NY, USA, 2013; ISBN 9781461450993. [Google Scholar]
- Andersson, K.; Ohlsson, T. Life cycle assessment of bread produced on different scales. Int. J. Life Cycle Assess. 1999, 4, 25–40. [Google Scholar] [CrossRef]
- Barling, D.; Sharpe, R.; Lang, T. Traceability and ethical concerns in the UK wheat—Bread chain: From food safety to provenance to transparency. Int. J. Agric. Sustain. 2009, 7, 261–278. [Google Scholar] [CrossRef]
- Braschkat, J.; Patyk, A.; Quirin, M.; Reinhardt, G.A. Life cycle assessment of bread production—A comparison of eight different scenarios. In DIAS Report—Life Cycle Assessment in the Agri-Food Sector; Danish Intitute of Agricultural Sciences (DIAS): Bygholm, Denmark, 2004. [Google Scholar]
- Büsser, S.; Jungbluth, N. The role of flexible packaging in the life cycle of coffee and butter. Int. J. Life Cycle Assess. 2009, 14, 80–91. [Google Scholar] [CrossRef]
- Caputo, P.; Ducoli, C.; Clementi, M. Strategies and Tools for Eco-Efficient Local Food Supply Scenarios. Sustainability 2014, 6, 631–651. [Google Scholar] [CrossRef] [Green Version]
- Caritte, V.; Acha, S.; Shah, N. Enhancing Corporate Environmental Performance Through Reporting and Roadmaps: Enhancing Corporate Environmental Performance. Bus. Strategy Environ. 2015, 24, 289–308. [Google Scholar] [CrossRef]
- Carlsson-Kanyama, A. Climate change and dietary choices—How can emissions of greenhouse gases from food consumption be reduced? Food Policy 1998, 23, 277–293. [Google Scholar] [CrossRef]
- De Magistris, T.; Gracia, A. Co-operation and economic relationship as determinants for competitiveness in the food sector: The Spanish wheat to bread chain. In Proceedings of the Annals of the 12th Congress of the European Association of Agricultural Economists, Ghent, Belgium, 26–29 August 2008. [Google Scholar]
- Erol, I.; Sencer, S.; Sari, R. A new fuzzy multi-criteria framework for measuring sustainability performance of a supply chain. Ecol. Econ. 2011, 70, 1088–1100. [Google Scholar] [CrossRef]
- Espinoza-Orias, N.; Stichnothe, H.; Azapagic, A. The carbon footprint of bread. Int. J. Life Cycle Assess. 2011, 16, 351–365. [Google Scholar] [CrossRef]
- Fiscus, D.A. Comparative network analysis toward characterization of systemic organization for human–environmental sustainability. Ecol. Model. 2009, 220, 3123–3132. [Google Scholar] [CrossRef]
- Garnett, T. Where are the best opportunities for reducing greenhouse gas emissions in the food system (including the food chain)? Food Policy 2011, 36, S23–S32. [Google Scholar] [CrossRef]
- Gerbens-Leenes, P.; Moll, H.; Schoot Uiterkamp, A.J. Design and development of a measuring method for environmental sustainability in food production systems. Ecol. Econ. 2003, 46, 231–248. [Google Scholar] [CrossRef]
- Gronroos, J.; Seppala, J.; Voutilainen, P.; Seuri, P.; Koikkalainen, K. Energy use in conventional and organic milk and rye bread production in Finland. Agric. Ecosyst. Environ. 2006, 117, 109–118. [Google Scholar] [CrossRef]
- Heller, M.C.; Keoleian, G.A.; Willett, W.C. Toward a Life Cycle-Based, Diet-level Framework for Food Environmental Impact and Nutritional Quality Assessment: A Critical Review. Environ. Sci. Technol. 2013, 47, 12632–12647. [Google Scholar] [CrossRef] [PubMed]
- Liedtke, C.; Baedeker, C.; Kolberg, S.; Lettenmeier, M. Resource intensity in global food chains: The Hot Spot Analysis. Br. Food J. 2010, 112, 1138–1159. [Google Scholar] [CrossRef]
- Nielsen, T.; Kristensen, N.H. Ethical traceability in the bacon supply chain. In Ethical Traceability and Communicating Food; The International Library of Environmental, Agricultural and Food Ethics; Springer: Dordrecht, The Netherlands, 2008; pp. 83–123. ISBN 9781402085239. [Google Scholar]
- Pelupessy, W.; Díaz, R. Upgrading of Lowland coffee in Central America. Agribusiness 2008, 24, 119–140. [Google Scholar] [CrossRef]
- Penker, M. Mapping and measuring the ecological embeddedness of food supply chains. Geoforum 2006, 37, 368–379. [Google Scholar] [CrossRef]
- Pretty, J.; Smith, G.; Goulding, K.W.T.; Groves, S.J.; Henderson, I.; Hine, R.E.; King, V.; van Oostrum, J.; Pendlington, D.J.; Vis, J.K.; et al. Multi-year assessment of Unilever’s progress towards agricultural sustainability I: Indicators, methodology and pilot farm results. Int. J. Agric. Sustain. 2008, 6, 37–62. [Google Scholar] [CrossRef]
- Pretty, J.; Smith, G.; Goulding, K.W.T.; Groves, S.J.; Henderson, I.; Hine, R.E.; King, V.; van Oostrum, J.; Pendlington, D.J.; Vis, J.K.; et al. Multi-year assessment of Unilever’s progress towards agricultural sustainability II: Outcomes for peas (UK), spinach (Germany, Italy), tomatoes (Australia, Brazil, Greece, USA), tea (Kenya, Tanzania, India) and oil palm (Ghana). Int. J. Agric. Sustain. 2008, 6, 63–88. [Google Scholar] [CrossRef]
- Qiang, W.; Liu, A.; Cheng, S.; Kastner, T.; Xie, G. Agricultural trade and virtual land use: The case of China’s crop trade. Land Use Policy 2013, 33, 141–150. [Google Scholar] [CrossRef]
- Rugani, B.; Vázquez-Rowe, I.; Benedetto, G.; Benetto, E. A comprehensive review of carbon footprint analysis as an extended environmental indicator in the wine sector. J. Clean. Prod. 2013, 54, 61–77. [Google Scholar] [CrossRef]
- Sharpe, R.; Barling, D.; Lang, T. Ethical traceability in the UK wheat-flour-bread chain. In Ethical Traceability and Communicating Food; Springer: Dordrecht, The Netherlands, 2008; pp. 124–165. ISBN 978-1-4020-8524-6. [Google Scholar]
- Sundkvist, Å.; Jansson, A.; Larsson, P. Strengths and limitations of localizing food production as a sustainability-building strategy—An analysis of bread production on the island of Gotland, Sweden. Ecol. Econ. 2001, 37, 217–227. [Google Scholar] [CrossRef]
- Vasileiou, K.; Morris, J. The sustainability of the supply chain for fresh potatoes in Britain. Supply Chain Manag. Int. J. 2006, 11, 317–327. [Google Scholar] [CrossRef]
- Vassiliou, A.; Kabourakis, E.; Papadopoulos, D. Traceability and Ethical Traceability in the Greek Olive Oil Chain. In Ethical Traceability and Communicating Food; Springer: Dordrecht, The Netherlands, 2008; pp. 166–191. ISBN 978-1-4020-8524-6. [Google Scholar]
- Vieux, F.; Soler, L.-G.; Touazi, D.; Darmon, N. High nutritional quality is not associated with low greenhouse gas emissions in self-selected diets of French adults. Am. J. Clin. Nutr. 2013, 97, 569–583. [Google Scholar] [CrossRef] [PubMed] [Green Version]
- Antonelli, M.; Greco, F. The Water We Eat: Combining Virtual Water and Water Footprints; Springer: Cham, Switzerland, 2015; ISBN 9783319163932. [Google Scholar]
- Schönberger, H.; Galvez Martos, J.L.; Styles, D. Best Environmental Management Practice in the Retail Trade Sector: Learning from Frontrunners; European Commission—Joint Research Centre—Institute for Prospective Technological Studies; Publication Office of the European Union: Luxembourg, 2013; ISBN 9789279304958. [Google Scholar]
- Shewry, P.R. Wheat. J. Exp. Bot. 2009, 60, 1537–1553. [Google Scholar] [CrossRef] [PubMed] [Green Version]
- Galli, F.; Bartolini, F.; Brunori, G. Handling Diversity of Visions and Priorities in Food Chain Sustainability Assessment. Sustainability 2016, 8, 305. [Google Scholar] [CrossRef]
- Ethical Traceability and Communicating Food; The International Library of Environmental, Agricultural and Food Ethics; Coff, C.; Barling, D.; Korthals, M.; Nielsen, T. (Eds.) Springer: Dordrecht, The Netherlands, 2008; Volume 15, ISBN 9781402085239. [Google Scholar]
- 4th International Conference: Life Cycle Assessment in the Agri-Food Sector. Available online: http://www.lcafood.dk/lca_conf/ (accessed on 15 August 2018).
- Search Results—AgEcon Search. Available online: http://ageconsearch.umn.edu/search?ln=en&cc=725 (accessed on 15 August 2018).
Figure 1.
Indicator counts per critical issue. Source: authors’ own elaboration.

Figure 2.
Venn diagram of sustainability dimensions per paper. Circle intersections show the relative distribution of single and multidimensional assessments within the retrieved literature; circle areas are proportional to indicator counts per single and multiple dimensions. Source: authors’ own elaboration.

Figure 3.
Venn diagram of indicators. Circle areas and intersections are proportional to indicator counts per single and multiple dimensions. b: biodiversity; n: nutrition; information and communication; r: resource use and pollution; v: value added creation and distribution. See Table A1 for the complete coding. Source: authors’ own elaboration.

Table 1.
List of key informants. Source: authors’ own elaboration based on [49].
Table 1.
List of key informants. Source: authors’ own elaboration based on [49].
| Key Informant | Firm/Organization | Relevance of the Interview |
|---|---|---|
| Quality and safety manger | Enterprise (processing and marketing) | Global chain |
| Health, safety, environment and energy manager | Enterprise (processing and marketing) | Global chain |
| Agronomist | Farmers’ cooperative | Local chain—GI |
| Associate | Bakery | Local chain—GI |
| Sole director | Mill | Local chain—GI |
| Director | Consortium for the promotion of bread geographical indication | Local chain—GI |
| Owner and manager | Farm, mill, bakery, direct sale | Local chain—vertically integrated |
| Professor | University | Crop genetics |
| Professor | University | Food science and technology |
| Bakery consultant | Self-employed | Baking |
| Quality manager | National retailer company | Food quality, food safety, retailing |
| Quality manager | Industrial bakery | Baking, bread distribution, relationships with retailers |
GI: geographical indication.
Table 2.
Identified patterns and relative definitions for geographical proximity and system boundary. Source: authors’ own elaboration.
Table 2.
Identified patterns and relative definitions for geographical proximity and system boundary. Source: authors’ own elaboration.
| Pattern | Definition |
|---|---|
| Geographical Proximity | |
| Global | Locations in multiple countries |
| or | |
| Assessment of the performance of an organization based on farm-level indicators measured in multiple countries | |
| or | |
| The assessment is intended for generalization | |
| National | Locations within the jurisdiction of a country |
| or | |
| Data refer to a country | |
| Subnational | Locations within a subregion of a country; the boundaries of the subregion may or may not correspond to a local jurisdiction |
| Farm | Farm-level assessment |
| System Boundary | |
| Cradle-to-grave | Agricultural production (included input production) to final consumption or end-of-life disposal |
| Cradle-to-retail | Agricultural production (included input production), product distribution, and sale |
| Gate-to-gate | A single step of the supply chain |
Table 3.
Overview of the retrieved papers. Source: Authors’ own elaboration.
| Ref. | Attributes | Patterns | ||||
|---|---|---|---|---|---|---|
| Aim | Sustainability Dimensions | Country Code | Research Method | Geographical Proximity | System Boundary | |
| [70] | Environmental impacts and hotspots at different production scales | Environ | SE | LCA | National, local | Cradle-to-grave |
| [71] b | Traceability systems for the supply chain and associated ethical concerns | Society | UK | Interview analysis | National | Cradle-to-retail |
| [72] | Least polluting production processes and process hotspots | Environ | DE | LCA | National | Cradle-to-retail |
| [73] | Environmental impacts of packaging and consumption | Environ | BR, EU | LCA | Global, national | Cradle-to-grave |
| [74] | Impact reduction of catered meals by promoting food self-sufficiency at the district level | Environ | IT | Food chain model | Local | Cradle-to-grave |
| [75] | Environmental performance indicators in corporate social responsibility reporting of food retailers | Environ | UK | Backcasting, Literature review, Interview analysis | National | Gate-to-gate |
| [76] | Environmental impacts of diets differing for food origin | Environ | SE | LCA | National | Cradle-to-retail |
| [77] | Effects of stability and duration of relationships among supply chain stakeholders on producers’ competitiveness | Society | ES | Structural equation model | National | Gate-to-gate |
| [78] | Evaluation framework for supply chain sustainability at the grocery retailer level | Environ, Economy, Society | - | Fuzzy multi-attribute utility model | Global, local | Cradle-to-retail |
| [79] | Trade-offs between two carbon footprint frameworks | Environ | UK | Carbon footprint | National | Cradle-to-grave |
| [80] | Sustainability of nutrient networks in human and non-human food chains | Environ | USA | Ecological network analysis | National | Cradle-to-grave |
| [81] | Impacts and hotspots of the supply chains of various foods | Environ | - | Literature review | - | Cradle-to-grave |
| [82] | Evaluation tool of the environmental performance of food production systems | Environ | - | Water, energy, land demand | Global, local | Gate-to-gate |
| [83] | Environmental pressures of different food production systems | Environ | FI | Life cycle inventory | National | Cradle-to-retail |
| [84] | Methodological approaches to agri-food LCAs at different levels | Environ | EU, USA, IT, NZ | Literature review | National, local | Cradle-to-grave |
| [15] | Potential for supply chain relocalization | Economy, Society | USA | Survey analysis | Local | Gate-to-gate |
| [85] | Priority intervention areas in the agribusiness | Environ | DE, Central America | Hot spot analysis | Global, national | Cradle-to-retail |
| [86] a | Supply chain evolution, associated ethical concerns and traceability | Society | DK | Interview analysis | National | Cradle-to-retail |
| [87] | Demand dynamics and environmental impacts of food production and trade | Environ, Economy | Central America | Literature review | National | Gate-to-gate |
| [88] | Assessment and mapping of chain’s ecological embeddedness | Environ, Economy | AT | Interview analysis | National | Cradle-to-retail |
| [89] c | Implementation of sustainability rules at the organizational level: on-farm indicator monitoring | Environ, Economy, Society | UK, DE, IT, BR, AU, USA, KE, IN, TZ, MY, GH | Literature review | Farm | Gate-to-gate |
| [90] c | Implementation of sustainability rules at the organizational level: on-farm indicator reporting | Environ, Economy, Society | UK, DE, IT, BR, AU, USA, KE, IN, TZ, MY, GH | Literature review | Farm | Gate-to-gate |
| [91] | Land resources involved in the trade of commodities | Environ | CN | Virtual land use | National | Gate-to-gate |
| [92] | Advantages and constraints of assessing sustainability via the carbon footprint | Environ | World | Literature review | Global | Cradle-to-grave |
| [93] a,b | Supply chain evolution, associated ethical concerns and traceability | Society | UK | Interview analysis | National | Cradle-to-retail |
| [94] | Strengths and limitations food chain localization as a sustainability strategy | Environ, Economy | SE | Energy demand, Greenhouse gas emissions | Local | Gate-to-gate |
| [95] | Stakeholders’ perceptions of environmental, economic, and social sustainability on-farm | Environ, Economy, Society | UK | Conjoint analysis (survey) | National | Gate-to-gate |
| [96] a | Supply chain evolution, associated ethical concerns and traceability | Society | GR | Interview analysis | National | Cradle-to-retail |
| [97] | Environmental impacts and nutritional quality of diets | Society | FR | Greenhouse gas emissions | National | Gate-to-gate |
a Chapters of the same book. b Papers that share co-authors. c Papers that present different parts of the same research and do not describe the adopted indicators with detail.
Table 4.
Overview of the five sustainability indicators highlighted via the application of the Venn diagram model. Source: authors’ own elaboration.
Table 4.
Overview of the five sustainability indicators highlighted via the application of the Venn diagram model. Source: authors’ own elaboration.
| Indicator | Sustainability Dimensions | Definition | Unit | Indicator Selection | Data | Ref. |
|---|---|---|---|---|---|---|
| Breeding effectiveness | Environ + Economy + Society | Increase in crop yields between before and after introduction of new breed | % | Literature | Scientific literature | [81] |
| Number of new breeds delivered per year | #/year | |||||
| Product/process certifications | Environ + Economy + Society | Returns from providing the product with a certification | Monetary value/unit product | Literature | Scientific and grey literature | [87] |
| If the product has any certification | Sustainability labeling [yes/no] | |||||
| Water use intensity/savings | Environ | Water intensity per and between life cycle phases | Qualitative scoring system | Literature | Scientific literature | [85] |
| Environ + Economy | The extent to which water needed for cropping drives business choices | Likert scale | Literature, Stakeholders | Primary | [95] | |
| The extent to which concerns about water quality drive business choices | Likert scale | |||||
| Environ | Volume of water consumed over product life cycle per functional unit | L/kg bread | Previous research by authors, Stakeholders | Primary | [70] | |
| Environ | Volume of water consumed | m3 | Literature | Corporate sustainability reports, Sustainability reporting initiatives | [75] | |
| Volume of water consumed per site | m3/site | |||||
| Volume of water consumed per unit surface | m3/ft2 | |||||
| Volume of harvested water | m3 | |||||
| Environ + Economy + Society | Volume of water required for inputs to the production of a certain foodstuff per year | m3/kgoutput ·year | Literature | Scientific literature | [82] | |
| Volume of water required by the company for producing a certain foodstuff per year | m3/year | |||||
| Volume of water required per output (a foodstuff) produced per year | m3/year | |||||
| Environ +Society | A measure of water use normalized for annual food intake | [not specified] | Literature | Scientific literature | [84] | |
| A measure of water use normalized for caloric food energy | [not specified] | |||||
| Environ | Annual water consumption | m3/(m2·year) | Literature | Retailer company reports | [78] | |
| Waste generation/reduction | Environ + Economy + Society | Weight of waste generated | t | Literature | Corporate sustainability reports, Sustainability reporting initiatives | [75] |
| Weight of waste generated per store | t/store | |||||
| Number of carrier bags consumed | million | |||||
| Weight of non-glass packaging used per functional unit | g/functional unit | |||||
| Weight of packaging used for home delivery per functional unit | g/functional unit | |||||
| Weight of primary material in packaging | t | |||||
| Weight of secondary or tertiary material in packaging | t | |||||
| Amount of paper consumed | # reams | |||||
| Weight of waste disposed to landfill | t | |||||
| Weight of waste disposed to landfill per store | t | |||||
| Waste minimization (recycling rates) | kg/m2·year | |||||
| Cardboard processed | [not specified] | |||||
| Number of carrier bag after reduction measure | million | |||||
| Share of construction waste recycled | % | |||||
| Weight of cooking oil collected to be used for biofuels | t | |||||
| Weight of food waste diverted to energy | t | |||||
| Share of food waste sent to anaerobic digestion | % | |||||
| Weight of waste diverted per store | t/store | |||||
| Share of waste diverted from landfill | % | |||||
| Weight of waste diverted to biomass-to-energy plants | t | |||||
| Weight of waste reused or recycled | t | |||||
| Share of waste reused or recycled | % | |||||
| Business uncertainty | Environ + Economy + Society | The extent to which the business secures adequate financial returns through cost and risk reduction | Likert scale | Literature, Stakeholders | Scientific literature, Primary | [71] |
© 2018 by the authors. Licensee MDPI, Basel, Switzerland. This article is an open access article distributed under the terms and conditions of the Creative Commons Attribution (CC BY) license (http://creativecommons.org/licenses/by/4.0/).
Share and Cite
MDPI and ACS Style
Gava, O.; Galli, F.; Bartolini, F.; Brunori, G. Linking Sustainability with Geographical Proximity in Food Supply Chains. An Indicator Selection Framework. Agriculture 2018, 8, 130. https://doi.org/10.3390/agriculture8090130
AMA Style
Gava O, Galli F, Bartolini F, Brunori G. Linking Sustainability with Geographical Proximity in Food Supply Chains. An Indicator Selection Framework. Agriculture. 2018; 8(9):130. https://doi.org/10.3390/agriculture8090130
Chicago/Turabian StyleGava, Oriana, Francesca Galli, Fabio Bartolini, and Gianluca Brunori. 2018. "Linking Sustainability with Geographical Proximity in Food Supply Chains. An Indicator Selection Framework" Agriculture 8, no. 9: 130. https://doi.org/10.3390/agriculture8090130
Note that from the first issue of 2016, this journal uses article numbers instead of page numbers. See further details here.