
Pine Woodchip Biochar Impact on Soil Nutrient Concentrations and Corn Yield in a Silt Loam in the Mid-Southern U.S.

Abstract
:1. Introduction
2. Results
2.1. Initial Biochar and Soil Properties

| Biochar Property | Mean (± SE) |
|---|---|
| pH a | 8.7 (0.03) |
| EC (dS·m−1) a | 5.3 (0.2) |
| Total C (mg·g−1) | 244.5 (21) |
| Total N (mg·g−1) | 0.7 (0.2) |
| C:N ratio | 366:1 (64) |
| Potassium (mg·g−1) | 2.1 (0.1) |
| Calcium (mg·g−1) | 10.1 (0.5) |
| Magnesium (mg·g−1) | 2.7 (0.2) |
| Phosphorus (μg·g−1) | 770.5 (17) |
| Sulfur (μg·g−1) | 128.5 (1.5) |
| Sodium (μg·g−1) | 321.5 (13) |
| Iron (μg·g−1) | 868.0 (57) |
| Manganese (μg·g−1) | 420.5 (30) |
| Copper (μg·g−1) | 6.5 (0.04) |
| Boron (μg·g−1) | 10.4 (0.7) |
| Zinc (μg·g−1) b | 0.01 (0) |
| Soil Property | Mean (± SE) |
|---|---|
| Particle-size distribution (g·g−1) | |
| Sand | 0.3 (0.3) |
| Silt | 0.6 (0.3) |
| Clay | 0.1 (0.2) |
| pH a | 6.4 (0.03) |
| Electrical conductivity (dS·m−1) a | 0.2 (0.1) |
| Organic matter (mg·g−1) | 27.1 (0.4) |
| Dissolved organic carbon (C) (μg·g−1) | 33.8 (1.2) |
| Microbial biomass C (μg·g−1) | 46.1 (2.3) |
| Microbial biomass nitrogen (N) (μg·g−1) | 8.8 (0.3) |
| Microbial biomass C:N ratio | 5.3:1 (0.2) |
| Dissolved total N (μg·g−1) | 9.2 (0.2) |
| Nitrate-N (μg·g−1) | 7.6 (0.2) |
| Ammonium-N (μg g−1) | 0.02 (0.02) |
| Inorganic N (μg·g−1) | 7.6 (0.2) |
| Dissolved organic N (μg·g−1) | 1.6 (0.1) |
| Acid phosphatase activities (μg·g−1·h−1) | 271.9 (14) |
| Alkaline phosphatase activities (μg·g−1·h−1) | 102.8 (7.2) |
| Water soluble phosphorus (μg·g−1) | 5.3 (0.3) |
| Mehlich-3 extractable phosphorus (μg·g−1) | 31.7 (1.1) |
| Mehlich-3 extractable potassium (μg·g−1) | 104.4 (4.7) |
| Mehlich-3 extractable calcium (μg·g−1) | 923.4 (13) |
| Mehlich-3 extractable magnesium (μg·g−1) | 46.4 (0.8) |
| Mehlich-3 extractable sulfur (μg·g−1) | 5.5 (0.2) |
| Mehlich-3 extractable iron (μg·g−1) | 51.1 (1.7) |
| Mehlich-3 extractable manganese (μg·g−1) | 161.7 (3.7) |
| Mehlich-3 extractable copper (μg·g−1) | 1.9 (0.1) |
2.2. Post-Harvest Soil Characteristics
| Soil Variable | p-Value | ||
|---|---|---|---|
| Fertilizer | Biochar | Fert × BC | |
| Soil moisture | 0.754 | 0.065 | 0.335 |
| pH | 0.248 | 0.105 | 0.417 |
| Electrical conductivity | 0.639 | 0.308 | 0.865 |
| Soil organic matter | 0.587 | 0.104 | 0.671 |
| Dissolved organic carbon (C) | 0.041 * | 0.356 | 0.241 |
| Dissolved total nitrogen (N) | 0.093 | 0.022 * | 0.727 |
| Microbial biomass C | 0.257 | 0.778 | 0.435 |
| Microbial biomass N | 0.255 | 0.768 | 0.477 |
| Microbial biomass C:N | 0.385 | 0.577 | 0.419 |
| Nitrate-N | 0.031 * | 0.044 * | 0.570 |
| Ammonium-N | 1.000 | 1.000 | 1.000 |
| Inorganic N | 0.031 * | 0.044 * | 0.570 |
| Dissolved organic N | 0.002 * | 0.644 | 0.203 |
| Acid phosphatase activities | 0.513 | 0.603 | 0.882 |
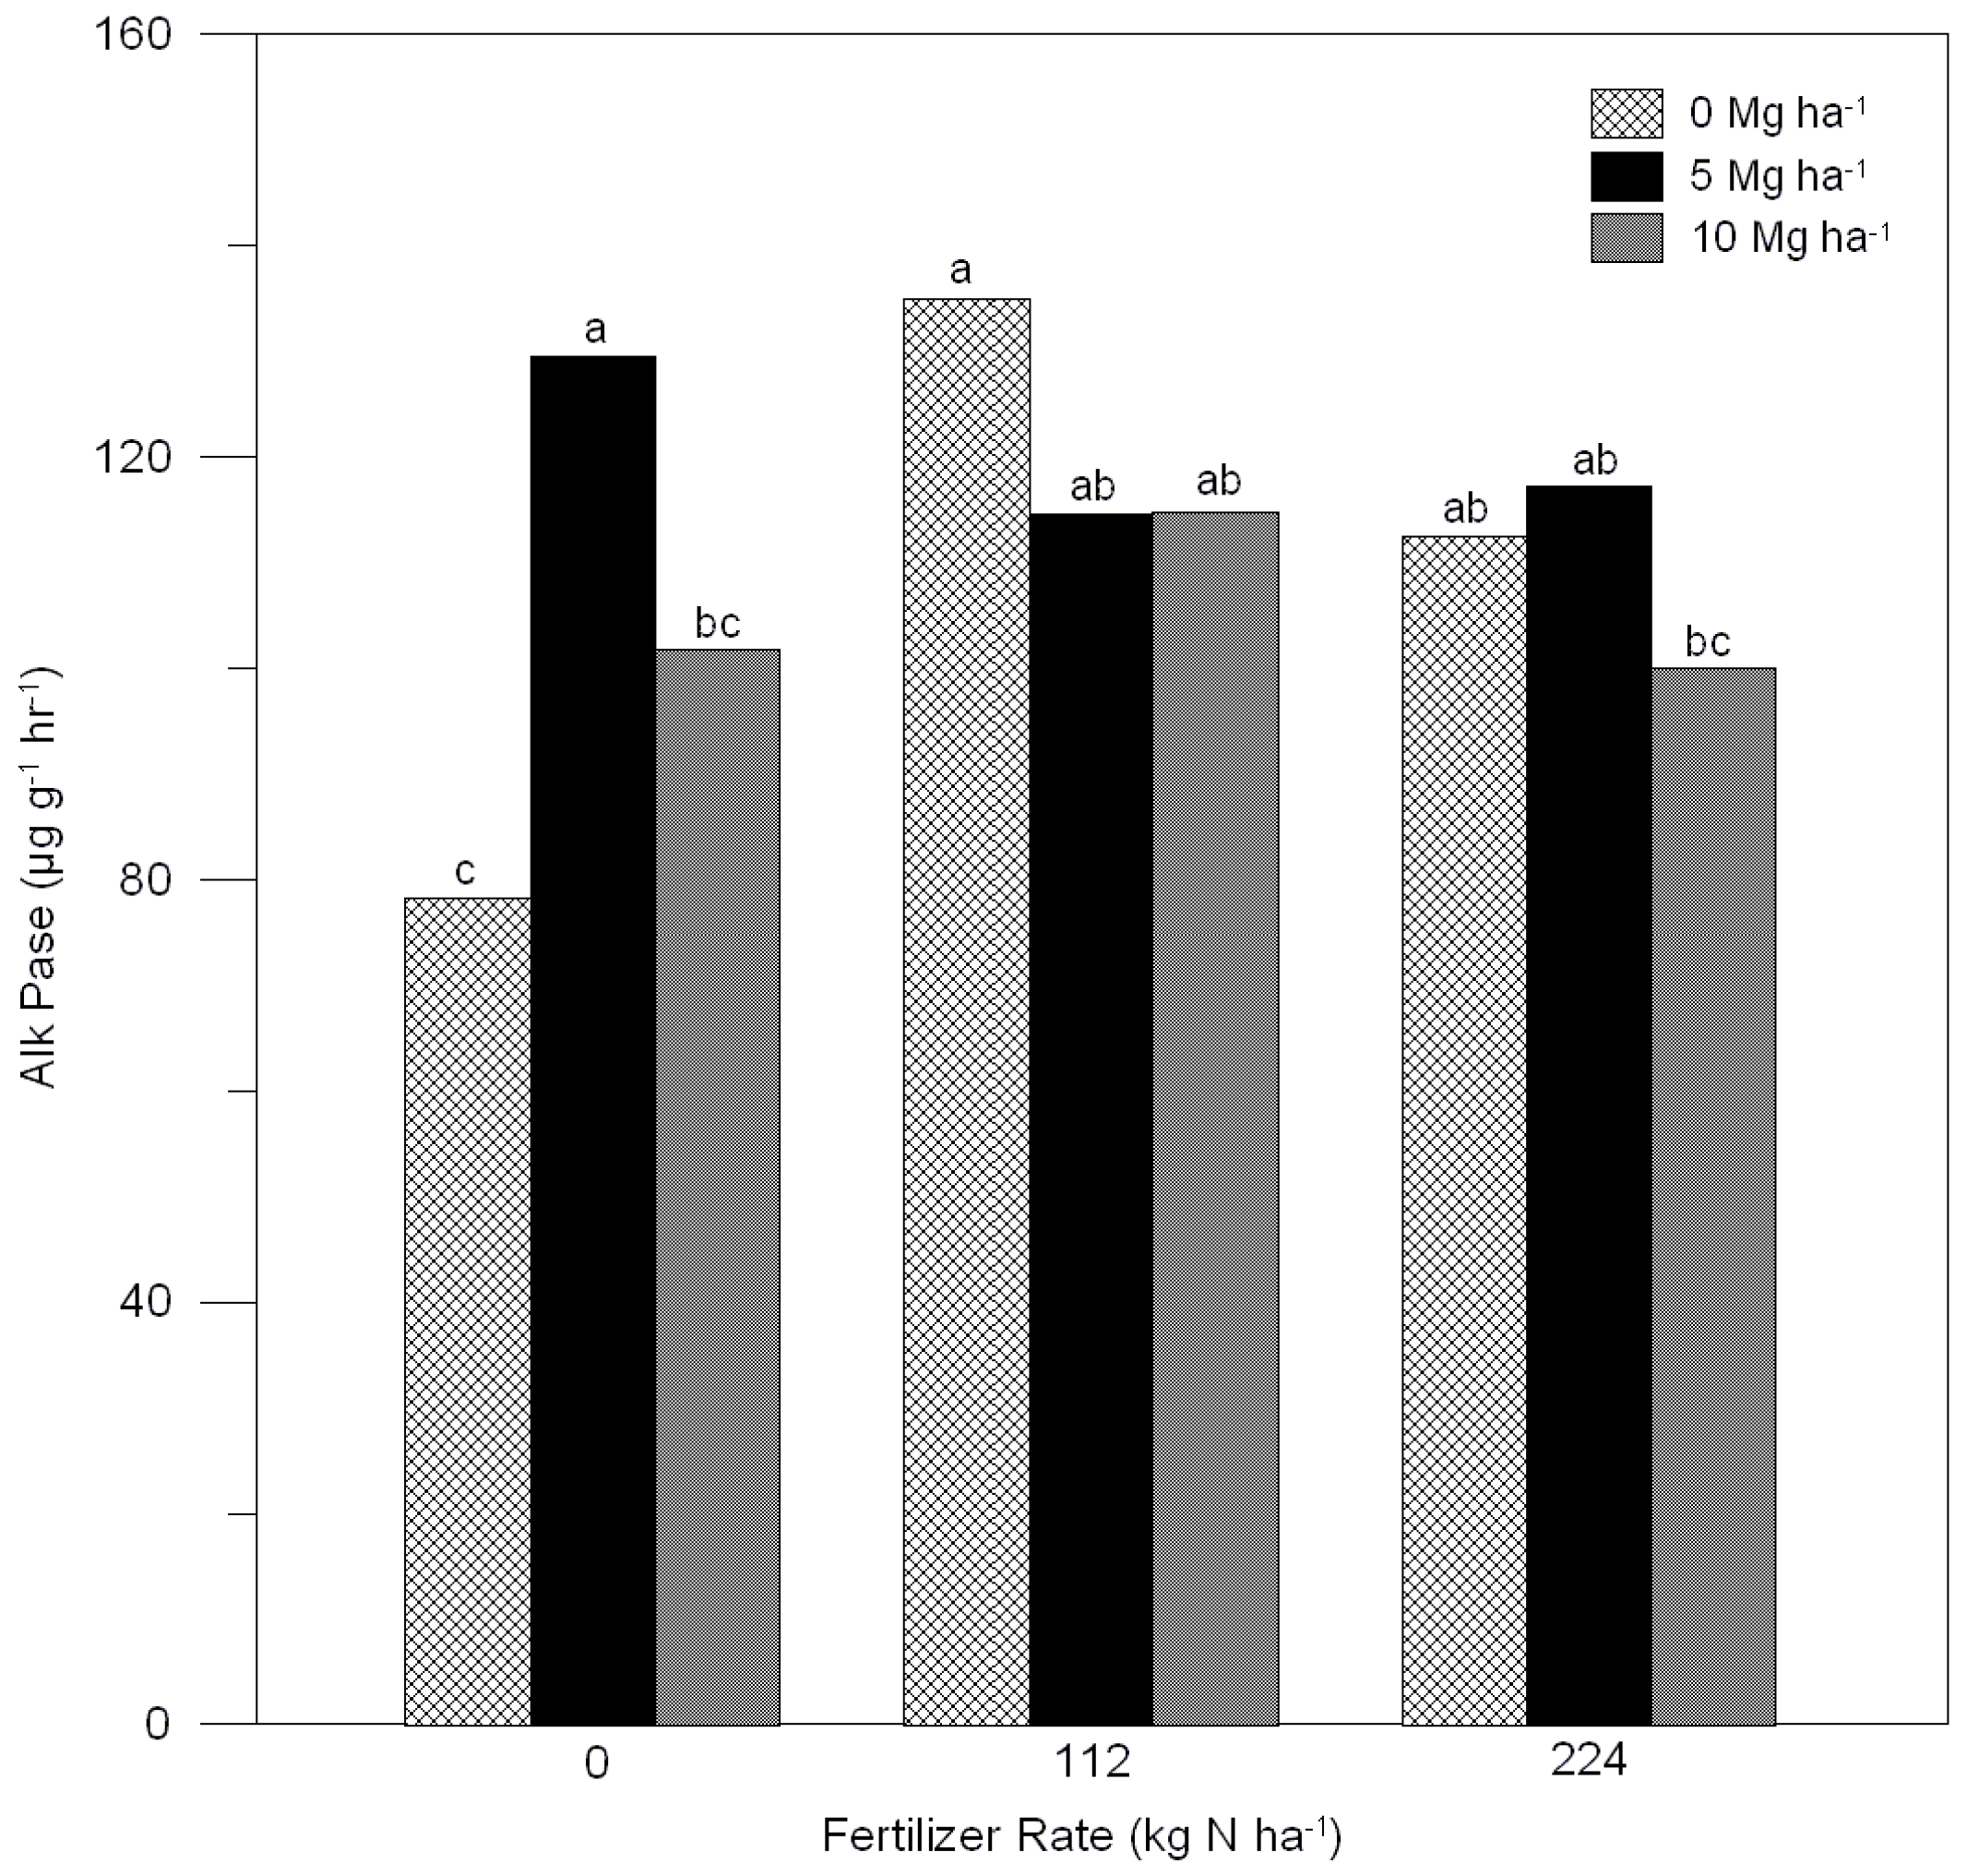
| Alkaline phosphatase activities | 0.143 | 0.235 | 0.046 * |
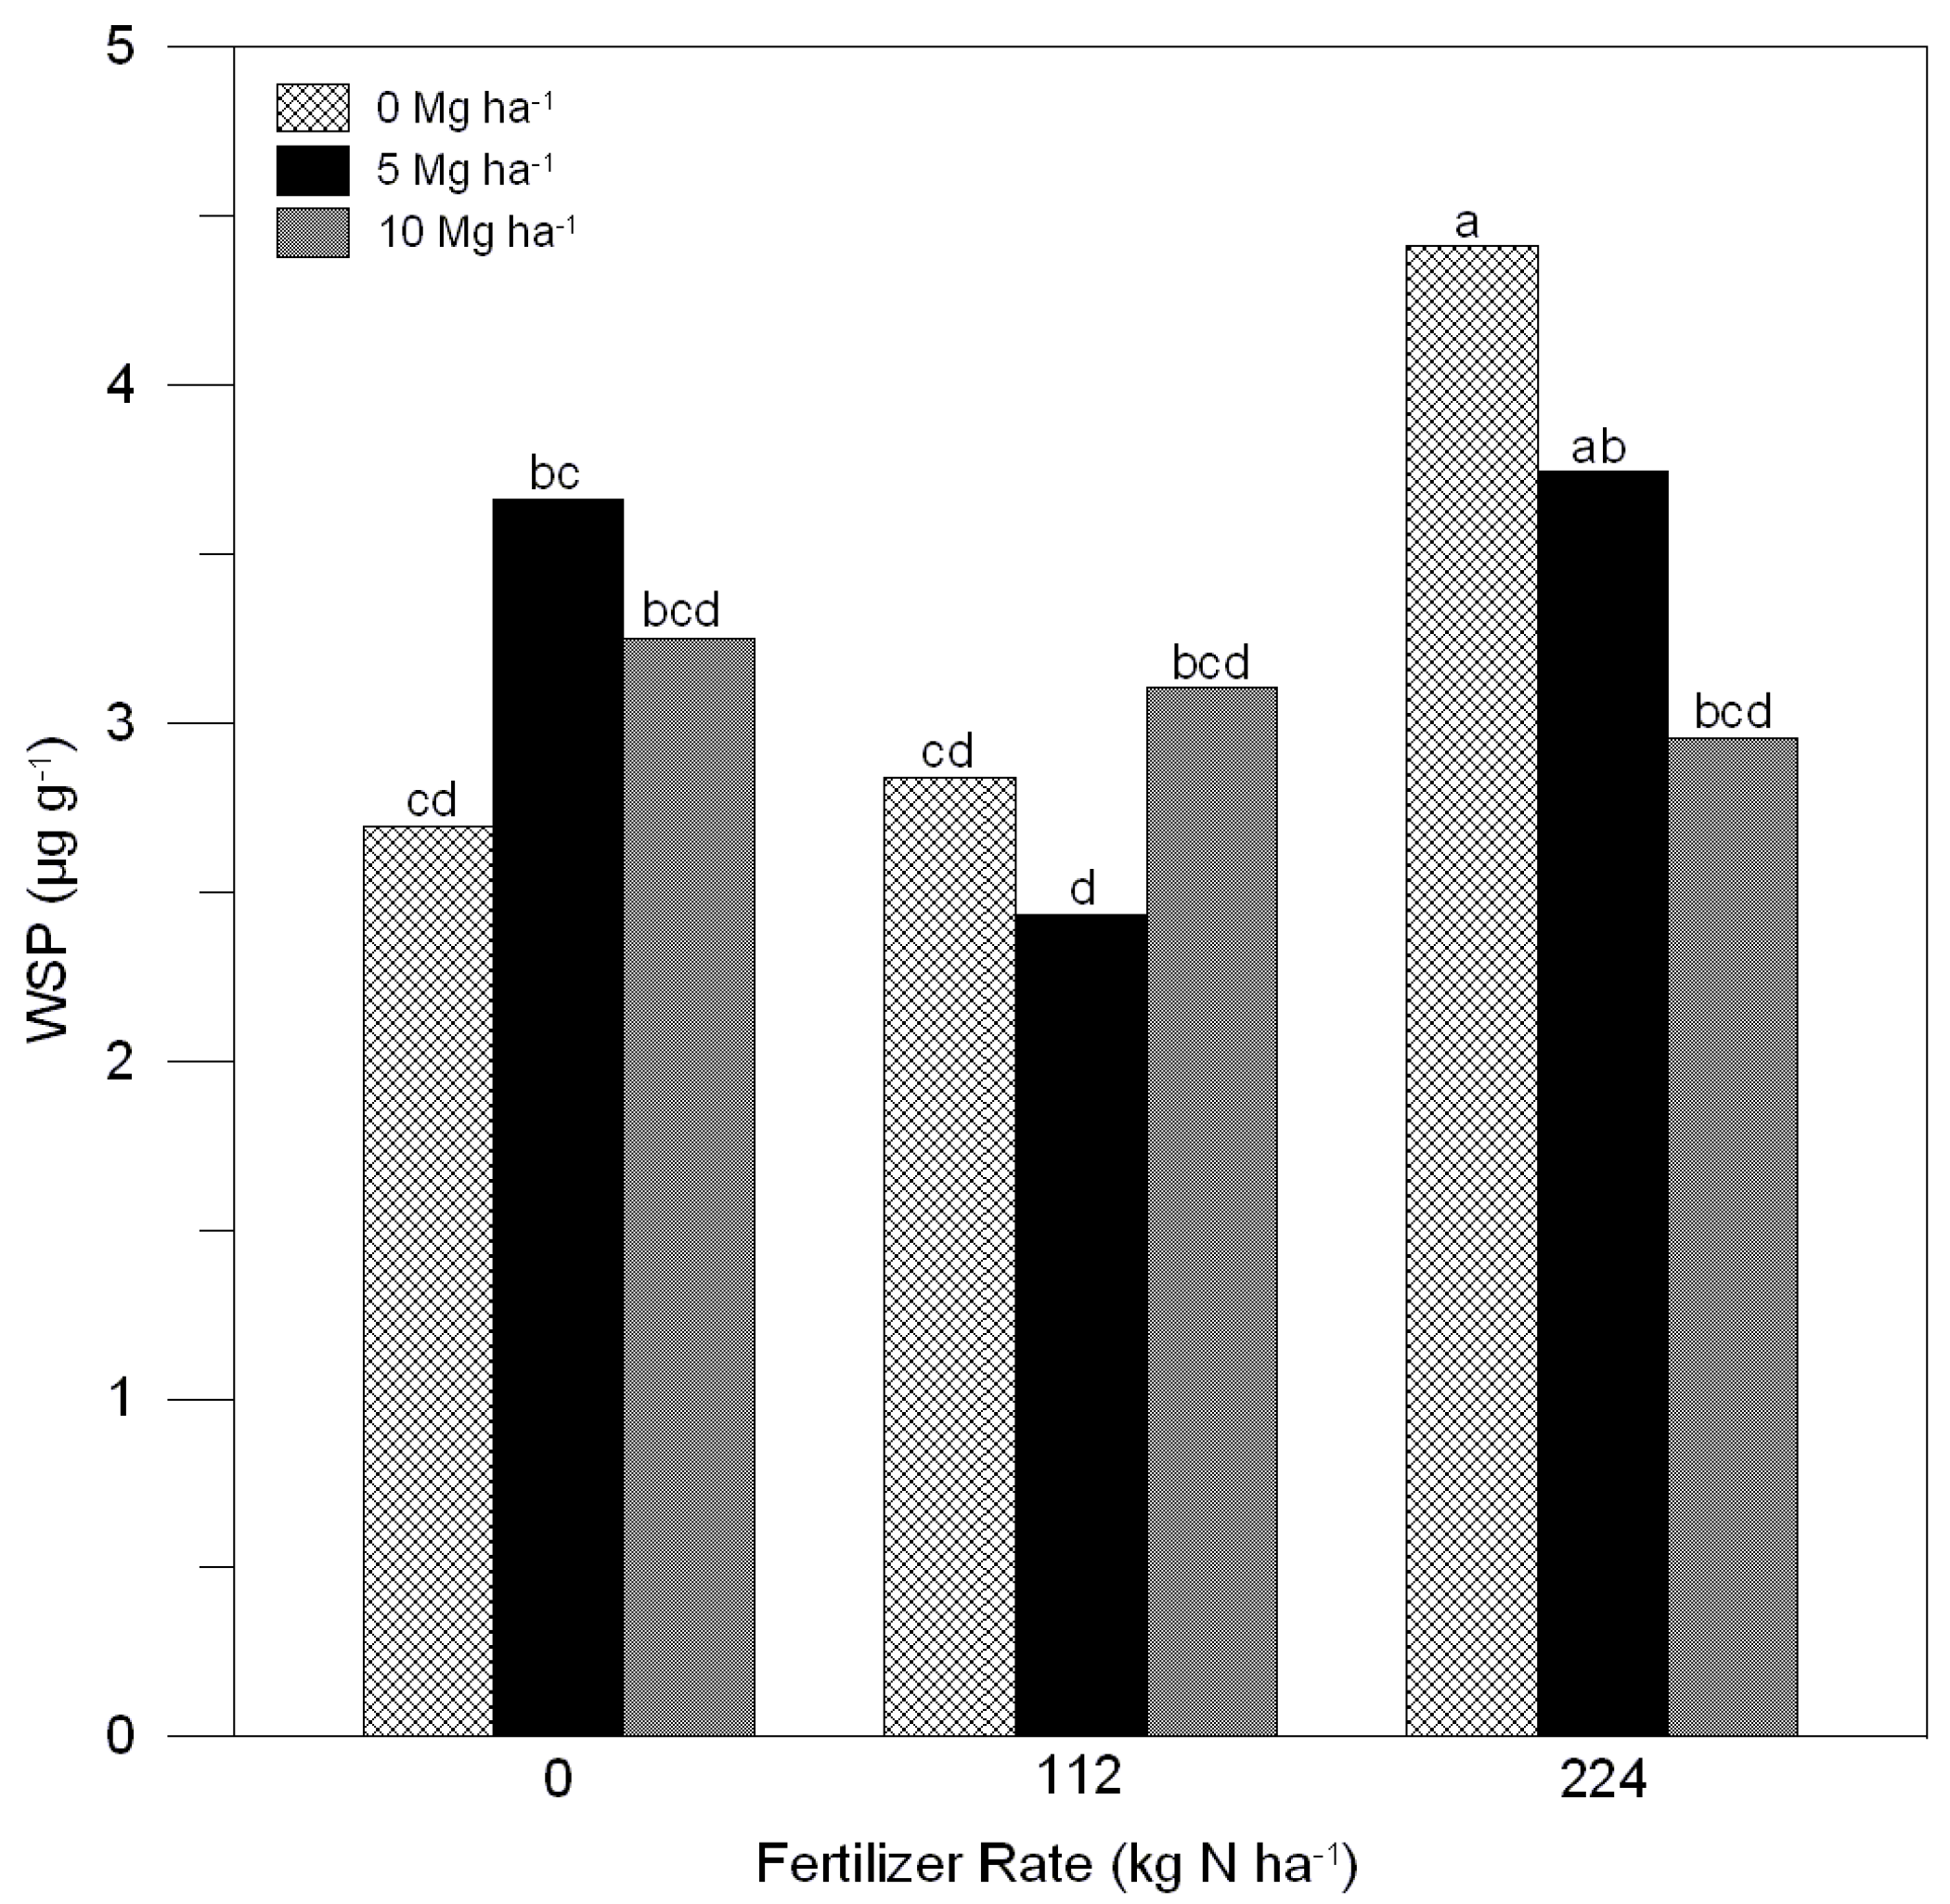
| Water soluble phosphorus | 0.015 * | 0.767 | 0.045 * |
| Mehlich-3 extractable phosphorus | 0.103 | 0.403 | 0.661 |
| Mehlich-3 extractable potassium | 0.708 | 0.697 | 0.785 |
| Mehlich-3 extractable calcium | 0.094 | 0.146 | 0.064 |
| Mehlich-3 extractable magnesium | 0.641 | 0.580 | 0.903 |
| Mehlich-3 extractable sulfur | 0.582 | 0.008 * | 0.519 |
| Mehlich-3 extractable iron | 0.035 * | 0.453 | 0.520 |
| Mehlich-3 extractable manganese | 0.150 | 0.045 * | 0.105 |
| Mehlich-3 extractable copper | 0.952 | 0.226 | 0.942 |
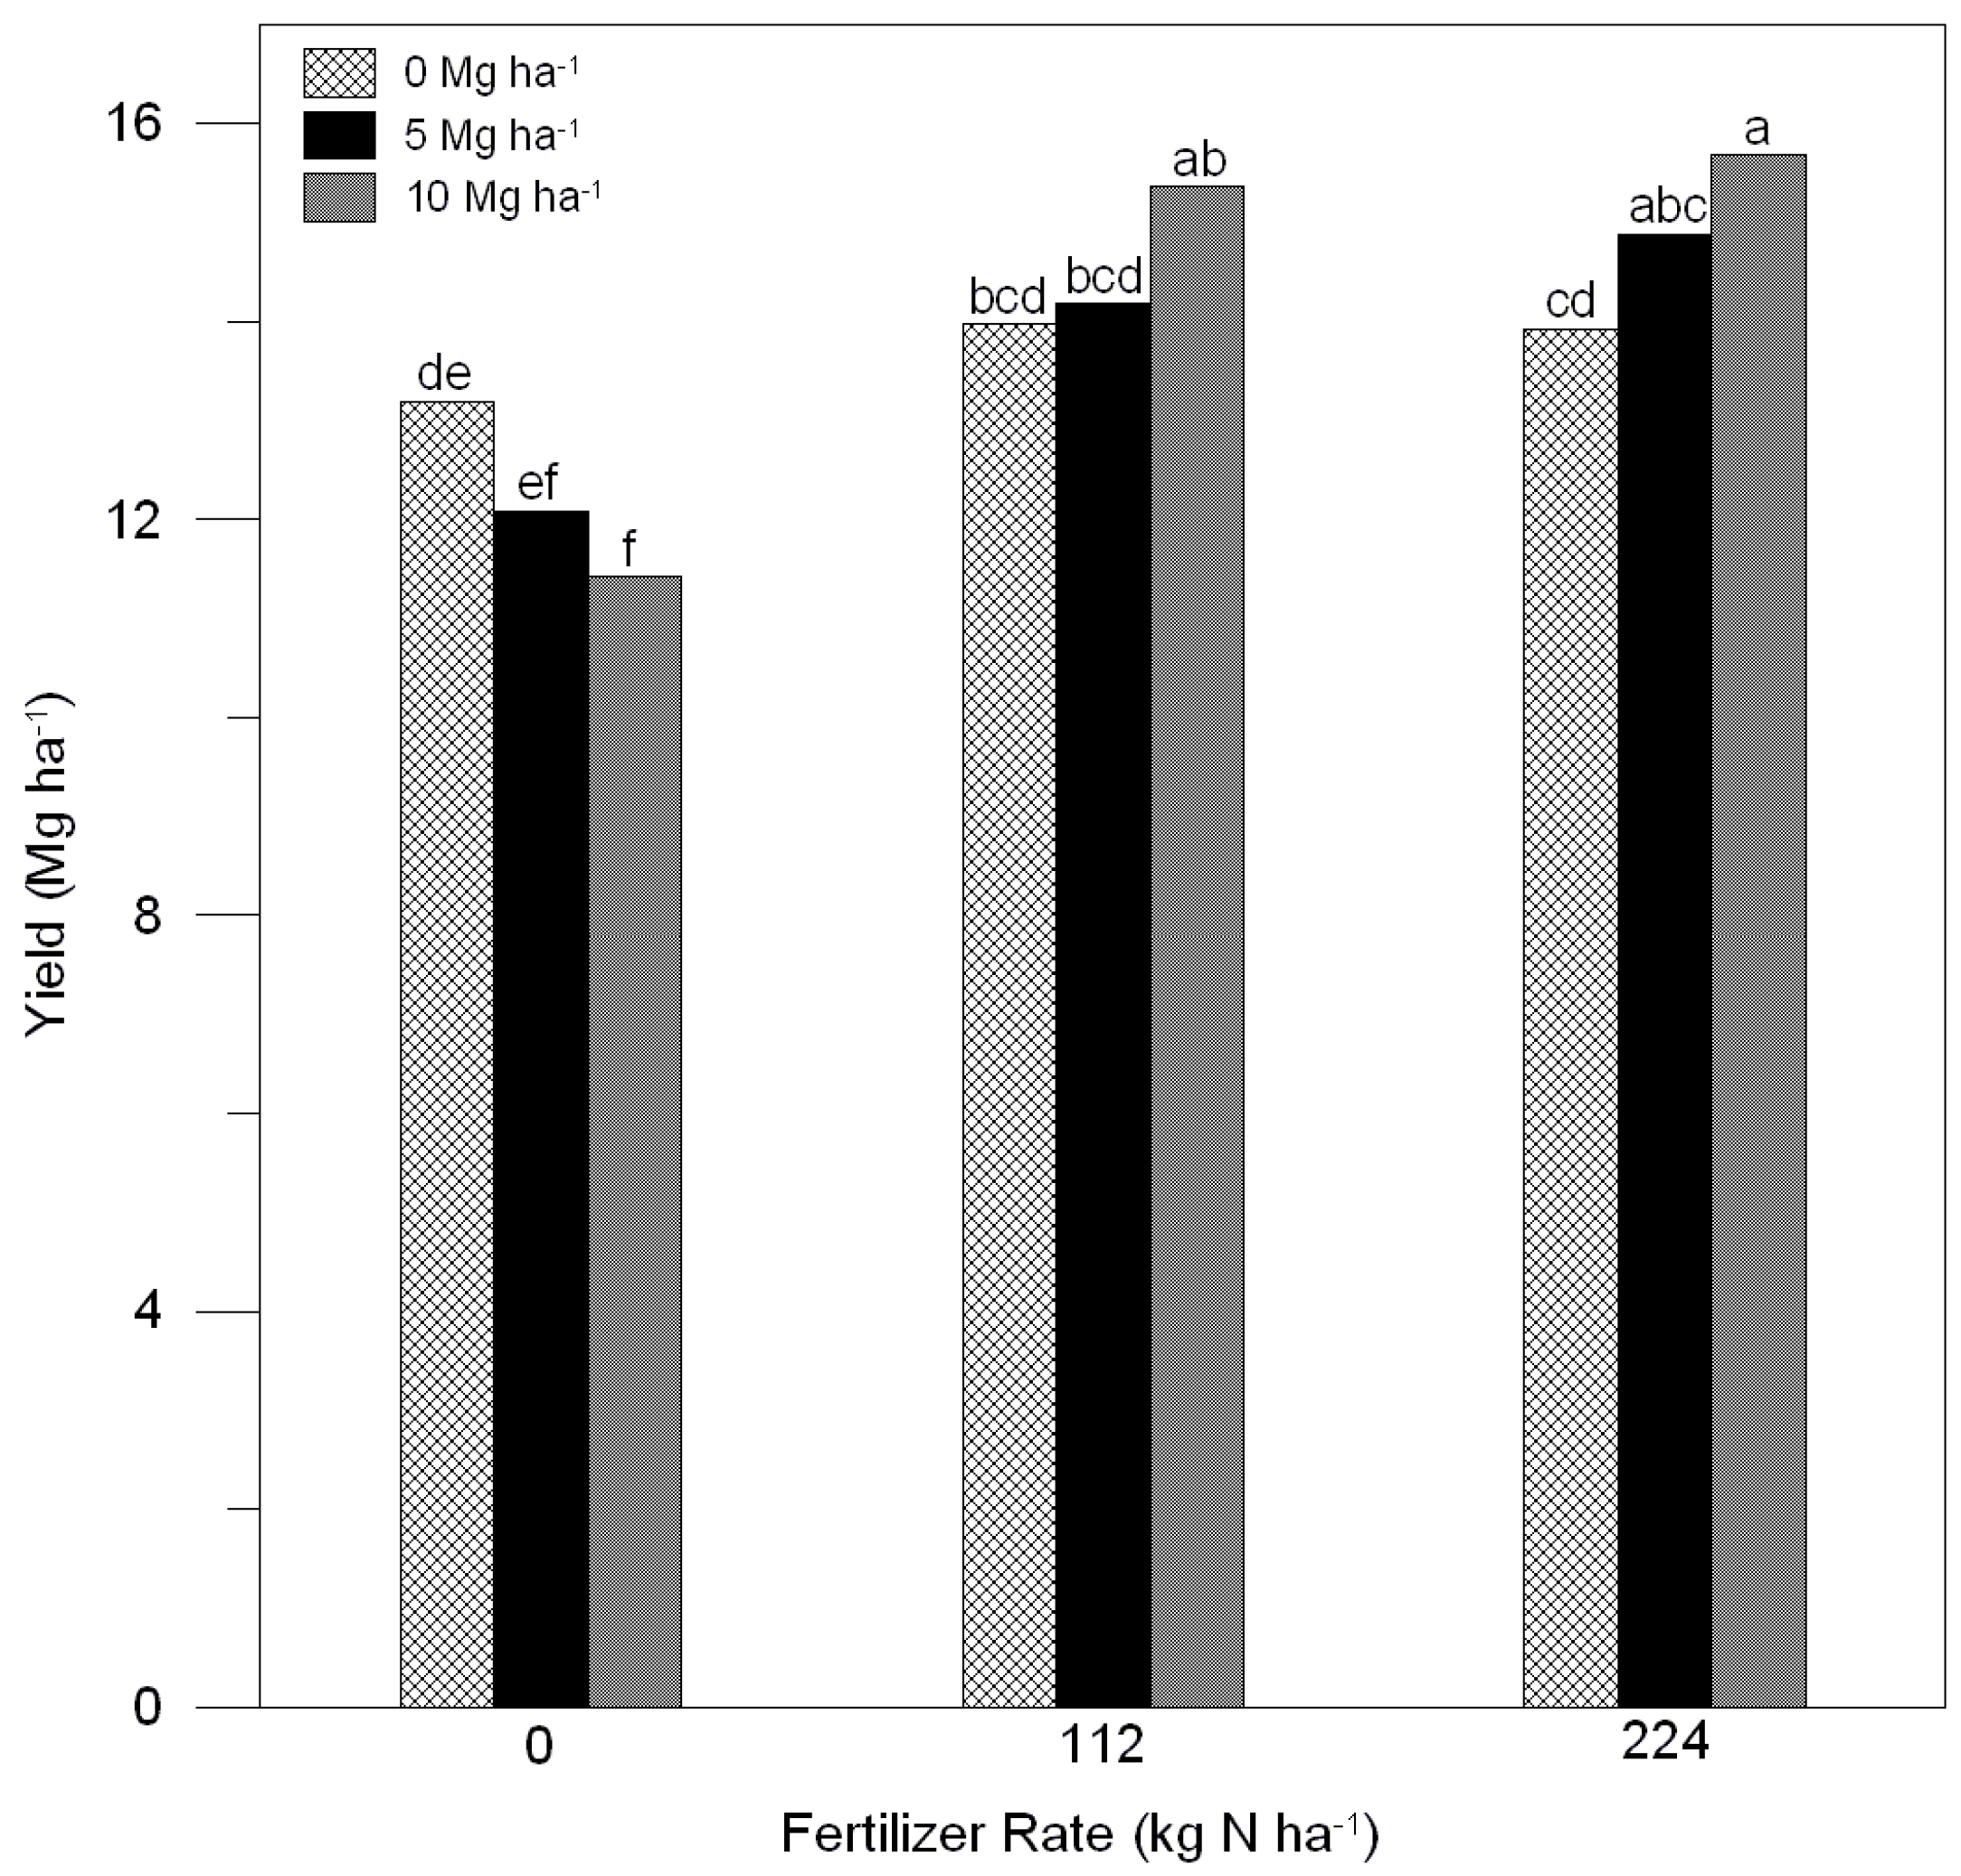
| Yield | <0.001 * | 0.439 | 0.011 * |
| Grain total N | 0.014 * | 0.491 | 0.477 |
| NUE | 0.170 | 0.003 * | 0.300 |
| Ear-leaf weight | 0.005 * | 0.548 | 0.333 |
| Ear-leaf N | <0.001 * | 0.555 | 0.710 |


| Plant/Soil | Variable | Fertilizer Rate (kg·N·ha−1) | ||
|---|---|---|---|---|
| 0 | 112 | 224 | ||
| Plant | Grain total N (mg·g−1) | 11.1 b | 11.4 b | 12.4 a |
| Ear-leaf weight (g) | 14.0 b | 15.7 a | 16.7 a | |
| Ear-leaf N (mg·g−1) | 23.1 b | 26.7 a | 28.0 a | |
| Soil | DON (μg·g−1) | 2.0 a | 2.1 a | 1.6 b |
| NO3−-N (μg·g−1) | 2.4 b | 2.8 ab | 3.9 a | |
| Inorganic N (μg·g−1) | 2.4 b | 2.8 ab | 3.9 a | |
| DOC (μg·g−1) | 8.6 b | 12.4 a | 11.0 ab | |
| Iron (μg·g−1) | 25.3 b | 28.5 ab | 30.6 a | |
| Plant/Soil | Variable | Biochar Rate (Mg·ha−1) | ||
|---|---|---|---|---|
| 0 | 5 | 10 | ||
| Plant | NUE (%) | 12.2 b | 21.8 b | 44.4 a |
| Soil | DTN (μg·g−1) | 5.7 a | 4.8 b | 4.4 b |
| NO3−-N (μg·g−1) | 3.8 a | 2.8 ab | 2.5 b | |
| Inorganic N (μg·g−1) | 3.8 a | 2.8 ab | 2.5 b | |
| Sulfur (μg·g−1) | 12.3 a | 11.4 a | 9.4 b | |
| Manganese (μg·g−1) | 80.6 a | 78.2 ab | 72.3 b | |
2.3. Corn Characteristics
3. Discussion
4. Experimental Section
4.1. Biochar Characteristics
4.2. Site Description and Experimental Design
4.3. Soil Analyses
4.4. Corn Analyses
4.5. Data Analyses
5. Summary and Conclusions
Acknowledgments
Author Contributions
Conflicts of Interest
References
- Kern, D.C.; D’aquino, G.; Rodrigues, T.E.; Frazao, F.J.L.; Sombroek, W.; Myers, T.P.; Neves, E.G. Distribution of Amazonian dark earths in the Brazilian Amazon. In Amazonian Dark Earths: Origin, Properties, Management; Lehmann, J., Kern, D.C., Glaser, B., Woods, W.I., Eds.; Kluwer Academic Publishers: Dordrecht, The Netherlands, 2003; pp. 51–75. [Google Scholar]
- Lehmann, J. Terra Preta de Indio. In Encyclopedia of Soil Science; Lal, R., Ed.; Taylor and Francis: Boca Raton, FL, USA, 2006; Volume 1, pp. 1–4. [Google Scholar]
- Glaser, B.; Haumaier, L.; Guggenberger, G.; Zech, W. The “Terra Preta” phenomenon: A model for sustainable agriculture in the humid tropics. Naturwissenschaften 2001, 88, 37–41. [Google Scholar] [CrossRef] [PubMed]
- Smith, N. Anthrosols and human carrying capacity in Amazonia. Ann. Assoc. Am. Geogr. 1980, 70, 553–566. [Google Scholar] [CrossRef]
- Zech, W.; Haumaier, L.; Hempfling, R. Ecological aspects of soil organic matter in tropical land use. In Humic Substances in Soil and Crop Sciences: Selected Readings; MacCarthy, P., Clapp, C.E., Malcolm, L., Bloom, P.R., Eds.; Soil Science Society of America: Madison, WI, USA, 1990; pp. 187–202. [Google Scholar]
- Demirbaş, A. Biomass resource facilities and biomass conversion processing for fuels and chemicals. Energy Convers. Manag. 2001, 42, 1357–1378. [Google Scholar] [CrossRef]
- Gaskin, J.W.; Steiner, C.; Harris, K.; Das, K.C.; Bibens, B. Effect of low-temperature pyrolysis conditions on biochar for agricultural use. Trans. ASABE 2008, 51, 2061–2069. [Google Scholar] [CrossRef]
- Kloss, S.; Zehetner, F.; Dellantonio, A.; Hamid, R.; Ottner, F.; Liedtke, V.; Schwanninger, M.; Gerzabek, M.H.; Soja, G. Characterization of slow pyrolysis biochars: Effects of feedstocks and pyrolysis temperature on biochar properties. J. Environ. Qual. 2012, 41, 990–1000. [Google Scholar] [CrossRef] [PubMed]
- Skodras, G.; Grammelis, P.; Basinas, P.; Kakaras, E.; Sakellaropoulos, G. Pyrolysis and combustion characteristics of biomass and waste-derived feedstock. Ind. Eng. Chem. Res. 2006, 45, 3791–3799. [Google Scholar] [CrossRef]
- Sun, Z.; Bruun, E.W.; Arthur, E.; de Jonge, L.W.; Moldrup, P.; Hauggaard-Nielsen, H.; Elsgaard, L. Effect of biochar on aerobic processes, enzyme activity, and crop yields in two sandy loam soils. Biol. Fertil. Soils 2014, 50, 1087–1097. [Google Scholar] [CrossRef]
- Jones, D.L.; Rousk, J.; Edwards-Jones, G.; DeLuca, T.H.; Murphy, D.V. Biochar-mediated changes in soil quality and plant growth in a three year field trial. Soil Biol. Biochem. 2012, 45, 113–124. [Google Scholar] [CrossRef]
- Chan, K.Y.; van Zwieten, L.; Meszaros, I.; Downie, A.; Joseph, S. Using poultry litter biochars as soil amendments. Aust. J. Soil Res. 2008, 46, 437–444. [Google Scholar] [CrossRef]
- Nelissen, V.; Ruysschaert, G.; Müller-Stöver, D.; Bodé, S.; Cook, J.; Ronsse, F.; Shackley, S.; Boeckx, P.; Hauggaard-Nielsen, H. Short-term effect of feedstock and pyrolysis temperature on biochar characteristics, soil and crop response in temperate soils. Agronomy 2014, 4, 52–73. [Google Scholar] [CrossRef] [Green Version]
- National Agricultural Statistics Service. Crop Production: 2013 Summary. Available online: http://usda.mannlib.cornell.edu/usda/nass/CropProdSu//2010s/2014/CropProdSu-01-10-2014.pdf (accessed on 2 December 2014).
- International Plant Nutrition Institute (IPNI). Nutri-Facts. Agronomic Fact Sheets on Crop Nutrients: Nitrogen. Ref. #1 #14024; International Plant Nutrition Institute: Peachtree Corners, GA, USA.
- Rogovska, N.; Laird, D.A.; Rathke, S.J.; Karlen, D.L. Biochar impact on Midwestern Mollisols and maize nutrient availability. Geoderma 2014, 230, 340–347. [Google Scholar] [CrossRef]
- Gaskin, J.W.; Speir, R.A.; Harris, K.; Das, K.C.; Lee, R.D.; Morris, L.A.; Fisher, D.S. Effect of peanut hull and pine chip biochar on soil nutrients, corn nutrient status, and yield. Agron. J. 2010, 102, 623–633. [Google Scholar] [CrossRef]
- Zheng, H.; Wang, Z.; Deng, X.; Herbert, S.; Xing, B. Impacts of adding biochar on nitrogen retention and bioavailability in agricultural soil. Geoderma 2013, 206, 32–39. [Google Scholar] [CrossRef]
- Rajkovich, S.; Enders, A.; Hanley, K.; Hyland, C.; Zimmerman, A.R.; Lehmann, J. Corn growth and nitrogen nutrition after additions of biochars with varying properties to a temperate soil. Biol. Fertil. Soils 2012, 48, 271–284. [Google Scholar] [CrossRef]
- Prommer, J.; Wanek, W.; Hofhansl, F.; Trojan, D.; Offre, P.; Urich, T.; Schleper, C.; Sassmann, S.; Kitzler, B.; Soja, G.; et al. Biochar decelerates soil organic nitrogen cycling but stimulates soil nitrification in a temperate arable field trial. PLoS One 2014, 9. [Google Scholar] [CrossRef] [PubMed]
- Nelissen, V.; Rütting, T.; Huygens, D.; Staelens, J.; Ruysschaert, G.; Boeckx, P. Maize biochars accelerate short-term soil nitrogen dynamics in a loamy sand soil. Soil Biol. Biochem. 2012, 55, 20–27. [Google Scholar] [CrossRef]
- Pelkki, M.H. An Economic Assessment of Arkansas’ Forest Industries: Challenges and Opportunities for the 21st Century; Arkansas Forest Resources Center Series 007; Arkansas Agricultural Experiment Station: Fayetteville, AR, USA, 2005. [Google Scholar]
- Espinoza, L.; Ross, J. Fertilization and liming. In Corn Production Handbook; University of Arkansas Cooperative Extension Service: Little Rock, AR, USA, 2003; pp. 23–27. [Google Scholar]
- Bond, R.D.; Dombek, D.G.; Still, J.A.; Pryor, R.M. Arkansas Corn and Grain Sorghum Performance Tests 2013; Arkansas Agricultural Experiment Station: Fayetteville, AR, USA, 2013. [Google Scholar]
- Kolb, S.E.; Fermanich, K.J.; Dornbush, M.E. Effect of charcoal quantity on microbial biomass and activity in temperate soils. Soil Sci. Soc. Am. J. 2009, 73, 1173–1181. [Google Scholar] [CrossRef]
- Streubel, J.D.; Collins, H.P.; Garcia-Perez, M.; Tarara, J.; Granatstein, D.; Kruger, C.E. Influence of contrasting biochar types on five soils at increasing rates of application. Soil Sci. Soc. Am. J. 2011, 75, 1402–1413. [Google Scholar] [CrossRef]
- Güereña, D.; Lehmann, J.; Hanley, K.; Enders, A.; Hyland, C.; Riha, S. Nitrogen dynamics following field application of biochar in a temperate North American maize-based production system. Plant Soil 2013, 365, 239–254. [Google Scholar] [CrossRef]
- Laird, D.; Fleming, P.; Wang, B.; Horton, R.; Karlen, D. Biochar impact on nutrient leaching from a Midwestern agricultural soil. Geoderma 2010, 158, 436–442. [Google Scholar] [CrossRef]
- Laird, D.A.; Fleming, P.; Davis, D.D.; Horton, R.; Wang, B.; Karlen, D.L. Impact of biochar amendments on the quality of a typical Midwestern agricultural soil. Geoderma 2010, 158, 443–449. [Google Scholar] [CrossRef]
- Gajić, A.; Koch, H.-J. Sugar beet (Beta vulgaris L.) growth reduction caused by hydrochar is related to nitrogen supply. J. Environ. Qual. 2012, 41, 1067–1075. [Google Scholar] [CrossRef] [PubMed]
- Chen, C.R.; Phillips, I.R.; Condron, L.M.; Goloran, J.; Xu, Z.H.; Chan, K.Y. Impacts of greenwaste biochar on ammonia volatilization from bauxite processing residue sand. Plant Soil 2013, 367, 301–312. [Google Scholar] [CrossRef]
- Zhao, X.; Yan, X.; Wang, S.; Xing, G.; Zhou, Y. Effects of the addition of rice-straw-based biochar on leaching and retention of fertilizer N in highly fertilized cropland soils. Soil Sci. Plant Nutr. 2013, 59, 771–782. [Google Scholar] [CrossRef]
- Husk, B.; Major, J. Commercial Scale Agricultural Biochar Field Trial in Québec, Canada over Two Years: Effects of Biochar on Soil Fertility, Biology and Crop Productivity and Quality. Available online: http://www.researchgate.net/publication/237079745_Commercial_scale_agricultural_biochar (accessed on 2 December 2014).
- Chan, K.Y.; van Zwieten, L.; Meszaros, I.; Downie, A.; Joseph, S. Agronomic values of greenwaste biochar as a soil amendment. Aust. J. Soil Res. 2007, 45, 629–634. [Google Scholar] [CrossRef]
- Vaccari, F.P.; Baronti, S.; Lugato, E.; Genesio, L.; Castaldi, S.; Fornasier, F.; Miglietta, F. Biochar as a strategy to sequester carbon and increase yield in durum wheat. Euro. J. Agron. 2011, 34, 231–238. [Google Scholar] [CrossRef]
- Prendergast-Miller, M.T.; Duvall, M.; Sohi, S.P. Localisation of nitrate in the rhizosphere of biochar-amended soils. Soil Biol. Biochem. 2011, 43, 2243–2246. [Google Scholar] [CrossRef]
- Prendergast-Miller, M.T.; Duvall, M.; Sohi, S.P. Biochar-root interactions are mediated by biochar nutrient content and impacts on soil nutrient availability. Eur. J. Soil Sci. 2013, 65, 173–185. [Google Scholar] [CrossRef]
- Method 3050B: Acid Digestion of Sediments, Sludges, and Soils. Available online: http://www.epa.gov/wastes/hazard/testmethods/sw846/pdfs/3050b.pdf (accessed on 2 December 2014).
- National Climatic Data Center. NOAA’s 1981–2010 Climate Normals. Available online: http://www.ncdc.noaa.gov/oa/climate/normals/usnormals.html (accessed on 2 December 2014).
- Web Soil Survey—Home. Available online: http://websoilsurvey.sc.egov.usda.gov/App/HomePage.htm (accessed on 2 December 2014).
- Division of Agriculture. Irrigation for Agriculture in Arkansas. Available online: http://www.uaex.edu/environment-nature/water/irrigation.aspx (accessed on 2 December 2014).
- Jones, D.; Willett, V. Experimental evaluation of methods to quantify dissolved organic nitrogen (DON) and dissolved organic carbon (DOC) in soil. Soil Biol. Biochem. 2006, 38, 991–999. [Google Scholar] [CrossRef]
- Mulvaney, R.L. Nitrogen: Inorganic forms. In Methods of Soil Analysis, Part 3. Chemical Methods; Sparks, D.L., Helmke, P.A., Page, A.L., Loeppert, R.H., Eds.; SSSA Book Series; Soil Science Society of America: Madison, WI, USA, 1996; pp. 1123–1184. [Google Scholar]
- Vance, E.D.; Brookes, P.C.; Jenkinson, D.S. Microbial biomass measurements in forest soils: The use of the chloroform fumigation-incubation method in strongly acid soils. Soil Biol. Biochem. 1987, 19, 697–702. [Google Scholar] [CrossRef]
- Self-Davis, M.L.; Moore, P.A.; Joern, B.C. Determination of water- and/or dilute salt-extractable phosphorus. In Methods of Phosphorus Analysis for Soils, Sediments, Residuals, and Waters; Pierzynski, G.M., Ed.; Southern Cooperative Series Bulletin; North Carolina State University: Raleigh, NC, USA, 2000; pp. 24–26. [Google Scholar]
- Kuo, S. Phosphorus. In Methods of Soil Analysis, Part 3. Chemical Methods; Sparks, D.L., Page, A.L., Helmke, P.A., Loeppert, R.H., Eds.; SSSA Book Series; Soil Science Society of America: Madison, WI, USA, 1996; pp. 869–920. [Google Scholar]
- Tabatabai, M.A. Soil enzymes. In Methods of Soil Analysis, Part 2. Microbiological and Biochemical Properties; Bottomley, P.S., Angle, J.S., Weaver, R.W., Eds.; SSSA Book Series; Soil Science Society of America: Madison, WI, USA, 1994; pp. 775–833. [Google Scholar]
- Tucker, M.R. Determination of phosphorus by Mehlich 3 extractant. In Reference Soil and Media Diagnostic Procedure for the Southern Region of the United States; Donohue, S.J., Ed.; Southern Cooperative Series Bulletin; Va. Agric. Exp. Station: Blacksburg, VA, USA, 1992; pp. 9–12. [Google Scholar]
- Gee, G.W.; Bauder, J.W. Particle-size analysis. In Methods of Soil Analysis, Part 1. Physical and Mineralogical Methods; Klute, A., Ed.; Agronomy Monograph; American Society of Agronomy: Madison, WI, USA, 1986; pp. 383–411. [Google Scholar]
- Plank, C.O. Plant Analysis Reference Procedures for the Southern Region of the United States; Southern Cooperative Series Bulletin; The University of Georgia: Athens, GA, USA, 1992. [Google Scholar]
- Pomares-Garcia, F.; Pratt, P.F. Recovery of 15N-labeled fertilizer from manured and sludge-amended soil. Soil Sci. Soc. Am. J. 1978, 42, 717–720. [Google Scholar] [CrossRef]
© 2015 by the authors; licensee MDPI, Basel, Switzerland. This article is an open access article distributed under the terms and conditions of the Creative Commons Attribution license (http://creativecommons.org/licenses/by/4.0/).
Share and Cite
Brantley, K.E.; Savin, M.C.; Brye, K.R.; Longer, D.E. Pine Woodchip Biochar Impact on Soil Nutrient Concentrations and Corn Yield in a Silt Loam in the Mid-Southern U.S. Agriculture 2015, 5, 30-47. https://doi.org/10.3390/agriculture5010030
Brantley KE, Savin MC, Brye KR, Longer DE. Pine Woodchip Biochar Impact on Soil Nutrient Concentrations and Corn Yield in a Silt Loam in the Mid-Southern U.S. Agriculture. 2015; 5(1):30-47. https://doi.org/10.3390/agriculture5010030
Chicago/Turabian StyleBrantley, Katy E., Mary C. Savin, Kristofor R. Brye, and David E. Longer. 2015. "Pine Woodchip Biochar Impact on Soil Nutrient Concentrations and Corn Yield in a Silt Loam in the Mid-Southern U.S." Agriculture 5, no. 1: 30-47. https://doi.org/10.3390/agriculture5010030