Significance and Diagnostic Accuracy of Early S100B Serum Concentration after Aneurysmal Subarachnoid Hemorrhage

 , ,
, ,
Abstract
:1. Introduction
2. Experimental Section
2.1. Participants
2.2. Outcome
2.3. Clinical Evaluation
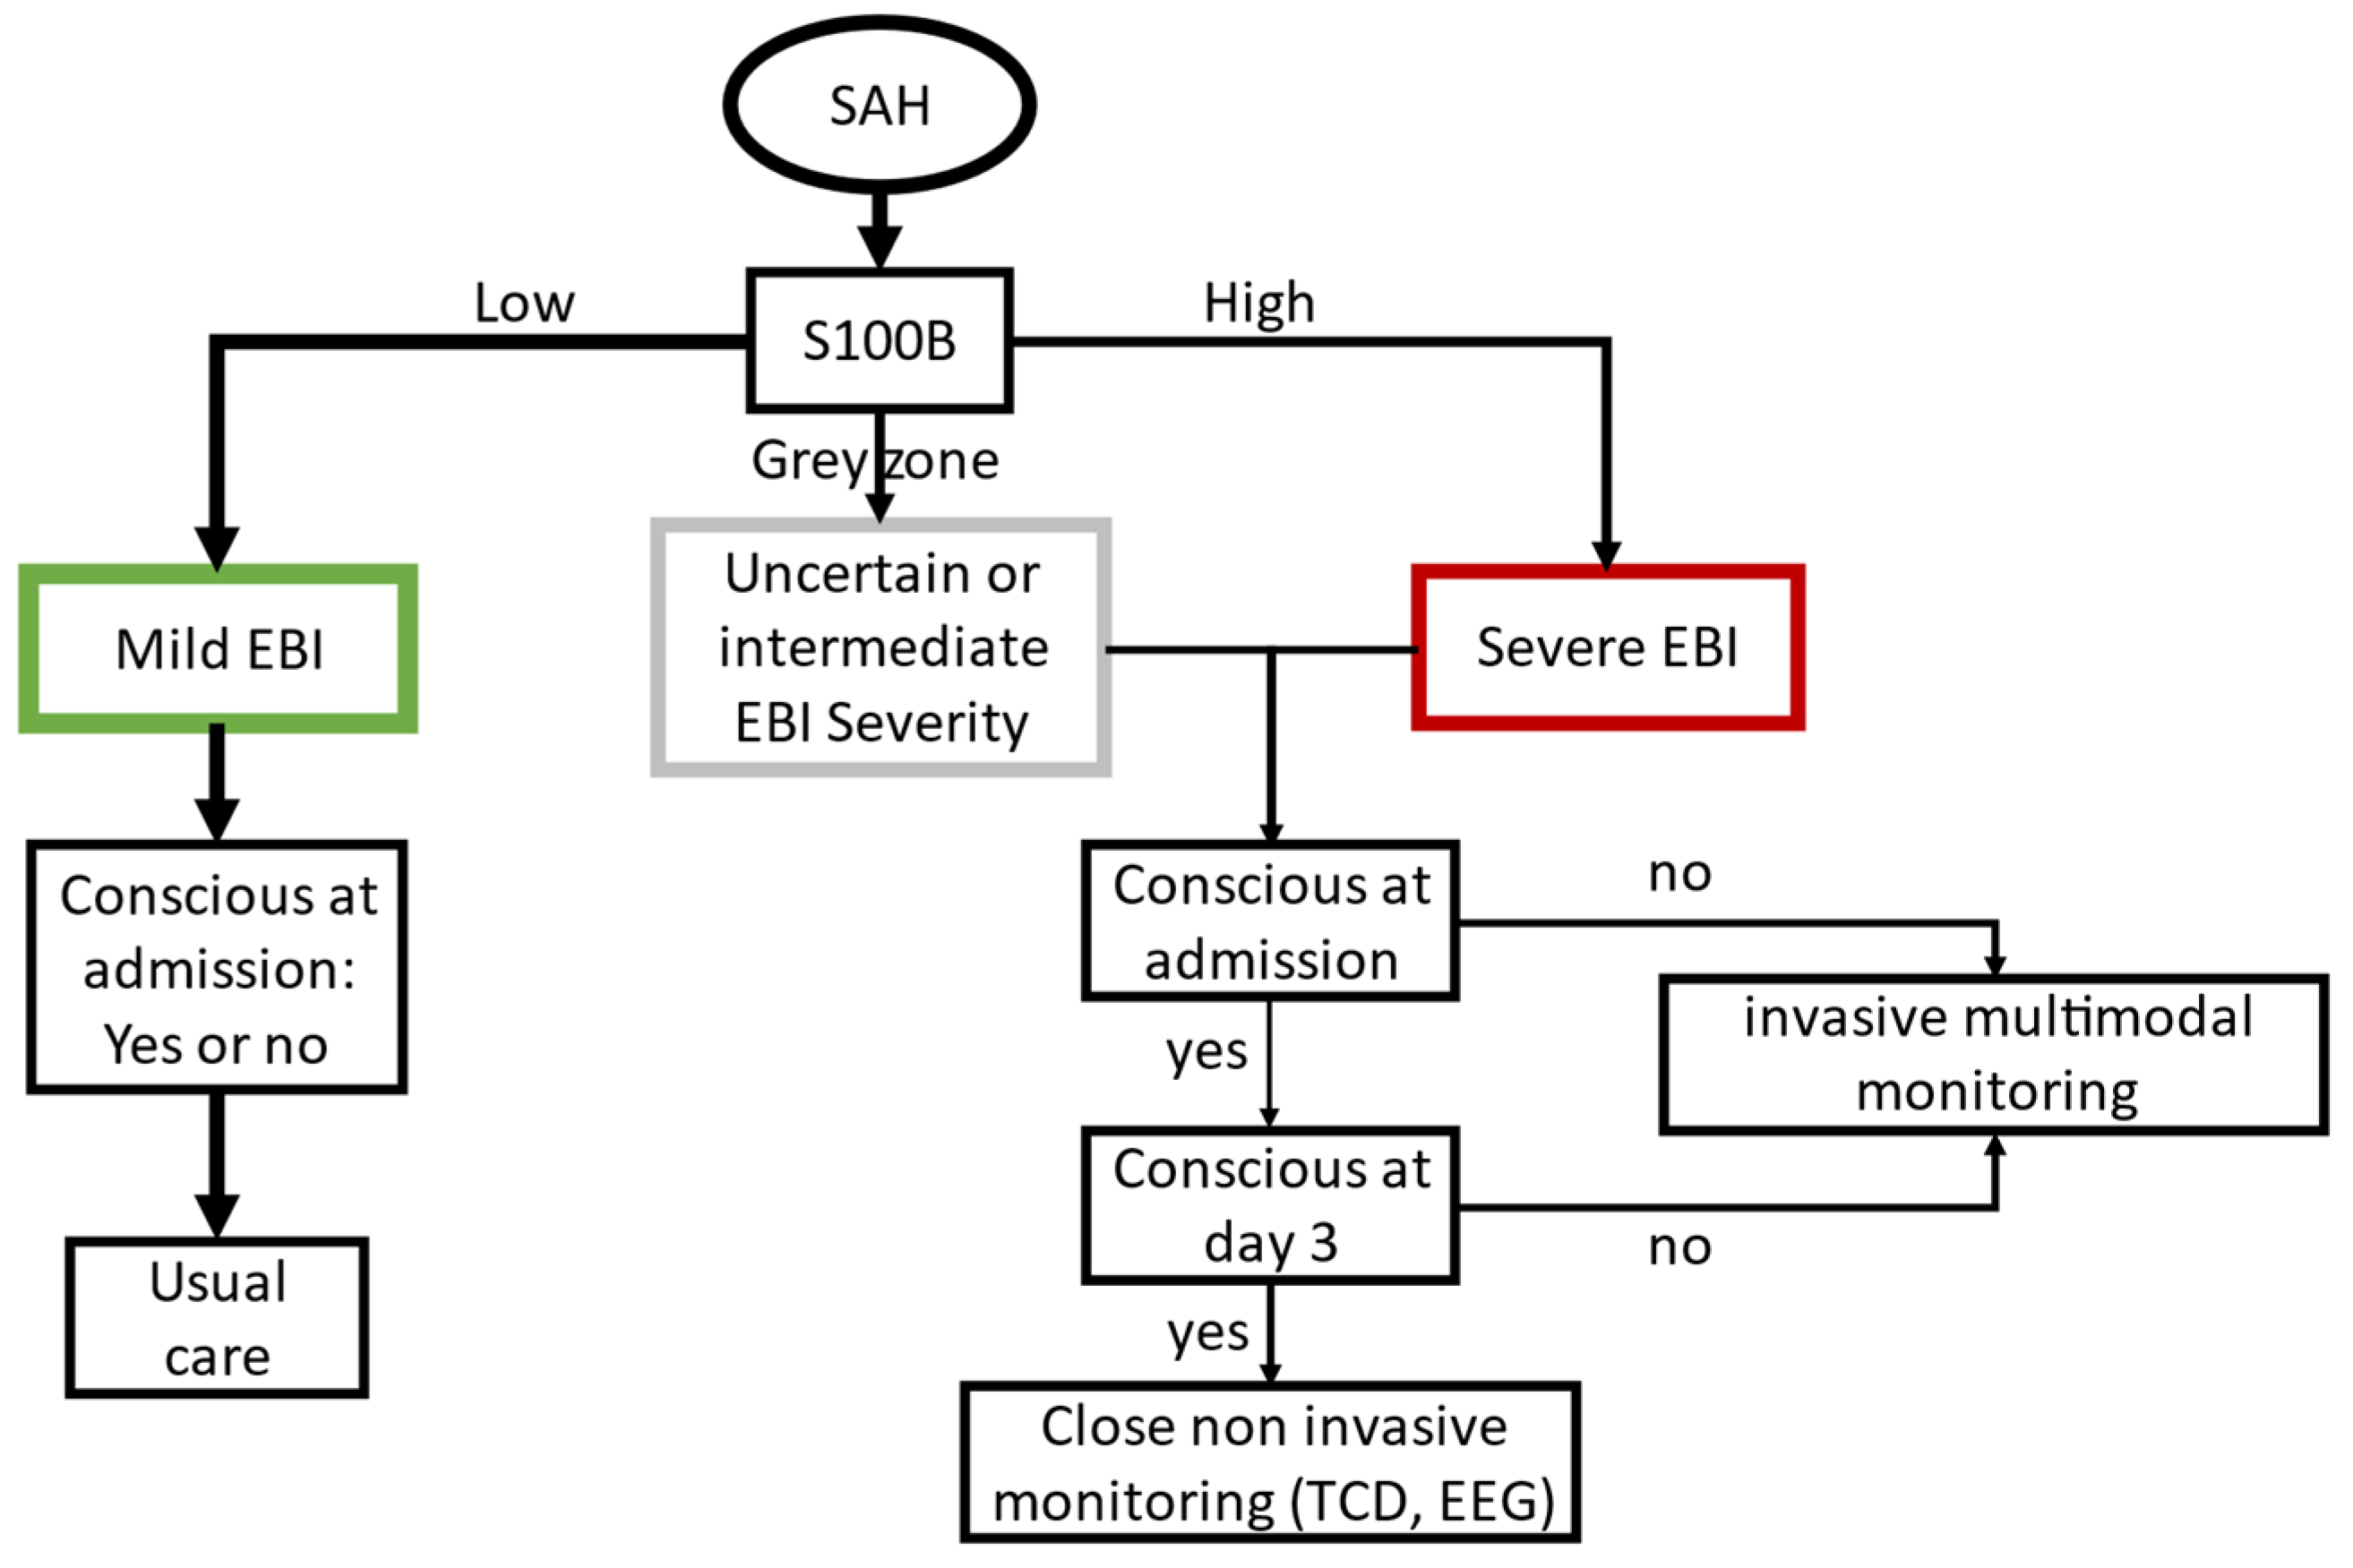
2.4. Clinical Management
2.5. S100B Measurements
2.6. Statistical Analysis
3. Results
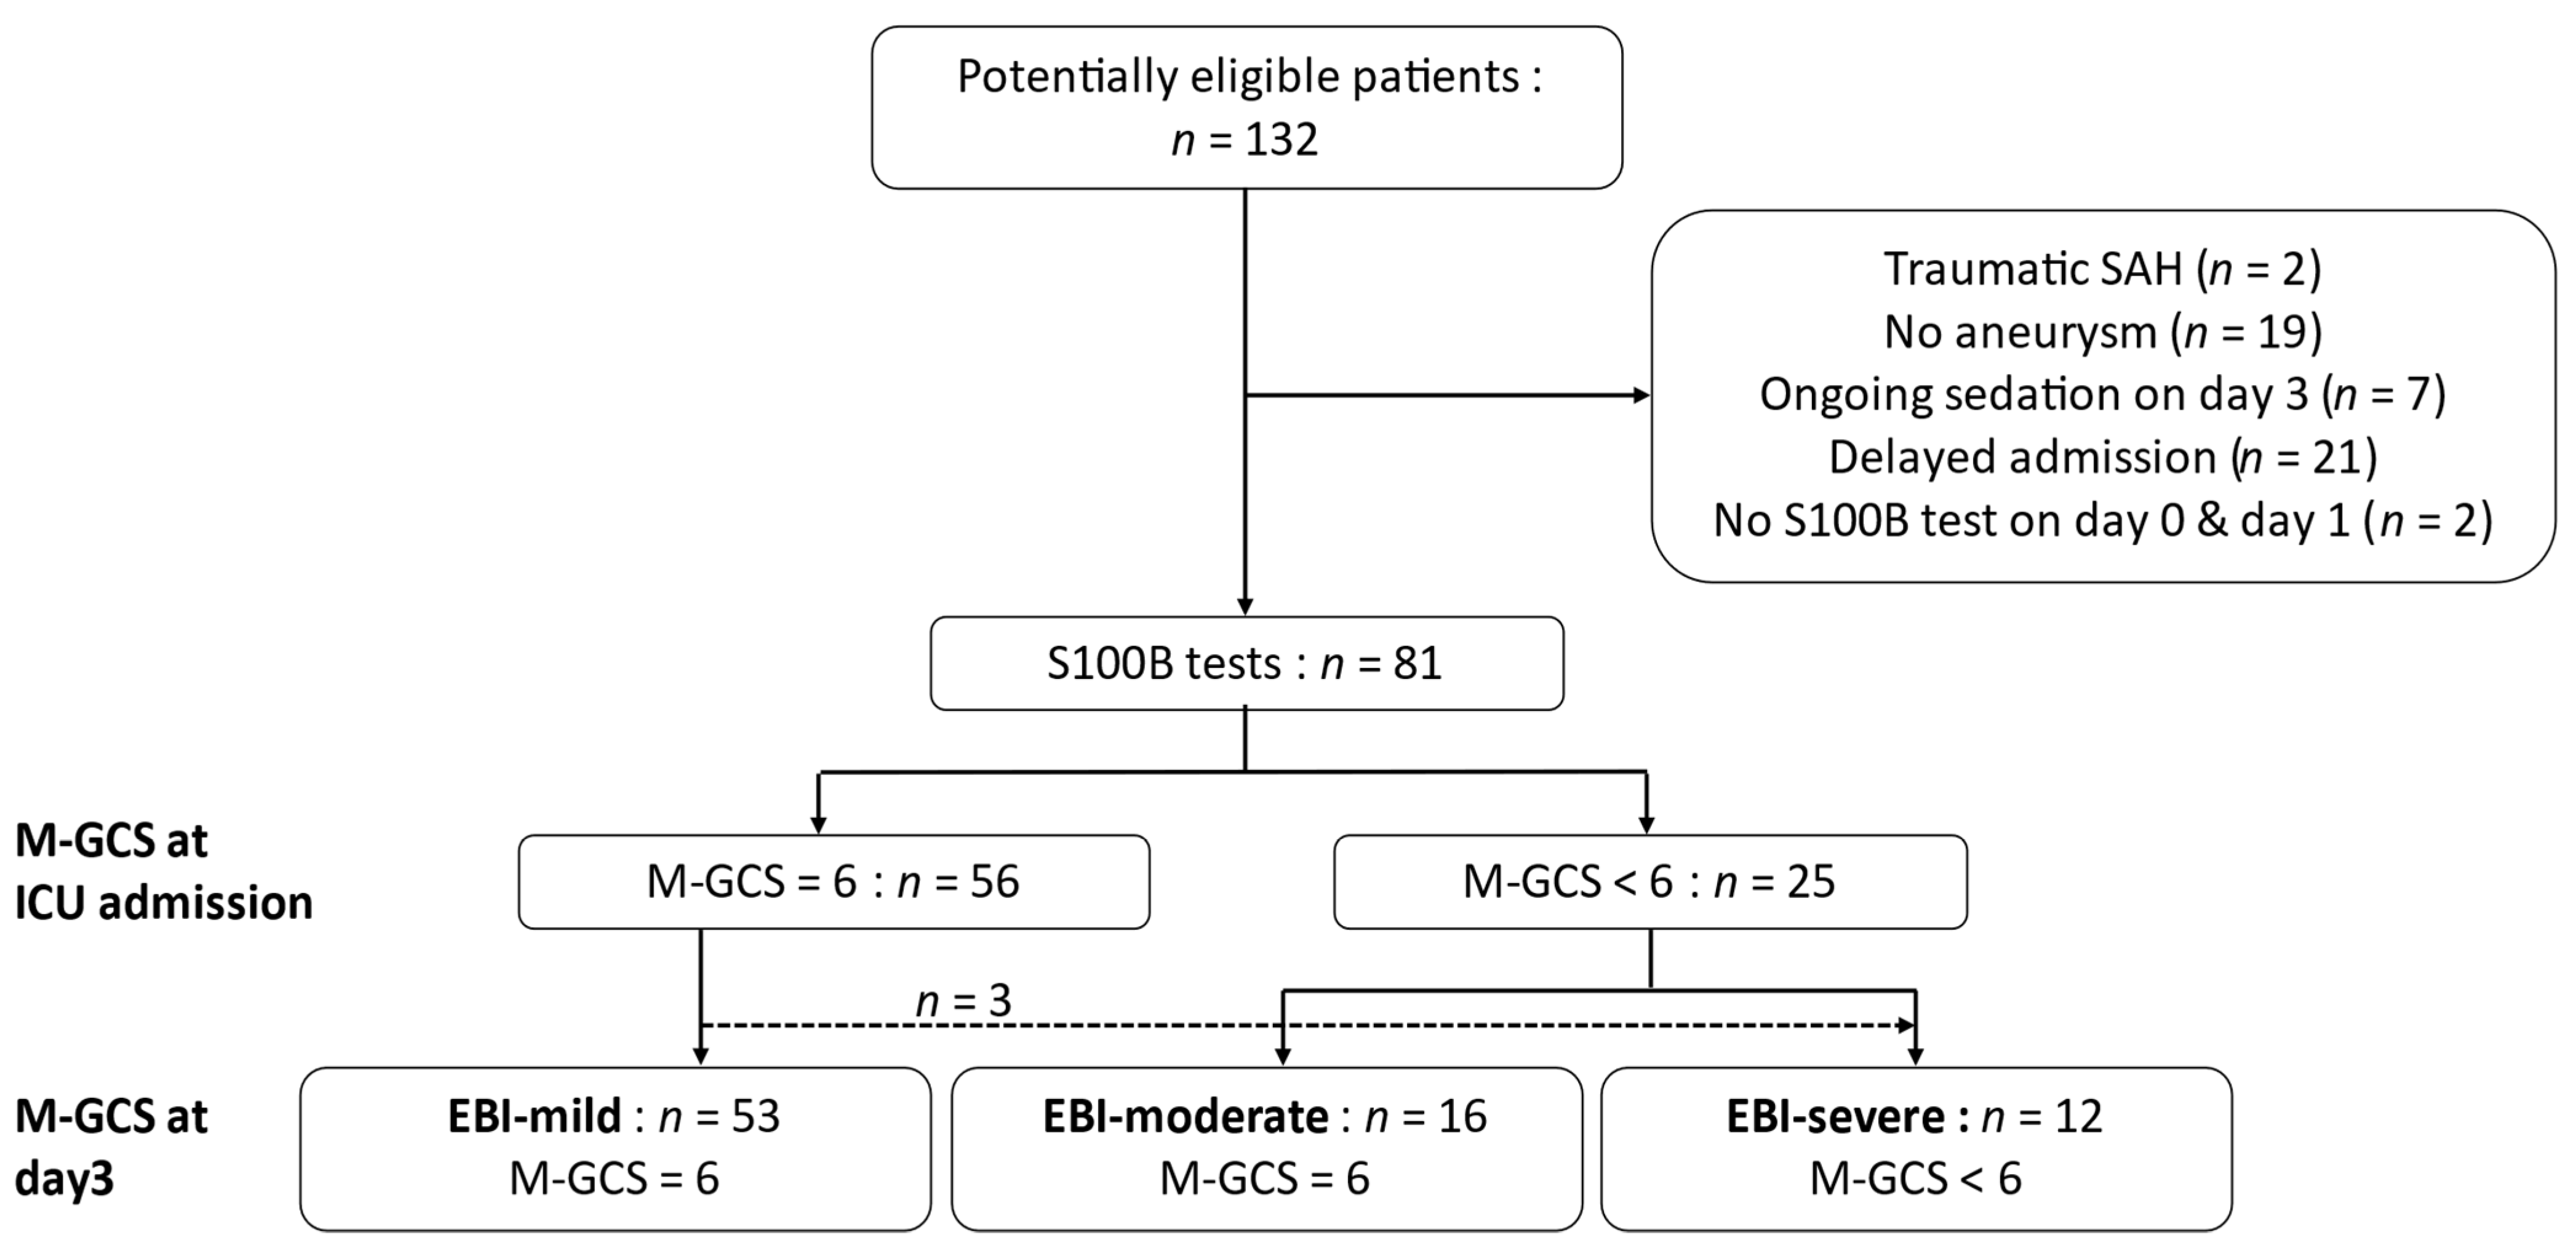
3.1. Population
3.2. Serum S100B Concentration Changes
3.3. Accuracy of Serum S100B Concentration to Predict an M-GCS < 6 on Day 3
3.4. Serum S100B Concentration and mRS at ICU Discharge
4. Discussion
5. Conclusions
Author Contributions
Funding
Acknowledgments
Conflicts of Interest
References
- Ingall, T.; Asplund, K.; Mähönen, M.; Bonita, R. A Multinational Comparison of Subarachnoid Hemorrhage Epidemiology in the WHO MONICA Stroke Study. Stroke 2000, 31, 1054–1061. [Google Scholar] [CrossRef] [PubMed]
- Connolly, S.E.; Rabinstein, A.A.; Carhuapoma, R.J.; Derdeyn, C.P.; Dion, J.; Higashida, R.T.; Hoh, B.L.; Kirkness, C.J.; Naidech, A.M.; Ogilvy, C.S.; et al. Guidelines for the Management of Aneurysmal Subarachnoid Hemorrhage A Guideline for Healthcare Professionals From the American Heart Association/American Stroke Association. Stroke 2012, 43, 1711–1737. [Google Scholar] [CrossRef] [PubMed] [Green Version]
- Broderick, J.; Brott, T.; Duldner, J.; Tomsick, T.; Leach, A. Initial and recurrent bleeding are the major causes of death following subarachnoid hemorrhage. Stroke 1994, 25, 1342–1347. [Google Scholar] [CrossRef] [PubMed] [Green Version]
- Claassen, J.; Vu, A.; Kreiter, K.T.; Kowalski, R.G.; Du, E.Y.; Ostapkovich, N.; Fitzsimmons, B.-F.M.; Connolly, E.; Mayer, S.A. Effect of acute physiologic derangements on outcome after subarachnoid hemorrhage. Crit. Care Med. 2004, 32, 832–838. [Google Scholar] [CrossRef] [PubMed]
- Naidech, A.M.; Janjua, N.; Kreiter, K.T.; Ostapkovich, N.D.; Fitzsimmons, B.-F.F.; Parra, A.; Commichau, C.; Connolly, E.; Mayer, S.A. Predictors and impact of aneurysm rebleeding after subarachnoid hemorrhage. Arch. Neurol. 2005, 62, 410–416. [Google Scholar] [CrossRef] [Green Version]
- Choi, H.; Bajgur, S.S.; Jones, W.H.; Savarraj, J.P.; Ko, S.-B.B.; Edwards, N.J.; Chang, T.R.; Hergenroeder, G.W.; Dannenbaum, M.J.; Chen, P.; et al. Quantification of Cerebral Edema After Subarachnoid Hemorrhage. Neurocritical Care 2016, 25, 64–70. [Google Scholar] [CrossRef]
- Kreiter, K.T.; Copeland, D.; Bernardini, G.L.; Bates, J.E.; Peery, S.; Claassen, J.; Du, E.Y.; Stern, Y.; Connolly, S.E.; Mayer, S.A. Predictors of cognitive dysfunction after subarachnoid hemorrhage. Stroke 2002, 33. [Google Scholar] [CrossRef] [Green Version]
- Teasdale, G.; Drake, C.; Hunt, W.; Kassell, N.; Sano, K.; Pertuiset, B.; Villiers, D.J. A universal subarachnoid hemorrhage scale: Report of a committee of the World Federation of Neurosurgical Societies. J. Neurol. Neurosurg. Psychiatry 1988, 51, 1457. [Google Scholar] [CrossRef] [PubMed] [Green Version]
- Suzuki, H. What is Early Brain Injury? Transl. Stroke Res. 2015, 6, 1–3. [Google Scholar] [CrossRef] [PubMed]
- Rass, V.; Helbok, R. Early Brain Injury after Poor-Grade Subarachnoid Hemorrhage. Curr. Neurol. Neurosci. 2019, 19, 78. [Google Scholar] [CrossRef] [PubMed] [Green Version]
- Francoeur, C.L.; Mayer, S.A. Management of delayed cerebral ischemia after subarachnoid hemorrhage. Crit. Care 2016, 20, 277. [Google Scholar] [CrossRef] [PubMed] [Green Version]
- Helbok, R.; Madineni, R.C.; Schmidt, M.J.; Kurtz, P.; Fernandez, L.; Ko, S.-B.B.; Choi, A.; Stuart, M.R.; Connolly, E.; Lee, K.; et al. Intracerebral monitoring of silent infarcts after subarachnoid hemorrhage. Neurocritical Care 2011, 14, 162–167. [Google Scholar] [CrossRef] [PubMed]
- Charpentier, C.; Audibert, G.; Guillemin, F.; Civit, T.; Ducrocq, X.; Bracard, S.; Hepner, H.; Picard, L.; Laxenaire, M. Multivariate analysis of predictors of cerebral vasospasm occurrence after aneurysmal subarachnoid hemorrhage. Stroke 1999, 30, 1402–1408. [Google Scholar] [CrossRef] [PubMed] [Green Version]
- Ahn, S.-H.H.; Savarraj, J.P.; Pervez, M.; Jones, W.; Park, J.; Jeon, S.-B.B.; Kwon, S.U.; Chang, T.R.; Lee, K.; Kim, D.H.; et al. The Subarachnoid Hemorrhage Early Brain Edema Score Predicts Delayed Cerebral Ischemia and Clinical Outcomes. Neurosurgery 2017. [Google Scholar] [CrossRef] [PubMed]
- Petzinka, V.N.; Endisch, C.; Streitberger, K.J.; Salih, F.; Ploner, C.J.; Storm, C.; Nee, J.; Leithner, C. Unresponsive wakefulness or coma after cardiac arrest—A long-term follow-up study. Resuscitation 2018. [Google Scholar] [CrossRef] [PubMed]
- Calderon, L.M.; Guyette, F.X.; Doshi, A.A.; Callaway, C.W.; Rittenberger, J.C.; Service, P. Combining NSE and S100B with clinical examination findings to predict survival after resuscitation from cardiac arrest. Resuscitation 2014, 85, 1025–1029. [Google Scholar] [CrossRef] [PubMed] [Green Version]
- Vos, P.; Gils, V.M.; Beems, T.; Zimmerman, C.; Verbeek, M. Increased GFAP and S100β but not NSE serum levels after subarachnoid haemorrhage are associated with clinical severity. Eur. J. Neurol. 2006, 13, 632–638. [Google Scholar] [CrossRef]
- Quintard, H.; Leduc, S.; Ferrari, P.; Petit, I.; Ichai, C. Early and persistent high level of PS 100β is associated with increased poor neurological outcome in patients with SAH: Is there a PS 100β threshold for SAH prognosis? Crit. Care 2016, 20, 33. [Google Scholar] [CrossRef] [Green Version]
- Foerch, C.; Niessner, M.; Back, T.; Bauerle, M.; Marchis, G.; Ferbert, A.; Grehl, H.; Hamann, G.F.; Jacobs, A.; Kastrup, A.; et al. Diagnostic Accuracy of Plasma Glial Fibrillary Acidic Protein for Differentiating Intracerebral Hemorrhage and Cerebral Ischemia in Patients with Symptoms of Acute Stroke. Clin. Chem. 2012, 58, 237–245. [Google Scholar] [CrossRef] [Green Version]
- Weiss, N.; Sanchez-Peña, P.; Roche, S.; Beaudeux, J.L.; Colonne, C.; Coriat, P.; Puybasset, L. Prognosis value of plasma S100B protein levels after subarachnoid aneurysmal hemorrhage. Anesthesiology 2006, 104, 658–666. [Google Scholar] [CrossRef]
- Lai, P.M.; Du, R. Association between S100B Levels and Long-Term Outcome after Aneurysmal Subarachnoid Hemorrhage: Systematic Review and Pooled Analysis. PLoS ONE 2016, 11, e0151853. [Google Scholar] [CrossRef] [PubMed] [Green Version]
- Macdonald, R.L.; Higashida, R.T.; Keller, E.; Mayer, S.A.; Molyneux, A.; Raabe, A.; Vajkoczy, P.; Wanke, I.; Bach, D.; Frey, A.; et al. Randomized Trial of Clazosentan in Patients With Aneurysmal Subarachnoid Hemorrhage Undergoing Endovascular Coiling. Stroke 2012, 43, 1463–1469. [Google Scholar] [CrossRef] [PubMed] [Green Version]
- Fisher, C.; Kistler, J.; Davis, J. Relation of cerebral vasospasm to subarachnoid hemorrhage visualized by computerized tomographic scanning. Neurosurgery 1980, 6, 1–9. [Google Scholar] [CrossRef] [PubMed]
- Lindvall, P.; Runnerstam, M.; Birgander, R.; Koskinen, L.-O.D. The Fisher grading correlated to outcome in patients with subarachnoid haemorrhage. Br. J. Neurosurg. 2009, 23, 188–192. [Google Scholar] [CrossRef] [PubMed]
- Hijdra, A.; Brouwers, P.J.; Vermeulen, M.; van Gijn, J. Grading the amount of blood on computed tomograms after subarachnoid hemorrhage. Stroke 1990, 21, 1156–1161. [Google Scholar] [CrossRef] [PubMed] [Green Version]
- Molyneux, A.J.; Kerr, R.S.; Yu, L.-M.; Clarke, M.; Sneade, M.; Yarnold, J.A.; Sandercock, P.; Group, I. For the International subarachnoid aneurysm trial (ISAT) of neurosurgical clipping versus endovascular coiling in 2143 patients with ruptured intracranial aneurysms: A randomised comparison of effects on survival, dependency, seizures, rebleeding, subgroups, and aneurysm occlusion. Lancet 2005, 366, 809–817. [Google Scholar] [CrossRef]
- Bossuyt, P.M.; Reitsma, J.B.; Bruns, D.E.; Gatsonis, C.A.; Glasziou, P.P.; Irwig, L.; Lijmer, J.G.; Moher, D.; Rennie, D.; de Vet, H.C.; et al. STARD 2015: An updated list of essential items for reporting diagnostic accuracy studies. BMJ 2015, 351, h5527. [Google Scholar] [CrossRef] [Green Version]
- Obuchowski, N.A.; McCLISH, D.K. Sample size determination for diagnostic accuracy studies involving binomial ROC curve indices. Stat. Med. 1997, 16, 1529–1542. [Google Scholar] [CrossRef]
- Robin, X.; Turck, N.; Hainard, A.; Tiberti, N.; Lisacek, F.; Sanchez, J.-C.; Müller, M. pROC: An open-source package for R and S+ to analyze and compare ROC curves. BMC Bioinform. 2011, 12, 1–8. [Google Scholar] [CrossRef]
- Cliff, N. Ordinal Methods for Behavioral Data Analysis, 1st ed.; Psychology Press: New York, NY, USA, 1996. [Google Scholar] [CrossRef]
- Ray, P.; Manach, Y.; Riou, B.; Houle, T.T. Statistical Evaluation of a Biomarker. Anesthesiology 2010, 112, 1023. [Google Scholar] [CrossRef] [PubMed] [Green Version]
- R Core Team. R: A Language and Environment for Statistical Computing; R Foundation for Statistical Computing: Vienna, Austria, 2017. [Google Scholar]
- Biberthaler, P.; Linsenmeier, U.; Pfeifer, K.-J.; Kroetz, M.; Mussack, T.; Kanz, K.-G.; Hoecherl, E.F.J.; Jonas, F.; Marzi, I.; Leucht, P.; et al. Serum S-100B concentration provides additional information for the indication of computed tomography in patients after minor head injury. Shock 2006, 25, 446–453. [Google Scholar] [CrossRef] [PubMed] [Green Version]
- Sanchez-Peña, P.; Pereira, A.-R.; Sourour, N.-A.; Biondi, A.; Lejean, L.; Colonne, C.; Boch, A.-L.; Hawari, M.; Abdennour, L.; Puybasset, L. S100B as an additional prognostic marker in subarachnoid aneurysmal hemorrhage. Crit. Care Med. 2008, 36, 2267–2273. [Google Scholar] [CrossRef] [PubMed]
- Kleindienst, A.; Meissner, S.; Eyupoglu, I.Y.; Parsch, H.; Schmidt, C.; Buchfelder, M. Dynamics of S100B Release into Serum and Cerebrospinal Fluid Following Acute Brain Injury. In Brain Edema XIV; Springer: Vienna, Austria, 2009; pp. 247–250. [Google Scholar] [CrossRef]
- Bianchi, R.; Kastrisianaki, E.; Giambanco, I.; Donato, R. S100B Protein Stimulates Microglia Migration via RAGE-dependent Up-regulation of Chemokine Expression and Release. J. Biol. Chem. 2011, 286, 7214–7226. [Google Scholar] [CrossRef] [PubMed] [Green Version]
- Chaudhry, S.R.; Güresir, A.; Stoffel-Wagner, B.; Fimmers, R.; Kinfe, T.M.; Dietrich, D.; Lamprecht, A.; Vatter, H.; Güresir, E.; Muhammad, S. Systemic High-Mobility Group Box-1. Crit. Care Med. 2018, 46, e1023–e1028. [Google Scholar] [CrossRef] [PubMed]
- Chaudhry, S.; Hafez, A.; Jahromi, B.; Kinfe, T.; Lamprecht, A.; Niemelä, M.; Muhammad, S. Role of Damage Associated Molecular Pattern Molecules (DAMPs) in Aneurysmal Subarachnoid Hemorrhage (aSAH). Int. J. Mol. Sci. 2018, 19, 2035. [Google Scholar] [CrossRef] [PubMed] [Green Version]
- Bell, J.D.; Rhind, S.G.; Battista, A.P.D.; Macdonald, R.L.; Baker, A.J. Biomarkers of Glycocalyx Injury are Associated with Delayed Cerebral Ischemia Following Aneurysmal Subarachnoid Hemorrhage: A Case Series Supporting a New Hypothesis. Neurocrit. Care 2017, 26, 339–347. [Google Scholar] [CrossRef] [PubMed]
- Sen, J.; Belli, A.; Petzold, A.; Russo, S.; Keir, G.; Thompson, E.; Smith, M.; Kitchen, N. Extracellular fluid S100B in the injured brain: A future surrogate marker of acute brain injury? Acta Neurochir. 2005, 147, 897–900. [Google Scholar] [CrossRef]
- Böni, R.; Burg, G.; Doguoglu, A.; Ilg, E.C.; Schäfer, B.W.; Müller, B.; Heizmann, C.W. Immunohistochemical localization of the Ca2+ binding S100 proteins in normal human skin and melanocytic lesions. Br. J. Derm. 1997, 137, 39–43. [Google Scholar] [CrossRef]
- Bouvier, D.; Duret, T.; Rouzaire, P.; Jabaudon, M.; Rouzaire, M.; Nourrisson, C.; Bourgne, C.; Pereira, B.; Evrard, B.; Sapin, V. Preanalytical, analytical, gestational and pediatric aspects of the S100B immuno-assays. Clin. Chem. Lab. Med. 2016, 54, 833–842. [Google Scholar] [CrossRef]
- Dadas, A.; Washington, J.; Marchi, N.; Janigro, D. Improving the clinical management of traumatic brain injury through the pharmacokinetic modeling of peripheral blood biomarkers. Fluids Barriers CNS 2016, 13, 21. [Google Scholar] [CrossRef] [Green Version]


| All (n = 81) | EBI-Mild (n = 53) | EBI-Moderate (n = 16) | EBI-Severe (n = 12) | p-Value | |
|---|---|---|---|---|---|
| Demographic data | |||||
| Median age, years (IQR) | 55 (46–63) | 52 (45–60) * | 58 (49–65) | 61 (57–72) | 0.018 |
| Sex, male, n (%) | 29 (36%) | 23 (43%) | 4 (25%) | 2 (17%) | 0.141 |
| Median SAPSS, (IQR) | 25 (19–39) | 22 (17–27) *** | 41 (28–54) ¥¥¥ | 58 (39–71) | <0.001 |
| Aneurysm characteristics | |||||
| Median size, mm (IQR) | 4.8 (3.5–7.7) | 4.7 (3.6–7.6) | 4.5 (3.3–8.8) | 4.8 (4–6.7) | 0.987 |
| Location, n (%) | |||||
| anterior circulation (ACA, ACoA, AChA, pericalosal) | 29 (36%) | 21 (40%) | 2 (13%) | 6 (50%) | 0.094 |
| posterior circulation (PCA, PCoA) | 8 (10%) | 5 (9%) | 2 (13%) | 1 (8%) | 0.851 |
| MCA | 21 (26%) | 14 (26%) | 5 (31%) | 2 (17%) | 0.588 |
| carotid | 5 (6%) | 4 (8%) | 1 (6%) | 0 | 1 |
| vertebrobasilary | 14 (17%) | 8 (15%) | 4 (25%) | 2 (17%) | 0.496 |
| Hydrocephalus, n (%) | 30 (37%) | 11 (21%) | 12 (75%) ¥¥¥ | 7 (58%) | <0.001 |
| Sedation at admission, n (%) | 23 (28%) | 2 (4%) *** | 12 (75%) ¥¥¥ | 9 (75%) | <0.001 |
| Re-bleeding, n (%) | 4 (5%) | 0 ** | 1 (6%) | 3 (25%) | 0.003 |
| Aneurysm treatment, number of coiling, n (%) | 68 (84%) | 47 (89%) | 13 (81%) | 8 (67%) | 0.134 |
| Median time from admission to treatment, h (IQR) | 14 (5–21) | 14 (8–20) | 14 (3–21) | 43 (15–68) | 0.150 |
| Aneurysm treatment complication, n (%) | 15 (19%) | 8 (15%) | 5 (31%) | 2 (17%) | 0.259 |
| WFNS at first physician contact, n (%) | |||||
| 1–2 | 55 (68%) | 46 (87%) ** | 5 (31%) ¥¥¥ | 4 (33%) | <0.001 |
| 3–5 | 26 (32%) | 7 (13%) ** | 11 (69%) ¥¥¥ | 8 (67%) | <0.001 |
| Fisher grade, n (%) | |||||
| 1–2 | 8 (10%) | 8 (15%) | 0 | 0 | 0.158 |
| 3–4 | 73 (90%) | 45 (85%) | 16 (100%) | 12 (100%) | 0.158 |
| Median Hijdra score (IQR) | 18 (12.5–21.5) | 15 (10–19.5) ** | 20 (19;22.5) ¥ | 20.5 (18.5;23) | <0.001 |
| SEBES > 2, n (%) | 64 (79%) | 39 (73.6%) | 14 (87.5%) | 11 (91.7%) | 0.305 |
| ICH, n (%) | 17 (21%) | 8 (15.1%) | 4 (25%) | 5 (41.7%) | 0.107 |
| Median GCS at ICU admission, (IQR) | 14 (3–15) | 15 (14–15) | 3 (3–4) | 3 (3–6) | <0.001 |
| DCI occurrence, n (%) | 20 (25%) | 10 (19%) | 7 (44%) | 3 (25%) | 0.116 |
| Median mRS at ICU discharge (IQR) | 3 (1–4) | 2 (1–3)*** | 3 (3–4) *, ¥ | 5 (5–6) | <0.001 |
| Median length of ICU stay, days (IQR) | 11 (9–16) | 10 (9–13) | 16 (13–18) ¥¥ | 11 (4–18) | 0.012 |
| All Patients (n = 81, M-GCS < 6 at Day 3 n = 12) | Patients with M-GCS < 6 at Admission (n = 25, M-GCS < 6 at Day 3 n = 9) | |||
|---|---|---|---|---|
| S100B Max | GCS at Admission | S100B Max | GCS at Admission | |
| AUC, % (95% CI) | 86.7 (73.6;95.9) | 84.1 (73.9–92.6) | 88.2 (72.2;100) | 62.5 (53.1;72.0) |
| Best threshold (95% CI) | 0.165 µg/L (0.100;0.494) | 4.5 (4.5–14.5) | 0.336 µg/L (0.123;0.951) | 4.5 (4.5;8.5) |
| Se, % (95% CI) | 83.3 (58.3;100) | 75.0 (50;100) | 77.7 (44.4;100) | 100 |
| Sp, % (95% CI) | 73.9 (62.3;84.1) | 82.6 (73.9;91.3) | 93.8 (81.3;100) | 25 (6.3;43.8) |
| PLR (95% CI) | 3.2 (2.0;5.1) | 4.3 (2.3;7.9) | 12.4 (1.8;85.7) | 1.3 (0.9–1.8) |
| NLR (95% CI) | 0.23 (0.06;0.81) | 0.30 (0.11;0.81) | 0.24 (0.07;0.81) | 0.19 (0.01;3.14) |
| Gray zone µg/L | 0.104–0.256 | 13.5–4.5 | 0.144–0.336 | 4.5–3 |
| Inter-LHR | 0.16–5.75 | 0.25–4.32 | 0.22–12.4 | 1.2–0.19 |
| % in gray zone | 38 | 14 | 32 | 84 |
© 2020 by the authors. Licensee MDPI, Basel, Switzerland. This article is an open access article distributed under the terms and conditions of the Creative Commons Attribution (CC BY) license (http://creativecommons.org/licenses/by/4.0/).
Share and Cite
Balança, B.; Ritzenthaler, T.; Gobert, F.; Richet, C.; Bodonian, C.; Carrillon, R.; Terrier, A.; Desmurs, L.; Perret-Liaudet, A.; Dailler, F. Significance and Diagnostic Accuracy of Early S100B Serum Concentration after Aneurysmal Subarachnoid Hemorrhage. J. Clin. Med. 2020, 9, 1746. https://doi.org/10.3390/jcm9061746
Balança B, Ritzenthaler T, Gobert F, Richet C, Bodonian C, Carrillon R, Terrier A, Desmurs L, Perret-Liaudet A, Dailler F. Significance and Diagnostic Accuracy of Early S100B Serum Concentration after Aneurysmal Subarachnoid Hemorrhage. Journal of Clinical Medicine. 2020; 9(6):1746. https://doi.org/10.3390/jcm9061746
Chicago/Turabian StyleBalança, Baptiste, Thomas Ritzenthaler, Florent Gobert, Caroline Richet, Carole Bodonian, Romain Carrillon, Anne Terrier, Laurent Desmurs, Armand Perret-Liaudet, and Frédéric Dailler. 2020. "Significance and Diagnostic Accuracy of Early S100B Serum Concentration after Aneurysmal Subarachnoid Hemorrhage" Journal of Clinical Medicine 9, no. 6: 1746. https://doi.org/10.3390/jcm9061746