Inter-Individual Differences in Cognitive Response to a Single Bout of Physical Exercise—A Randomized Controlled Cross-Over Study

Abstract
:1. Introduction
2. Experimental Section
2.1. Subjects
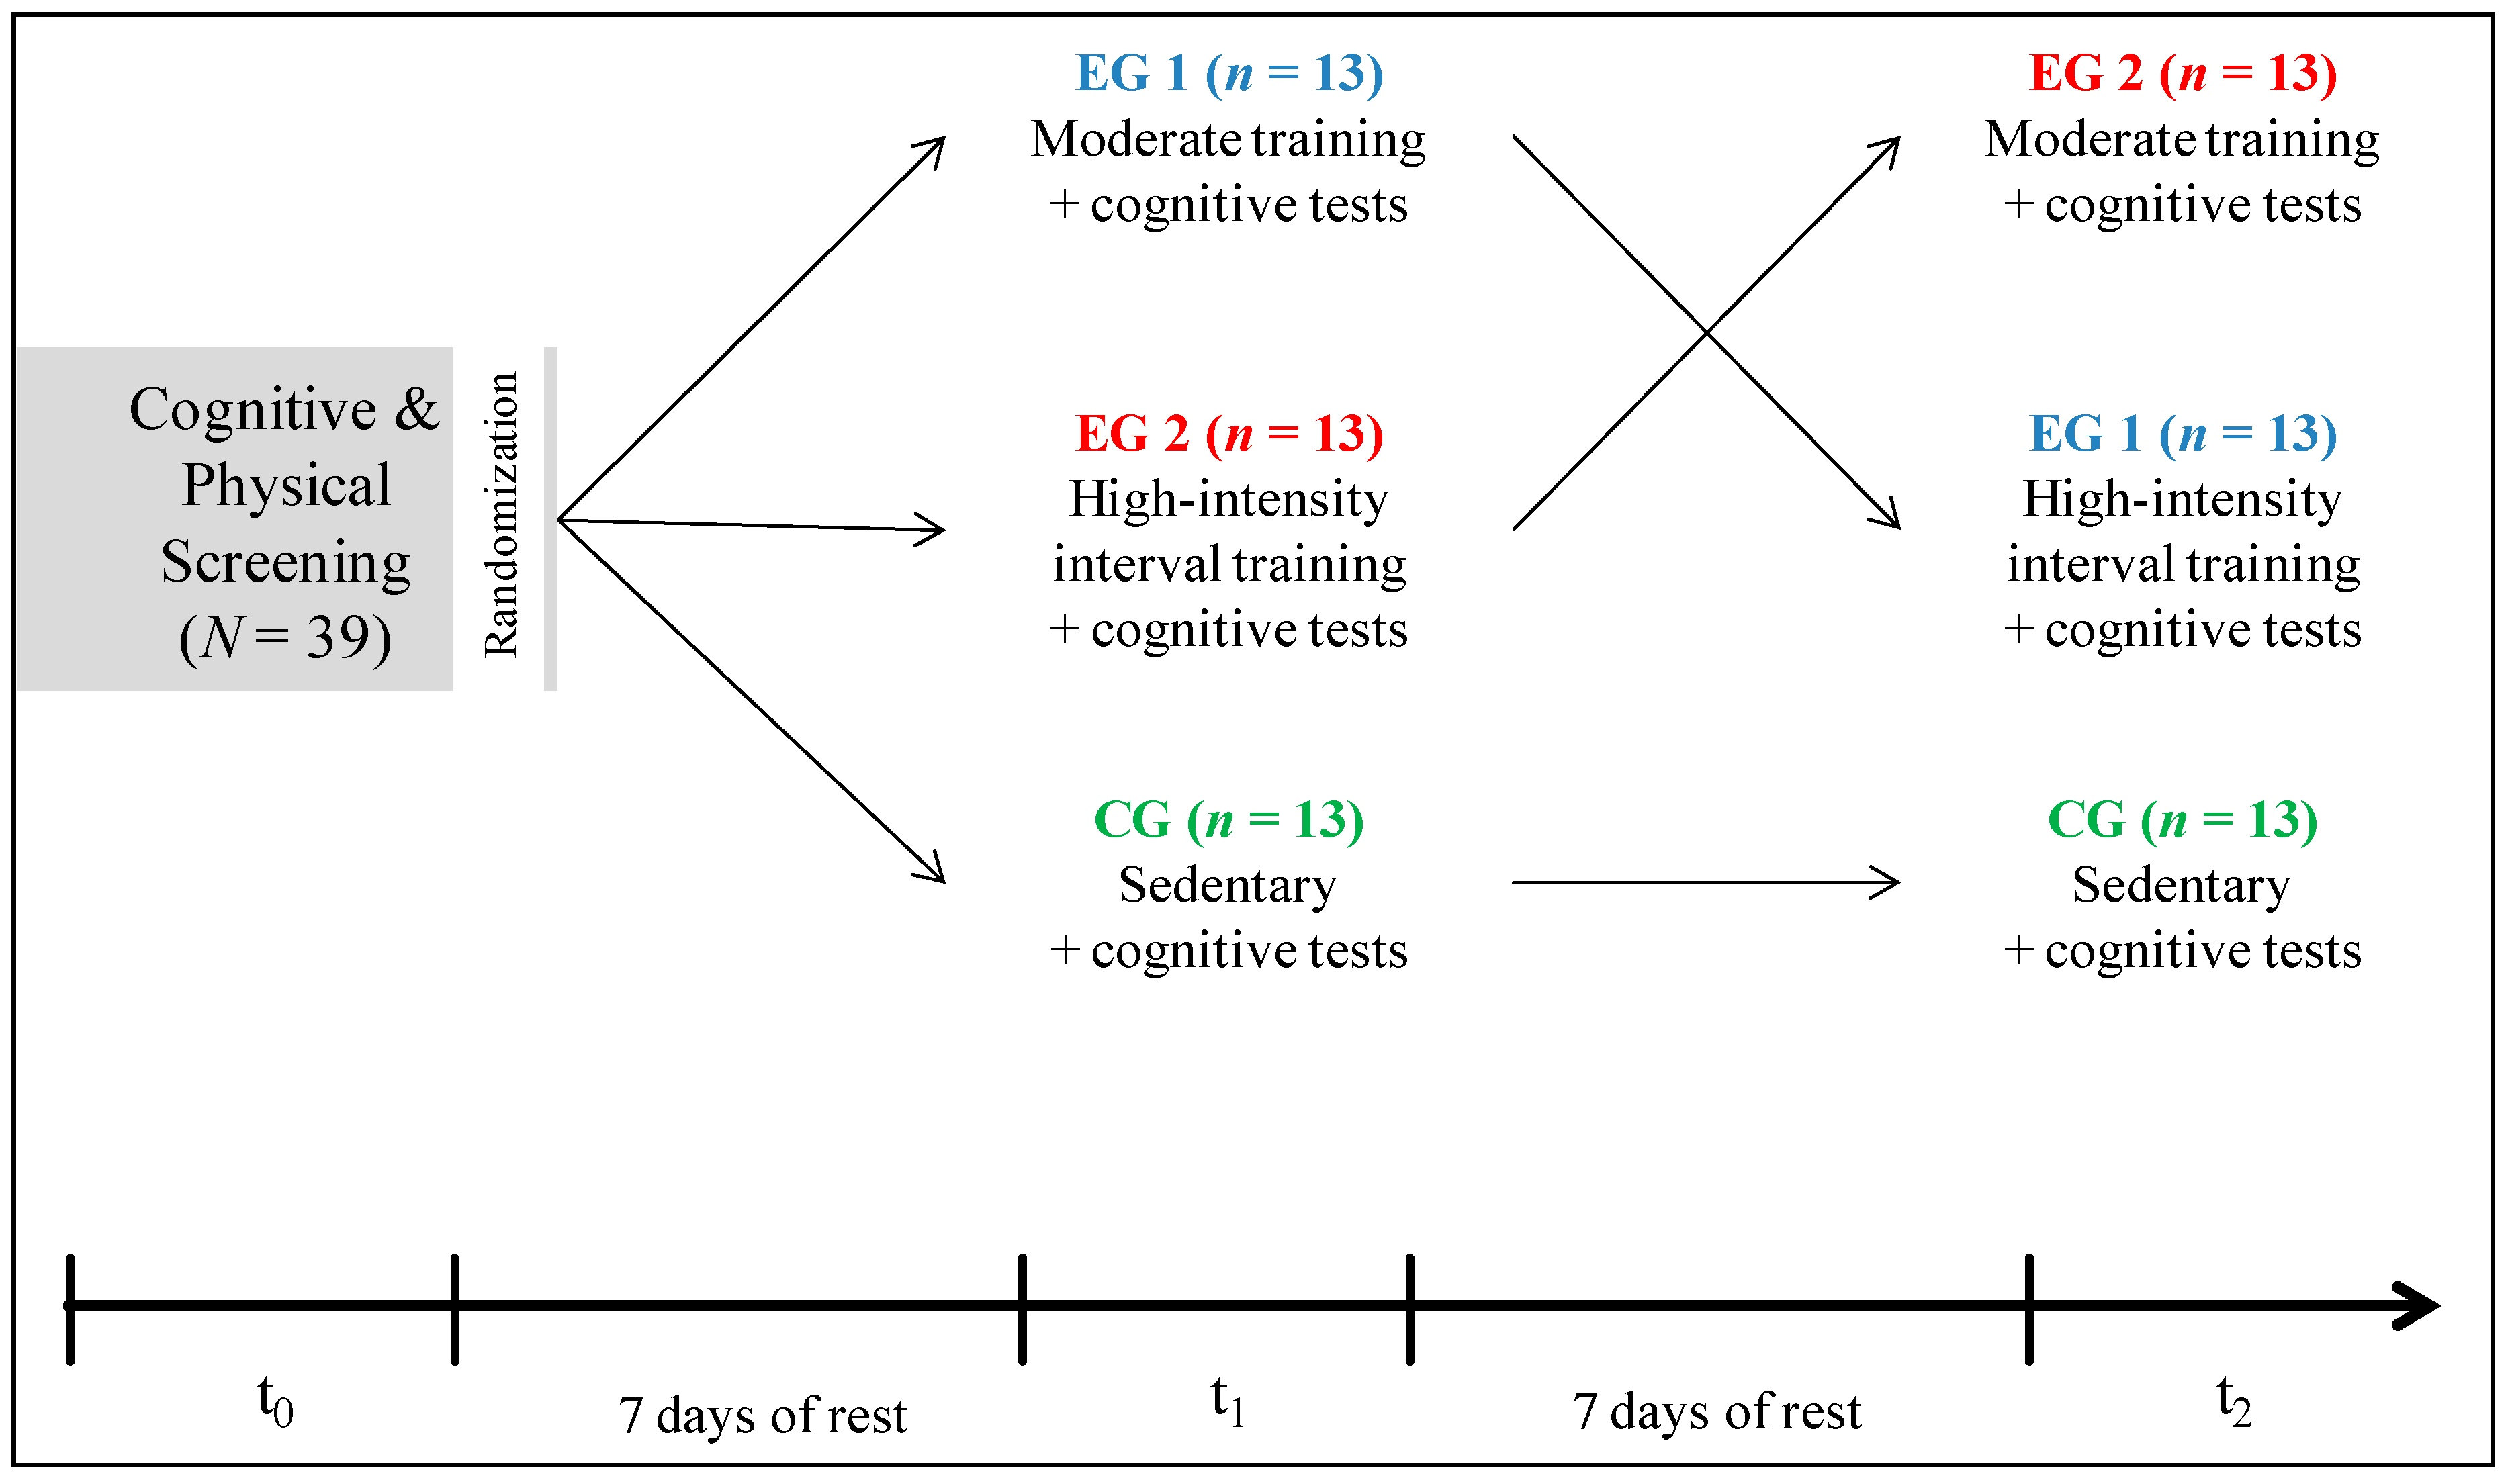
2.2. Experimental Design
2.2.1. Screening (t0)—Incremental Step Test
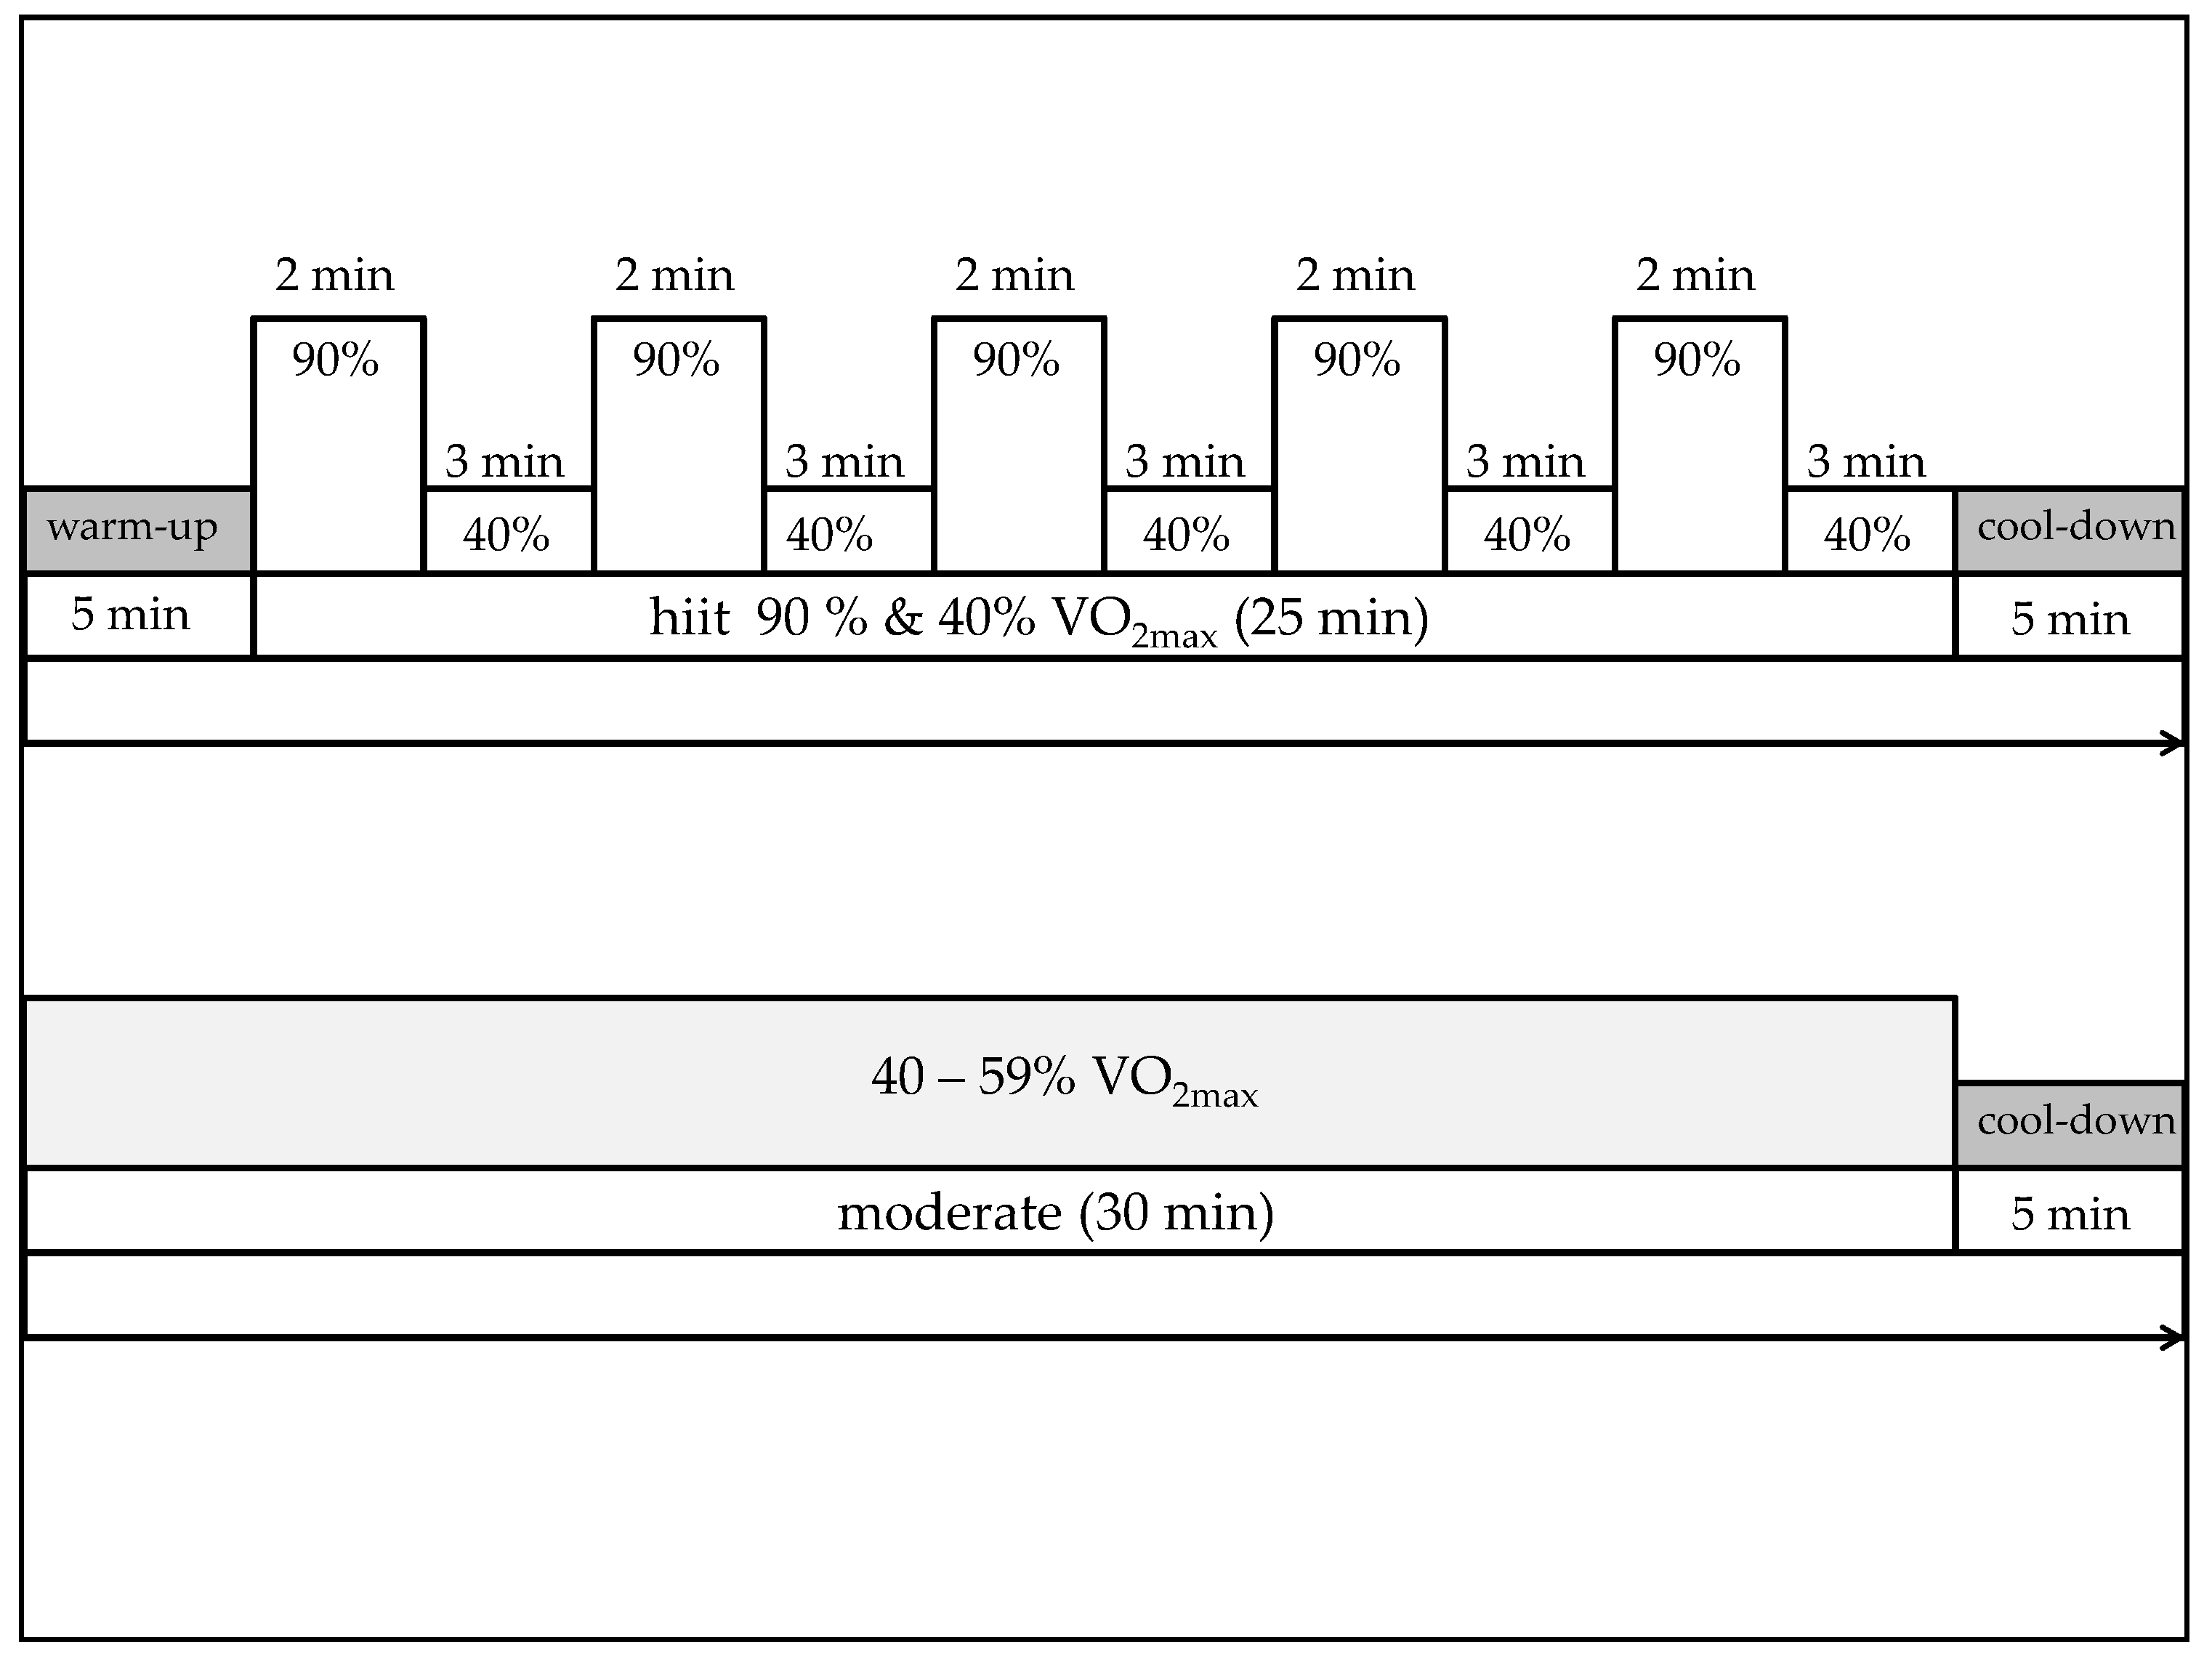
2.2.2. Exercise Conditions (t1, t2)
2.2.3. Neuropsychological Measures
2.3. Statistical Analysis
3. Results
3.1. Demographic Data
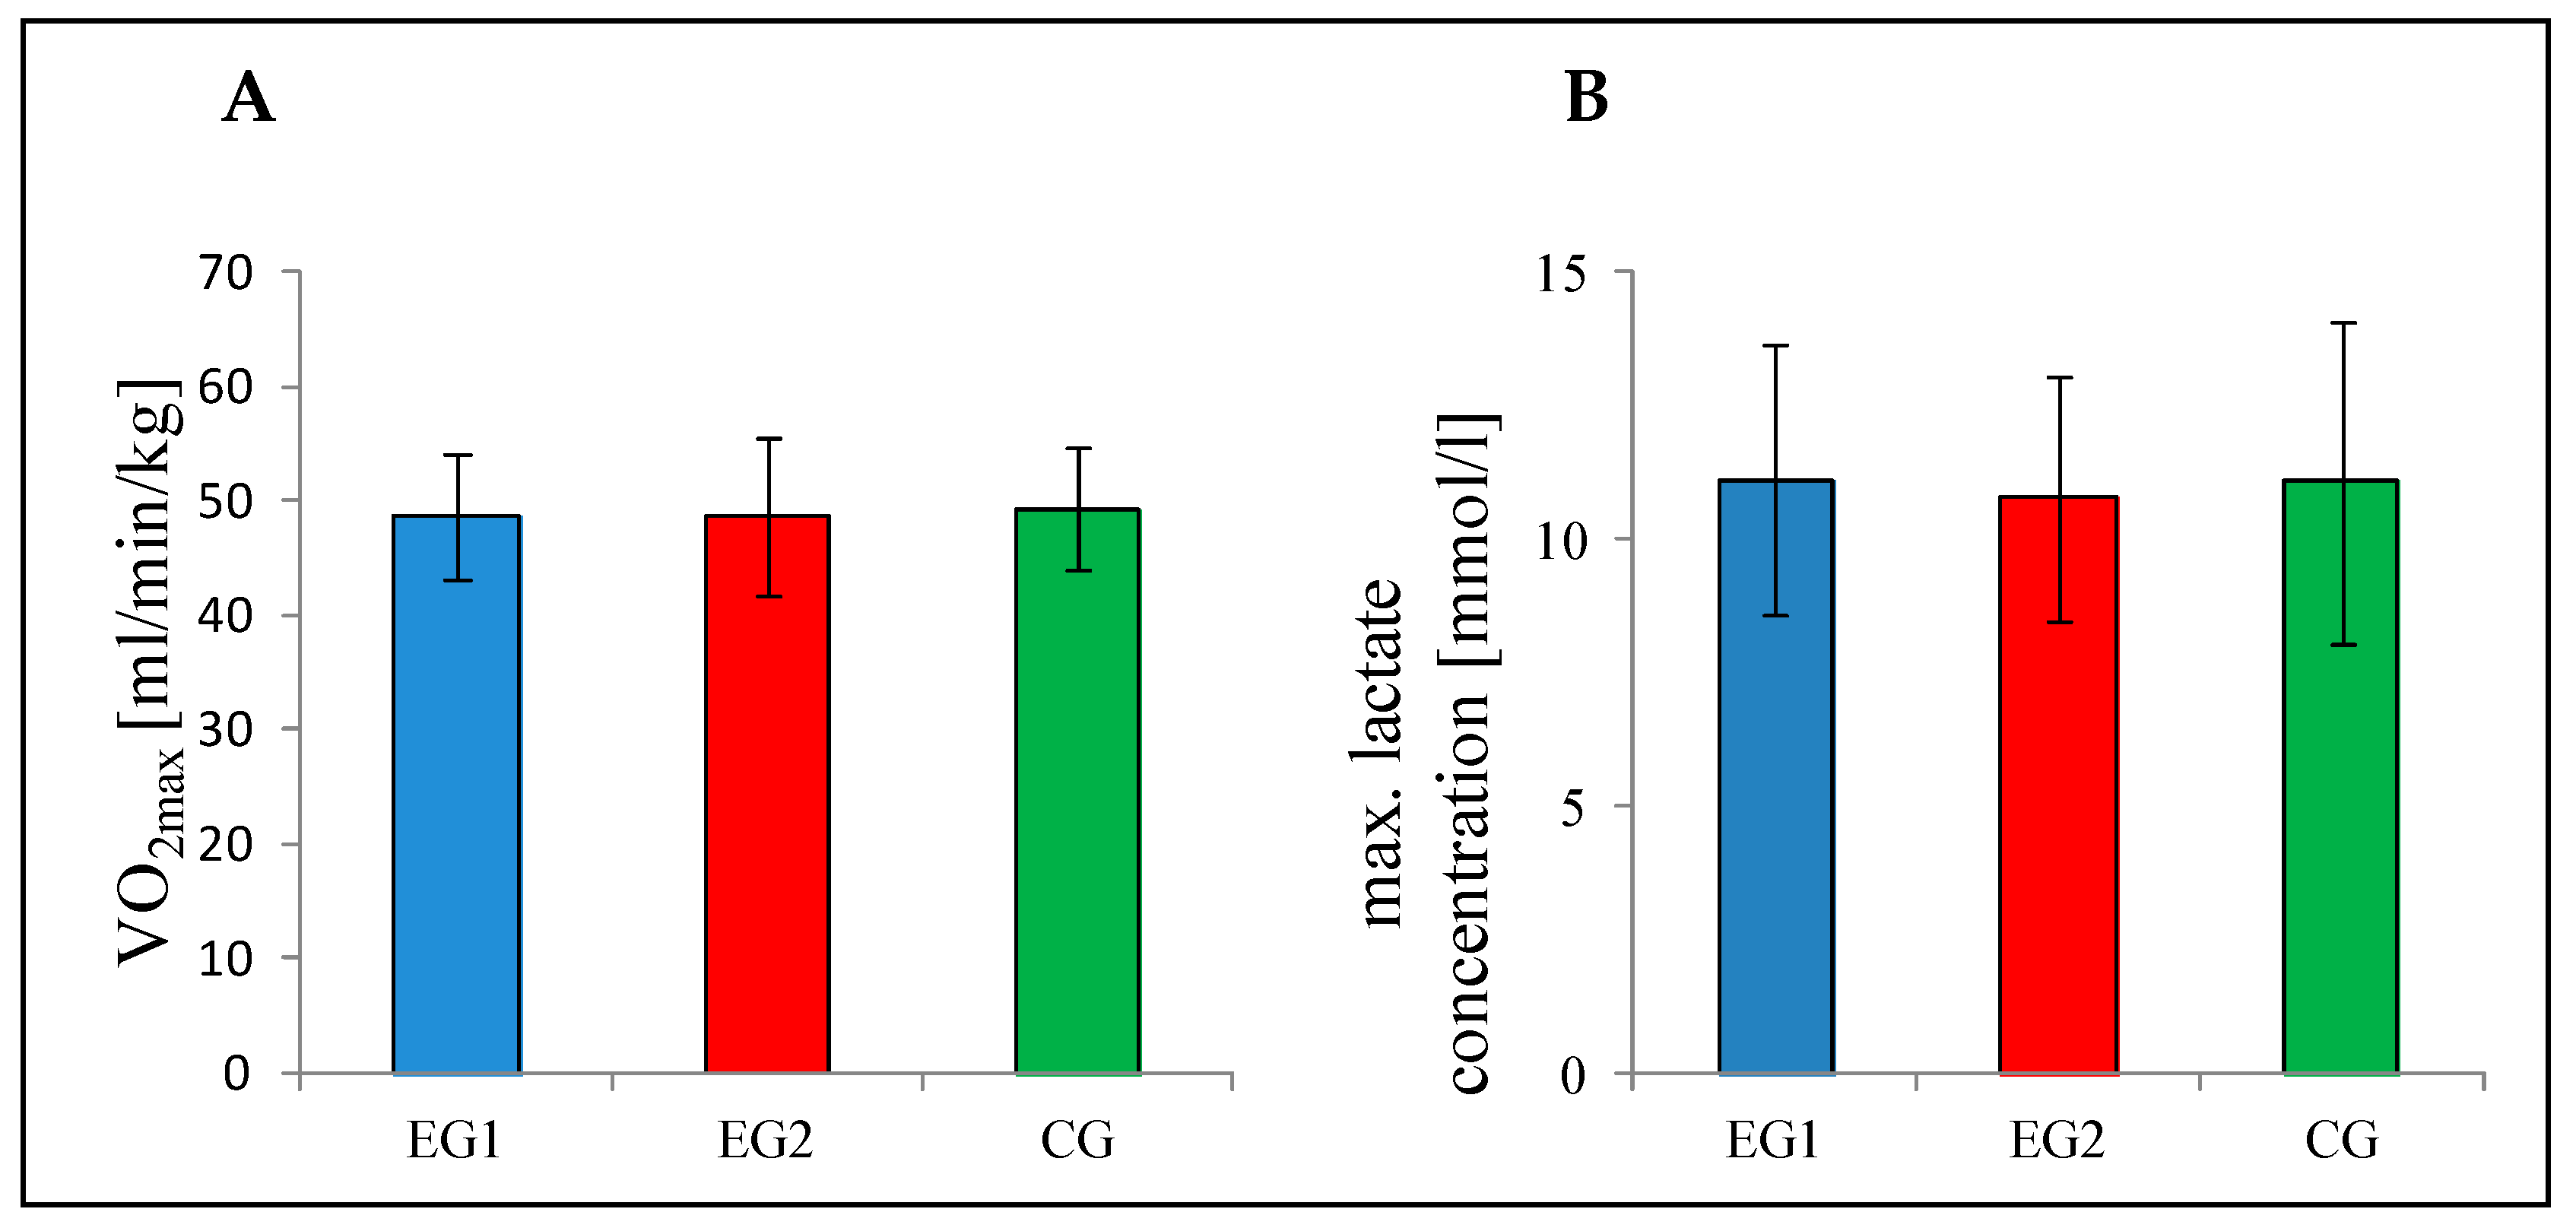
3.2. Baseline (t0)
3.3. Group Analysis
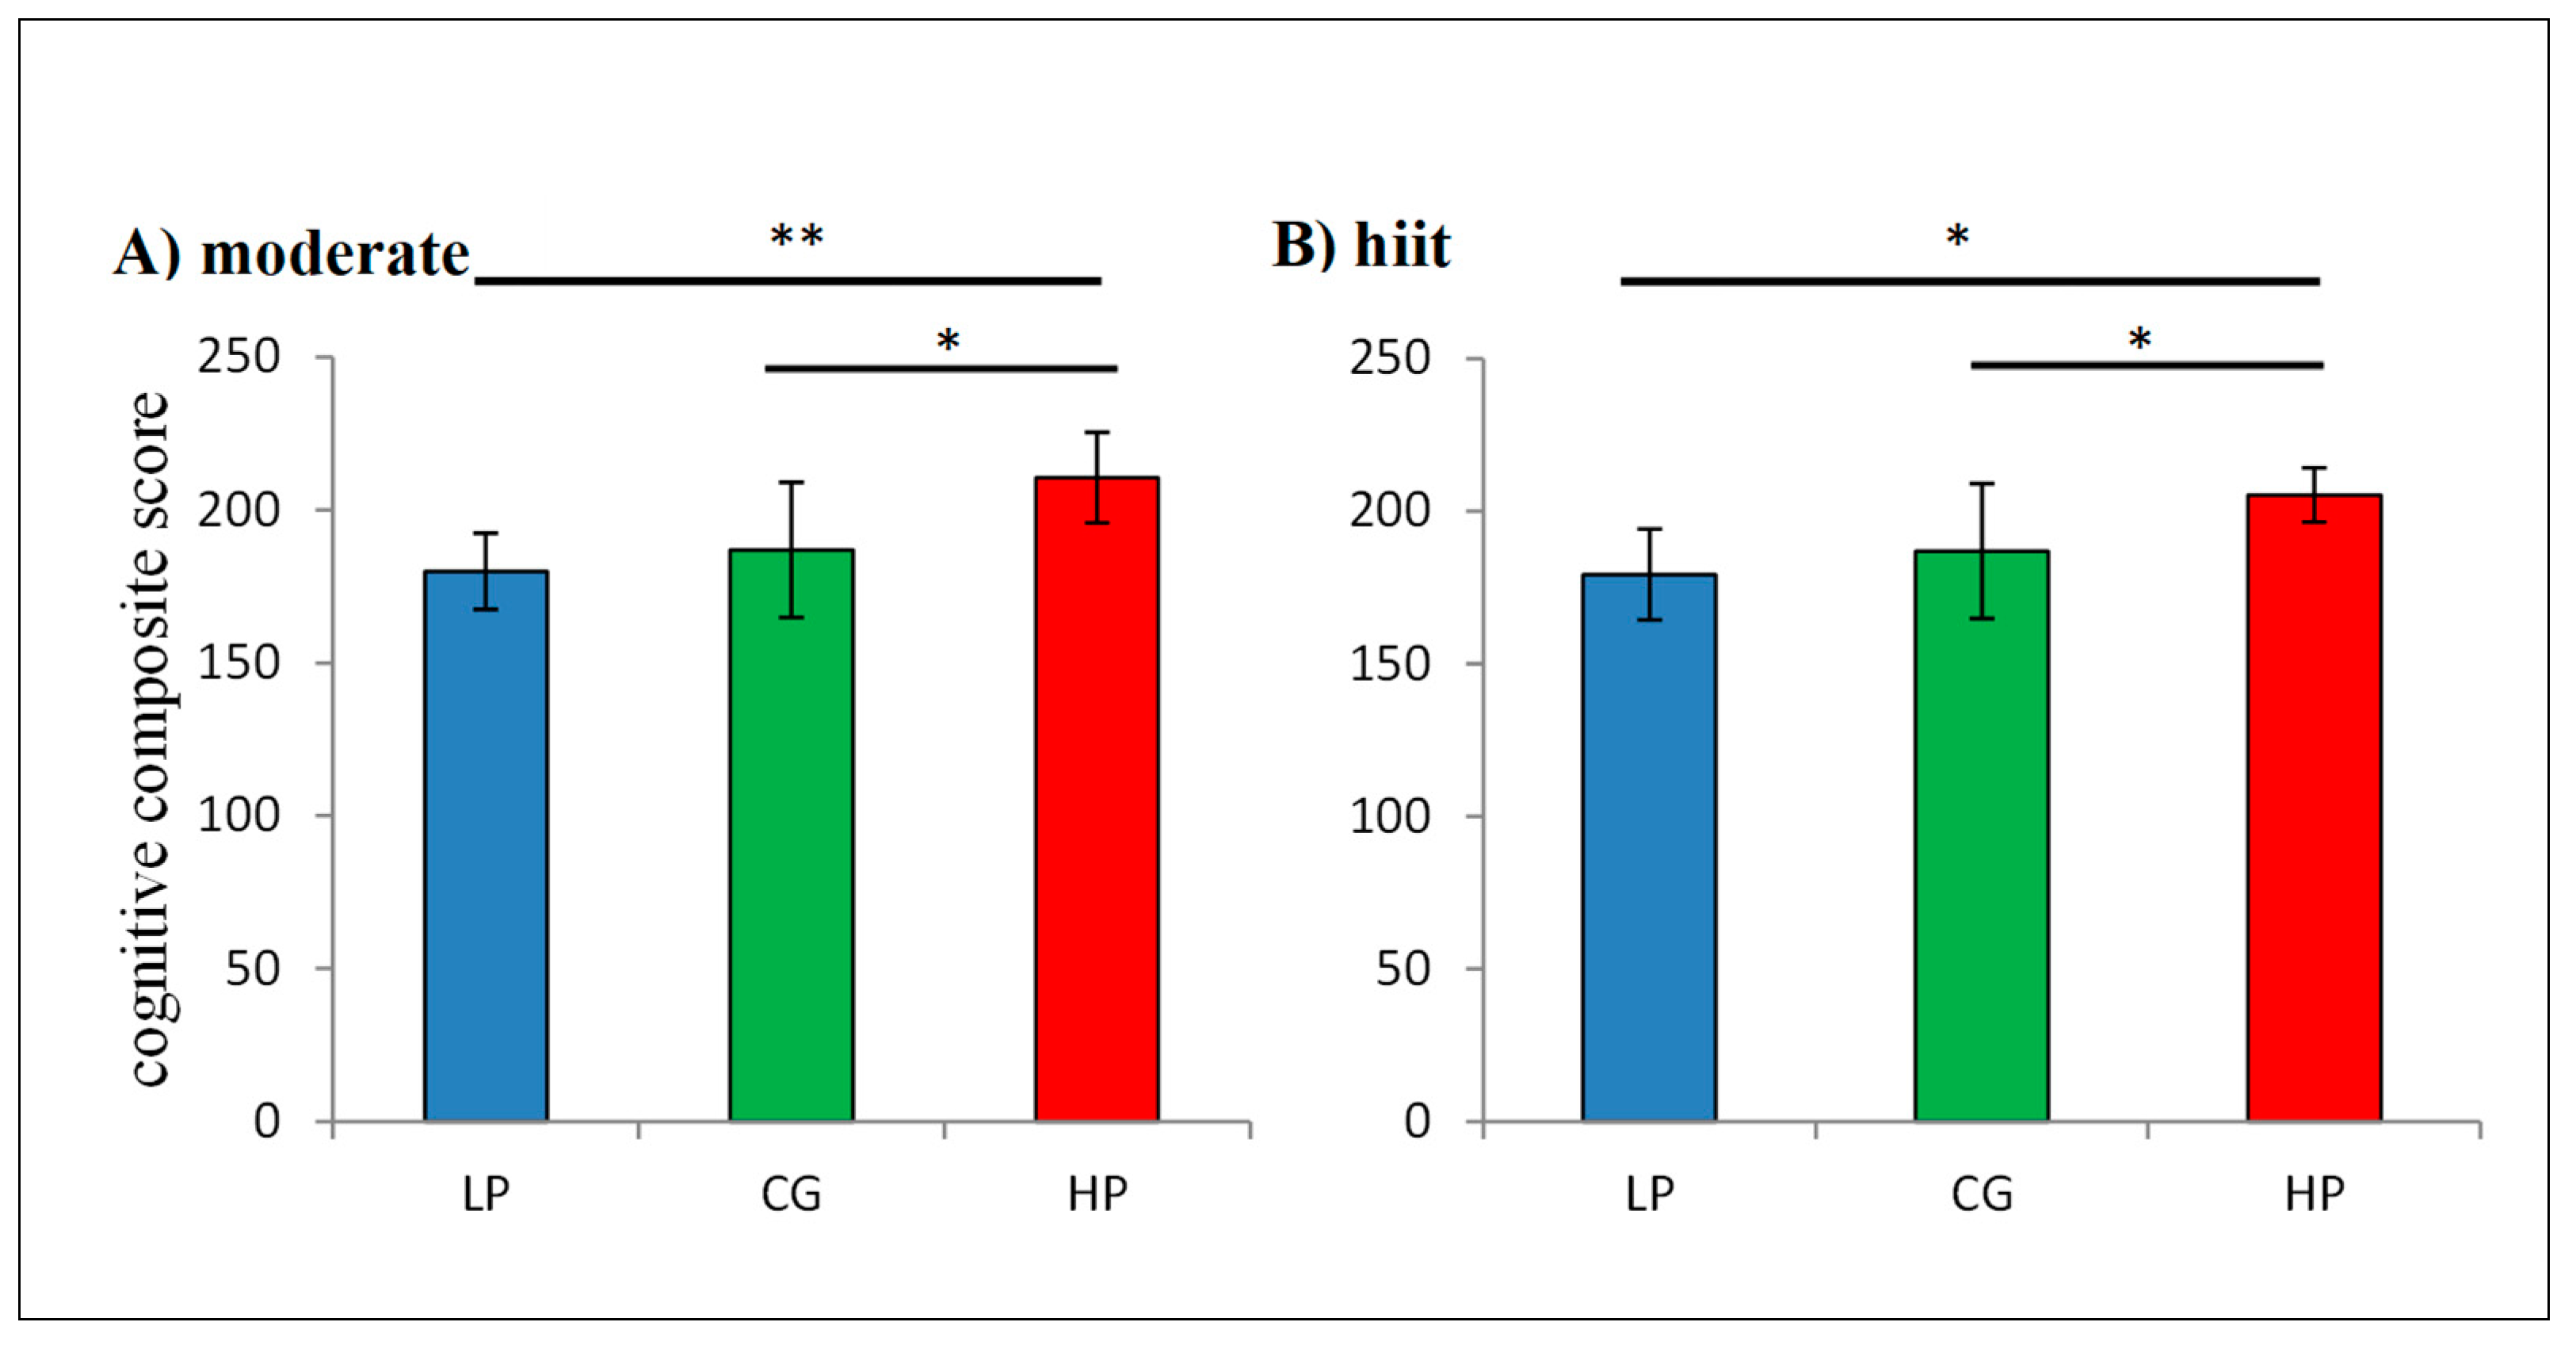
3.4. Median Split
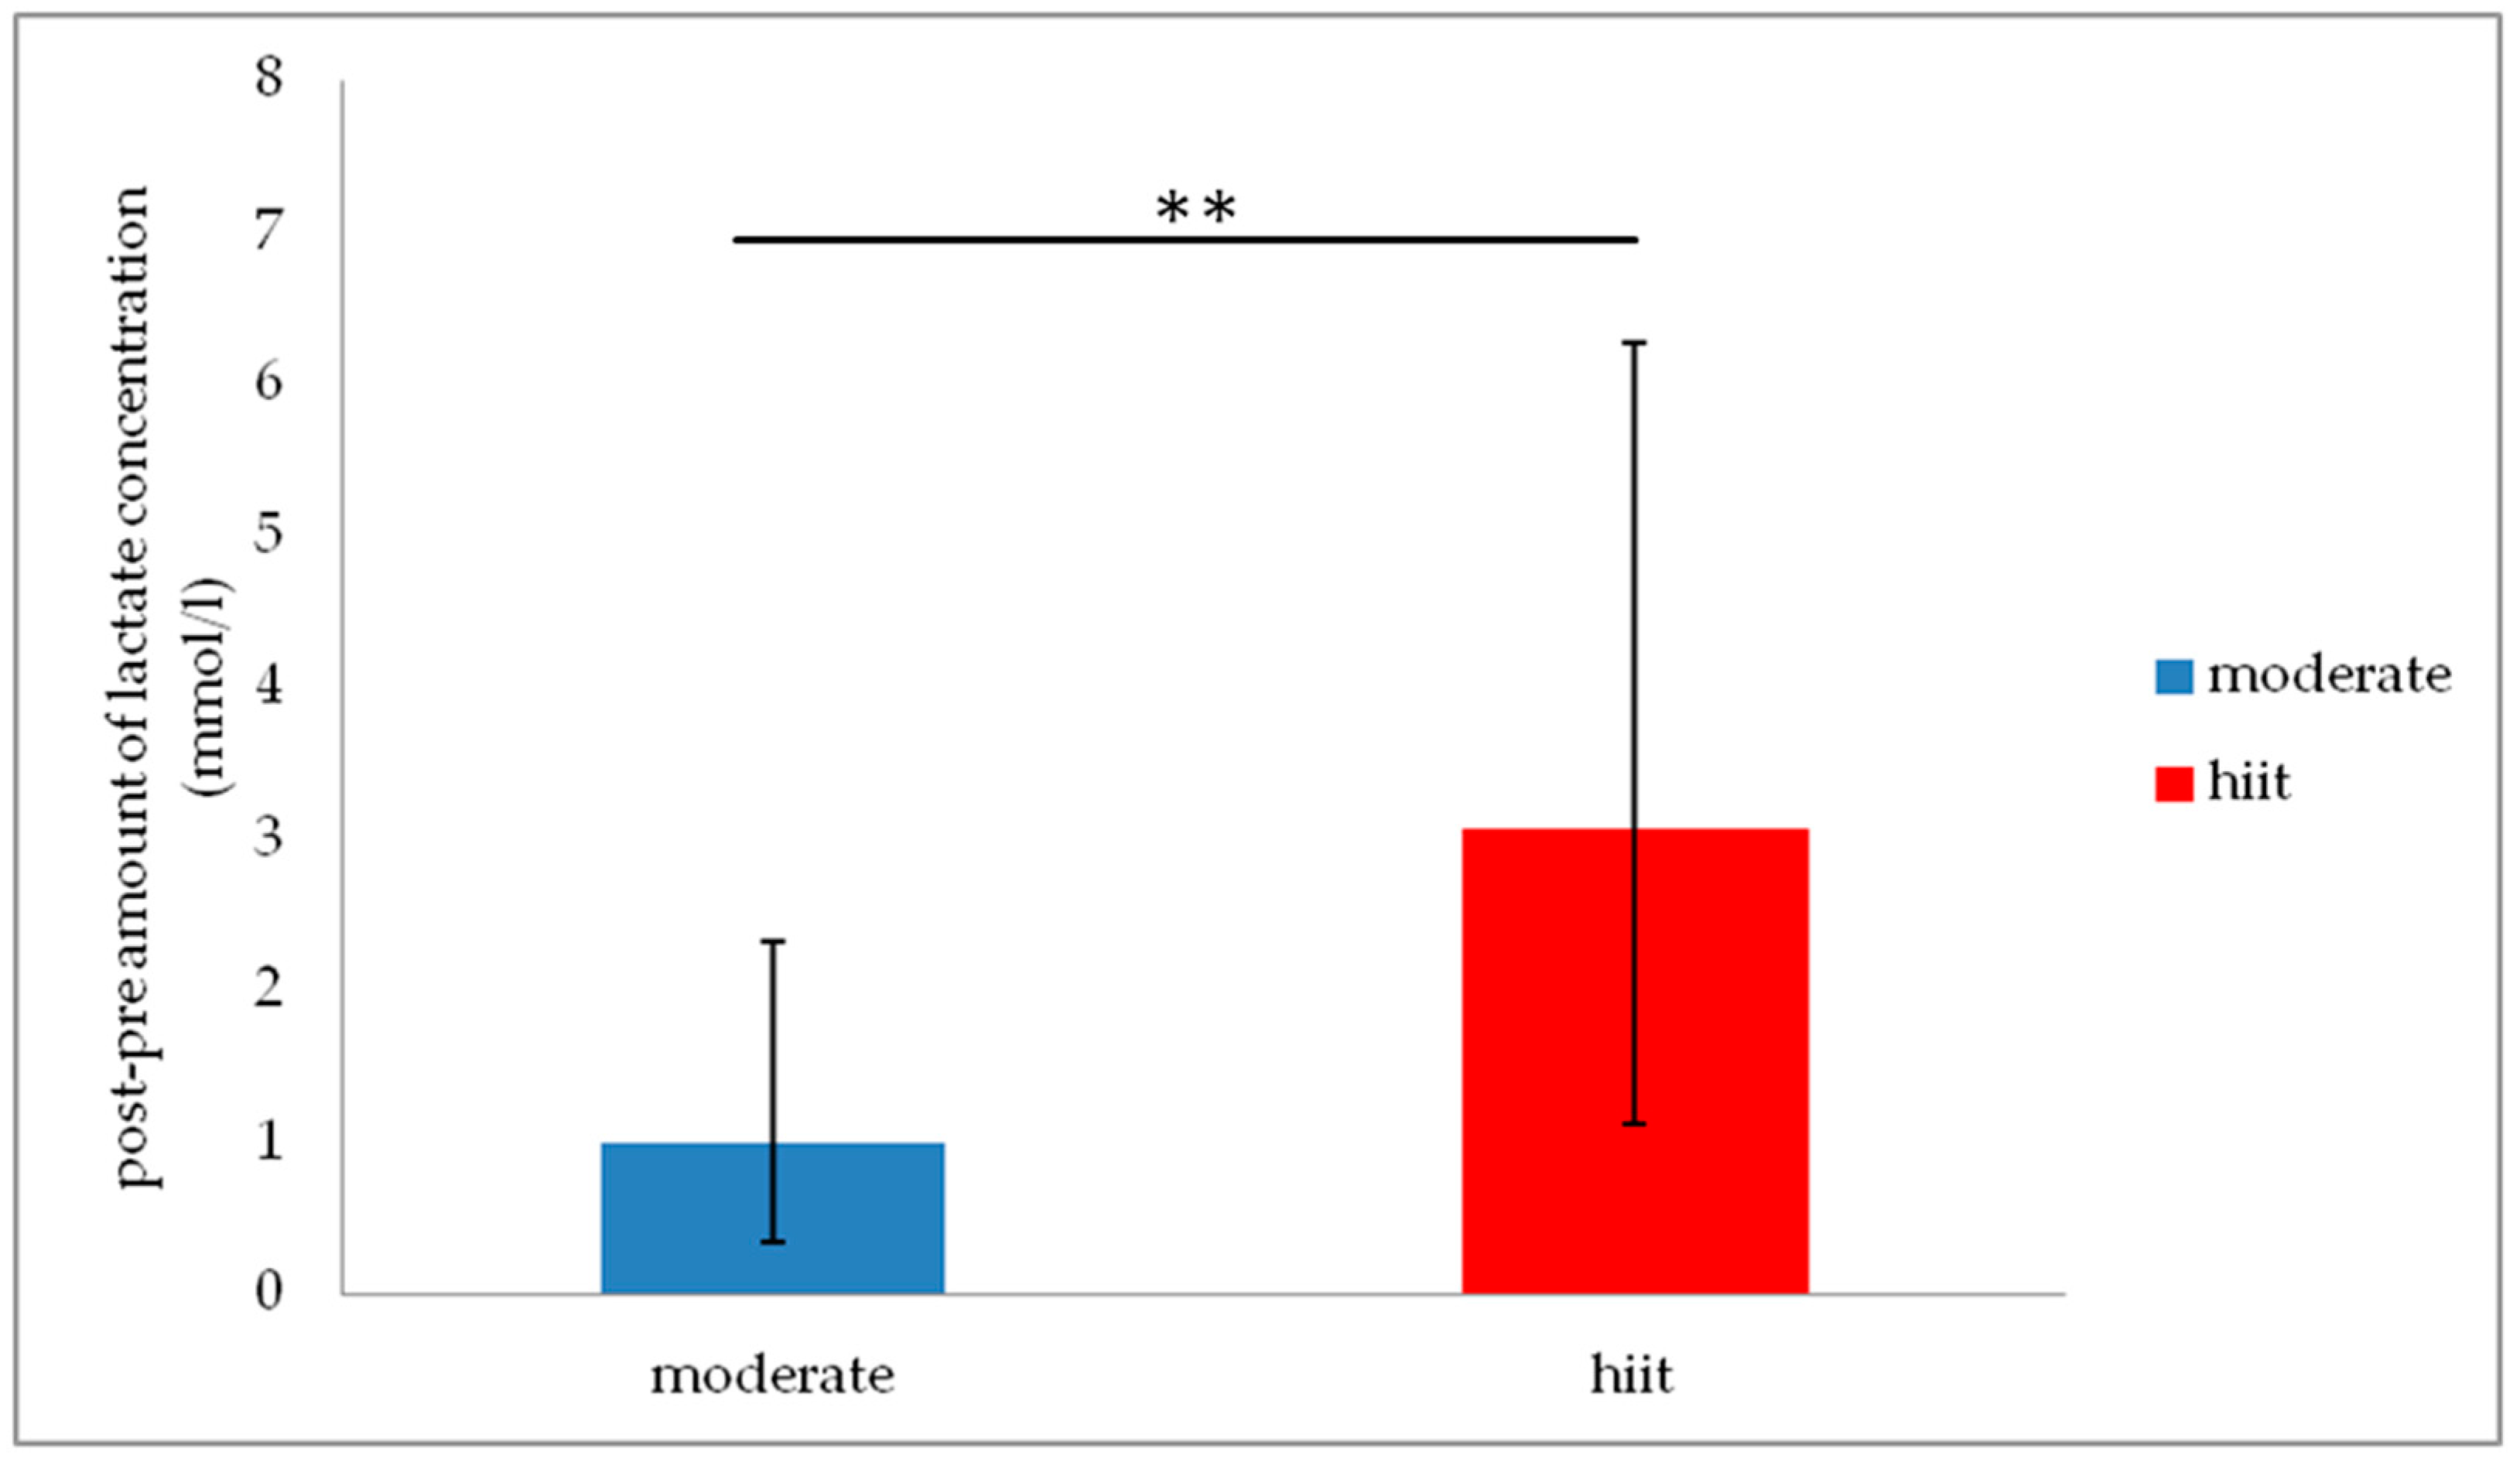
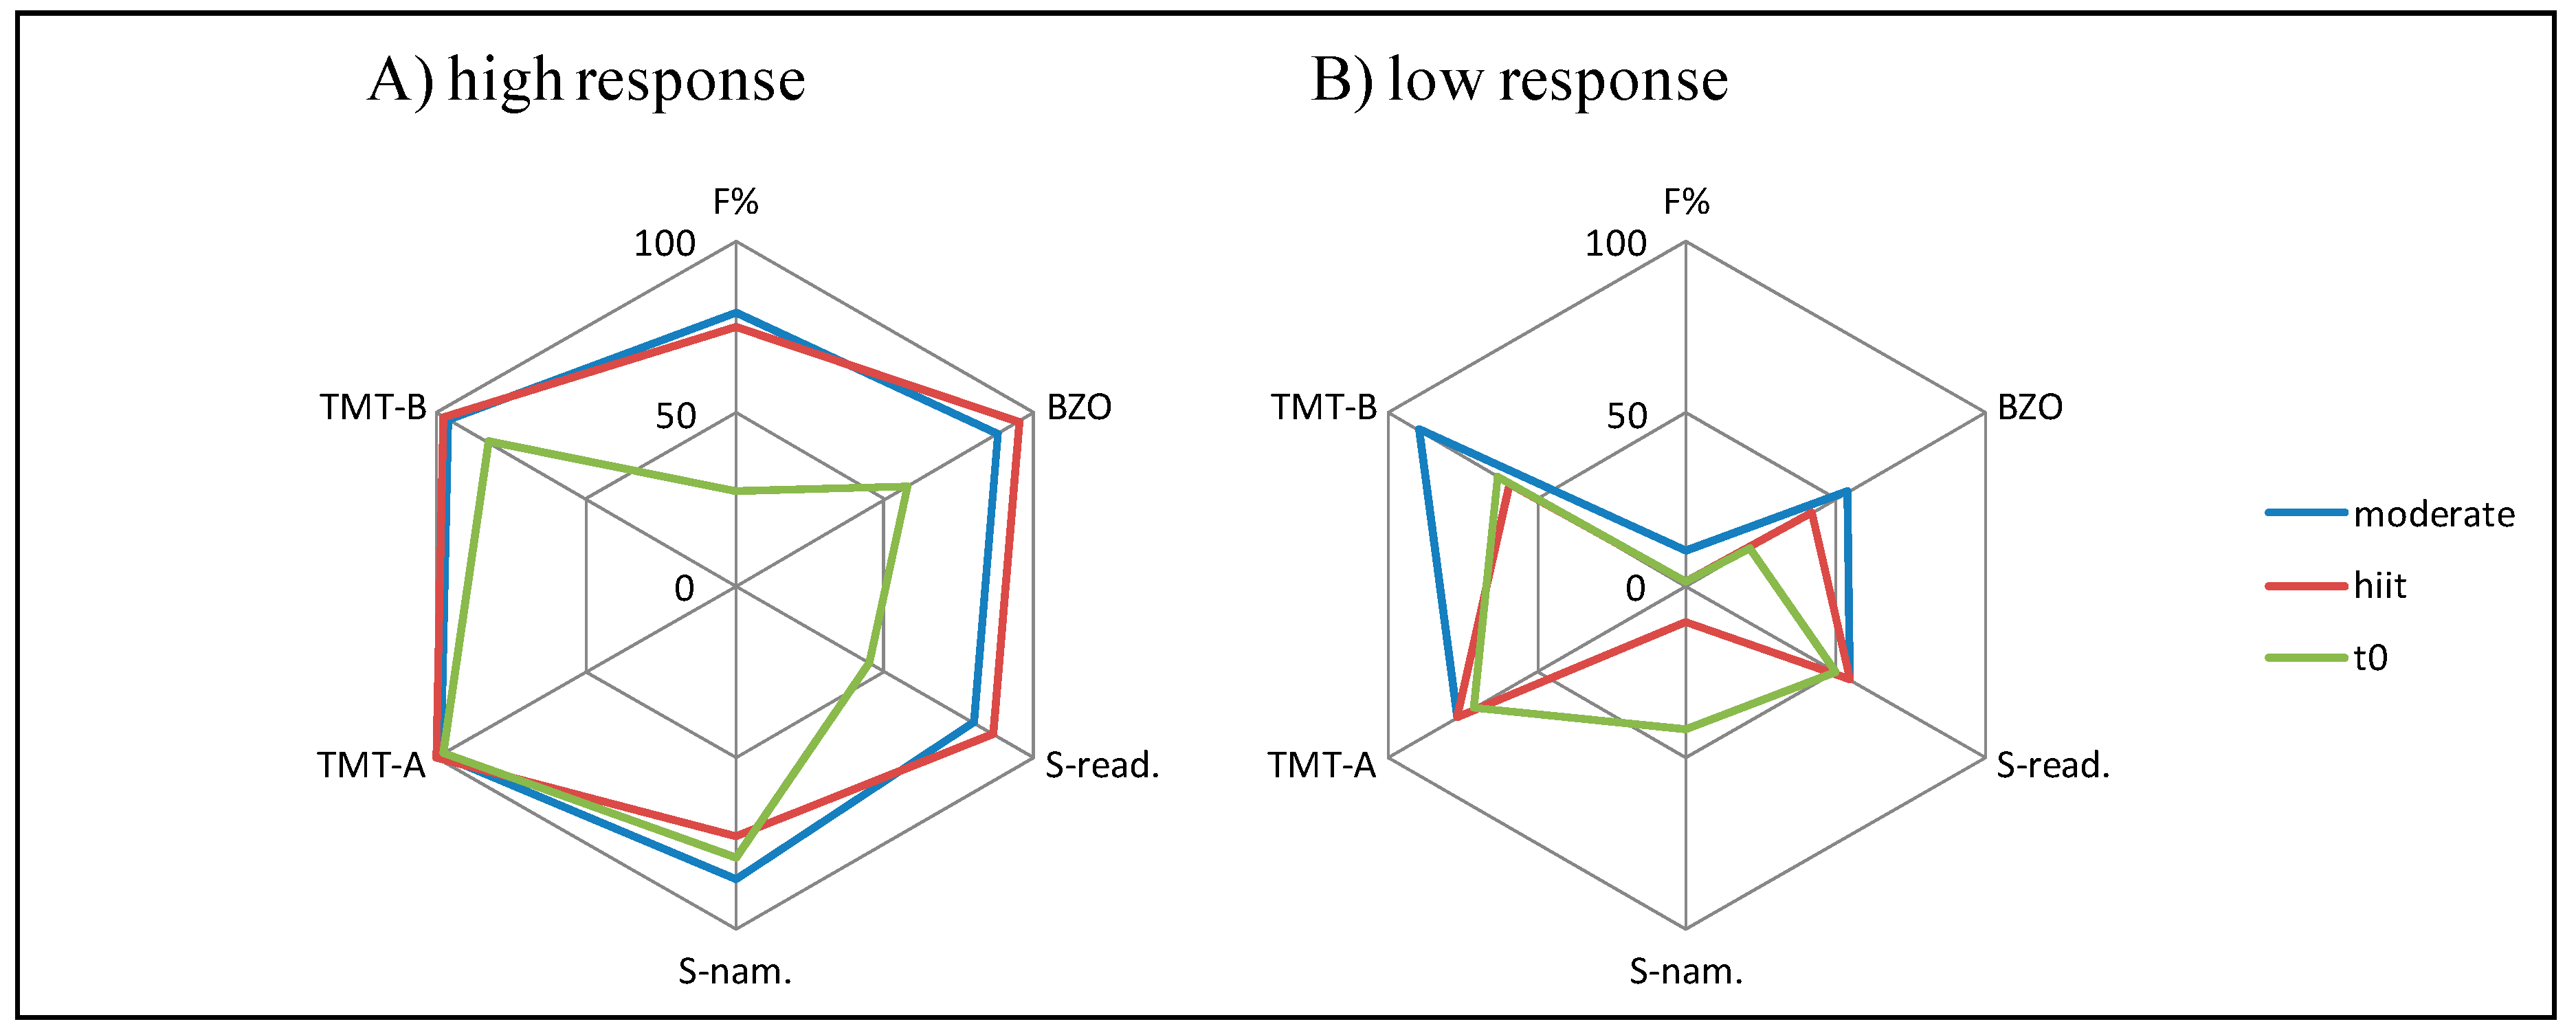
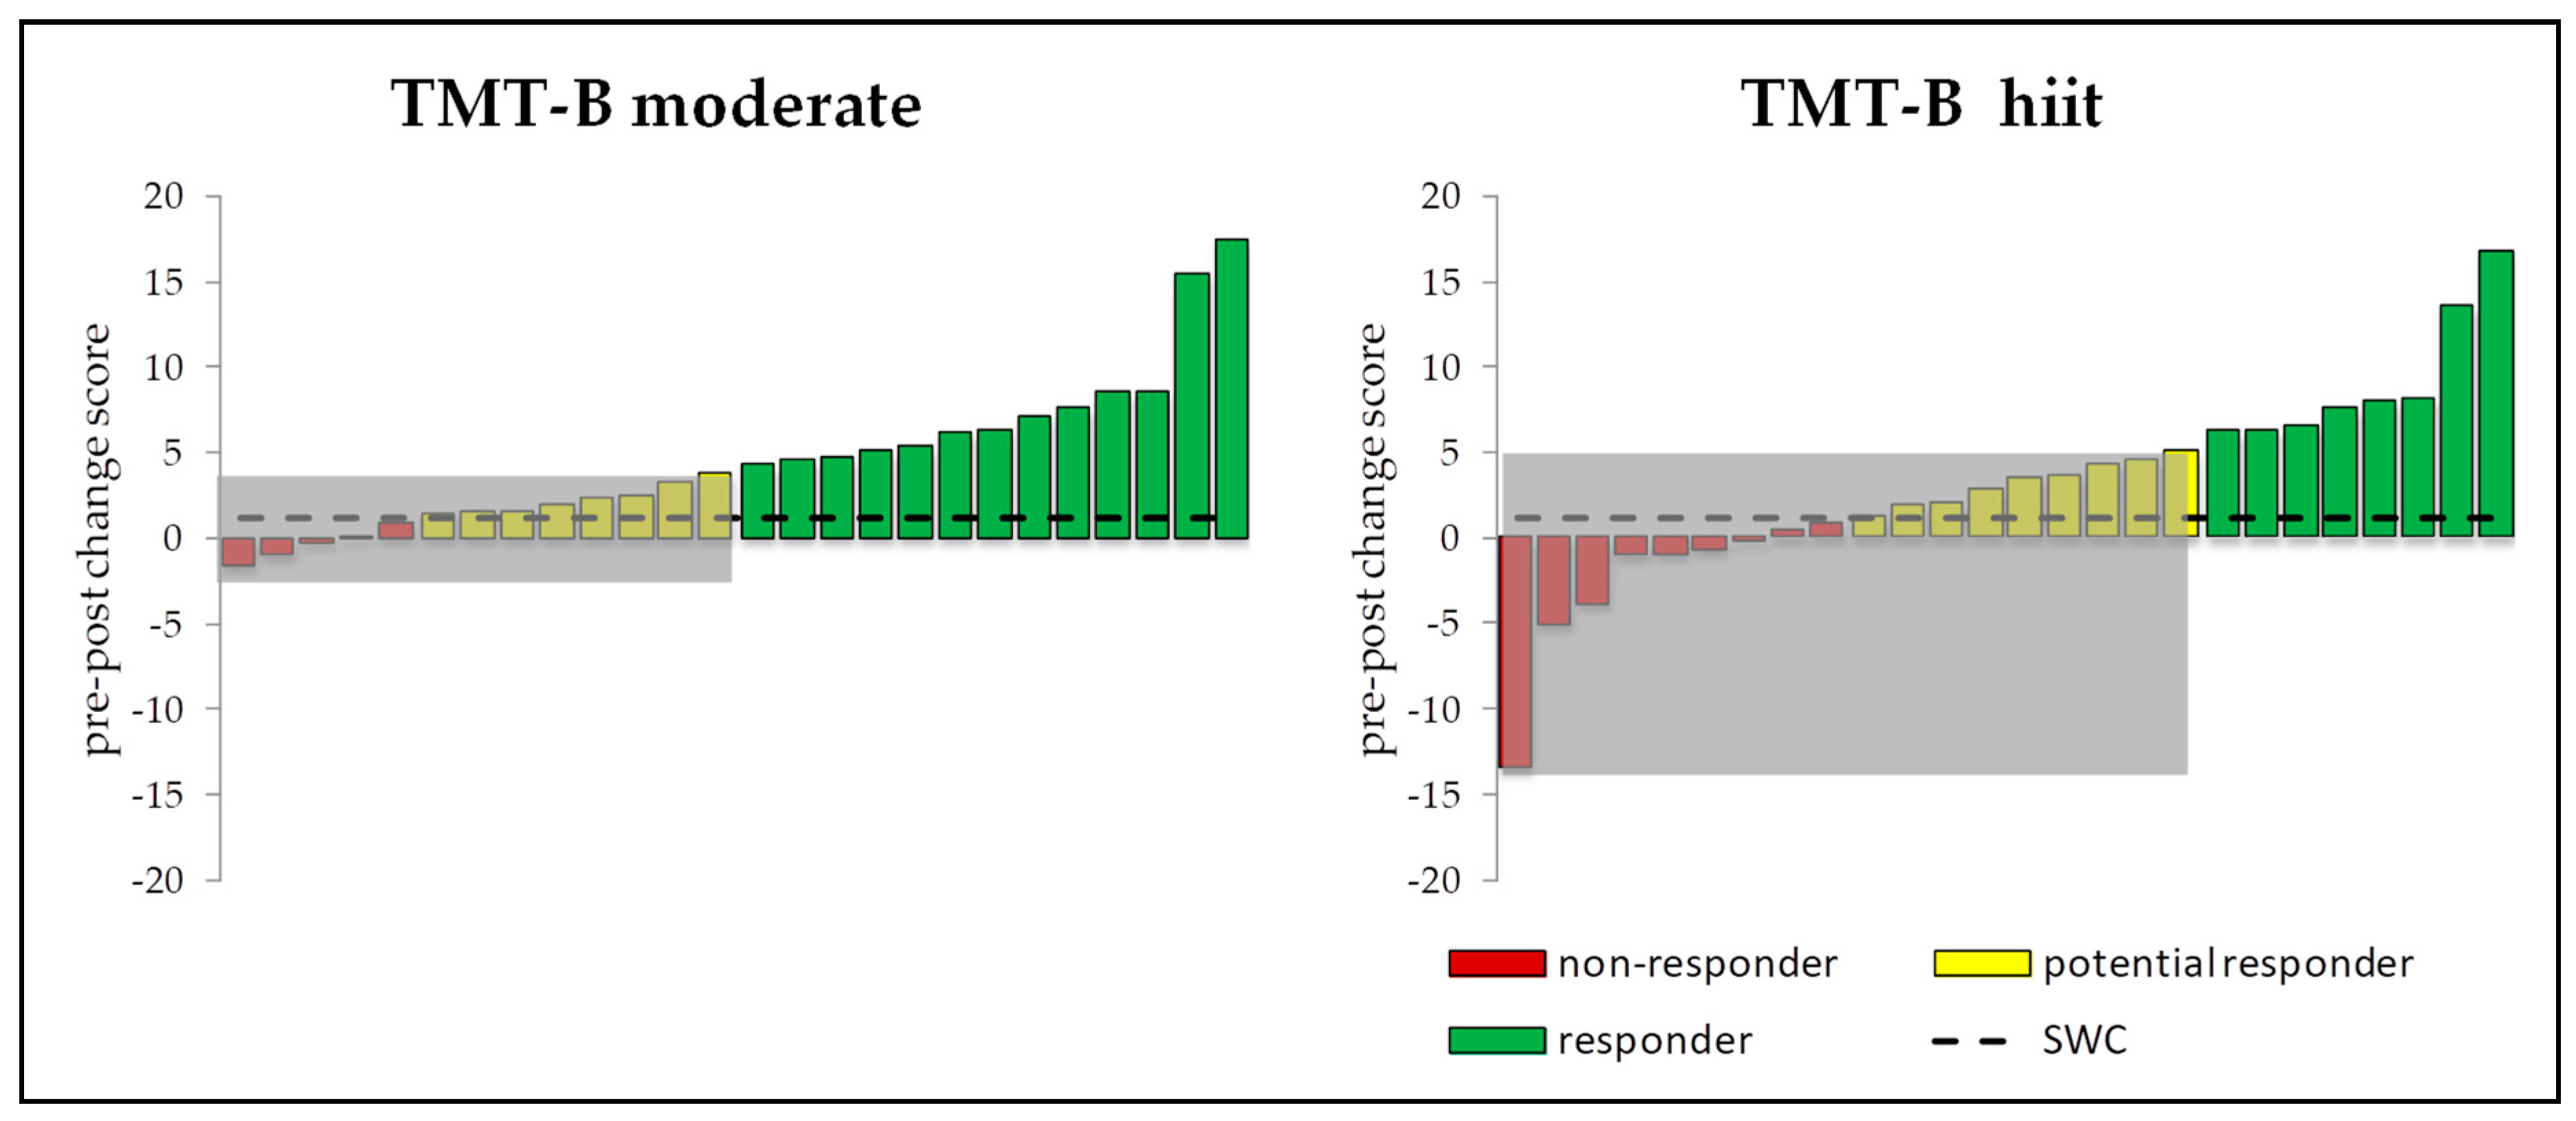
3.5. Intra-Individual and Inter-Individual Changes
4. Discussion
4.1. Responders vs. Non-Responders
4.2. Neurobiological Mechanisms of Exercise Induced Cognitive Enhancement
4.3. Limitations
5. Conclusions
Author Contributions
Conflicts of Interest
References
- Ahlskog, J.E.; Geda, Y.E.; Graff-Radford, N.R.; Petersen, R.C. Physical exercise as a preventive or disease-modifying treatment of dementia and brain aging. Mayo Clin. Proc. 2011, 86, 876–884. [Google Scholar] [CrossRef] [PubMed]
- Müller, P.; Schmicker, M.; Müller, N.G. Präventionsstrategien gegen Demenz. Z. Gerontol. Geriatr. 2017, 50, 89–95. [Google Scholar] [CrossRef] [PubMed]
- Warburton, D.E.R.; Nicol, C.W.; Bredin, S.S.D. Health benefits of physical activity: The evidence. CMAJ Can. Med. Assoc. J. J. Assoc. Med. Can. 2006, 174, 801–809. [Google Scholar] [CrossRef] [PubMed]
- Cotman, C.; Berchtold, N.C. Exercise: A behavioral intervention to enhance brain health and plasticity. Trends Neurosci. 2002, 25, 295–301. [Google Scholar] [CrossRef]
- Gomez-Pinilla, F.; Hillman, C. The influence of exercise on cognitive abilities. Compr. Physiol. 2013, 3, 403–428. [Google Scholar] [CrossRef] [PubMed]
- Chang, Y.K.; Labban, J.D.; Gapin, J.I.; Etnier, J.L. The effects of acute exercise on cognitive performance: A meta-analysis. Brain Res. 2012, 1453, 87–101. [Google Scholar] [CrossRef] [Green Version]
- Pontifex, M.B.; McGowan, A.L.; Chandler, M.C.; Gwizdala, K.L.; Parks, A.C.; Fenn, K.; Kamijo, K. A primer on investigating the after effects of acute bouts of physical activity on cognition. Psychol. Sport Exerc. 2018, 40, 1–22. [Google Scholar] [CrossRef]
- McMorris, T.; Hale, B.J. Differential effects of differing intensities of acute exercise on speed and accuracy of cognition: A meta-analytical investigation. Brain Cognit. 2012, 80, 338–351. [Google Scholar] [CrossRef]
- Kamijo, K.; Hayashi, Y.; Sakai, T.; Yahiro, T.; Tanaka, K.; Nishihira, Y. Acute effects of aerobic exercise on cognitive function in older adults. J. Gerontol. Ser. B Psychol. Sci. Soc. Sci. 2009, 64, 356–363. [Google Scholar] [CrossRef]
- Lowe, C.J.; Hall, P.A.; Vincent, C.M.; Luu, K. The effects of acute aerobic activity on cognition and cross-domain transfer to eating behavior. Front. Hum. Neurosci. 2014, 8, 1–7. [Google Scholar] [CrossRef]
- Yerkes, R.M.; Dodson, J.D. The relation of strength of stimulus to rapidity of habit-formation. J. Comp. Neurol. Psychol. 1908, 18, 459–482. [Google Scholar] [CrossRef] [Green Version]
- Barenberg, J.; Berse, T.; Dutke, S. Ergometer cycling enhances executive control in task switching. J. Cognit. Psychol. 2015, 27, 692–703. [Google Scholar] [CrossRef]
- Tsukamoto, H.; Suga, T.; Takenaka, S.; Tanaka, D.; Takeuchi, T.; Hamaoka, T.; Isaka, T.; Ogoh, S.; Hashimoto, T. Repeated high-intensity interval exercise shortens the positive effect on executive function during post-exercise recovery in healthy young males. Physiol. Behav. 2016, 160, 26–34. [Google Scholar] [CrossRef] [PubMed] [Green Version]
- Müller, P.; Rehfeld, K.; Schmicker, M.; Müller, N. P52. Future directions for physical exercise as personalized medicine. Clin. Neurophysiol. 2018, 129, e88. [Google Scholar] [CrossRef]
- World Health Organization. Global Recommendations on Physical Activity for Health; World Health Organization: Geneva, Switzerland, 2010. [Google Scholar]
- Hecksteden, A.; Meyer, T. Personalized Sports Medicine—Principles and tailored implementations in preventive and competitive sports. Dtsch. Z. Sportmed. 2018, 69, 73–80. [Google Scholar] [CrossRef]
- Bouchard, C.; Rankinen, T. Individual differences in response to regular physical activity. Med. Sci. Sports Exerc. 2001, 33, 446–453. [Google Scholar] [CrossRef]
- Gurd, B.J.; Giles, M.D.; Bonafiglia, J.T.; Raleigh, J.P.; Boyd, J.C.; Ma, J.K.; Zelt, J.G.E.; Scribbans, T.D. Incidence of nonresponse and individual patterns of response following sprint interval training. Appl. Physiol. Nutr. Metab. Physiol. Appl. Nutr. Metab. 2016, 41, 229–234. [Google Scholar] [CrossRef] [PubMed]
- Buford, T.W.; Roberts, M.D.; Church, T.S. Toward exercise as personalized medicine. Sports Med. (Auckl. N.Z.) 2013, 43, 157–165. [Google Scholar] [CrossRef]
- Bonafiglia, J.T.; Rotundo, M.P.; Whittall, J.P.; Scribbans, T.D.; Graham, R.B.; Gurd, B.J. Inter-Individual Variability in the Adaptive Responses to Endurance and Sprint Interval Training: A Randomized Crossover Study. PLoS ONE 2016, 11, e0167790. [Google Scholar] [CrossRef]
- Borg, G. Psychophysical bases of perceived exertion. Med. Sci. Sports Exerc. 1982, 14, 377–381. [Google Scholar] [CrossRef]
- Brickenkamp, R.; Schmidt-Atzert, L.; Liepmann, D. d2-R: Test d2—Revision. Aufmerksamkeits und Konzentrationstest; Hogrefe Verlag: Göttingen, Germany, 2010. [Google Scholar]
- Schuhfried, G. Wiener Testsystem Interferenztest nach Stroop. In Kurzbeschreibung Stroop Version 29—Revision 1; Schuhfried: Mödlingen, Austria, 2017. [Google Scholar]
- Voss, M.W.; Vivar, C.; Kramer, A.F.; van Praag, H. Bridging animal and human models of exercise-induced brain plasticity. Trends Cognit. Sci. 2013, 17, 525–544. [Google Scholar] [CrossRef] [PubMed] [Green Version]
- Alves, C.R.R.; Gualano, B.; Takao, P.P.; Avakian, P.; Fernandes, R.M.; Morine, D.; Takito, M.Y. Effects of Acute Physical Exercise on Executive Functions. A Comparison between Aerobic and Strength Exercise. J. Sport Exerc. Psychol. 2012, 34, 539–549. [Google Scholar] [CrossRef] [PubMed]
- Bailey, E.K.; Douglas, T.J.; Wolff, D.; Bailey, S. Coordinated and aerobic exercise do not improve attention in graduate students. Open Sports Sci. J. 2014, 7, 203–207. [Google Scholar] [CrossRef]
- Van den Berg, V.; Saliasi, E.; de Groot, R.H.; Jolles, J.; Chinapaw, M.J.M.; Singh, A.S. Physical Activity in the School Setting. Cognitive Performance Is Not Affected by Three Different Types of Acute Exercise. Front. Psychol. 2016, 7, 723. [Google Scholar] [CrossRef] [PubMed]
- Lambourne, K.; Tomporowski, P. The effect of exercise-induced arousal on cognitive task performance: A meta-regression analysis. Brain Res. 2010, 1341, 12–24. [Google Scholar] [CrossRef] [PubMed]
- Basso, J.C.; Suzuki, W.A. The Effects of Acute Exercise on Mood, Cognition, Neurophysiology, and Neurochemical Pathways: A Review. Brain Plast. 2017, 2, 127–152. [Google Scholar] [CrossRef] [PubMed] [Green Version]
- Basso, J.C.; Shang, A.; Elman, M.; Karmouta, R.; Suzuki, W.A. Acute Exercise Improves Prefrontal Cortex but not Hippocampal Function in Healthy Adults. J. Int. Neuropsychol. Soc. JINS 2015, 21, 791–801. [Google Scholar] [CrossRef] [PubMed]
- Ross, R.; Lannoy, L.; de Stotz, P.J. Separate Effects of Intensity and Amount of Exercise on Interindividual Cardiorespiratory Fitness Response. Mayo Clin. Proceed. 2015, 90, 1506–1514. [Google Scholar] [CrossRef] [Green Version]
- Bouchard, C. Individual differences in the response to regular exercise. International journal of obesity and related metabolic disorders. J. Int. Assoc. Study Obes. 1995, 19, 5–8. [Google Scholar]
- Bonafiglia, J.T.; Nelms, M.W.; Preobrazenski, N.; LeBlanc, C.; Robins, L.; Lu, S.; Lithopoulos, A.; Walsh, J.J.; Gurd, B.J. Moving beyond threshold-based dichotomous classification to improve the accuracy in classifying non-responders. Physiol. Rep. 2018, 6, e13928. [Google Scholar] [CrossRef]
- Montero, D.; Lundby, C. Refuting the myth of non-response to exercise training: ‘non-responders’ do respond to higher dose of training. J. Physiol. 2017, 595, 3377–3387. [Google Scholar] [CrossRef] [PubMed]
- Scharhag-Rosenberger, F.; Walitzek, S.; Kindermann, W.; Meyer, T. Differences in adaptations to 1 year of aerobic endurance training: Individual patterns of nonresponse. Scand. J. Med. Sci. Sports 2012, 22, 113–118. [Google Scholar] [CrossRef] [PubMed]
- Hopkins, W.G.; Marshall, S.W.; Batterham, A.M.; Hanin, J. Progressive statistics for studies in sports medicine and exercise science. Med. Sci. Sports Exerc. 2009, 41, 3–13. [Google Scholar] [CrossRef] [PubMed]
- Swinton, P.A.; Hemingway, B.S.; Saunders, B.; Gualano, B.; Dolan, E. A Statistical Framework to Interpret Individual Response to Intervention: Paving the Way for Personalized Nutrition and Exercise Prescription. Front. Nutr. 2018, 5, 41. [Google Scholar] [CrossRef] [PubMed] [Green Version]
- Van Praag, H.; Christie, B.R.; Sejnowski, T.J.; Gage, F.H. Running enhances neurogenesis, learning, and long-term potentiation in mice. Proc. Natl. Acad. Sci. USA 1999, 96, 13427–13431. [Google Scholar] [CrossRef] [PubMed] [Green Version]
- Krabbe, K.S.; Nielsen, A.R.; Krogh-Madsen, R.; Plomgaard, P.; Rasmussen, P.; Erikstrup, C.; Fischer, C.P.; Petersen, A.M.; Taudorf, S.; Secher, N.H.; et al. Brain-derived neurotrophic factor (BDNF) and type 2 diabetes. Diabetologia 2007, 50, 431–438. [Google Scholar] [CrossRef]
- Rasmussen, P.; Brassard, P.; Adser, H.; Pedersen, M.V.; Leick, L.; Hart, E.; Secher, N.H.; Pedersen, B.K.; Pilegaard, H. Evidence for a release of brain-derived neurotrophic factor from the brain during exercise. Exp. Physiol. 2009, 94, 1062–1069. [Google Scholar] [CrossRef]
- Maass, A.; Düzel, S.; Brigadski, T.; Goerke, M.; Becke, A.; Sobieray, U.; Neumann, K.; Lövdén, M.; Lindenberger, U.; Bäckman, L.; et al. Relationships of peripheral IGF-1, VEGF and BDNF levels to exercise-related changes in memory, hippocampal perfusion and volumes in older adults. NeuroImage 2016, 131, 142–154. [Google Scholar] [CrossRef] [Green Version]
- Müller, P.; Rehfeld, K.; Schmicker, M.; Hökelmann, A.; Dordevic, M.; Lessmann, V.; Brigadski, T.; Kaufmann, J.; Müller, N.G. Evolution of Neuroplasticity in Response to Physical Activity in Old Age: The Case for Dancing. Front. Aging Neurosci. 2017, 9, 56. [Google Scholar] [CrossRef] [Green Version]
- Rehfeld, K.; Lüders, A.; Hökelmann, A.; Lessmann, V.; Kaufmann, J.; Brigadski, T.; Müller, P.; Müller, N.G. Dance training is superior to repetitive physical exercise in inducing brain plasticity in the elderly. PLoS ONE 2018, 13, e0196636. [Google Scholar] [CrossRef]
- Piepmeier, A.T.; Etnier, J.L. Brain-derived neurotrophic factor (BDNF) as a potential mechanism of the effects of acute exercise on cognitive performance. J. Sport Health Sci. 2015, 4, 14–23. [Google Scholar] [CrossRef] [Green Version]
- Winter, B.; Breitenstein, C.; Mooren, F.C.; Voelker, K.; Fobker, M.; Lechtermann, A.; Krueger, K.; Fromme, A.; Korsukewitz, C.; Floel, A.; et al. High impact running improves learning. Neurobiol. Learn. Mem. 2007, 87, 597–609. [Google Scholar] [CrossRef] [PubMed]
- Hwang, J.; Brothers, R.M.; Castelli, D.M.; Glowacki, E.M.; Chen, Y.T.; Salinas, M.M.; Kim, J.; Jung, Y.; Calvert, H.G. Acute high-intensity exercise-induced cognitive enhancement and brain-derived neurotrophic factor in young, healthy adults. Neurosci. Lett. 2016, 630, 247–253. [Google Scholar] [CrossRef] [PubMed]
- Schurr, A. Cerebral glycolysis: A century of persistent misunderstanding and misconception. Front. Neurosci. 2014, 8, 360. [Google Scholar] [CrossRef] [PubMed]
- El Hayek, L.; Khalifeh, M.; Zibara, V.; Abi Assaad, R.; Emmanuel, N.; Karnib, N.; El-Ghandour, R.; Nasrallah, P.; Bilen, M.; Ibrahim, P.; et al. Lactate Mediates the Effects of Exercise on Learning and Memory through SIRT1-Dependent Activation of Hippocampal Brain-Derived Neurotrophic Factor (BDNF). J. Neurosci. 2019, 39, 2369–2382. [Google Scholar] [CrossRef] [PubMed]
- Ferris, L.T.; Williams, J.S.; Shen, C.-L. The effect of acute exercise on serum brain-derived neurotrophic factor levels and cognitive function. Med. Sci. Sports Exerc. 2007, 39, 728–734. [Google Scholar] [CrossRef] [PubMed]
- Schiffer, T.; Schulte, S.; Sperlich, B.; Achtzehn, S.; Fricke, H.; Strüder, H.K. Lactate infusion at rest increases BDNF blood concentration in humans. Neurosci. Lett. 2011, 488, 234–237. [Google Scholar] [CrossRef]
- Dennis, A.; Thomas, A.G.; Rawlings, N.B.; Near, J.; Nichols, T.E.; Clare, S.; Johansen-Berg, H.; Stagg, C.J. An Ultra-High Field Magnetic Resonance Spectroscopy Study of Post Exercise Lactate, Glutamate and Glutamine Change in the Human Brain. Front. Physiol. 2015, 6, 351. [Google Scholar] [CrossRef]
- Kemppainen, J.; Aalto, S.; Fujimoto, T.; Kalliokoski, K.K.; Långsjö, J.; Oikonen, V.; Rinne, J.; Nuutila, P.; Knuuti, J. High intensity exercise decreases global brain glucose uptake in humans. J. Physiol. 2005, 568, 323–332. [Google Scholar] [CrossRef] [Green Version]
- Rasmussen, P.; Wyss, M.T.; Lundby, C. Cerebral glucose and lactate consumption during cerebral activation by physical activity in humans. FASEB J. Off. Publ. Fed. Am. Soc. Exp. Biol. 2011, 25, 2865–2873. [Google Scholar] [CrossRef]
- Hecksteden, A.; Pitsch, W.; Rosenberger, F.; Meyer, T. Repeated testing for the assessment of individual response to exercise training. J. Appl. Physiol. 2018, 124, 1567–1579. [Google Scholar] [CrossRef] [PubMed]
- Hecksteden, A.; Kraushaar, J.; Scharhag-Rosenberger, F.; Theisen, D.; Senn, S.; Meyer, T. Individual response to exercise training—A statistical perspective. J. Appl. Physiol. 2015, 118, 1450–1459. [Google Scholar] [CrossRef] [PubMed]
- Müller, P.; Taubert, M.; Müller, N.G. Physical exercise as personalized medicine for dementia prevention? Front. Physiol. 2019, 10, 672. [Google Scholar] [CrossRef] [PubMed]
- Dankel, S.J.; Loenneke, J.P. A Method to Stop Analyzing Random Error and Start Analyzing Differential Responders to Exercise. Sports Med. 2019. [Google Scholar] [CrossRef] [PubMed]


| EG1 (n = 13) | EG2 (n = 13) | CG (n = 13) | ||||||
|---|---|---|---|---|---|---|---|---|
| M | SD | M | SD | M | SD | F | p | |
| Demographic Data | ||||||||
| age (year) | 23.54 | 3.05 | 24.00 | 3.56 | 22.46 | 3.13 | 0.76 | 0.472 |
| height (cm) | 185 | 0.06 | 182 | 0.08 | 178 | 0.07 | 2.71 | 0.080 |
| weight (kg) | 82.15 | 7.48 | 82.31 | 9.53 | 77.08 | 10.55 | 1.34 | 0.275 |
| BMI (kg/cm2) | 24.03 | 1.62 | 24.86 | 1.86 | 24.14 | 2.25 | 0.71 | 0.500 |
| BDI (score) | 4.92 | 3.64 | 4.08 | 2.81 | 7.08 | 4.39 | 2.31 | 0.114 |
| Physical Activity per Week | ||||||||
| count | 2.08 | 0.49 | 2.15 | 0.69 | 1.85 | 0.80 | 0.74 | 0.486 |
| duration (h) | 3.54 | 1.22 | 3.46 | 1.13 | 3.41 | 1.39 | 0.16 | 0.850 |
© 2019 by the authors. Licensee MDPI, Basel, Switzerland. This article is an open access article distributed under the terms and conditions of the Creative Commons Attribution (CC BY) license (http://creativecommons.org/licenses/by/4.0/).
Share and Cite
Schwarck, S.; Schmicker, M.; Dordevic, M.; Rehfeld, K.; Müller, N.; Müller, P. Inter-Individual Differences in Cognitive Response to a Single Bout of Physical Exercise—A Randomized Controlled Cross-Over Study. J. Clin. Med. 2019, 8, 1101. https://doi.org/10.3390/jcm8081101
Schwarck S, Schmicker M, Dordevic M, Rehfeld K, Müller N, Müller P. Inter-Individual Differences in Cognitive Response to a Single Bout of Physical Exercise—A Randomized Controlled Cross-Over Study. Journal of Clinical Medicine. 2019; 8(8):1101. https://doi.org/10.3390/jcm8081101
Chicago/Turabian StyleSchwarck, Svenja, Marlen Schmicker, Milos Dordevic, Kathrin Rehfeld, Notger Müller, and Patrick Müller. 2019. "Inter-Individual Differences in Cognitive Response to a Single Bout of Physical Exercise—A Randomized Controlled Cross-Over Study" Journal of Clinical Medicine 8, no. 8: 1101. https://doi.org/10.3390/jcm8081101