Article

A Meta-Epidemiological Appraisal of the Effects of Interdisciplinary Multimodal Pain Therapy Dosing for Chronic Low Back Pain

1
Pain and Rehabilitation Centre, and Department of Medical and Health Sciences, Linköping University, SE-581 85 Linköping, Sweden
2
Division of Occupational Therapy, Department of Social and Welfare Studies, Faculty of Health Sciences, Campus Norrkoping, Linköping University, SE-60174 Linköping, Sweden
*
Author to whom correspondence should be addressed.
J. Clin. Med. 2019, 8(6), 871; https://doi.org/10.3390/jcm8060871
Submission received: 21 May 2019 / Revised: 13 June 2019 / Accepted: 17 June 2019 / Published: 18 June 2019
(This article belongs to the Special Issue Rehabilitation for Persistent Pain Across the Lifespan)

Abstract

:
Using a meta-analysis, meta-regression, and a meta-epidemiological approach, we conducted a systematic review to examine the influence of interdisciplinary multimodal pain therapy (IMPT) dosage on pain, disability, return to work, quality of life, depression, and anxiety in published randomised controlled trials (RCTs) in patients with non-specific chronic low back pain (CLBP). We considered all RCTs of IMPT from a Cochrane review and searched PubMed for additional RCTs through 30 September 2018. A subgroup random-effects meta-analysis by length, contact, and intensity of treatment was performed followed by a meta-regression analysis. Using random and fixed-effect models and a summary relative odds ratio (ROR), we compared the effect sizes (ES) from short-length, non-daily contact, and low-intensity RCTs with long-length, daily contact, and high-intensity RCTs. Heterogeneity was quantified with the I2 metric. A total of 47 RCTs were selected. Subgroup meta-analysis showed that there were larger ES for pain and disability in RCTs with long-length, non-daily contact, and low intensity of treatment. Larger ES were also observed for quality of life in RCTs with short-length, non-daily contact, and low intensity treatment. However, these findings were not confirmed by the meta-regression analysis. Likewise, the summary RORs were not significant, indicating that the length, contact, and intensity of treatment did not have an overall effect on the investigated outcomes. For the outcomes investigated here, IMPT dosage is not generally associated with better ES, and an optimal dosage was not determined.

1. Introduction

Currently, interdisciplinary multimodal pain therapy (IMPT) is used as a first-line therapy for chronic low back pain (CLBP) management [1,2,3,4]. IMPT, a long biopsychosocial treatment framework provided by a team of professionals, generally contains a synchronised combination of physical, educational, or psychological treatments in combination with measures for returning to work/studies [5,6]. Because IMPT can effectively treat patients with non-specific CLBP, it is strongly recommended [1,2,3,4]. Compared to usual care or physical treatment, IMPT has a consistent positive effect on disability and pain according to systematic reviews (SRs) [2,4]. In a new umbrella review, our team found suggestive evidence that IMPT might improve the likelihood of returning to work [5]. In addition, IMPT might decrease the personal and economic burden and increase the patients’ treatment participation [2,7].
However, IMPT treatments are rather costly. The costs mainly depend on the treatment dosage, which includes the total duration, the contact (daily or non-daily), and intensity of treatment (number of contact hours per week) [8,9,10]. In addition, IMPT costs increase as the duration, contact, and intensity of treatment increase [8,9,10], and IMPT heavily depends on the involved professions. Typically, IMPT includes costs for physical therapists, psychologists, occupational therapists, physicians, and administration personnel [11]. Additionally, concerns include the costs of attending such treatments and the large societal costs of those patients who do not complete the treatments and do not return to work [11]. Therefore, the dosage of the treatment and the multidisciplinary nature of IMPT provide relatively high direct costs for both patients and the healthcare system [11]. Hence, variances in the IMPT dosage may lead to differences in both effectiveness and costs [8,9,10].
Presently, the optimal IMPT dosage and which dosage is efficacious for the patients with non-specific CLBP is unidentified [9], despite the need for a standardisation of such treatments [5,12]. A recent systematic review showed that IMPT dosage was never studied as a primary outcome, and its optimum dosage is currently unknown [10]. Our umbrella review also showed that a short duration of IMPT for CLBP patients with short-term and medium-term pain had the largest evidence of returning to work (highly suggestive evidence and suggestive evidence, respectively) [5]. A better understanding of how IMPT dosage is associated with outcome effects (e.g., pain, disability, and work status) should be considered when determining dosage. In turn, this could lead to better and more efficient patient care, which will benefit patients, rehabilitation facilities, insurers, and employers [8,11].
Here, we conducted a systematic review with meta-analysis and a meta-epidemiological appraisal to examine whether IMPT dosage is associated with better outcome effects in patients with non-specific CLBP.

2. Materials and Methods

This study was designed based on the Preferred Reporting Items for Systematic Reviews and Meta-Analyses (PRISMA) guidelines [13,14]. Because this meta-research project did not require patients to be directly involved, ethical approval was not required.

2.1. Literature Search and Study Selection

This study includes all randomised controlled trials (RCTs) included in Kamper et al.’s Cochrane systematic review [2]. We choose this review because it is the most recent and comprehensive review with the largest number of included RCTs. We also searched PubMed through 30 September 2018 for additional fully published RCTs in peer-reviewed journals investigating the effectiveness of IMPT on non-specific CLBP. The basic search strategy included the following key terms: chronic low back pain, interdisciplinary, multimodal pain therapy, multidisciplinary biopsychosocial rehabilitation, and randomised controlled trials (for details, see Box S1, Supplementary Materials).
We included only RCTs that (1) examined any IMPT versus any control (e.g., treatment as usual, and waiting list) or other treatment (e.g., physiotherapy and surgery), (2) included only adult men and women, (3) identified a diagnosis of a non-specific CLBP lasting more than three months, and (4) published in English expect for those included in the Kamper et al.’s review [2] as the provided data in this study were already translated into English.
We excluded studies if they (1) used a study design other than RCT, (2) compared different IMPTs with each other (i.e., head-to-head comparisons), (3) included participants with fewer than 50% diagnosed with non-specific CLBP, (4) included a diagnosis of LBP due to cancer, infection, inflammatory arthropathy, osteoporosis, high-velocity trauma, fracture, pregnancy, rheumatoid arthritis, or rheumatic pain, and (5) provided insufficient or inadequate data for quantitative synthesis.

2.2. Data Extraction

One investigator (E.D.) screened titles and abstracts, assessed the eligibility, extracted data, and rated the quality of the included RCTs. These were also checked by a second author (M.B.). Any disagreements were resolved by consensus, or a third reviewer (B.G.) was consulted if disagreements persisted. The six primary outcomes of interest for this study were pain, disability, work status (return to work), quality of life, depression, and anxiety as reported by the original authors of the RCTs. We chose these outcomes because these were the most common outcomes in RCTs with adequate data for analysis. Other outcomes (e.g., fear avoidance and coping strategies) provided limited data for synthesis. Because of the same limitation (i.e., limited data for adequate synthesis), we also focused only on short-term outcomes (i.e., up to three months). The IMPT dosage was defined according to total duration (in weeks), daily contact or non-daily contact, and intensity of treatment (number of contact hours per week) [2,10].

2.3. Assessment of Bias

We used the updated Cochrane Back Review Group criteria [15] to rate the quality of the included RCTs, which include 12 criteria and assess the risk of bias (RoB). For each criterion, the quality of each RCT was classified as high (i.e., low RoB = 1), moderate (i.e., unclear RoB = 2), and low (i.e., high RoB = 3). Next, we evaluated an overall “risk of bias” assessment for each RCT by giving one point to each criterion when low RoB was indicated. Thus, RCTs satisfying at least six of the 12 criteria and having no having no serious flaws (e.g., 80% drop-out rate in one group) were considered as “low” risk of bias [15]. RCTs with serious flaws, or those in which fewer than six of the criteria are met were considered as having a “high” risk of bias [15]. It is important to note that the blinding is quite problematic in this field [2,10].

2.4. Data Synthesis and Analysis

We analysed data descriptively and conducted subgroup meta-analysis of all the outcomes of interest as listed above. Specifically, to explore the effects of IMPT dosage—i.e., the total duration (in weeks), the contact, and intensity of treatment (number of contact hours per week)—a series of random-effects meta-analyses [16] were conducted by clustering the RCTs according to the following variables: short length (in weeks; <5 weeks) vs. long length (≥5 weeks); non-daily contact vs. daily contact; and low intensity vs. high intensity (e.g., less than 30 h per week vs. more 30 h per week). Dichotomous outcomes were analysed by calculating the pooled odds ratio (OR), and continuous outcomes were analysed by calculating the standardised mean difference (SMD). Between-study heterogeneity was evaluated by Cochran’s Q test [16] and quantified with the I2 metric of inconsistency (low, moderate, large, and very large for values of <25, 25–49, 50–74, and >75%, respectively) [17,18]. We also calculated the 95% confidence intervals for the I2. We used the regression asymmetry test and funnel plots to estimate publication bias for all outcomes of interest [19]. We also performed a random-effects meta-regression analysis [20] to examine the potential moderator effect of dosage aspects, mean age of the participants, gender (female), type of control (i.e., physical activity), and RoB assessment (i.e., RCTs with low risk as previously described) on treatment effects. The dosage aspects (duration and intensity) were included in the meta-regression analysis as continuous variables for a more accurate estimation [20]. The only exception was for contact since it was only in binary form.
To further systemically assess the potential influence of IMPT dosage on the outcomes of interest, we used a meta-epidemiological approach [21,22,23] comparing the magnitude of the effect size (ES) by the treatment dosage in terms of the total duration (in weeks), the contact, and intensity of treatment (number of contact hours per week) for each outcome. To match the outcome data and allow for the synthesis of the evidence, we transformed the SMD to a logOR for the continuous outcomes [22] based on a standardised formula [24].
From each outcome, we calculated a summary OR for the short-duration RCTs and long-duration RCTs, for the non-daily contact and daily contact, and for the low-intensity vs. high-intensity RCTs within the eligible RCTs using fixed-effect models [22,25]. This method is more proper for examining study design factors on treatment effects [21,22,23]. All comparisons were coined so that the experimental arm was always an IMPT vs. a control arm. Next, we obtained a relative OR (ROR) within all comparisons for each outcome [22]. A ROR that exceeds 1 equates to assessments providing a more favourable response to the experimental IMPT supported by an RCT with long duration, daily contact, and high intensity compared to RCTs with short duration, non-daily contact, and low intensity. To obtain a summary ROR (sROR) across all outcomes, we combined the natural logarithm estimates of the RORs for all comparisons [21] using fixed- and random-effects models [16,25].
The statistical analyses were made using STATA version 10.0 (STATA Corp, College Station, Texas, USA); a value of p < 0.05 (two-tailed) was set as the level of significance.

3. Results

We identified 41 RCTs from Kamper et al.’s study [2]. The electronic search yielded a total of 3799 potentially eligible titles. Following the search and screening and retrieval of 126 full text articles, six additional RCTs were determined to be eligible (Figure S1, Supplementary Materials). These articles were added to the 41 RCTs included in Kamper et al. [2] to make a total of 47 included RCTs (see Supplementary Materials for the list of refences of the included studies). The two independent investigators reached a very high level of agreement (43/47 RCTs). In the whole process, from screening to data extraction, any disagreement was discussed with a third researcher (B.G.) until a consensus was reached.

3.1. Characteristics of Included Studies

Table 1 presents the characteristics of studies. All the 47 included studies were RCTs published from 1990 to 2017. Most studies were conducted in Europe (n = 34; 74%). The number of participants ranged from 20 to 542 with a median number of 134 participants per study (interquartile range (IQR = 84–195), a median age of 44 years old (IQR = 41–47), a total treatment duration ranging from 1–16 weeks with a median of five weeks (IQR = 3–7), and a number of contact hours (per week) ranging from 1–100 h (median = 10; IQR = 3–30). Most RCTs provided a non-daily contact (n = 26; 56%). Although the definition of CLBP varied among studies, most studies defined CLBP as back pain lasting more than three months (Table 1). The number of datasets included in the meta-analysis per outcome varied from two (anxiety) to 28 (pain).

3.2. Risk of Bias in Included Studies

The results of the RoB assessment are presented in Table S1 (Supplementary Materials). Overall, 15 of the 47 studies (32%) were evaluated as low risk of bias. The most important methodological flaws were related to a lack of participant, clinician, and outcome assessment blinding; in particular, 46 out of 47 RCTs (almost 100%) had a high risk of bias in all three of these criteria (Figure 1). However, as in any psychotherapy [22], blinding is not possible, at least to participants or clinicians, in this type of treatment [2,10].

3.3. Publication Bias

Publication bias was observed for three outcomes (disability (p = 0.018), quality of life (p = 0.060), and depression (p = 0.081)), based on the funnel plots and Egger’s regression test (see Figures S2–S6, Supplementary Materials). No publication bias remained for the outcome of pain (p = 0.219) after excluding the study of Monticone et al. (2013) (Reference 27 in Supplementary Materials) providing a large outlier as seen in Figure S2 (Supplementary Materials). Publication bias for anxiety outcome could not be estimated due to the inadequate number of included studies (only two RCTs).

3.4. Analyses for Outcomes of Interdisciplinary Multimodal Pain Therapy (IMPT) by Length, Contact, and Intensity

For each outcome, subgroup analysis was conducted for IMPT dosage by length, contact, and intensity (Table 2). There were larger ES for pain and disability in RCTs with long length, non-daily contact, and low intensity of treatment. Larger and significant ES were also observed for quality of life in RCTs with short length, non-daily contact, and low intensity of treatment. After excluding the study of Moticone et al. (2013/2014) (References 27,28 in Supplementary Materials), the ES were similar between the aspects of dosage for the outcomes of pain and disability (see Figures S7–S12, Supplementary Materials). The forest plots of the overall ES from all studies included for the six outcomes per RoB assessment, type of control, and aspects of dosage are provided in Figures S13–S18 (Supplementary Materials).

3.5. Meta-Regression

In the meta-regression analyses, none of the examined variables displayed a moderating effect on the five examined outcomes (i.e., pain, disability, return to work, quality of life, and depression). For the anxiety outcome, there were insufficient observations to perform such analysis (Table S2, Supplementary Materials).

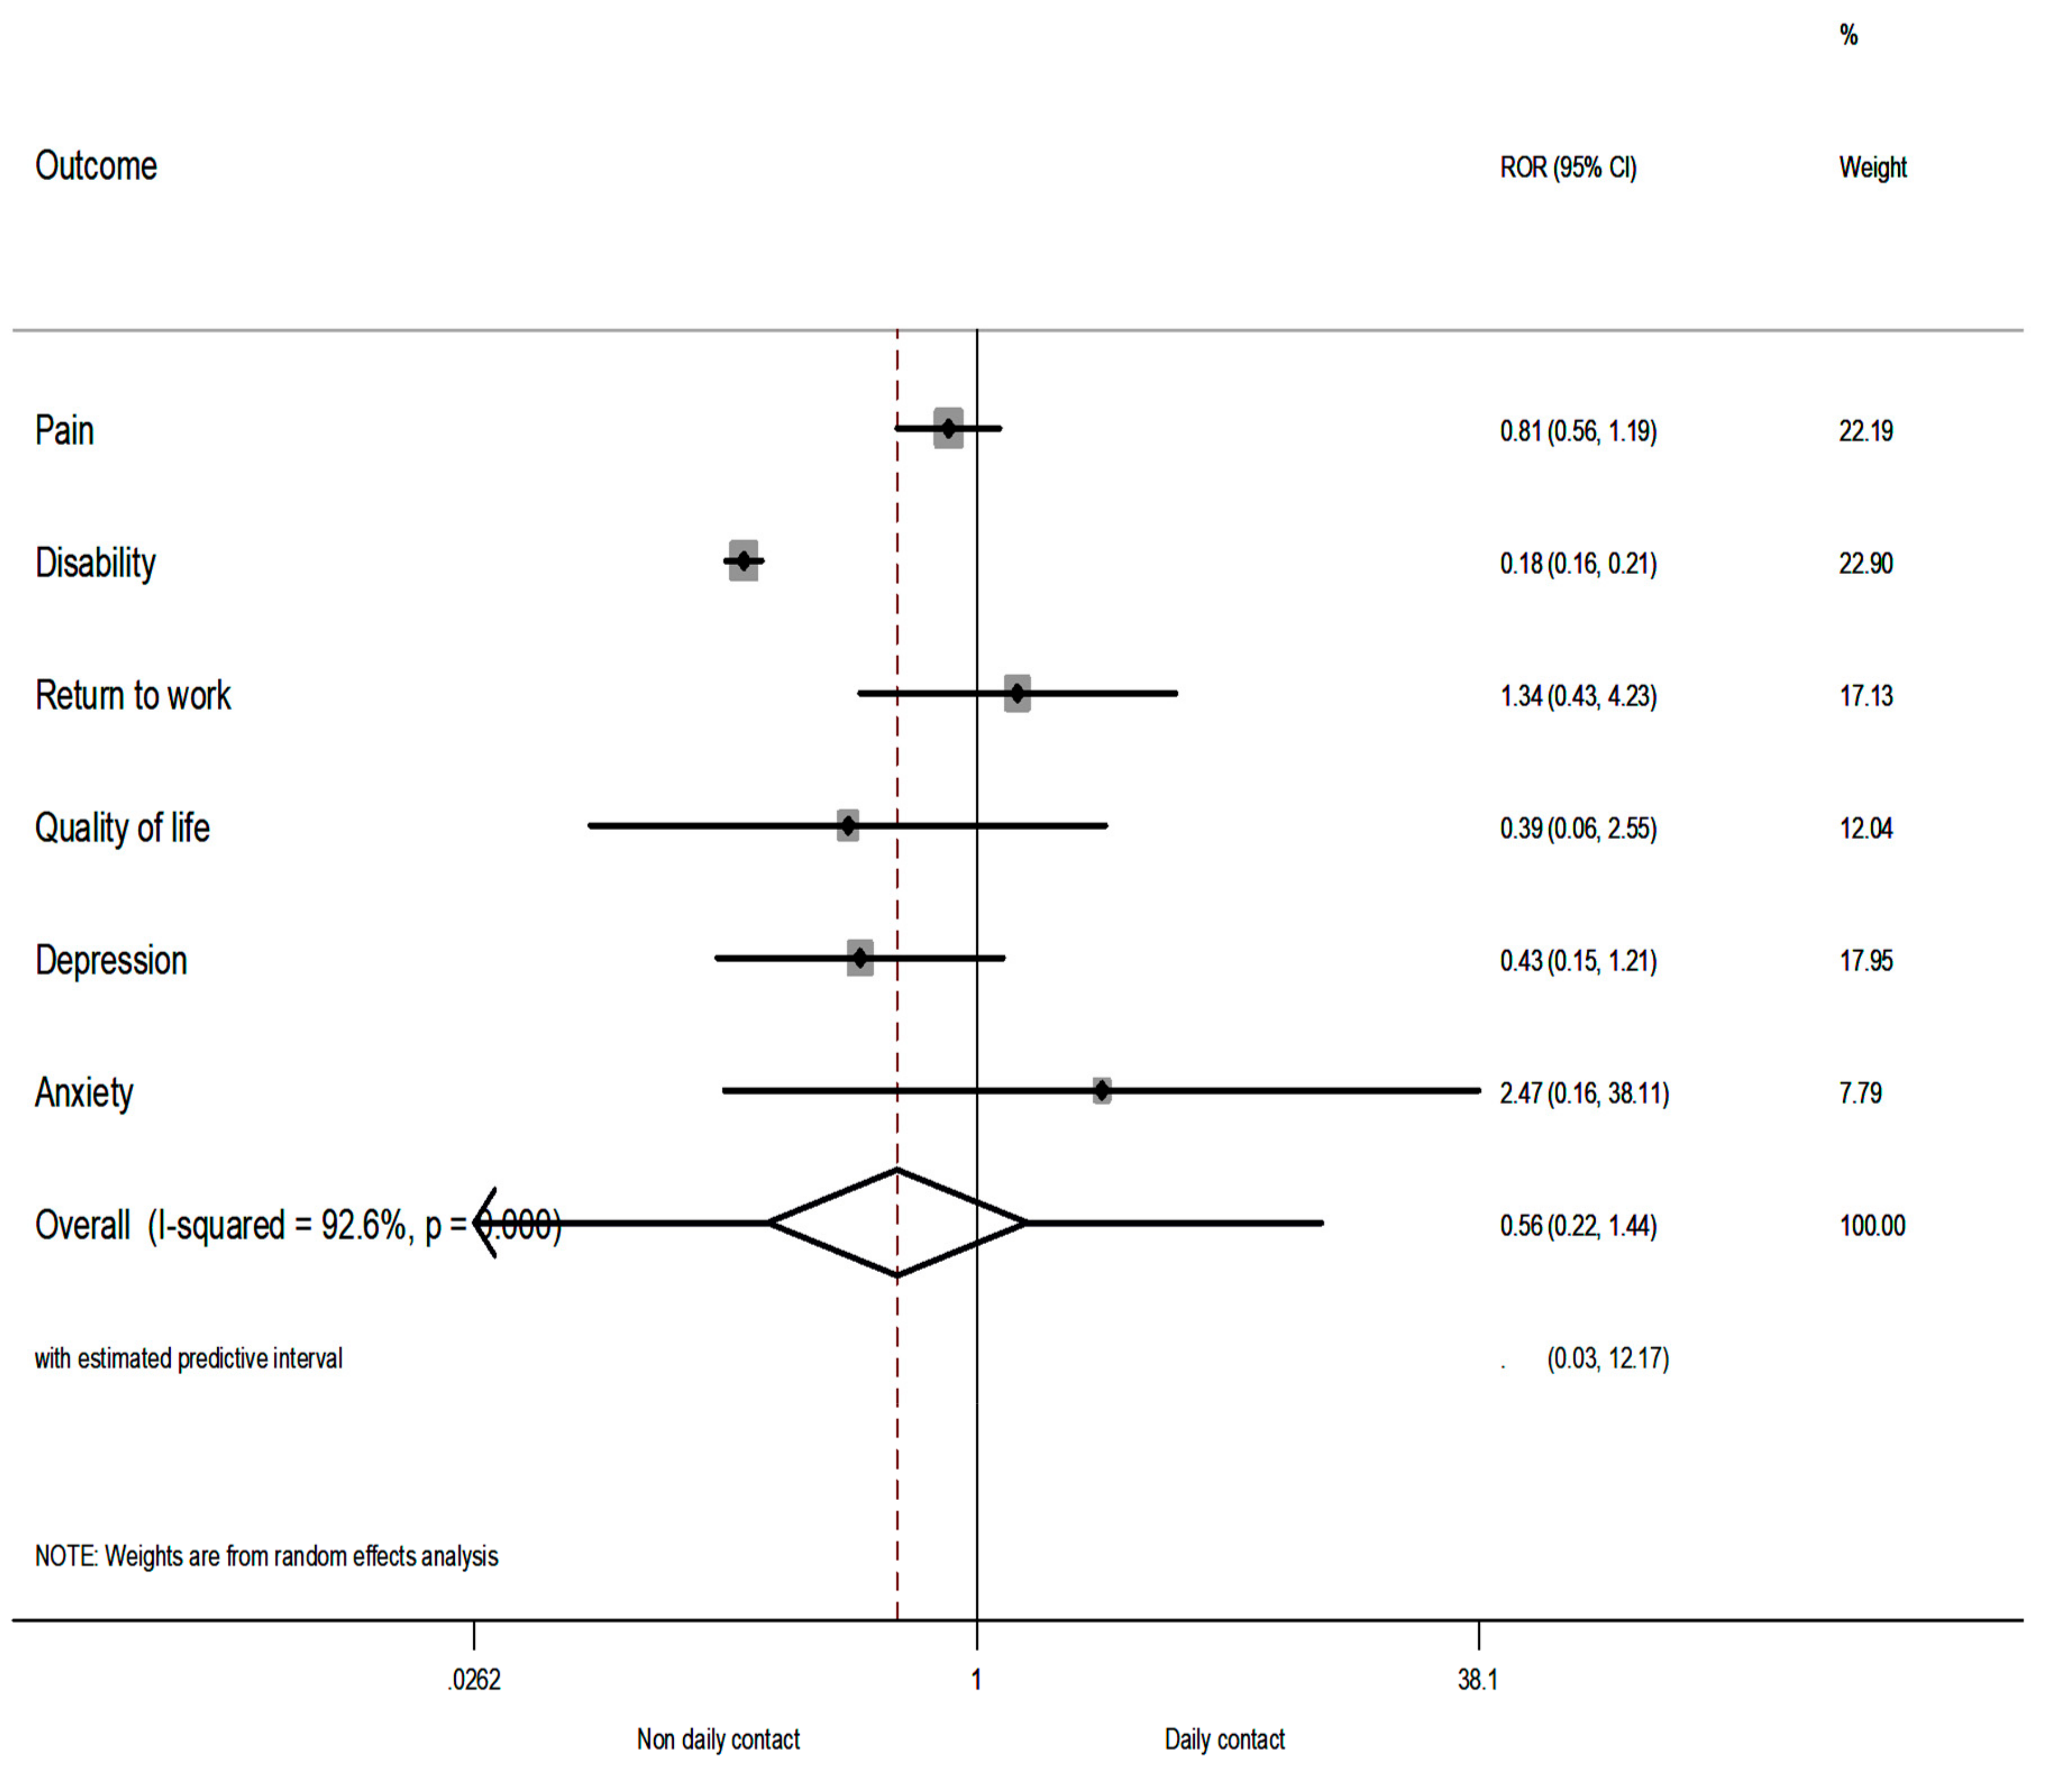
3.6. Comparison of Relative Odds Ratios

The comparison of RORs by length of treatment showed that, for pain and disability, the summary RORs were >1, demonstrating that the IMPT was more favourable in RCTs with long length of treatment (i.e., RCTs with duration of more than five weeks). However, the summary ROR was not significant (sROR = 1.48 (95% confidence interval (CI) 0.78–2.81, p = 0.232) using the random-effects model, showing that the length of treatment did not have an overall effect on the investigated outcomes (Figure 2). Very large heterogeneity was observed (I2 = 82%, 95% CI 55–90%). Under the fixed-effect models the sROR was, however, significant (Figure S19, Supplementary Materials).
The comparison of RORs by contact of treatment (i.e., non-daily contact vs. daily contact) showed that the summary ROR was <1 only for disability, a finding that indicates that the IMPT was more favourable in RCTs with non-daily contact of treatment (i.e., RCTs with at least 3 h per week). However, the summary ROR was not significant (sROR = 0.56; 95% CI 0.22–1.44; p = 0.230) according to the random-effects model (Figure 3), showing that the contact of treatment did not have an overall effect on the investigated outcomes, whereas the sROR was significant under the fixed-effect models (Figure S20, Supplementary Materials). Very large heterogeneity was also present (I2 = 93%, 95% CI 88–95%).
With respect to the intensity of treatment (i.e., low intensity vs. high intensity), the summary ROR was <1 only for disability, demonstrating that the IMPT was more favourable in RCTs with low intensity of treatment (i.e., RCTs with less than 30 h per week). The summary ROR was also not significant (sROR = 1.12; 95% CI 0.66–1.89; p = 0.672) using the random-effects model, showing that the intensity of treatment did not have an overall effect on the outcomes. Large heterogeneity was observed (I2 = 70%, 95% CI 21–87%) (Figure 4). Similar results were evident when the fixed-effect models were used (Figure S21, Supplementary Materials). A sensitivity analysis excluding the study of Moticone et al. (2013/2014) (References 27,28 in Supplementary Materials) did not alter the overall effects between the comparison of RORs (Figures S22–S24, Supplementary Materials).

4. Discussion

When evaluating the 47 RCTs of IMPT by length, contact, and intensity, we found that IMPT dosage did not have an overall influence on the reported effects in patients with non-specific CLBP. Specifically, the summary RORs were not significant when we compared the effect estimates for the investigated outcomes from the short-length and the long-length treatments and the non-daily contact with the daily contact. There was no significant influence for either intensity of the treatment. Although we found large heterogeneity between RCTs, the meta-regression analysis revealed that none of the examined factors were potential factors for heterogeneity.
Yet, per individual outcome, some evidence exhibited that IMPT of more than five weeks may be related to more “favourable” effects for pain reduction, while a long treatment with non-daily contact and low intensity may be associated with more beneficial effects for disability. These results were supported by both subgroup meta-analyses and meta-analytical comparisons of RORs between the treatment effects. This study suggests that an optimal IMPT dosage from the published work is not possible to be standardised. This finding partly agrees with the idea that the published recommended IMPT dosages are somewhat arbitrary and primarily based on clinical expertise and experience [8]. Our study, however, did not confirm an overall IMPT dose–treatment–effect association in agreement with a recently published non-inferiority RCT [9].
To our knowledge, this is the first study to examine the influence of IMPT dosage in such a systematic appraisal followed by meta-analysis and meta-epidemiological approach across the largest dataset of published RCTs, calculating the magnitude of the observed effect. Our meta-epidemiological approach with comparison of RORs is suitable for examining study design factors and characteristics on treatment effects [21,22,23]. IMPT, a complex treatment, requires a broad set-up of outcome variables. The present review had such a broad approach when evaluating IMPT dosage. Hence, we analysed dosage aspects for the individual outcomes and used a more comprehensive approach—the summary estimates of outcomes. Although IMPT dosing is rather essential in terms both of efficacy and healthcare costs [8,11], it was not systematically and thoroughly assessed in RCTs [9]. Few other studies that focused on IMPT dosage and these studies included a smaller number of RCTs or used different methodological methods and outcomes [4,10]. In a Cochrane review, Guzman et al. compared 12 IMPTs in 1964 patients with CLBP [4]. Their meta-analysis found that daily intensive IMPT (with more than 100 h per week) with respect to disability was more beneficial than monodisciplinary treatment. Evidence regarding other outcomes was either limited or ambivalent [4]. However, their review was not designed to directly study the influence of treatment dosage on outcome effects.
Waterschoot et al. conducted a systematic review analysing the influence of IMPT dosage on disability, work, and quality of life in patients with CLBP and included 18 studies [10]. As in our study, the studies included in that review varied in terms of dosage (total duration and contact hours) and outcome effects. Their linear mixed-effect modelling showed that duration in weeks was significantly associated with the aforesaid outcomes [10]. It was somewhat surprising that we did not find an association between duration of treatment (or any other dose aspect) and effects on pain, disability, return to work, quality of life, depression, or anxiety. An explanation could be that different components such as a professional’s expertise or different types of professionals involved in an IMPT might have greater influence than the dosage variables. Waterschoot et al. also suggested that the content of such treatments is strongly related to dosage aspects; thus, the independent effect of dosage is not easily detectable [10]. A final explanation of the lack of association between and outcome effects is that there is also the possibility that the dosage does not actually influence the outcomes in this target group. The latter is supported by the subgroup analysis in Kamper et al. as they found that there was no pattern of smaller or larger effects for duration and contact with IMPT while the intensity of treatment slightly affected the treatment effects [2]. This finding is also supported by Reneman et al. who found that the dosage is not related to differences in disability [9].
One limitation of our study is that we did not explore the potential interaction of the role of professionals per RCT with length, contact, and intensity of treatment. Also, the individual components of IMPT may differ between RCTs without any difference in the overall dosage variables investigated here. Moreover, it is possible that some professionals might be unequally trained or have less clinical expertise for the application of the multidisciplinary treatment, and it might be hypothesised that these factors could affect the exact extent/dosage of a program. For example, well-trained professionals with extensive clinical expertise might require fewer contacts to help their patients. A related issue is the adherence to the treatment protocols within IMPT by the professionals. Many treatments require that the patients apply the achieved insights and knowledge in their home environments or jobs, and the time spent on this is usually not included in the stated doses. Furthermore, the severity of the clinical presentations of the patient groups, as well as the social context (e.g., with respect to the insurance situation) may differ substantially between RCTs; unfortunately, there are no established and standardised ways to compare chronic pain patient cohorts. It is also possible that the diversity of the professionals and the multidisciplinary nature of the treatment per se may lead to differences in treatment effects in relation to the variation of dosage [8,11]. However, there are no related data in the literature to either support or reject this hypothesis. Another limitation is that the dichotomisation between length was based on the median value of the total duration of the IMPT per week; thus, one may argue that this was somewhat subjective. However, in the literature, there is not a valid cut-off score to precisely define what is a short-length or long-length treatment, although the categorisation of contact and intensity was based on the available literature [4]. One may also argue that the overall dichotomisation of the dosage cannot accurately represent the wide spectrum of the total length in weeks, total number of hours, or the total number of contact hours per week. Indeed, our results confirm the wide variability in weeks, contact hours, and intensity as previously reported [10]. Nevertheless, the results of the meta-regression analysis using continuous variables of dosage were also not significant. In addition, large heterogeneity was found, but it cannot be explained from the dosage choices, age, gender, low risk of bias, or type of control as presented in the published RCTs. This extensive heterogeneity contributed to different results from fixed and random-effects models with respect to the comparison between length and contact of treatment, and it can be better explained by the variation in professional teams and the contents of the IMPT. Finally, we based our research on studies from a Cochrane systematic review from 2014, and, despite the additional search on PubMed, we may have missed some information.
This study does not suggest that IMPT is not beneficial for patients with CLBP. On the contrary, our results found reliable but moderate effects on pain and disability following previous evidence [1,2,3,4]. In addition, even if IMPT dosage remains controversial, the lack of association between dosing and outcome effects may mean that the rehabilitation professionals should reconsider adopting lower dosages. We also assumed that an IMPT with duration of at least five weeks with non-daily contact and low intensity would reduce pain and disability and the costs of such treatments, and increase the rehab participation of patients suffering from chronic symptomatology, thereby avoiding exhaustive and long treatments. In turn, active participation could lead to more beneficial results. Undoubtedly, CLBP is a major cause of concern globally [7,26,27] and one of the leading causes of years lived with disability [28]; therefore, optimal treatments are needed [29].

5. Conclusions

In this study, we showed that the IMPT dosing in general is not associated with better effects on pain, disability, work status, quality of life, depression, and anxiety in patients with non-specific CLBP. Some evidence suggests the efficacy of a long program with non-daily contact and low intensity for only pain and disability per individual outcome level, but an overall optimal dosage was not likely to be identified. This knowledge will contribute to a better evaluation from pain rehabilitation professionals to obtain insight into dosage choices that may contribute to more efficacious treatments. Further research on this topic examining also long-term outcomes is warranted.

Supplementary Materials

The following are available online at https://www.mdpi.com/2077-0383/8/6/871/s1. Figure S1: Study flow diagram, Figure S2: Funnel plot for the pain outcome. Egger’s test for publication bias was not significant (p = 0.141), Figure S3: Funnel plot for the disability outcome. Egger’s test for publication bias was significant (p = 0.018), Figure S4: Funnel plot for the return to work outcome. Egger’s test for publication bias was not significant (p = 0.141), Figure S5: Funnel plot for the quality of life outcome. Egger’s test for publication bias was significant (p = 0.060), Figure S6: Funnel plot for the depression outcome. Egger’s test for publication bias was significant (p = 0.081), Figure S7: Sensitivity analysis by length for the pain outcome, after excluding the study of Moticone et al. (2013/2014), Figure S8: Sensitivity analysis by contact for the pain outcome, after excluding the study of Moticone et al. (2013/2014), Figure S9: Sensitivity analysis by intensity for the pain outcome, after excluding the study of Moticone et al. (2013/2014), Figure S10: Sensitivity analysis by length for the disability outcome, after excluding the study of Moticone et al. (2013/2014), Figure S11: Sensitivity analysis by contact for the disability outcome, after excluding the study of Moticone et al. (2013/2014), Figure S12: Sensitivity analysis by intensity for the disability outcome, after excluding the study of Moticone et al. (2013/2014), Figure S13: Forest plot for the pain outcome all studies included, Figure S14: Forest plot for the disability outcome all studies included, Figure S15: Forest plot for the return to work outcome all studies included, Figure S16: Forest plot for the quality of life outcome all studies included, Figure S17: Forest plot for the depression outcome all studies included, Figure S18: Forest plot for the anxiety outcome all studies included, Figure S19: The relative odds ratios (RORs) and 95% confidence intervals (CIs) for each outcome at short term of a short-length treatment vs. long-length treatment. The RORs were calculated with a fixed-effect model. A ROR >1 favours long length; a ROR <1 favours short length, Figure S20: The relative odds ratios (RORs) and 95% confidence intervals (CIs) for each outcome at short term of a non-daily contact vs. daily contact. The RORs were calculated with a fixed-effect model. A ROR >1 favours daily contact; a ROR <1 favours non-daily contact, Figure S21: The relative odds ratios (RORs) and 95% confidence intervals (CIs) for each outcome at short term of a low intensity vs. high intensity. The RORs were calculated with a fixed-effect model. A ROR >1 favours high intensity (i.e., >30 h per week); a ROR <1 favours low intensity (i.e., <30 h per week), Figure S22: The relative odds ratios (RORs) and 95% confidence intervals (CIs) for each outcome at short term of a short-length treatment vs. long-length treatment, after excluding the study of Moticone et al. (2013/2014). The RORs were calculated with a random-effects model. A ROR >1 favours long length; a ROR <1 favours short length, Figure S23: The relative odds ratios (RORs) and 95% confidence intervals (CIs) for each outcome at short term of a non-daily contact vs. daily contact, after excluding the study of Moticone et al. (2013/2014). The RORs were calculated with a random-effects model. A ROR >1 favours daily contact; a ROR <1 favours non-daily contact, Figure S24: The relative odds ratios (RORs) and 95% confidence intervals (CIs) for each outcome at short term of a low intensity vs. high intensity, after excluding the study of Moticone et al. (2013/2014). The RORs were calculated with a random-effects model. A ROR >1 favours high intensity (i.e., >30 h per week); a ROR <1 favours low intensity (i.e., <30 h per week), Table S1: Risk of bias (RoB) according to the Cochrane Back Review Group criteria, Table S2: Results of the meta-regression analyses of potential moderators of the six examined outcomes, Table S3: Checklist summarizing compliance with PRISMA guidelines, Box S1: Search details in PubMed, Box S2: References of included RCTs.

Author Contributions

E.D. and B.G. had the idea for the project, and E.D. primarily designed the study, which was discussed and finally approved by all authors. E.D. and M.B. extracted the data and E.D. ran the analysis. All authors wrote the first draft and commented on different versions of the paper. All authors approved the final version of the paper. The corresponding author had final responsibility for the decision to submit for publication.

Conflicts of Interest

The authors declare no conflicts of interest.

References

  1. Saragiotto, B.T.; de Almeida, M.O.; Yamato, T.P.; Maher, C.G. Multidisciplinary biopsychosocial rehabilitation for nonspecific chronic low back pain. Phys. Ther. 2016, 96, 759–763. [Google Scholar] [CrossRef] [PubMed]
  2. Kamper, S.J.; Apeldoorn, A.T.; Chiarotto, A.; Smeets, R.J.; Ostelo, R.W.; Guzman, J.; van Tulder, M.W. Multidisciplinary biopsychosocial rehabilitation for chronic low back pain. Cochrane Database Syst. Rev. 2014, 9, CD000963. [Google Scholar] [CrossRef] [PubMed]
  3. Kamper, S.J.; Apeldoorn, A.T.; Chiarotto, A.; Smeets, R.J.; Ostelo, R.W.; Guzman, J.; van Tulder, M.W. Multidisciplinary biopsychosocial rehabilitation for chronic low back pain: Cochrane systematic review and meta-analysis. BMJ 2015, 350, h444. [Google Scholar] [CrossRef] [PubMed]
  4. Guzman, J.; Esmail, R.; Karjalainen, K.; Malmivaara, A.; Irvin, E.; Bombardier, C. Multidisciplinary bio-psycho-social rehabilitation for chronic low back pain. Cochrane Database Syst. Rev. 2002, 1, CD000963. [Google Scholar]
  5. Dragioti, E.; Evangelou, E.; Larsson, B.; Gerdle, B. Effectiveness of multidisciplinary programmes for clinical pain conditions: An umbrella review. J. Rehabil. Med. 2018, 50, 779–791. [Google Scholar] [CrossRef] [PubMed] [Green Version]
  6. Scascighini, L.; Toma, V.; Dober-Spielmann, S.; Sprott, H. Multidisciplinary treatment for chronic pain: A systematic review of interventions and outcomes. Rheumatology (Oxford) 2008, 47, 670–678. [Google Scholar] [CrossRef]
  7. Lambeek, L.C.; van Tulder, M.W.; Swinkels, I.C.; Koppes, L.L.; Anema, J.R.; van Mechelen, W. The trend in total cost of back pain in The Netherlands in the period 2002 to 2007. Spine (Phila. Pa. 1976) 2011, 36, 1050–1058. [Google Scholar] [CrossRef] [PubMed]
  8. Reneman, M.F.; Waterschoot, F.P.C.; Bennen, E.; Schiphorst Preuper, H.R.; Dijkstra, P.U.; Geertzen, J.H.B. Dosage of pain rehabilitation programs: A qualitative study from patient and professionals’ perspectives. BMC Musculoskelet. Disord. 2018, 19, 206. [Google Scholar] [CrossRef]
  9. Reneman, M.F.; Waterschoot, F.P.C.; Burgerhof, J.G.M.; Geertzen, J.H.B.; Schiphorst Preuper, H.R.; Dijkstra, P.U. Dosage of pain rehabilitation programmes for patients with chronic musculoskeletal pain: A non-inferiority randomised controlled trial. Disabil. Rehabil. 2018, 18, 1–8. [Google Scholar] [CrossRef]
  10. Waterschoot, F.P.; Dijkstra, P.U.; Geertzen, J.H.; Reneman, M.F. Dose or content? Effectiveness of pain rehabilitation programs for patients with chronic low back pain: A systematic review. Aurthor reply. Pain 2014, 155, 1902–1903. [Google Scholar] [CrossRef]
  11. Chen, J.J. Outpatient pain rehabilitation programs. Iowa Orthop. J. 2006, 26, 102–106. [Google Scholar] [PubMed]
  12. Kaiser, U.; Treede, R.D.; Sabatowski, R. Multimodal pain therapy in chronic noncancer pain-gold standard or need for further clarification? Pain 2017, 158, 1853–1859. [Google Scholar] [CrossRef]
  13. Moher, D.; Liberati, A.; Tetzlaff, J.; Altman, D.G.; Group, P. Preferred reporting items for systematic reviews and meta-analyses: the PRISMA statement. PLoS Med. 2009, 6, e1000097. [Google Scholar] [CrossRef]
  14. Liberati, A.; Altman, D.G.; Tetzlaff, J.; Mulrow, C.; Gotzsche, P.C.; Ioannidis, J.P.; Clarke, M.; Devereaux, P.J.; Kleijnen, J.; Moher, D. The PRISMA statement for reporting systematic reviews and meta-analyses of studies that evaluate health care interventions: Explanation and elaboration. J. Clin. Epidemiol. 2009, 62, e1–e34. [Google Scholar] [CrossRef] [PubMed]
  15. Furlan, A.D.; Pennick, V.; Bombardier, C.; van Tulder, M.; Editorial Board, Cochrane Back Review Group. 2009 updated method guidelines for systematic reviews in the Cochrane Back Review Group. Spine (Phila. Pa. 1976) 2009, 15, 1929–1941. [Google Scholar] [CrossRef] [PubMed]
  16. DerSimonian, R.; Laird, N. Meta-analysis in clinical trials. Control Clin. Trials 1986, 7, 177–188. [Google Scholar] [CrossRef]
  17. Higgins, J.P.; Thompson, S.G.; Deeks, J.J.; Altman, D.G. Measuring inconsistency in meta-analyses. BMJ 2003, 327, 557–560. [Google Scholar] [CrossRef] [Green Version]
  18. Higgins, J.P.; Thompson, S.G. Quantifying heterogeneity in a meta-analysis. Stat. Med. 2002, 21, 1539–1558. [Google Scholar] [CrossRef]
  19. Egger, M.; Davey Smith, G.; Schneider, M.; Minder, C. Bias in meta-analysis detected by a simple, graphical test. BMJ 1997, 315, 629–634. [Google Scholar] [CrossRef] [Green Version]
  20. Thompson, S.G.; Higgins, J.P. How should meta-regression analyses be undertaken and interpreted? Stat. Med. 2002, 21, 1559–1573. [Google Scholar] [CrossRef]
  21. Sterne, J.A.; Juni, P.; Schulz, K.F.; Altman, D.G.; Bartlett, C.; Egger, M. Statistical methods for assessing the influence of study characteristics on treatment effects in ‘meta-epidemiological’ research. Stat. Med. 2002, 21, 1513–1524. [Google Scholar] [CrossRef]
  22. Dragioti, E.; Dimoliatis, I.; Fountoulakis, K.N.; Evangelou, E. A systematic appraisal of allegiance effect in randomized controlled trials of psychotherapy. Ann. Gen. Psychiatry 2015, 14, 25. [Google Scholar] [CrossRef] [Green Version]
  23. Evangelou, E.; Tsianos, G.; Ioannidis, J.P. Doctors’ versus patients’ global assessments of treatment effectiveness: Empirical survey of diverse treatments in clinical trials. BMJ 2008, 336, 1287–1290. [Google Scholar] [CrossRef] [PubMed]
  24. Chinn, S. A simple method for converting an odds ratio to effect size for use in meta-analysis. Stat. Med. 2000, 19, 3127–3131. [Google Scholar] [CrossRef]
  25. Altman, D.G.; Egger, M.; Smith, G.D. Systematic Reviews in Health Care: Meta-Analysis in Context, 2nd ed.; BMJ Publishing Group: London, UK, 2001. [Google Scholar]
  26. Henschke, N.; Maher, C.G.; Refshauge, K.M.; Herbert, R.D.; Cumming, R.G.; Bleasel, J.; York, J.; Das, A.; McAuley, J.H. Prognosis in patients with recent onset low back pain in Australian primary care: Inception cohort study. BMJ 2008, 337, a171. [Google Scholar] [CrossRef] [PubMed]
  27. Maetzel, A.; Li, L. The economic burden of low back pain: A review of studies published between 1996 and 2001. Best Pract. Res. Clin. Rheumatol. 2002, 16, 23–30. [Google Scholar] [CrossRef]
  28. Vos, T.; Flaxman, A.D.; Naghavi, M.; Lozano, R.; Michaud, C.; Ezzati, M.; Shibuya, K.; Salomon, J.A.; Abdalla, S.; Aboyans, V.; et al. Years lived with disability (YLDs) for 1160 sequelae of 289 diseases and injuries 1990–2010: A systematic analysis for the Global Burden of Disease Study 2010. Lancet 2012, 380, 2163–2196. [Google Scholar] [CrossRef]
  29. Oliveira, C.B.; Maher, C.G.; Pinto, R.Z.; Traeger, A.C.; Lin, C.C.; Chenot, J.F.; van Tulder, M.; Koes, B.W. Clinical practice guidelines for the management of non-specific low back pain in primary care: An updated overview. Eur. Spine J. 2018, 27, 2791–2803. [Google Scholar] [CrossRef]
Figure 1. Risk of bias graph: assessments for seven risk of bias criteria presented as percentages across all included studies.
Jcm 08 00871 g001
Figure 2. The relative odds ratios (RORs) and 95% confidence intervals (CIs) for each outcome, and the summary RORs and their 95% CIs at short term of a short-length treatment vs. long-length treatment. The RORs were calculated with a random-effects model. A ROR >1 favours long length; an ROR <1 favours short length.
Jcm 08 00871 g002
Figure 3. The relative odds ratios (RORs) and 95% confidence intervals (CIs) for each outcome, and the summary RORs and their 95% CIs at short term of non-daily contact vs. daily contact. The RORs were calculated with a random-effects model. A ROR >1 favours daily contact; an ROR <1 favours non-daily contact.
Jcm 08 00871 g003
Figure 4. The relative odds ratios (RORs) and 95% confidence intervals (CIs) for each outcome, and the summary RORs and their 95% CIs at short term of low intensity vs. high intensity. The RORs were calculated with a random-effects model. A ROR >1 favours high intensity (i.e. >30 h per week); an ROR <1 favours low intensity (i.e. <30 h per week).
Jcm 08 00871 g004
Table 1. Characteristics of included studies.
Author, Year *CountrySample SizeFemale %Mean Age (or Age Range)TreatmentControlDefinition of Chronic LBPTotal Duration (Weeks)ContactContact Duration (h/Week)RoB Assessment
Abbassi, 2012Iran338845IMPTTAULBP >6 months7Non-daily contact4Low risk
Alaranta, 1994Finland2935641IMPTPhysicalLBP >6 months6Daily contact100High risk
Altmaier, 1992USA457340IMPTPhysicalLBP >3 months3Daily contact20High risk
Basler 1997Germany767649IMPTTAULBP >6 months12Non-daily contact2.5High risk
Bendix, 1996/1998Denmark1067040IMPTTAULBP >6 months3Daily contact49High risk
Bendix, 1995/1998Denmark1067542IMPTPhysicalLBP >6 months4Daily contact45High risk
Bendix, 2000Denmark1386541IMPTPhysicalLBP >6 months4Daily contact45High risk
Coole, 2013UK515344IMPTPhysicalLBP >3 months16Non-daily contact3High risk
Corey, 1996Canada138NRNRIMPTTAULBP >3 months5Daily contact32.5High risk
Fairbank, 2005UK3495118–55IMPTSurgeryLBP >1 year3Daily contact75Low risk
Harkapaa, 1989Finland3093745IMPTPhysicalLBP for >2 years3Daily contact100High risk
Hellum, 2011Norway1735141IMPTSurgeryLBP >1 year5Non-daily contact12High risk
Henchoz, 2010Switzerland1093240IMPTPhysicalLBP >3 months3Non-daily contact30High risk
Jackel, 1990Germany716249IMPTWLLBP >3 months6Daily contact36High risk
Jousset, 2004France843340IMPTPhysicalLBP >3 months5Daily contact30High risk
Kaapa, 2006Finland12010046IMPTPhysicalLBP >1 year7Daily contact100Low risk
Kole-Snijders, 1999Netherlands1486440IMPTWLLBP >6 months8Daily contact13High risk
Kool, 2007Switzerland1742142IMPTPhysical LBP >3 months3Non-daily contact24Low risk
Lambeek, 2010Netherlands1344218–65IMPTTAULBP >3 months12Non-daily contact3Low risk
Leeuw, 2008Netherlands854845IMPTIMPT LBP >3 months16Non-daily contact2Low risk
Linton, 2005Sweden1858349IMPTTAUNR6Non-daily contact2High risk
Lukinmaa, 1989Finland1585344IMPTTAUNR1Non-daily contact2.5High risk
Mangels, 2009Germany3637849IMPTPhysical ICD 104Daily contact100Low risk
Meng, 2011Germany3606449IMPTTAU/IMPT ICD 107Non-daily contact1High risk
Mitchell, 1994Canada54229nrIMPTTAUNR8Daily contact35High risk
Moix, 2003Spain305354IMPTTAUNR11Non-daily contact1High risk
Monticone, 2013Italy905850IMPTTAULBP >3 months5Non-daily contact3Low risk
Monticone, 2014Italy20NRNRIMPTPhysicalLBP >3 months8Non-daily contact3Low risk
Morone, 2011Italy736460IMPTTAULBP >3 months4Non-daily contact4High risk
Morone, 2012Italy757255IMPTTAU/
Physical
LBP >3 months4Non-daily contact4High risk
Nicholas, 1991Australia585241IMPTPhysicalLBP >6 months5Non-daily contact3.5High risk
Nicholas, 1992Australia204544IMPTPhysicalLBP >6 months5Non-daily contact3.5High risk
Roche, 2007/2011France1323540IMPTPhysicalLBP >3 months5Daily contact30Low risk
Smeets, 2006/2008Netherlands2124247IMPTWLLBP >3 months10Non-daily contact7.1Low risk
Skouen, 2002Norway1954443IMPTTAU/IMPTNR4Daily contact30High risk
Schweikert, 2006Germany4091747IMPTPhysicalLBP >6 months3Daily contact17.5High risk
Strand, 2001Norway1176143IMPTTAUICPC diagnosis5Daily contact30High risk
Streibelt, 2009Germany2221746IMPTPhysicalNR3Non-daily contact20High risk
Tavafian, 2008Iran10210043IMPTTAULBP >3 months1Non-daily contact 5High risk
Tavafian, 2011Iran1972245IMPTTAULBP >3 months1Non-daily contact10Low risk
Tavafian, 2014Iran1787544IMPTTAULBP >3 months1Daily contact5High risk
Tavafian 2017Iran1467846IMPTTAULBP >3 months1Daily contact5Low risk
Tavafian, 2017Iran1657945IMPTTAULBP >3 months1Daily contact5Low risk
Turner, 1990USA964944IMPTPhysical/
WL
LBP >6 months8Non-daily contact2High risk
Van den Hout, 2003Netherlands843440IMPTIMPTLBP >6 months8Non-daily contact20High risk
Vollenbroek-Hutten, 2004Netherlands163NR39IMPTTAULBP >6 months7Non-daily contact9Low risk
Von Korff, 2005USA2406350IMPTTAUscore >7/23 on RMDQ1Non-daily contact3High risk
* See references of included randomised controlled trials (RCTs) 1–47 in Supplementary Materials; ICD 10—International Statistical Classification of Diseases and Related Health Problems, Tenth Revision, ICPC—International Classification of Primary Care, LBP—lower back pain, IMPT—interdisciplinary multimodal pain therapy, NR—not reported, RMDQ—Roland Morris Disability Questionnaire, RoB—risk of bias, TAU—treatment as usual, UK—United Kingdom, USA—United States of America, WL—waiting list.
Table 2. Characteristics and subgroup meta-analysis for dose of IMPT by length, contact, and intensity of the six investigated outcomes.
Short-Term OutcomesNo. of RCTsAverage Total Duration (Median Weeks, IQR)Average h/Week (Median, IQR)Level of Daily/Non-Daily Contact (n)Level of Active (i.e., Physical)/Non-Active Control (i.e., WL/TAU) (n)Level of Low Risk/High Risk of Bias (n)Overall ES (95% CI)
Random-Effects Model
p-ValueI2
(%; 95% CI) p-Value
Outcome 1: Pain
Length
Short length (<5 weeks)123 (1–4)7.5 (4–22)8/46/63/9SMD, −0.33 (−0.55 to −0.11)0.00381 (67–88) 0.000
Long length (≥5 weeks)168 (5.5–10)3.5 (2.7–10)4/128/88/8SMD, −0.45 (−0.73 to −0.17)0.00179 (64–85) 0.000
Contact
Non-daily contact167.5 (4.5–10)3.3 (2.7–4)0/167/96/10SMD, −0.50 (−0.79 to −0.20)0.00180 (67–86) 0.000
Daily contact123 (2–5.5)22 (11.5–68)12/07/55/7SMD, -0.29 (−0.49 to −0.09)0.00578 (59–86) 0.000
Intensity
<30 h per week235 (3–8)4 (3–7.1)7/1610/138/15SMD, −0.42 (−0.62 to −0.20)<0.00081 (71–86) 0.000
>30 h per week55 (4–6)100 (36–100)5/04/13/2SMD, −0.32 (−0.63 to −0.05)0.02279 (31–89) 0.001
Outcome 2: Disability
Length
Short length (<5 weeks)103 (1–4)7.5 (4–30)5/55/52/8SMD, −0.27 (−0.48 to −0.07)0.00775 (47–85) 0.000
Long length (≥5 weeks)177 (6–10)3.5 (3–9)4/139/89/8SMD, −0.51 (−0.78 to −0.24)<0.00082 (73–88) 0.000
Contact
Non-daily contact187 (4–10)3.5 (3–4)0/188/107/11SMD, −0.58 (−0.86 to −0.31)<0.00081 (70–87) 0.000
Daily contact94 (1–3)36 (18–100)9/06/34/5SMD, −0.16 (−0.33–0.01)0.05567 (16–82) 0.002
Intensity
<30 h per week206 (4–9)3.8 (3–6)3/178/128/12SMD, −0.49 (−0.74 to −0.24)<0.00085 (78–89) 0.000
>30 h per week75 (3–6)100 (30–100)6/16/13/4SMD, −0.26 (−0.43 to −0.09)0.00354 (0–78) 0.043
Outcome 3: Return to work
Length
Short length (<5 weeks)33 (1–4)24 (3–30)2/11/21/2OR, 1.46 (0.82–2.62)0.19942 (0–83) 0.177
Long length (≥5 weeks)25 (5–5)30 (30–30)2/02/01/1OR, 1.10 (0.55–2.20)0.7860 (NA) # 0.938
Contact
Non-daily contact11 (1–1)3 (3–3)0/10/10/1OR, 0.91 (0.31–2.68)0.864NA
Daily contact44.5 (3.5–5)30 (27–30)4/01/32/2OR, 1.46 (0.96–2.21)0.07512 (0–72) 0.332
Intensity
<30 h per week22 (1–3)13.5 (3–24)1/11/11/1OR, 1.63 (0.65–4.09)0.29756 (NA) # 0.133
>30 h per week35 (4–5)30 (30–30)3/02/11/2OR, 1.12 (0.69–1.82)0.6450 (0–73) 0.994
Outcome 4: Quality of life
Length
Short length (<5 weeks)81.5 (1–3.5)7.5 (4–13.7)5/33/52/6SMD, 0.49 (0.14–0.84)0.00683 (65–90) 0.000
Long length (≥5 weeks)110 (10–10)7.1 (7.1–7.1)0/11/01/0SMD, 0.14 (−0.24–0.52)0.470NA
Contact
Non-daily contact44 (1–10)4 (3–7.1)0/42/22/2SMD, 0.53 (0.09–0.98)0.01964 (0–86) 0.038
Daily contact51.5 (1–3)10 (5–18)5/02/31/4SMD, 0.38 (−0.06–0.81)0.08988 (70–93) 0.000
Intensity
<30 h per week82 (1–4))6 (4–10)4/43/52/6SMD, 0.54 (0.25–0.83)<0.00075 (38–86) 0.000
>30 h per week12 (2–2)100 (100–100)1/01/01/0SMD, −0.38 (−0.74 to −0.02)0.041 *NA
Outcome 5: Depression
Length
Short length (<5 weeks)23.5 (3–4)58.8 (17.5–100)2/02/01/1SMD, 0.08 (−0.22–0.39)0.58471 (NA)# 0.063
Long length (≥5 weeks)87.5 (5.5–9)5.3 (2.8–21.5)2/65/33/5SMD, −0.09 (−0.29–0.11)0.35820 (0–64) 0.273
Contact
Non-daily contact68 (5–10)3.5 (2–7.1)0/64/22/4SMD, 0.01 (−0.21–0.22)0.9590 (0–61) 0.562
Daily contact45 (3.5–6.5)68 (26.8–100)4/03/12/2 SMD, −0.07 (−0.35–0.22)0.65372 (0–88) 0.013
Intensity
<30 h per week78 (5–10)7.1 (2–17.5)2/54/32/5SMD, 0.12 (−0.03–0.27)0.1191 (0–59) 0.414
>30 h per week35 (4–7)100 (3.5–100)2/13/02/1 SMD, −0.18 (−0.46–0.10)0.20246 (0–84) 0.155
Outcome 6: Anxiety
Length
Short length (<5 weeks)13 (3–3)17.5 (17.5–17.5)1/01/00/1SMD, 0.08 (−0.13–0.29)0.455NA
Long length (≥5 weeks)15 (5–5)3.5 (3.5–3.5)0/11/00/1SMD, −0.58 (−1.48–0.32)0.209NA
Contact
Non-daily contact15 (5–5)3.5 (3.5–3.5)0/11/00/1SMD, −0.58 (−1.48–0.32)0.209NA
Daily contact13 (3–3)17.5 (17.5–17.5)1/01/00/1SMD, 0.08 (−0.13–0.29)0.455NA
Intensity
<30 h per week24 (3–5)10.5 (3.5–17.5)1/12/00/2SMD, −0.10 (−0.67–0.48)0.74048 (NA) # 0.164
>30 h per week00 (0–0)0 (0–0)0/00/00/0NANANA
Notes: * favours control, # degrees of freedom (df n − 1) must be at least 2, CI—confidence interval, ES—effect size, OR—odds ratio, I2—I square metric of heterogeneity, IQR—interquartile range, TAU—treatment as usual, SMD—standardised mean difference, NA—not applicable, WL—waiting list.

