Metabolomic Investigation of β-Thalassemia in Chorionic Villi Samples

 ,
, 
Abstract
:1. Introduction
2. Materials and Methods
2.1. Sample Preparation
2.2. Gas Chromatography Mass–Spectrometry Analysis and Data Processing
2.3. Statistical Analysis
2.4. Pathways Analysis
3. Results
4. Discussion
5. Conclusions
Author Contributions
Acknowledgments
Conflicts of Interest
References
- Weatherall, D.J.; Clegg, J.B. The Thalassemia Syndromes, 4th ed.; Blackwell Science Ltd.: Oxford, UK, 2001; pp. 1–846. [Google Scholar]
- Cao, A. William Allan Award address. Am. J. Hum. Genet. 1994, 54, 397–402. [Google Scholar]
- Thein, S.L. The molecular basis of β-thalassemia. Cold Spring Harb. Perspect. Med. 2013, 3, a011700. [Google Scholar] [CrossRef]
- Cao, A.; Rosatelli, M.C.; Monni, G.; Galanello, R. Screening for thalassemia: A model of success. Obstet. Gynecol. Clin. N. Am. 2002, 29, 305–328. [Google Scholar] [CrossRef]
- Monni, G.; Peddes, C.; Iuculano, A.; Ibba, R.M. From Prenatal to Preimplantation Genetic Diagnosis of β-Thalassemia. Prevention Model in 8748 Cases: 40 Years of Single Center Experience. J. Clin. Med. 2018, 7, 35. [Google Scholar] [CrossRef]
- Nagana Gowda, G.A.; Zhang, S.; Gu, H.; Asiago, V.; Shanaiah, N.; Raftery, D. Metabolomics-based methods for early disease diagnostics. Expert Rev. Mol. Diagn. 2008, 8, 617–633. [Google Scholar] [CrossRef] [Green Version]
- Cindrova-Davies, T.; Tissot van Patot, M.; Gardner, L.; Jauniaux, E.; Burton, G.J.; Charnock-Jones, D.S. Energy status and HIF signalling in chorionic villi show no evidence of hypoxic stress during human early placental development. Mol. Hum. Reprod. 2015, 21, 296–308. [Google Scholar] [CrossRef]
- Dunn, W.B.; Brown, M.; Worton, S.A.; Davies, K.; Jones, R.L.; Kell, D.B.; Heazell, A.E.P. The metabolome of human placental tissue: Investigation of first trimester tissue and changes related to preeclampsia in late pregnancy. Metabolomics 2012, 8, 579–597. [Google Scholar] [CrossRef]
- Dettmer, K.; Aronov, P.A.; Hammock, B.D. Mass spectrometry-based metabolomics. Mass Spectrom. Rev. 2007, 26, 51–78. [Google Scholar] [CrossRef]
- Griffin, J.L.; Atherthon, H.; Shockcor, J.; Atzori, L. Metabolomics as a tool for cardiac research. Nat. Rev. Cardiol. 2011, 8, 630–643. [Google Scholar] [CrossRef]
- Poddighe, S.; Murgia, F.; Lorefice, L.; Liggi, S.; Cocco, E.; Marrosu, M.G.; Atzori, L. Metabolomic analysis identifies altered metabolic pathways in Multiple Sclerosis. Int. J. Biochem. Cell Biol. 2017, 93, 148–155. [Google Scholar] [CrossRef]
- Syggelou, A.; Iacovidou, N.; Atzori, L.; Xanthos, T.; Fanos, V. Metabolomics in the developping human being. Pediatr. Clin. N. Am. 2012, 59, 1039–1058. [Google Scholar] [CrossRef]
- De Sanctis, V.; Soliman, A.T.; Elsedfy, H.; Skordis, N.; Kattamis, C.; Angastiniotis, M.; Karimi, M.; Yassin, M.; El Awwa, A.; Stoeva, I.; et al. Growth and endocrine disorders in thalassemia: The international network on endocrine complications in thalassemia (I-CET) position statement and guidelines. Indian J. Endocrinol. Metab. 2003, 17, 8–18. [Google Scholar] [CrossRef]
- De Sanctis, V.; Soliman, A.T.; Elsedfy, H.; Pepe, A.; Kattamis, C.; El Kholy, M.; Yassin, M. Diabetes and Glucose Metabolism in Thalassemia Major: An Update. Expert Rev. Hematol. 2016, 9, 401–408. [Google Scholar] [CrossRef]
- Musharraf, S.G.; Iqbal, A.; Ansari, S.H.; Parveen, S.; Khan, I.A.; Siddiqui, A.J. β-Thalassemia Patients Revealed a Significant Change of Untargeted Metabolites in Comparison to Healthy Individuals. Sci. Rep. 2017, 7, 42249. [Google Scholar] [CrossRef]
- Monni, G.; Ibba, R.M.; Lai, R.; Cau, G.; Mura, S.; Olla, G.; Rosatelli, M.C.; Cao, A. Early transabdominal chorionic villus sampling in couples at high genetic risk. Am. J. Obstet. Gynecol. 1993, 168, 170–173. [Google Scholar] [CrossRef]
- Monni, G.; Ibba, R.M.; Zoppi, M.A. Prenatal Genetic Diagnosis through Chorionic Villus Sampling. In Genetic Disorders and the Fetus, 6th ed.; Milunsky, A., Milunsky, J.M., Eds.; Wiley-Blackwell: Hoboken, NJ, USA, 2010; pp. 160–193. [Google Scholar]
- Murgia, F.; Iuculano, A.; Peddes, C.; Santoru, M.L.; Tronci, L.; Deiana, M.; Atzori, L.; Monni, G. Metabolic Fingerprinting of Chorionic Villous Samples in Normal Pregnancy and Chromosomal Disorders. Prenat. Diagn. 2019. [Google Scholar] [CrossRef]
- R Core Team. R: A language and environment for statistical computing. R Foundation for Statistical Computing. 2011. Available online: http://www.R-project.org/ (accessed on 26 November 2018).
- Smith, C.A.; Want, E.J.; O’Maille, G.; Abagyan, R.; Siuzdak, G. XCMS: Processing mass spectrometry data for metabolite profiling using nonlinear peak alignment, matching, and identification. Anal. Chem. 2006, 78, 779–787. [Google Scholar] [CrossRef]
- Liggi, S.; Hinz, C.; Hall, Z.; Santoru, M.L.; Poddighe, S.; Fjeldsted, J.; Atzori, L.; Griffin, J.L. KniMet: A pipeline for the processing of chromatography-mass spectrometry metabolomics data. Metabolomics 2018, 14, 52. [Google Scholar] [CrossRef]
- Eriksson, L.; Byrne, T.; Johansson, E.; Trygg, J.; Wikström, C. Multi- and Megavariate Data Analysis Basic Principles and Applications, 3rd ed.; Umetrics Academy: Malmo, Sweden, 2013; pp. 1–501. [Google Scholar]
- Chong, J.; Soufan, O.; Li, C.; Caraus, I.; Li, S.; Bourque, G.; Wishart, D.S.; Xia, J. MetaboAnalyst 4.0: Towards more transparent and integrative metabolomics analysis. Nucleic Acids Res. 2018, 46, W486–W494. [Google Scholar] [CrossRef]
- Iuculano, A.; Murgia, F.; Peddes, C.; Santoru, M.L.; Tronci, L.; Deiana, M.; Balsamo, A.; Euser, A.; Atzori, L.; Monni, G. Metabolic characterization of amniotic fluids of fetuses with enlarged nuchal translucency. J. Perinat. Med. 2019, 47, 311–318. [Google Scholar] [CrossRef]
- Wamelink, M.M.; Struys, E.A.; Jakobs, C. The biochemistry, metabolism and inherited defects of the pentose phosphate pathway: A review. J. Inherit. Metab. Dis. 2008, 31, 703–717. [Google Scholar] [CrossRef]
- Stincone, A.; Prigione, A.; Cramer, T.; Wamelink, M.; Campbell, K.; Cheung, E.; Olin-Sandoval, V.; Grüning, N.M.; Krüger, A.; Alam, M.T.; et al. The return of metabolism: Biochemistryand physiology of the pentose phosphate pathway. Biol. Rev. 2015, 90, 927–963. [Google Scholar] [CrossRef]
- Wood, T. Physiological functions of the pentose phosphate pathway. Cell Biochem. Funct. 1986, 4, 241–247. [Google Scholar] [CrossRef]
- Mahdi, E.A. Relationship between oxidative stress and antioxidant status in beta thalassemia major patients. ActaChim. Pharm. Indica 2014, 4, 137–145. [Google Scholar]
- Fibach, E.; Mutaz, D. Oxidative Stress in β-Thalassemia. Mol. Diagn. Ther. 2019, 23, 245–261. [Google Scholar] [CrossRef]
- Voskou, S.; Aslan, M.; Fanis, P.; Phylactides, M.; Kleanthous, M. Oxidative stress in β-thalassaemia and sickle cell disease. Redox Biol. 2015, 6, 226–239. [Google Scholar] [CrossRef]
- Pavlova, L.E.; Savov, V.M.; Petkov, H.G.; Charova, I.P. Oxidative stress in patients with β-thalassemia major. Prilozi 2007, 28, 145–154. [Google Scholar]
- Balboa, M.A.; Balsinde, J. Oxidative stress and arachidonic acid mobilization. Biochim. Biophys. Acta 2006, 1761, 385–391. [Google Scholar] [CrossRef]
- Sapirstein, A.; Bonventre, J.V. Phospholipases A2 in ischemic and toxic brain injury. Neurochem. Res. 2000, 25, 745–753. [Google Scholar] [CrossRef]
- Tallima, H.; El Ridi, R. Arachidonic acid: Physiological roles and potential health benefits—A review. J. Adv. Res. 2018, 11, 33–41. [Google Scholar] [CrossRef]

| Patients (n) | Age (years) | Gestational Age (weeks) | NT (mm) | CRL (mm) | |
|---|---|---|---|---|---|
| Control | 27 | 36.8 ± 5.3 | 12.72 ± 0.75 | 2.07 ± 0.9 | 61.34 ± 9.8 |
| Heterozygotes | 7 | 31.2 ± 4.1 | 12.2 ± 1.8 | 1.4 ± 0.4 | 53.0 ± 5.4 |
| Homozygotes | 6 | 34.7 ± 2.9 | 11.9 ± 0.55 | 1.5 ± 0.3 | 52.9 ± 5.2 |
| Supervised Models | ||||||
|---|---|---|---|---|---|---|
| N | R2X | R2Y | Q2 | p-Value | Permutation Test: Intercept R2\Q2 | |
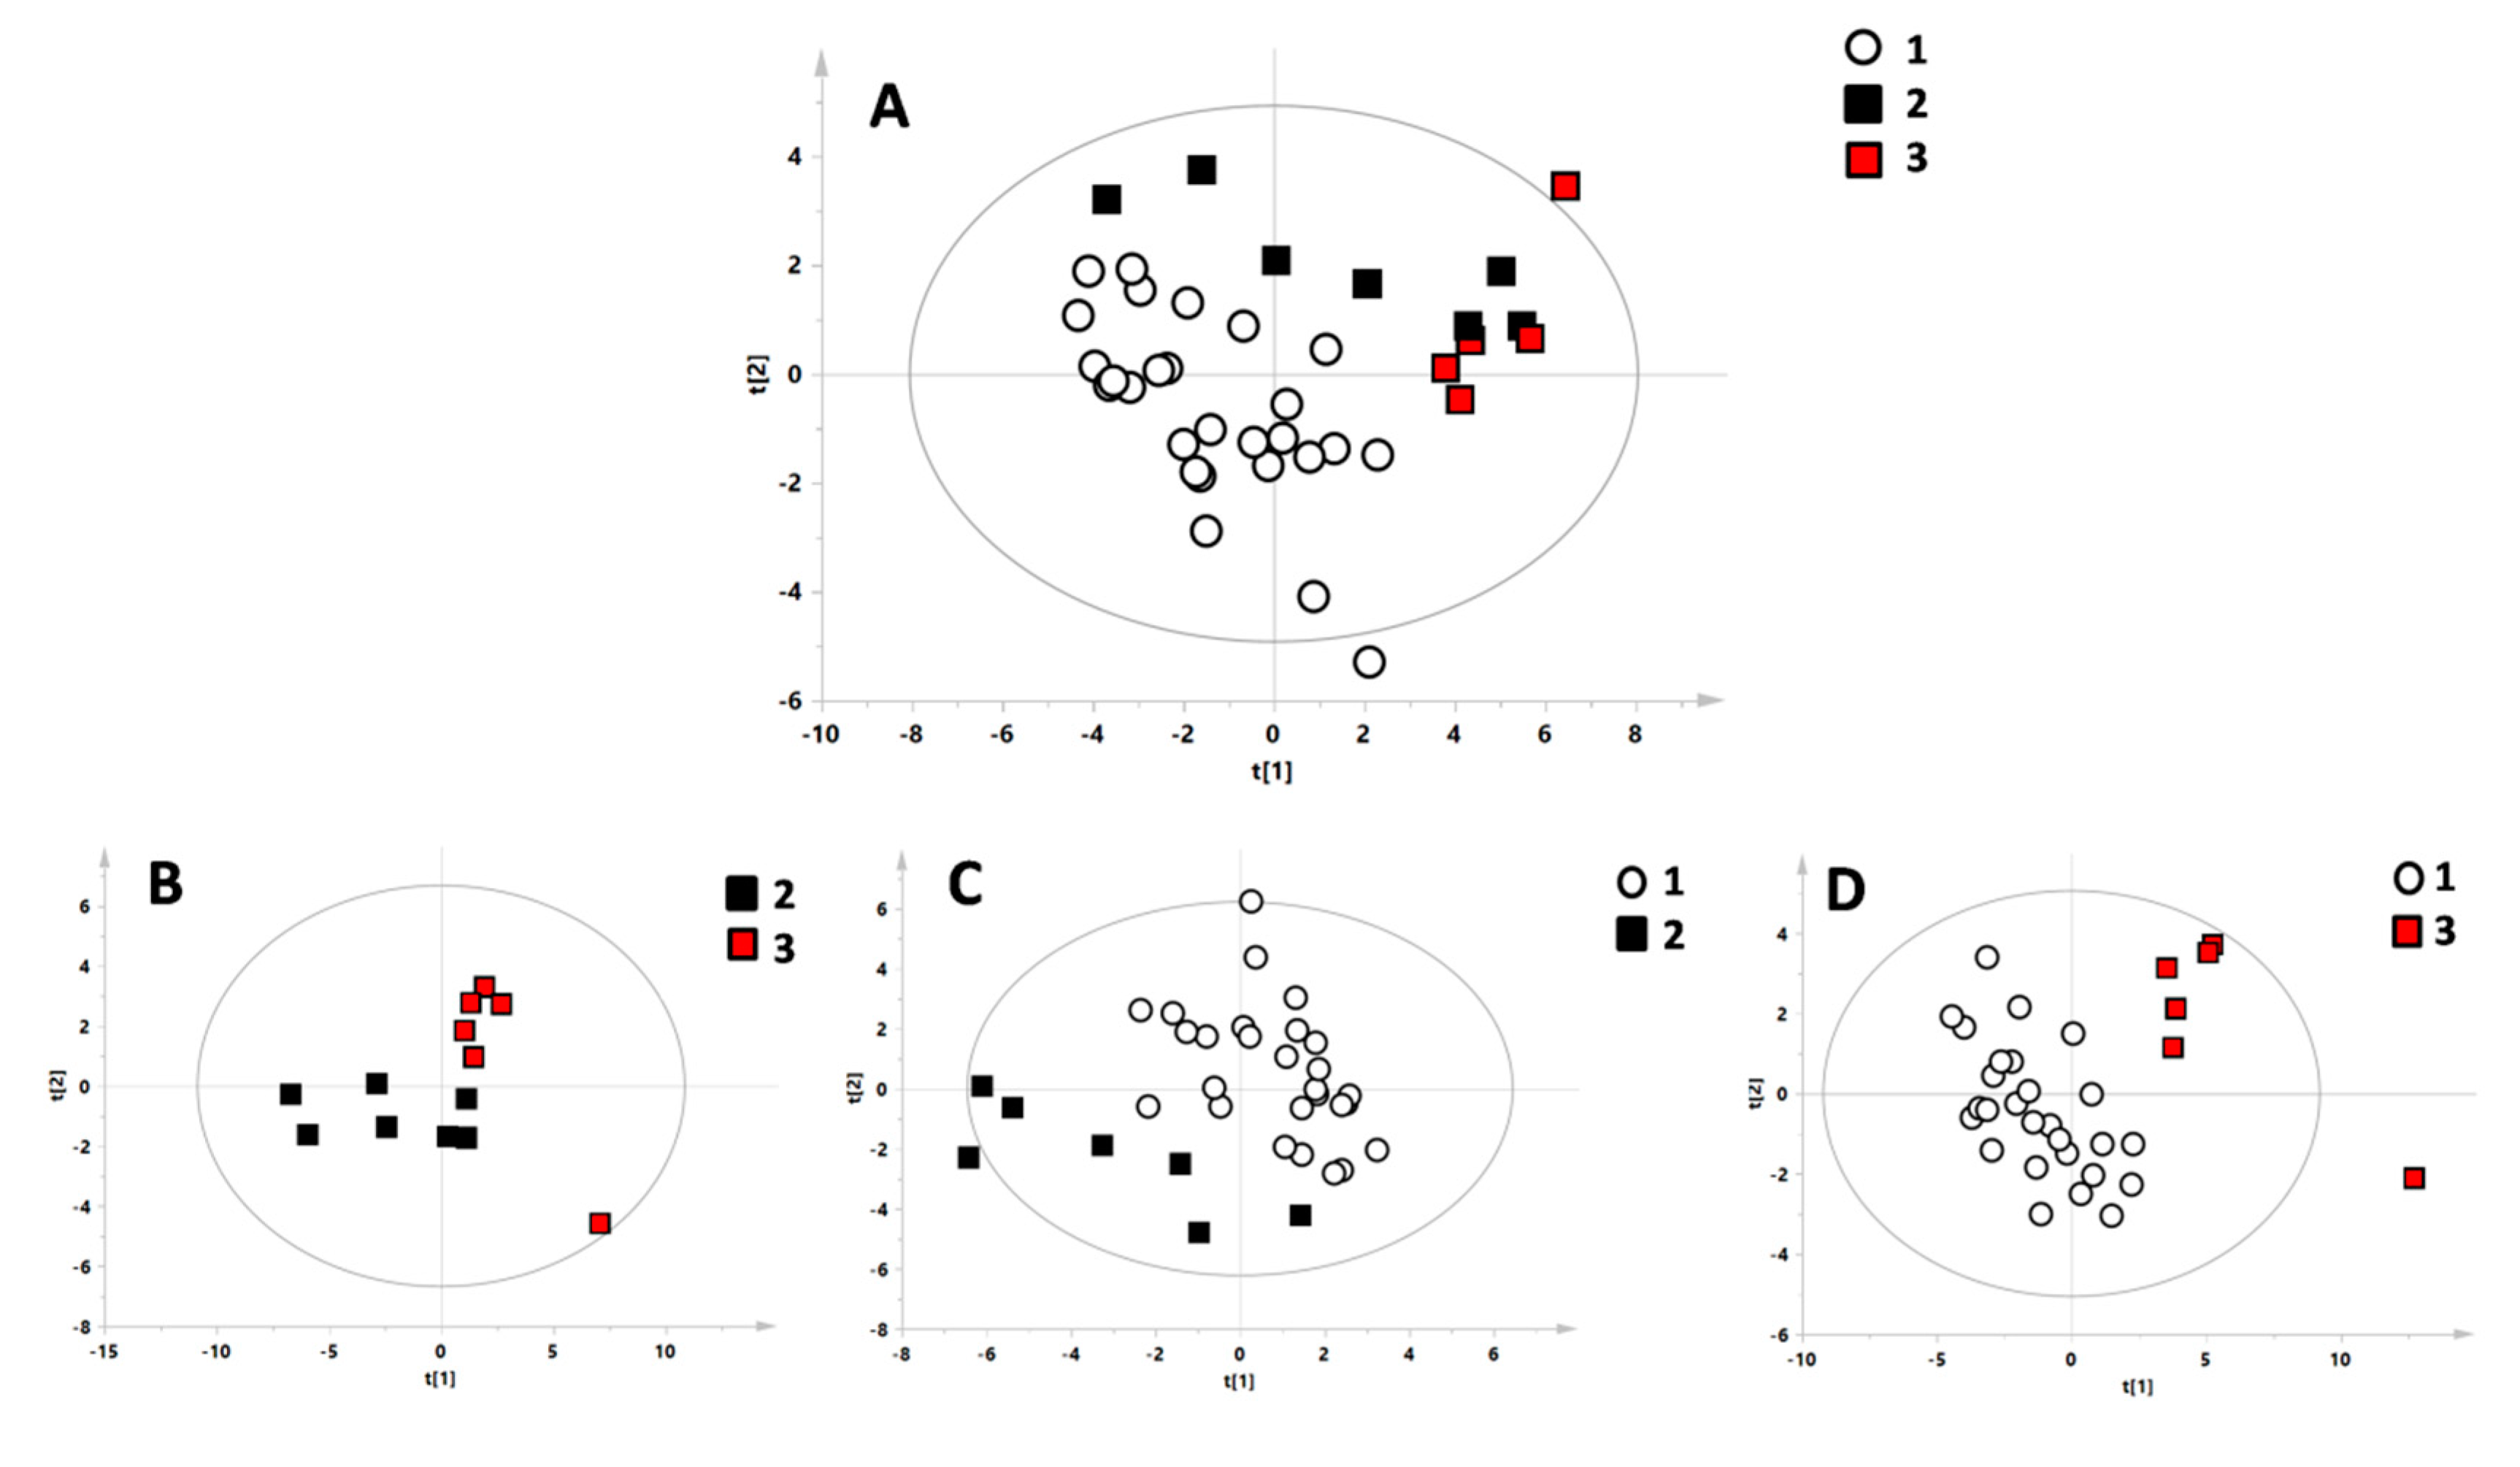
| C vs. Hom vs. Het | 39 | 0.351 | 0.484 | 0.159 | ns | 0.27/−0.14 |
| Het vs. Hom | 13 | 0.515 | 0.699 | 0.246 | ns | 0.73/−0.03 |
| C vs. Het | 34 | 0.352 | 0.689 | 0.390 | 0.003 | 0.44/−0.21 |
| C vs. Hom | 33 | 0.486 | 0.917 | 0.658 | <0.0001 | 0.55/−0.33 |
© 2019 by the authors. Licensee MDPI, Basel, Switzerland. This article is an open access article distributed under the terms and conditions of the Creative Commons Attribution (CC BY) license (http://creativecommons.org/licenses/by/4.0/).
Share and Cite
Monni, G.; Murgia, F.; Corda, V.; Peddes, C.; Iuculano, A.; Tronci, L.; Balsamo, A.; Atzori, L. Metabolomic Investigation of β-Thalassemia in Chorionic Villi Samples. J. Clin. Med. 2019, 8, 798. https://doi.org/10.3390/jcm8060798
Monni G, Murgia F, Corda V, Peddes C, Iuculano A, Tronci L, Balsamo A, Atzori L. Metabolomic Investigation of β-Thalassemia in Chorionic Villi Samples. Journal of Clinical Medicine. 2019; 8(6):798. https://doi.org/10.3390/jcm8060798
Chicago/Turabian StyleMonni, Giovanni, Federica Murgia, Valentina Corda, Cristina Peddes, Ambra Iuculano, Laura Tronci, Antonella Balsamo, and Luigi Atzori. 2019. "Metabolomic Investigation of β-Thalassemia in Chorionic Villi Samples" Journal of Clinical Medicine 8, no. 6: 798. https://doi.org/10.3390/jcm8060798