Transthoracic Impedance Measured with Defibrillator Pads—New Interpretations of Signal Change Induced by Ventilations

 , , , and
Abstract
:1. Introduction
2. Materials and Methods
2.1. Study Design and Patient Recruitment
2.2. Experimental Protocol
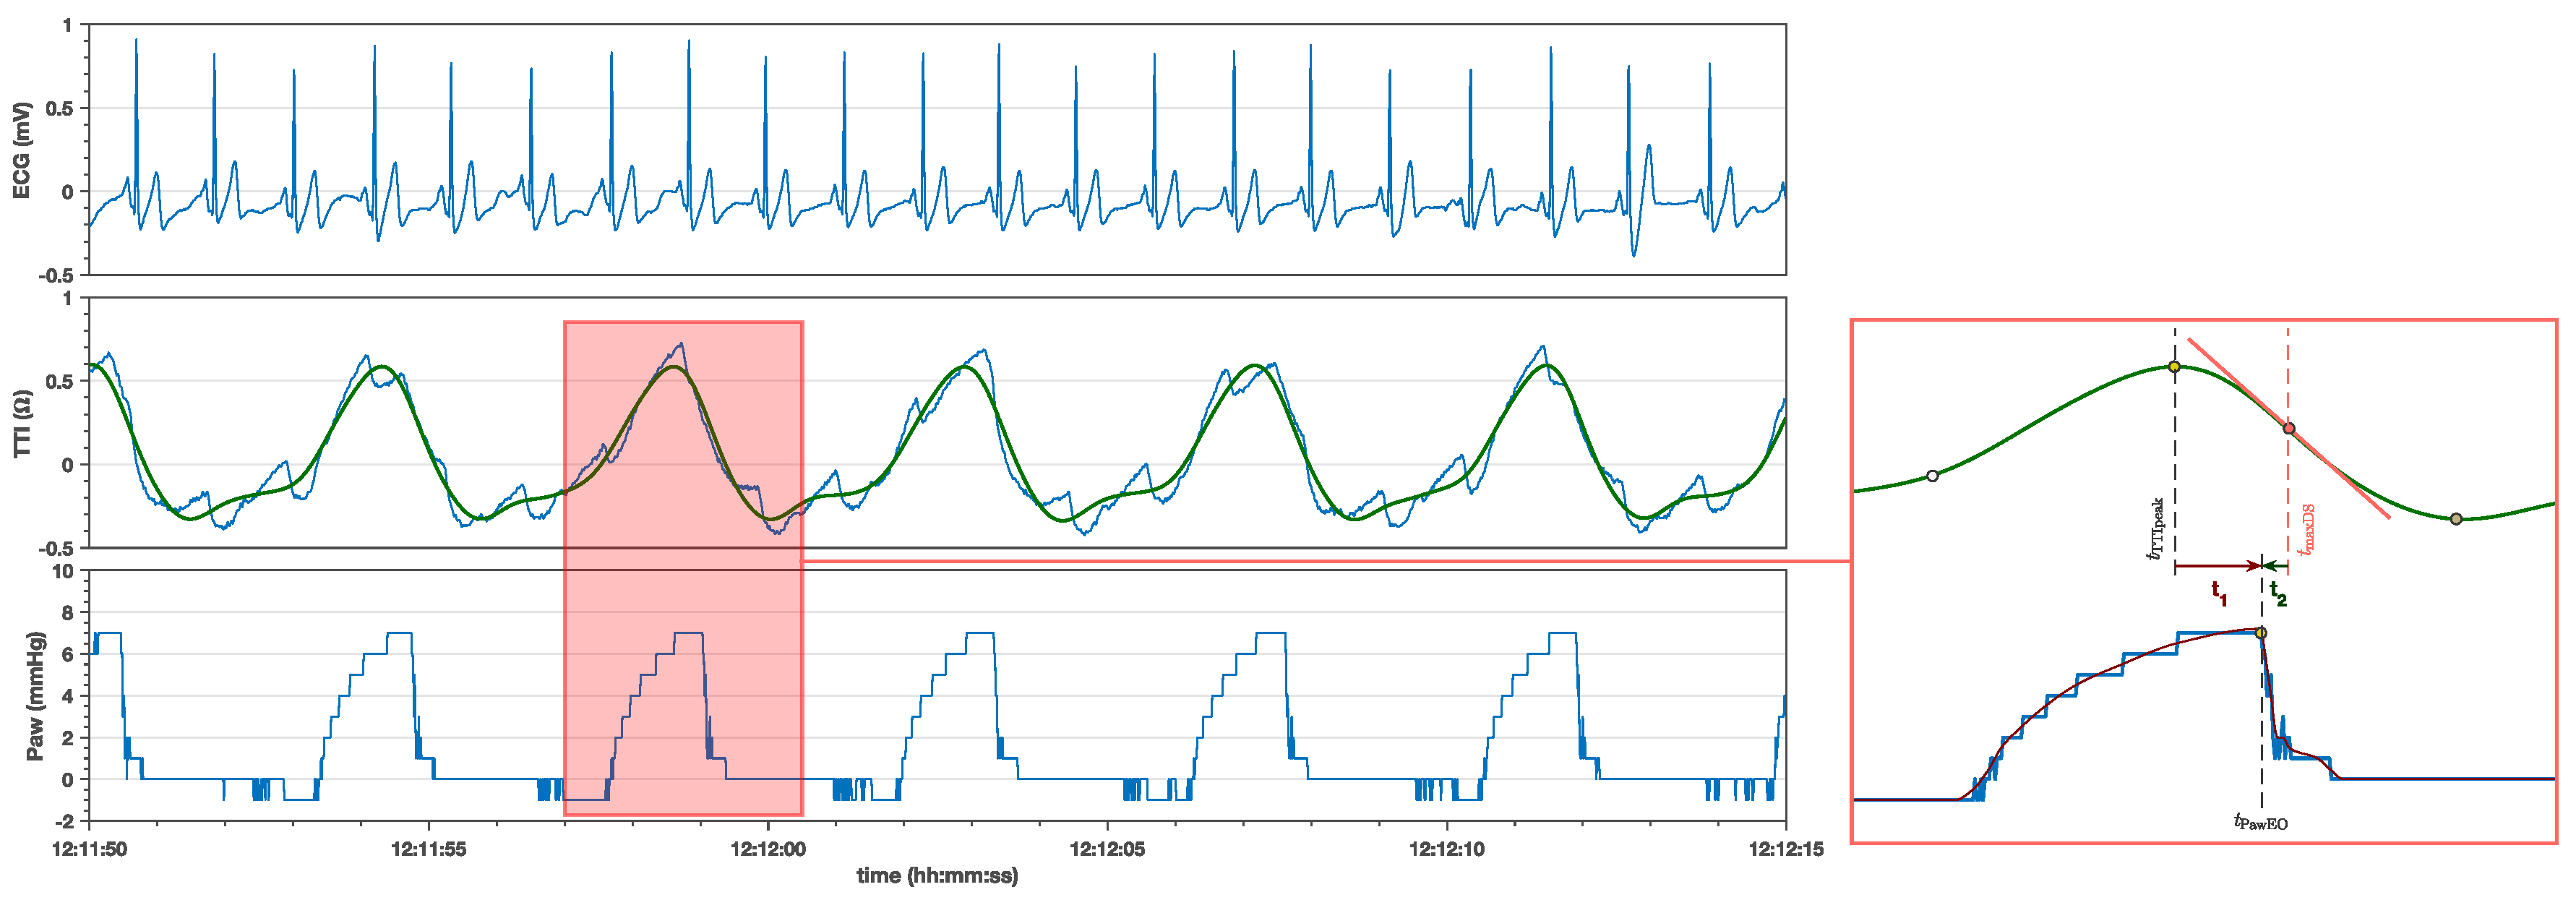
2.3. Measurement of Variables of Interest
2.4. Statistical Analysis
3. Results
4. Discussion
Limitations
5. Conclusions
Author Contributions
Funding
Conflicts of Interest
Abbreviations
| BMI | Body Mass Index |
| CI | Confidence Interval |
| CPR | Cardiopulmonary Resuscitation |
| ECG | Electrocardiogram |
| fps | Frames Per Second |
| I:E ratio | Inspiration Expiration ratio |
| LP15 | LifePack 15 (monitor-defibrillator) |
| maxDS | Maximum downslope point of the TTI ventilation waveform |
| OR | Operating Room |
| Paw | Airway Pressure |
| PawEO | Expiration Onset in Airway Pressure |
| pETCO2 | Partial Pressure of Exhaled Carbon Dioxide |
| TIpeak | Peak point of the TTI ventilation waveform |
| TTI | Trans Thoracic Impedance |
References
- Monsieurs, K.G.; Nolan, J.P.; Bossaert, L.L.; Greif, R.; Maconochie, I.K.; Nikolaou, N.I.; Perkins, G.D.; Soar, J.; Truhlář, A.; Wyllie, J.; et al. European Resuscitation Council Guidelines for Resuscitation 2015: Section 1. Executive summary. Resuscitation 2015, 95, 1–80. [Google Scholar] [CrossRef]
- Putensen, C.; Wrigge, H.; Zinserling, J. Electrical impedance tomography guided ventilation therapy. Curr. Opin. Crit. Care 2007, 13, 344–350. [Google Scholar] [CrossRef]
- Karagiannidis, C.; Waldmann, A.D.; Róka, P.L.; Schreiber, T.; Strassmann, S.; Windisch, W.; Böhm, S.H. Regional expiratory time constants in severe respiratory failure estimated by electrical impedance tomography: A feasibility study. Crit. Care 2018, 22, 221. [Google Scholar] [CrossRef]
- Pellis, T.; Bisera, J.; Tang, W.; Weil, M.H. Expanding automatic external defibrillators to include automated detection of cardiac, respiratory, and cardiorespiratory arrest. Crit. Care Med. 2002, 30, S176–S178. [Google Scholar] [CrossRef] [PubMed]
- Wik, L.; Kramer-Johansen, J.; Myklebust, H.; Sørebø, H.; Svensson, L.; Fellows, B.; Steen, P. Quality of cardiopulmonary resuscitation during out-of-hospital cardiac arrest. JAMA 2005, 293, 299. [Google Scholar] [CrossRef] [PubMed]
- Kramer-Johansen, J.; Myklebust, H.; Wik, L.; Fellows, B.; Svensson, L.; Sørebø, H.; Steen, P.A. Quality of out-of-hospital cardiopulmonary resuscitation with real time automated feedback: A prospective interventional study. Resuscitation 2006, 71, 283–292. [Google Scholar] [CrossRef] [Green Version]
- Stecher, F.S.; Olsen, J.A.; Stickney, R.E.; Wik, L. Transthoracic impedance used to evaluate performance of cardiopulmonary resuscitation during out of hospital cardiac arrest. Resuscitation 2008, 79, 432–437. [Google Scholar] [CrossRef]
- Beesems, S.G.; Wijmans, L.; Tijssen, J.G.P.; Koster, R.W. Duration of ventilations during cardiopulmonary resuscitation by lay rescuers and first responders: relationship between delivering chest compressions and outcomes. Circulation 2013, 127, 1585–1590. [Google Scholar] [CrossRef]
- Alonso, E.; Ruiz, J.; Aramendi, E.; González-Otero, D.; Ruiz de Gauna, S.; Ayala, U.; Russell, J.K.; Daya, M. Reliability and accuracy of the thoracic impedance signal for measuring cardiopulmonary resuscitation quality metrics. Resuscitation 2015, 88, 28–34. [Google Scholar] [CrossRef]
- González-Otero, D.M.; Ruiz de Gauna, S.; Ruiz, J.; Daya, M.R.; Wik, L.; Russell, J.K.; Kramer-Johansen, J.; Eftestøl, T.; Alonso, E.; Ayala, U. Chest compression rate feedback based on transthoracic impedance. Resuscitation 2015, 93, 82–88. [Google Scholar] [CrossRef] [PubMed]
- Kwok, H.; Coult, J.; Liu, C.; Blackwood, J.; Kudenchuk, P.J.; Rea, T.D.; Sherman, L. An accurate method for real-time chest compression detection from the impedance signal. Resuscitation 2016, 105, 22–28. [Google Scholar] [CrossRef]
- Ayala, U.; Irusta, U.; Ruiz, J.; Ruiz de Gauna, S.; González-Otero, D.; Alonso, E.; Kramer-Johansen, J.; Naas, H.; Eftestøl, T. Fully automatic rhythm analysis during chest compression pauses. Resuscitation 2015, 89, 25–30. [Google Scholar] [CrossRef]
- Wik, L.; Olsen, J.A.; Persse, D.; Sterz, F.; Lozano, M.; Brouwer, M.A.; Westfall, M.; Souders, C.M.; Malzer, R.; van Grunsven, P.M.; et al. Manual vs. integrated automatic load-distributing band CPR with equal survival after out of hospital cardiac arrest. The randomized CIRC trial. Resuscitation 2014, 85, 741–748. [Google Scholar] [CrossRef]
- Charbonney, E.; Delisle, S.; Savary, D.; Bronchti, G.; Rigollot, M.; Drouet, A.; Badat, B.; Ouellet, P.; Gosselin, P.; Mercat, A.; et al. A new physiological model for studying the effect of chest compression and ventilation during cardiopulmonary resuscitation: The Thiel cadaver. Resuscitation 2018, 125, 135–142. [Google Scholar] [CrossRef]
- Chalkias, A.; Xanthos, T. Timing positive-pressure ventilation during chest compression: the key to improving the thoracic pump? Eur. Heart J. Acute Cardiovasc. Care 2015, 4, 24–27. [Google Scholar] [CrossRef]
- Kill, C.; Hahn, O.; Dietz, F.; Neuhaus, C.; Schwarz, S.; Mahling, R.; Wallot, P.; Jerrentrup, A.; Steinfeldt, T.; Wulf, H.; et al. Mechanical ventilation during cardiopulmonary resuscitation with intermittent positive-pressure ventilation, bilevel ventilation, or chest compression synchronized ventilation in a pig model. Crit. Care Med. 2014, 42, e89–e95. [Google Scholar] [CrossRef]
- Kleinsasser, A.; Lindner, K.H.; Schaefer, A.; Loeckinger, A. Decompression-triggered positive-pressure ventilation during cardiopulmonary resuscitation improves pulmonary gas exchange and oxygen uptake. Circulation 2002, 106, 373–378. [Google Scholar] [CrossRef]
- Grieco, D.L.; Brochard, L.; Drouet, A.; Telias, I.; Delisle, S.; Bronchti, G.; Ricard, C.; Rigollot, M.; Badat, B.; Ouellet, P.; et al. Intrathoracic Airway Closure Impacts CO2 Signal and Delivered Ventilation During Cardiopulmonary Resuscitation. Am. J. Respir. Crit. Care Med. 2019, 199, 728–737. [Google Scholar] [CrossRef]
- Hillman, K.; Albin, M. Pulmonary barotrauma during cardiopulmonary resuscitation. Crit. Care Med. 1986, 14, 606–609. [Google Scholar] [CrossRef]
- Dohi, S. Postcardiopulmonary resuscitation pulmonary edema. Crit. Care Med. 1983, 11, 434–437. [Google Scholar] [CrossRef]
- Ornato, J.P.; Ryschon, T.W.; Gonzalez, E.R.; Bredthauer, J.L. Rapid change in pulmonary vascular hemodynamics with pulmonary edema during cardiopulmonary resuscitation. Am. J. Emerg. Med. 1985, 3, 137–142. [Google Scholar] [CrossRef]
- Ducas, J.; Roussos, C.; Karsardis, C.; Magder, S. Thoracicoabdominal mechanics during resuscitation maneuvers. Chest 1983, 84, 446–451. [Google Scholar] [CrossRef]
- Reid-Nicholson, M.D.; Escoffery, C.T. Severe pulmonary barotrauma. West Indian Med. J. 2000, 49, 344–346. [Google Scholar]
- Risdal, M.; Aase, S.O.; Stavland, M.; Eftestøl, T. Impedance-based ventilation detection during cardiopulmonary resuscitation. IEEE Trans. Biomed. Eng. 2007, 54, 2237–2245. [Google Scholar] [CrossRef]
- Smiseth, O.A.; Veddeng, O. A comparison of changes in esophageal pressure and regional juxtacardiac pressures. J. Appl. Physiol. 1990, 69, 1053–1057. [Google Scholar] [CrossRef]
- Wik, L.; Naess, P.A.; Ilebekk, A.; Steen, P.A. Simultaneous active compression-decompression and abdominal binding increase carotid blood flow additively during cardiopulmonary resuscitation (CPR) in pigs. Resuscitation 1994, 28, 55–64. [Google Scholar] [CrossRef]
- Alonso, E.; Aramendi, E.; Daya, M.; Irusta, U.; Chicote, B.; Russell, J.K.; Tereshchenko, L.G. Circulation detection using the electrocardiogram and the thoracic impedance acquired by defibrillation pads. Resuscitation 2016, 99, 56–62. [Google Scholar] [CrossRef]
- Ayala, U.; Eftestøl, T.; Alonso, E.; Irusta, U.; Aramendi, E.; Wali, S.; Kramer-Johansen, J. Automatic detection of chest compressions for the assessment of CPR-quality parameters. Resuscitation 2014, 85, 957–963. [Google Scholar] [CrossRef]
- Hutson, A.D. Calculating nonparametric confidence intervals for quantiles using fractional order statistics. J. Appl. Stat. 1999, 26, 343–353. [Google Scholar] [CrossRef]
- Irusta, U.; Ruiz, J.; de Gauna, S.R.; Eftestøl, T.; Kramer-Johansen, J. A least mean-square filter for the estimation of the cardiopulmonary resuscitation artifact based on the frequency of the compressions. IEEE Trans. Biomed. Eng. 2009, 56, 1052–1062. [Google Scholar] [CrossRef]
- Isasi, I.; Irusta, U.; Aramendi, E.; Ayala, U.; Alonso, E.; Kramer-Johansen, J.; Eftestøl, T. A Multistage Algorithm for ECG Rhythm Analysis During Piston-Driven Mechanical Chest Compressions. IEEE Trans. Biomed. Eng. 2019, 66, 263–272. [Google Scholar] [CrossRef]
- Peberdy, M.A.; Andersen, L.W.; Abbate, A.; Thacker, L.R.; Gaieski, D.; Abella, B.S.; Grossestreuer, A.V.; Rittenberger, J.C.; Clore, J.; Ornato, J.; et al. Inflammatory markers following resuscitation from out-of-hospital cardiac arrest-A prospective multicenter observational study. Resuscitation 2016, 103, 117–124. [Google Scholar] [CrossRef]
- Carvalho, A.R.; Spieth, P.M.; Güldner, A.; Cuevas, M.; Carvalho, N.C.; Beda, A.; Spieth, S.; Stroczynski, C.; Wiedemann, B.; Koch, T.; et al. Distribution of regional lung aeration and perfusion during conventional and noisy pressure support ventilation in experimental lung injury. J. Appl. Physiol. 2011, 110, 1083–1092. [Google Scholar] [CrossRef] [Green Version]
- Aramendi, E.; Lu, Y.; Chang, M.P.; Elola, A.; Irusta, U.; Owens, P.; Idris, A.H. A novel technique to assess the quality of ventilation during pre-hospital cardiopulmonary resuscitation. Resuscitation 2018, 132, 41–46. [Google Scholar] [CrossRef]
- Edelson, D.P.; Eilevstjønn, J.; Weidman, E.K.; Retzer, E.; Hoek, T.L.V.; Abella, B.S. Capnography and chest-wall impedance algorithms for ventilation detection during cardiopulmonary resuscitation. Resuscitation 2010, 81, 317–322. [Google Scholar] [CrossRef] [Green Version]
- Aramendi, E.; Elola, A.; Alonso, E.; Irusta, U.; Daya, M.; Russell, J.K.; Hubner, P.; Sterz, F. Feasibility of the capnogram to monitor ventilation rate during cardiopulmonary resuscitation. Resuscitation 2017, 110, 162–168. [Google Scholar] [CrossRef]
- Alonso, E.; González-Otero, D.; Aramendi, E.; Ruiz de Gauna, S.; Ruiz, J.; Ayala, U.; Russell, J.K.; Daya, M. Can thoracic impedance monitor the depth of chest compressions during out-of-hospital cardiopulmonary resuscitation? Resuscitation 2014, 85, 637–643. [Google Scholar] [CrossRef]

| Ventilator Mode | Time Differences | |
|---|---|---|
| vol (mL)/freq (min−1)/ (ms) | (ms) | (ms) |
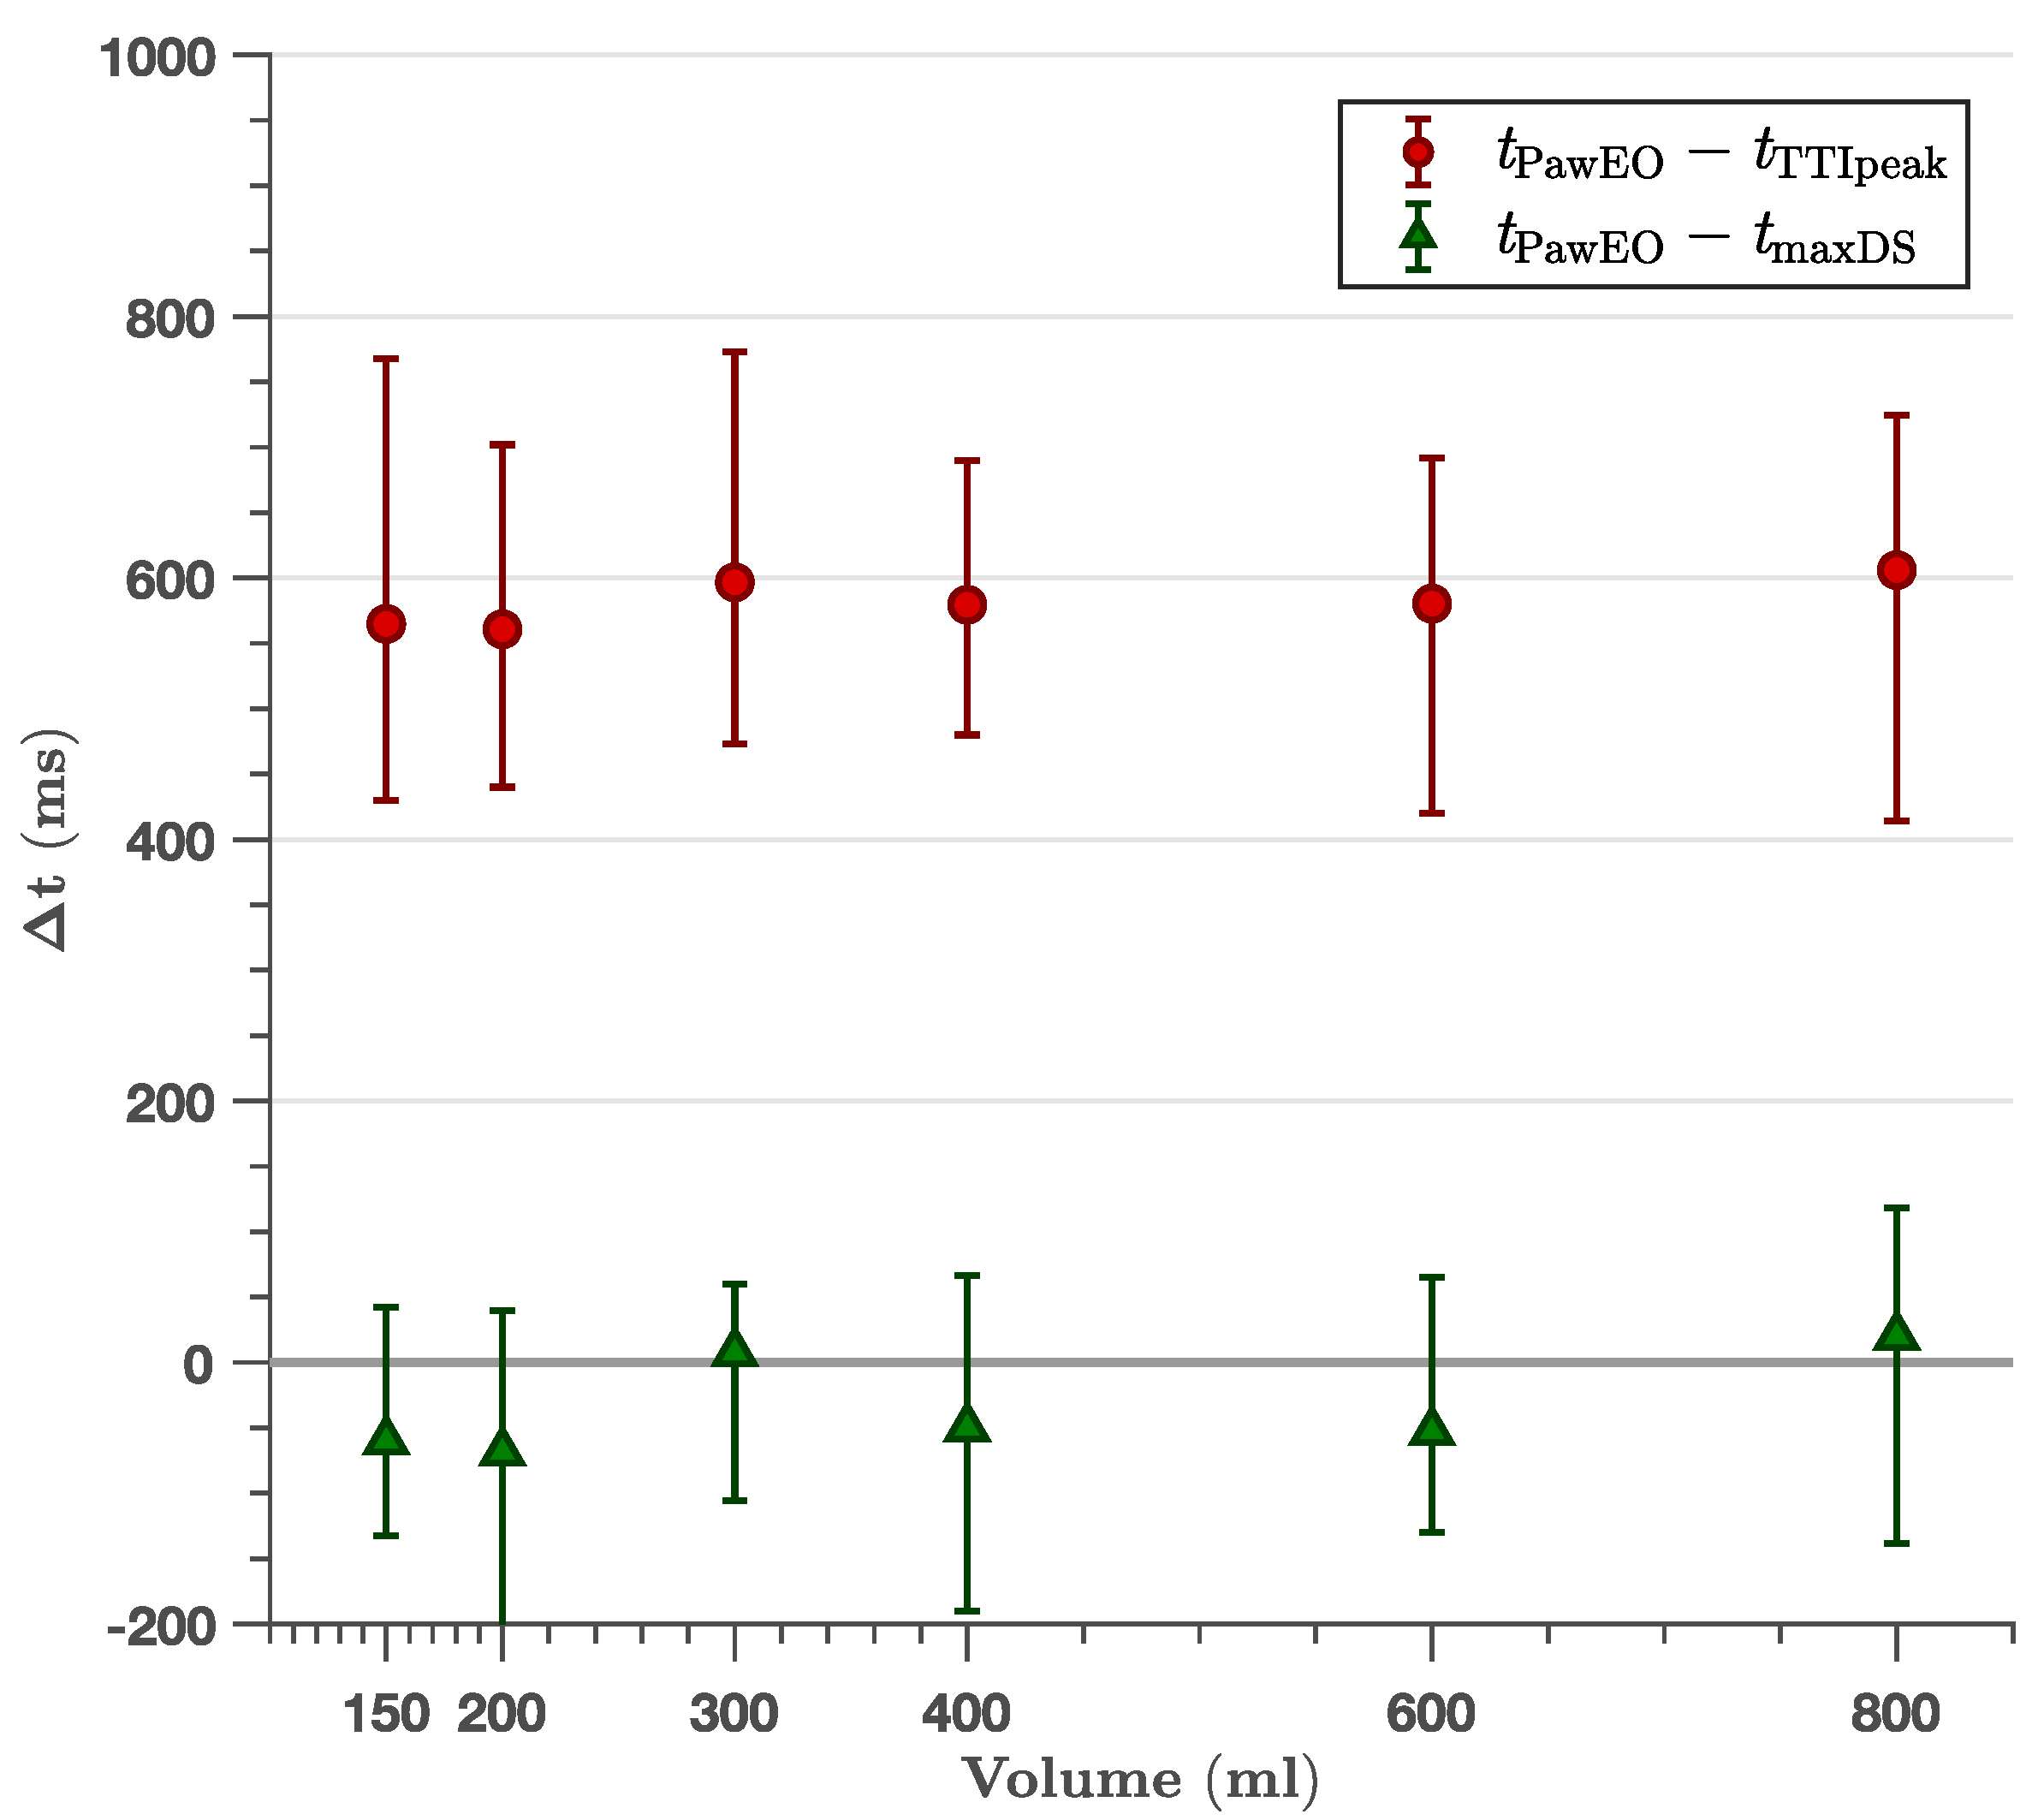
| varying vol | ||
| 150/12/2000 | 565 (514, 648) | −60 (−89, −18) |
| 200/12/2000 | 561 (542, 596) | −69 (−127, −8) |
| 300/12/2000 | 597 (558, 711) | 8 (−67, 48) |
| 400/12/2000 | 580 (542, 609) | −50 (−98, 8) |
| 600/12/2000 | 580 (540, 636) | −53 (−83, −20) |
| 850/12/2000 | 606 (571, 628) | 20 (−52, 56) |
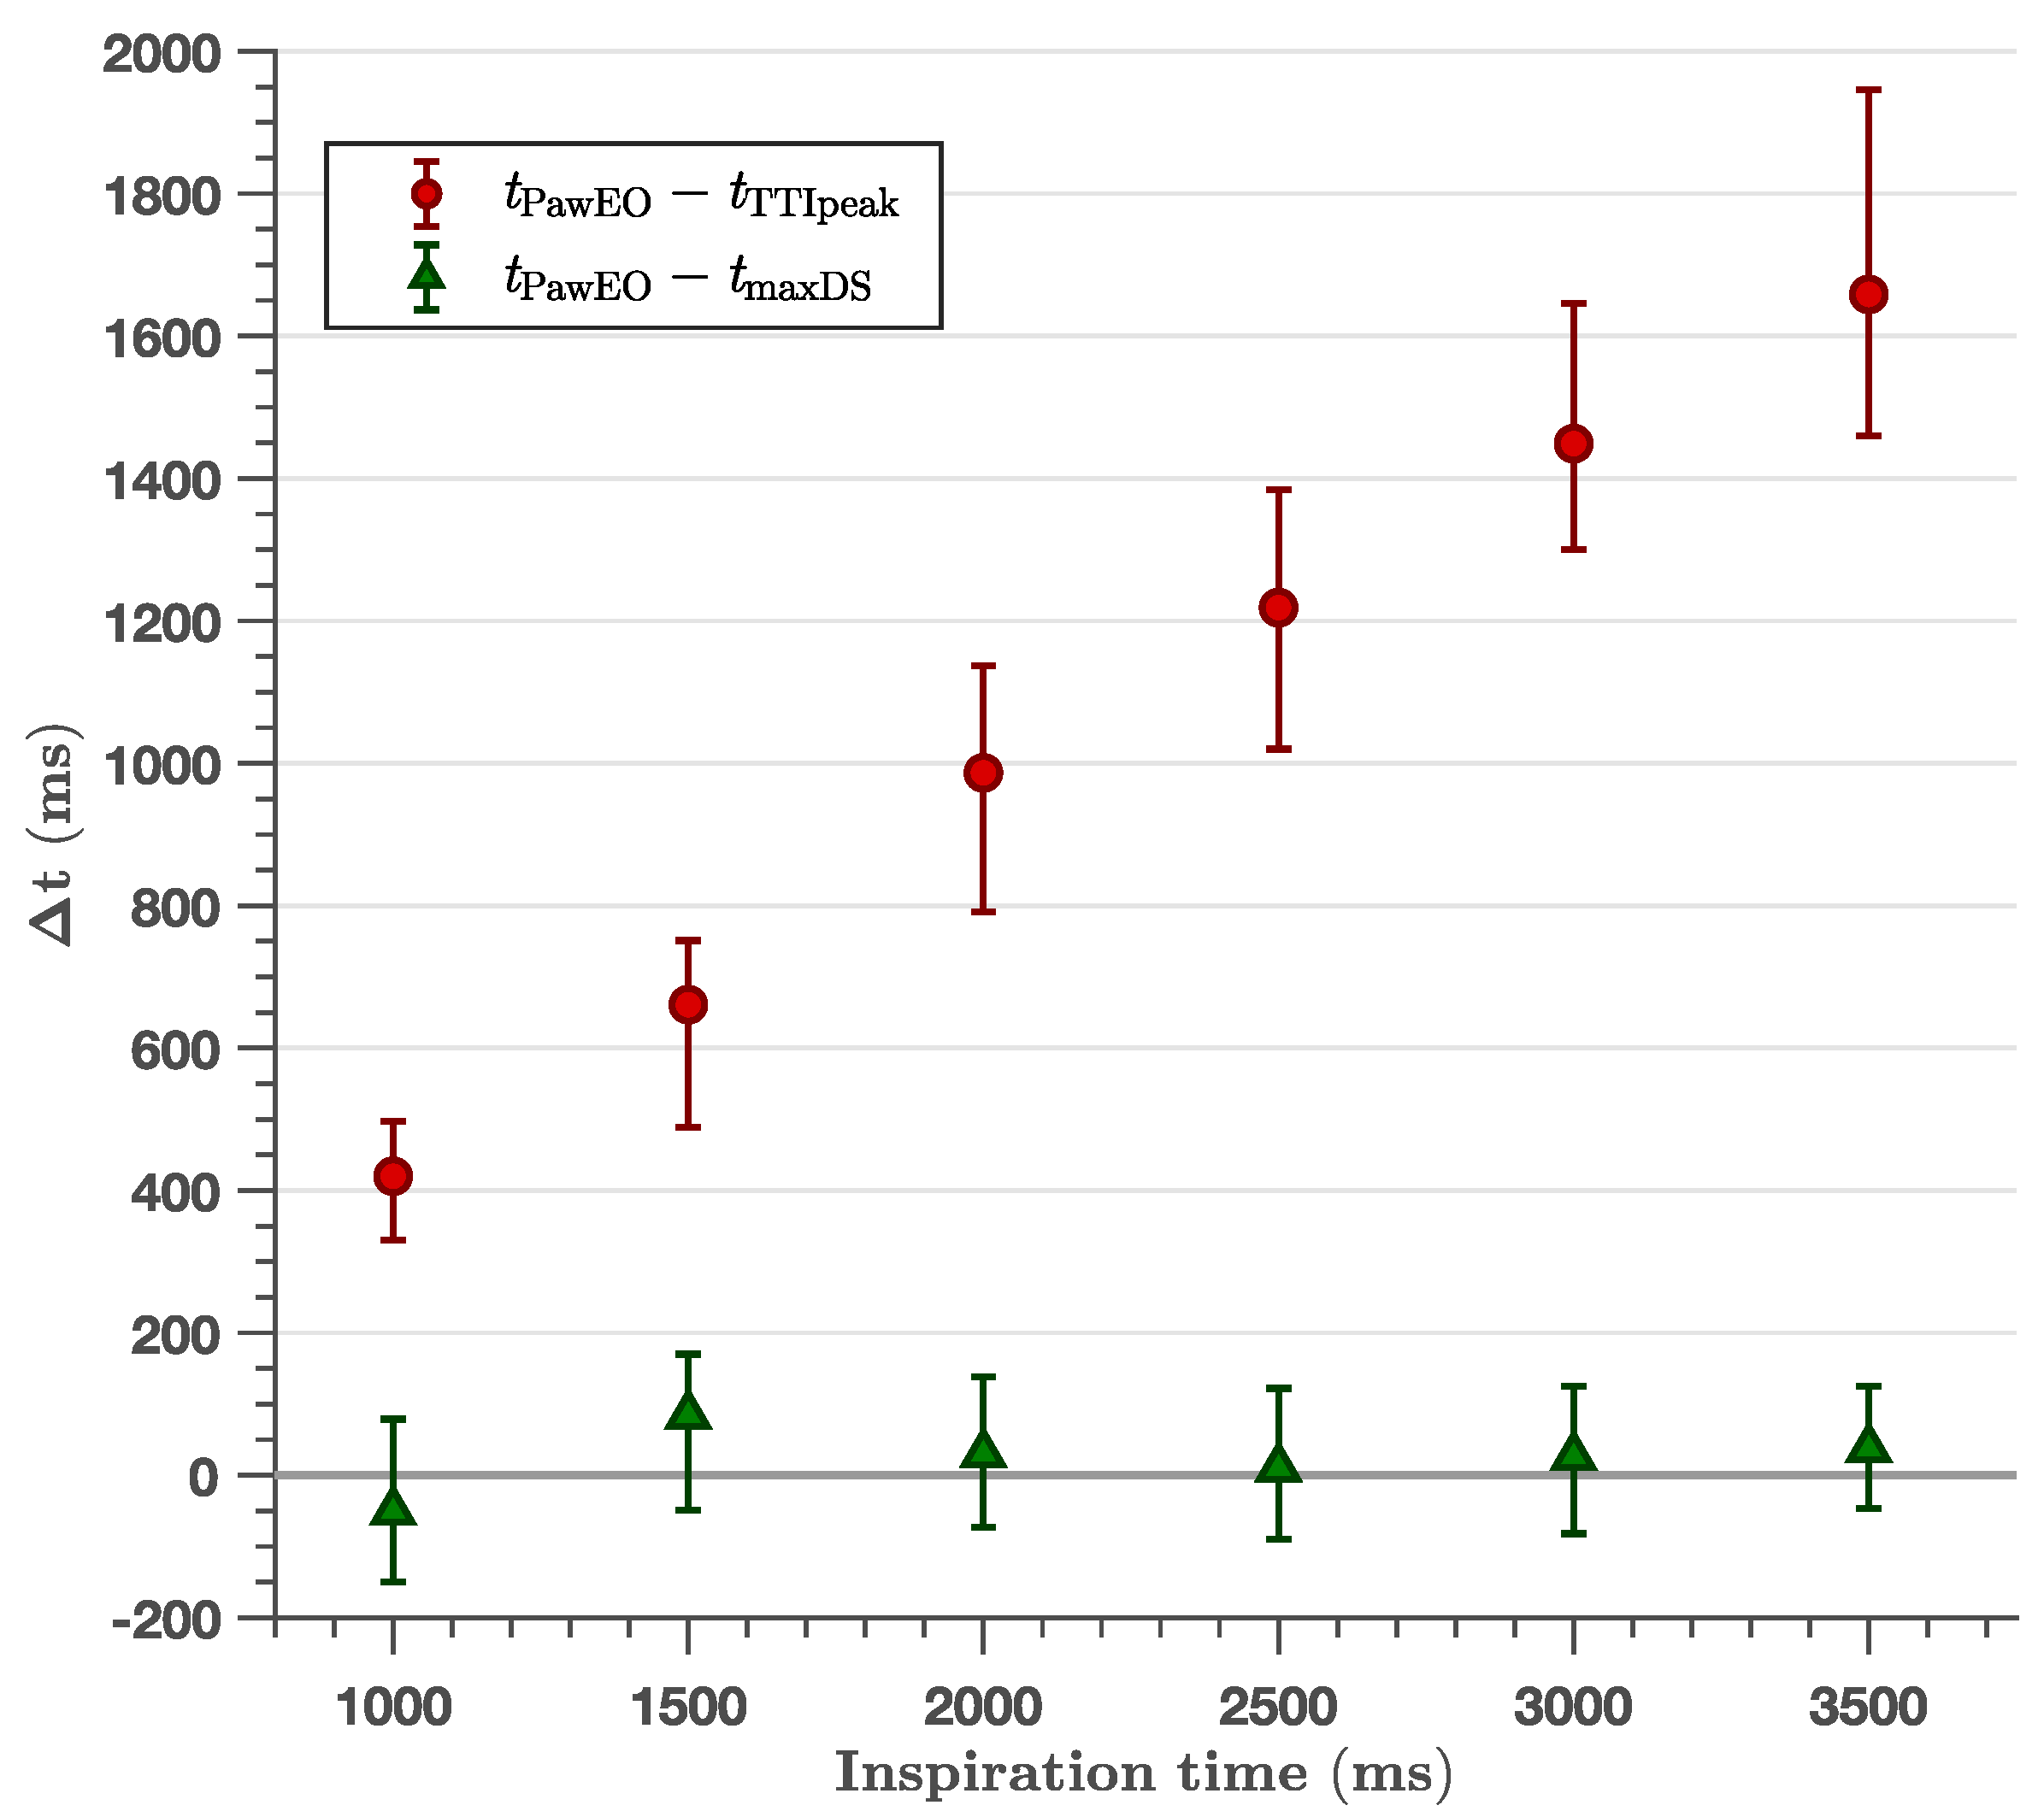
| varying | ||
| 400/10/ 500 | 263 (248, 279) | −18 (−40, 4) |
| 400/10/1000 | 420 (402, 434) | −51 (−91, −7) |
| 400/10/1500 | 661 (631, 674) | 84 (30, 113) |
| 400/10/2000 | 987 (969, 1049) | 30 (9, 50) |
| 400/10/2500 | 1219 (1200, 1237) | 10 (−10, 39) |
| 400/10/3000 | 1449 (1394, 1496) | 26 (−4, 52) |
| 400/10/3500 | 1658 (1584, 1831) | 37 (10, 70) |
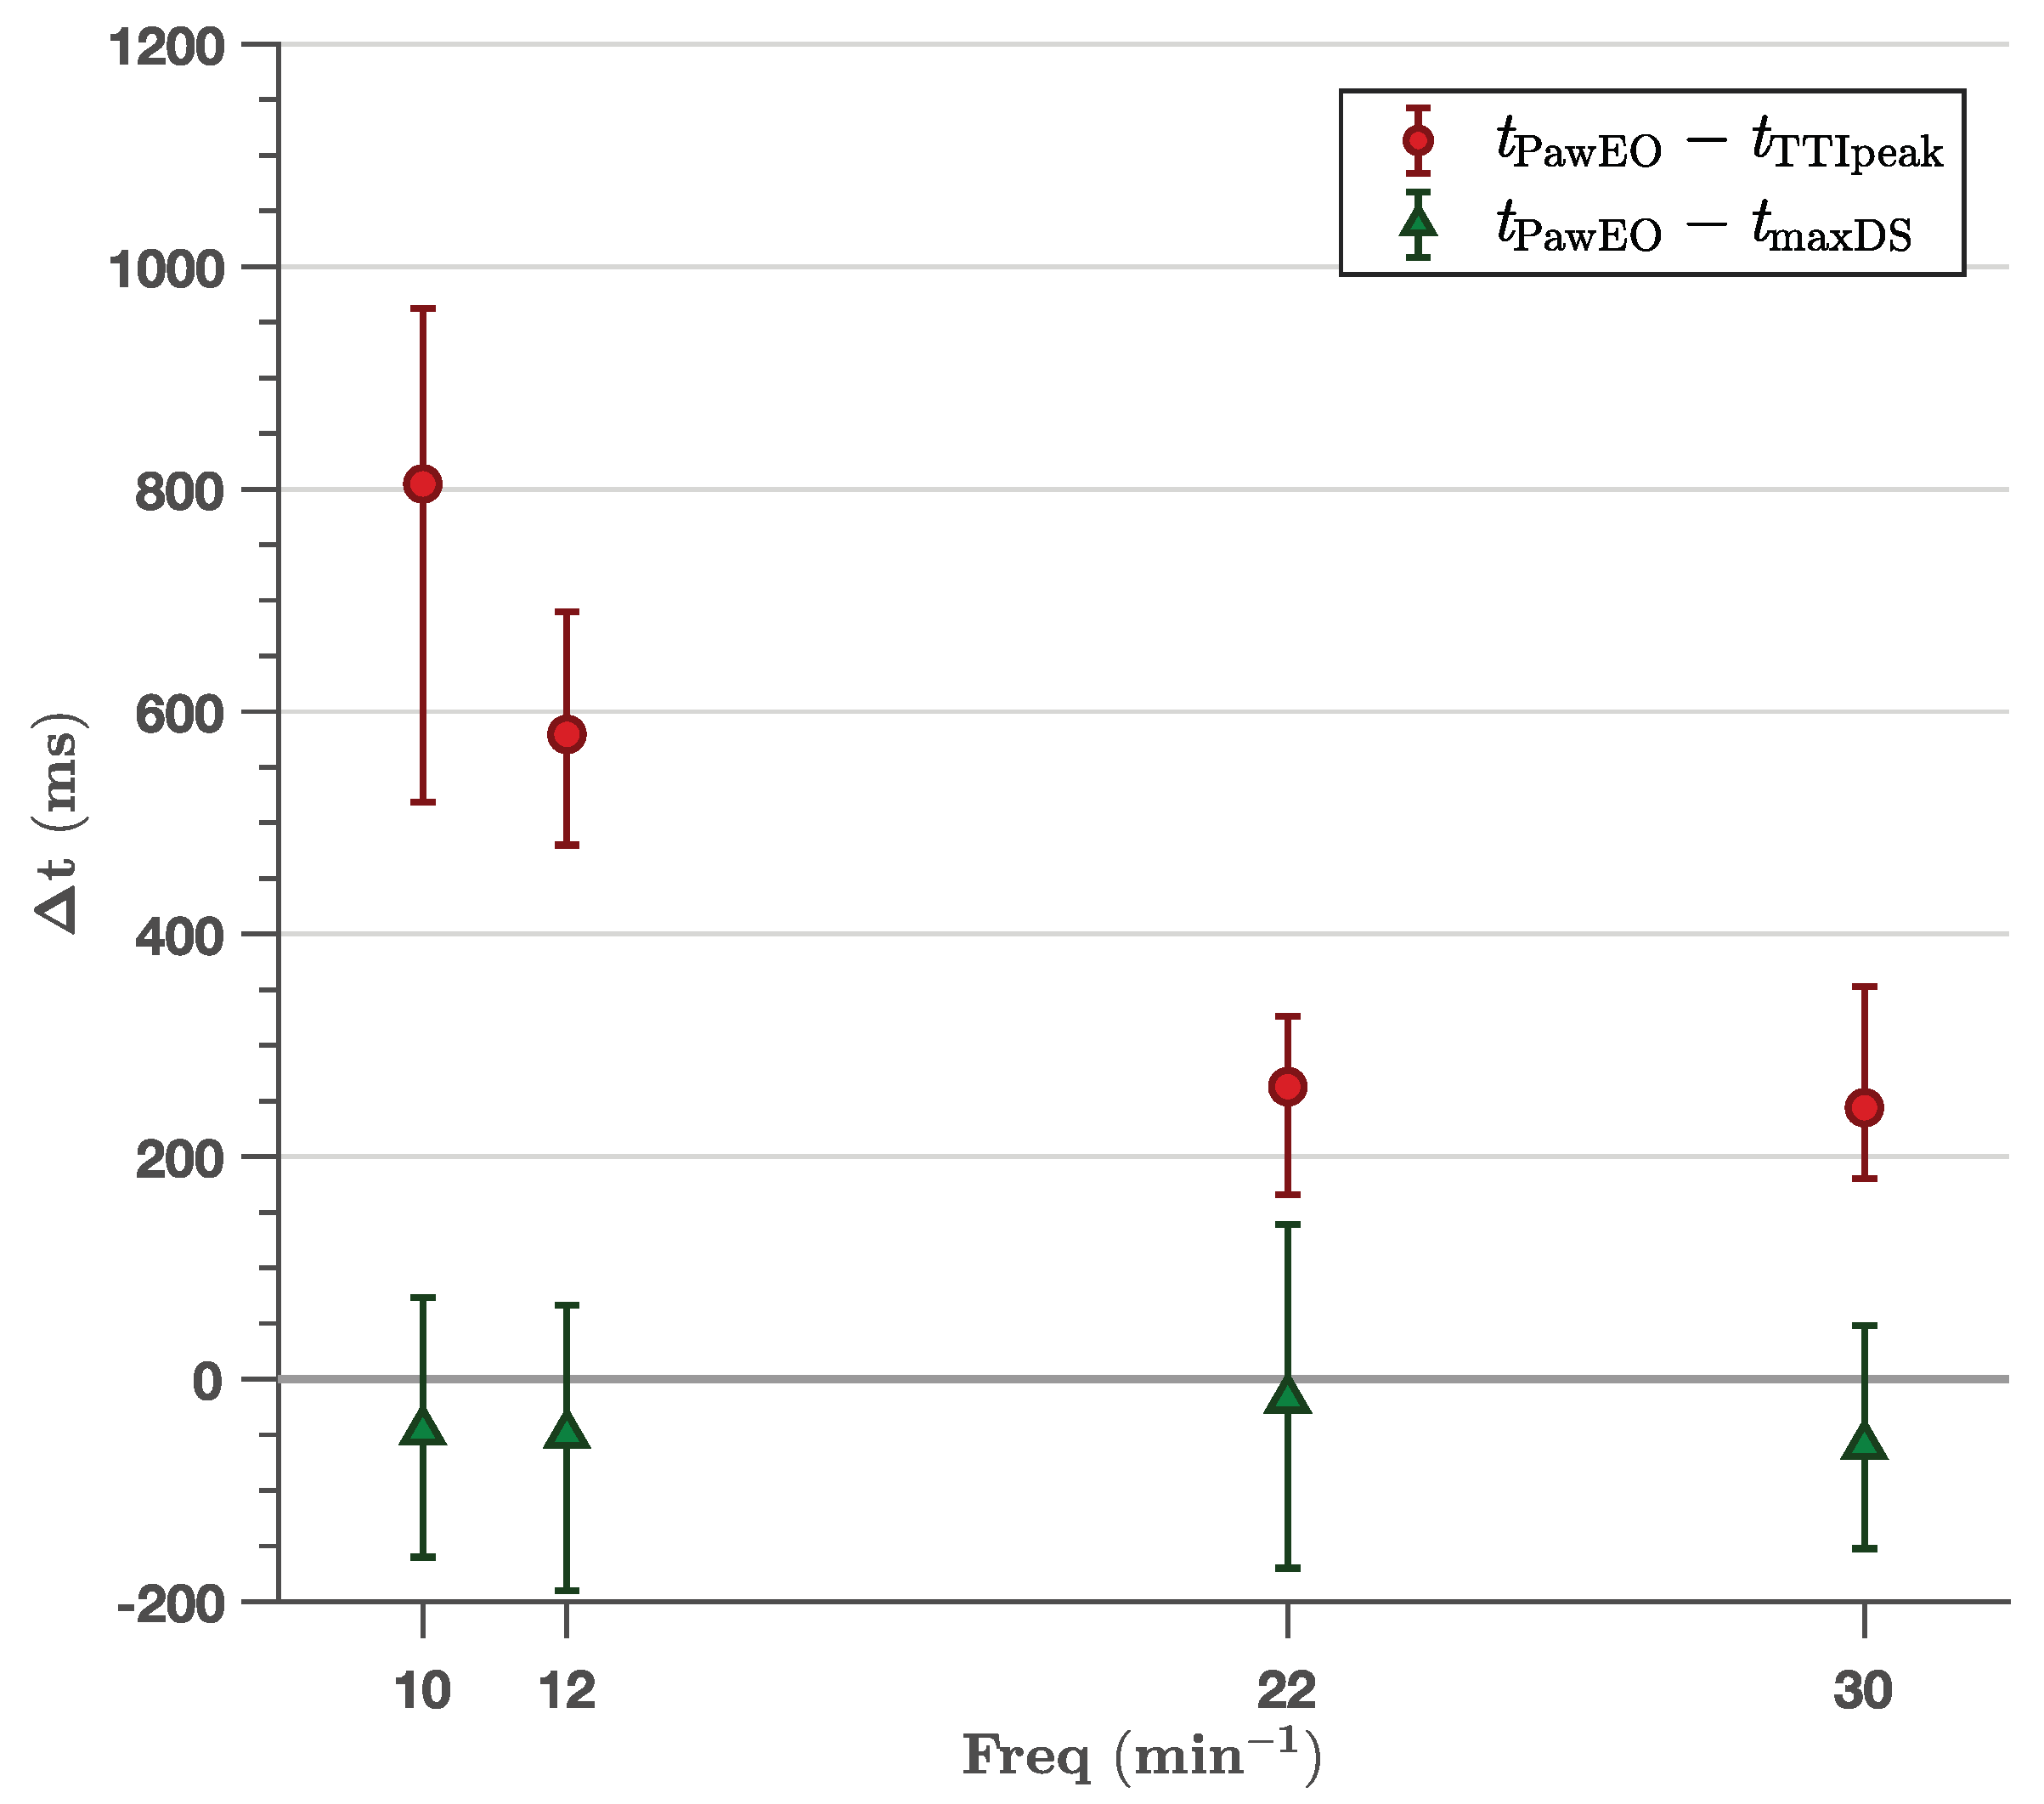
| varying freq | ||
| 400/10/2000 | 805 (744, 899) | −47 (−82, −23) |
| 400/12/2000 | 580 (542, 609) | −50 (−98, 8) |
| 400/22/2000 | 263 (248, 279) | −18 (−40, 4) |
| 400/30/2000 | 244 (226, 270) | −60 (−76, −20) |
| Ventilator Mode | (ms) | p-Value | (ms) | p-Value | ||
|---|---|---|---|---|---|---|
| vol/freq/ | BMI < 25 | BMI ≥ 25 | Chest < 97.5 cm | Chest ≥ 97.5 cm | ||
| varying vol | ||||||
| 150/12/2000 | −24 (−70, 20) | −90 (−130, −29) | 0.02 | −77 (−143, −22) | −70 (−108, 13) | 0.44 |
| 200/12/2000 | −45 (−141, 7) | −85 (−179, 18) | 0.37 | −190 (−259, −100) | −58 (−100, 14) | <0.01 |
| 300/12/2000 | 49 (−10, 120) | −77 (−142, 41) | <0.01 | −136 (−185, 47) | −49 (−72, 45) | 0.08 |
| 400/12/2000 | −50 (−84, 6) | −53 (−120, 31) | 0.57 | −161 (−210, −41) | −67 (−110, 14) | 0.36 |
| 600/12/2000 | −48 (−83, −4) | −72 (−110, 11) | 0.72 | −70 (−170, −15) | −64 (−98, 16) | 0.45 |
| 850/12/2000 | −14 (−52, 52) | 32 (−80, 91) | 0.77 | −30 (−139, 61) | −10 (−67, 59) | 0.89 |
| varying | ||||||
| 400/10/ 500 | 50 (−152, 107) | −20 (−46, −9) | 0.39 | −1 (−20, 82) | −10 (−195, 75) | 0.15 |
| 400/10/1000 | −73 (−99, −49) | 10 (−102, 57) | 0.64 | −125 (−140, −64) | −29 (−66, 32) | 0.13 |
| 400/10/1500 | 77 (29, 100) | 121 (0, 153) | 0.21 | −40 (−70, 8) | 140 (100, 170) | <0.01 |
| 400/10/2000 | 67 (37, 102) | 0 (−30, 30) | <0.01 | 30 (−21, 74) | 15 (−23, 52) | 0.47 |
| 400/10/2500 | 58 (10, 102) | −15 (−40, 20) | <0.01 | 40 (−47, 88) | 2 (−31, 61) | 0.82 |
| 400/10/3000 | 85 (−19, 125) | 12 (−14, 37) | 0.02 | 80 (2, 125) | 11 (−65, 85) | 0.40 |
| 400/10/3500 | 23 (−13, 81) | 40 (12, 80) | 0.86 | 52 (10, 100) | 17 (−31, 93) | 0.91 |
| varying freq | ||||||
| 400/10/2000 | 5 (−68, 53) | −80 (−110, −30) | 0.02 | −84 (−112, 2) | −33 (−89, −20) | 0.65 |
| 400/12/2000 | −50 (−84, 6) | −53 (−120, 31) | 0.56 | −161 (−210, −41) | −67 (−110, 14) | 0.36 |
| 400/22/2000 | 50 (−152, 107) | −20 ( −46, −9) | 0.39 | −1 (−20, 82) | −10 (−194, 75) | 0.13 |
| 400/30/2000 | −20 ( −70, 10) | −72 (−108, −49) | 0.03 | −35 (−80, −4) | −86 (−140, 46) | 0.47 |
© 2019 by the authors. Licensee MDPI, Basel, Switzerland. This article is an open access article distributed under the terms and conditions of the Creative Commons Attribution (CC BY) license (http://creativecommons.org/licenses/by/4.0/).
Share and Cite
Berve, P.O.; Irusta, U.; Kramer-Johansen, J.; Skålhegg, T.; Kongsgård, H.W.; Brunborg, C.; Aramendi, E.; Wik, L. Transthoracic Impedance Measured with Defibrillator Pads—New Interpretations of Signal Change Induced by Ventilations. J. Clin. Med. 2019, 8, 724. https://doi.org/10.3390/jcm8050724
Berve PO, Irusta U, Kramer-Johansen J, Skålhegg T, Kongsgård HW, Brunborg C, Aramendi E, Wik L. Transthoracic Impedance Measured with Defibrillator Pads—New Interpretations of Signal Change Induced by Ventilations. Journal of Clinical Medicine. 2019; 8(5):724. https://doi.org/10.3390/jcm8050724
Chicago/Turabian StyleBerve, Per Olav, Unai Irusta, Jo Kramer-Johansen, Tore Skålhegg, Håvard Wahl Kongsgård, Cathrine Brunborg, Elisabete Aramendi, and Lars Wik. 2019. "Transthoracic Impedance Measured with Defibrillator Pads—New Interpretations of Signal Change Induced by Ventilations" Journal of Clinical Medicine 8, no. 5: 724. https://doi.org/10.3390/jcm8050724