Data Independent Acquisition Mass Spectrometry Can Identify Circulating Proteins That Predict Future Weight Loss with a Diet and Exercise Programme

 , ,
, ,
Abstract
:1. Introduction
2. Methods
Statistics Analysis
3. Results
4. Discussion
5. Summary
6. Novelty Statement
- Using a biological proteomic ‘fingerprinting’ technique (SWATH MS) on plasma samples we set out to identify impaired glucose regulaton (IGR) individuals who were more likely to lose weight with a validated lifestyle change intervention.
- 20 people with IGR engaged in a six month lifestyle change intervention with samples taken pre- and post-intervention for proteomic evaluation.
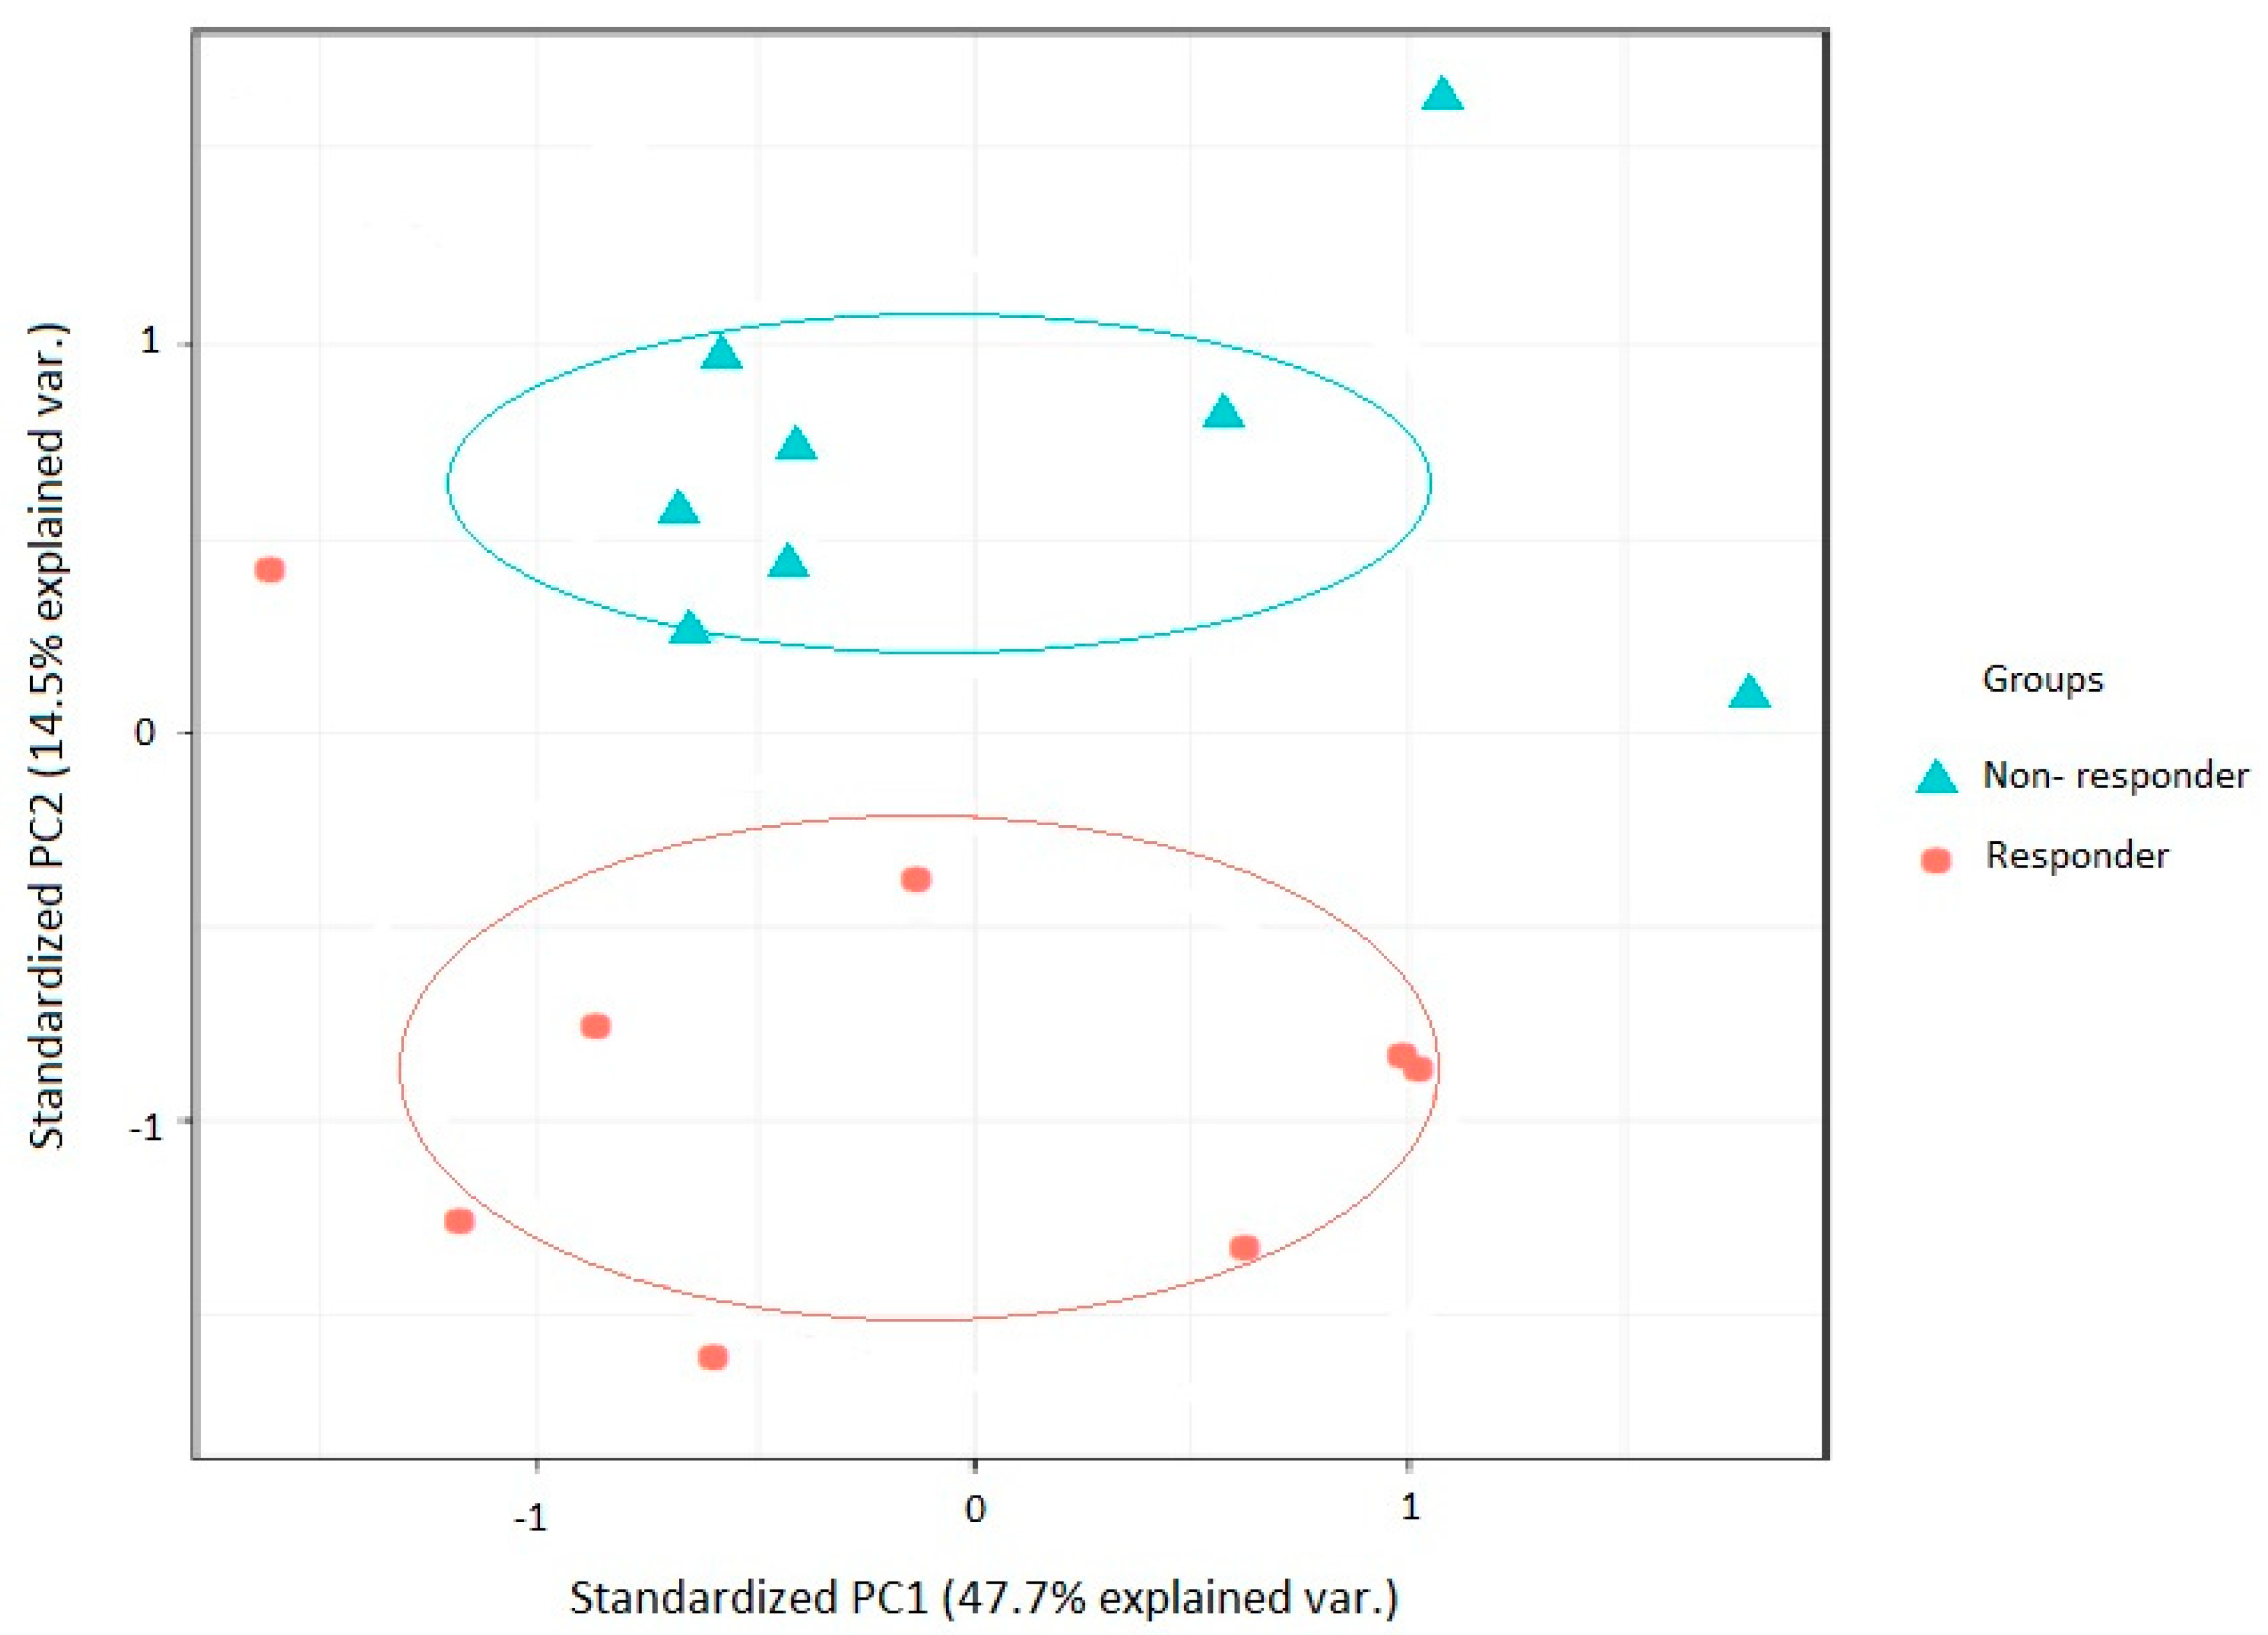
- SWATH MS determined a panel of protein differences in people who were more likely to lose ≥3% in weight over the six month intervention period.
- Higher levels of insulin-like growth factor-II (IGF-II) were found to be predictive of greater success with weight reduction.
Supplementary Materials
Author Contributions
Funding
Acknowledgments
Conflicts of Interest
References
- Lorber, D. Importance of cardiovascular disease risk management in patients with type 2 diabetes mellitus. Diabetes. Metab. Syndr. Obes. 2014, 7, 169–183. [Google Scholar] [CrossRef] [PubMed]
- Barry, E.; Greenhalgh, T. The National Diabetes Prevention Programme. Br. J. Gen. Pract. 2015, 65, 450. [Google Scholar] [CrossRef] [PubMed]
- Savas, L.A.; Grady, K.; Cotterill, S.; Summers, L.; Boaden, R.; Gibson, J.M. Prioritising prevention: Implementation of IGT Care Call, a telephone based service for people at risk of developing type 2 diabetes. Prim. Care Diabetes 2015, 9, 3–8. [Google Scholar] [CrossRef] [PubMed]
- Gummesson, A.; Nyman, E.; Knutsson, M.; Karpefors, M. Effect of weight reduction on glycated haemoglobin in weight loss trials in patients with type 2 diabetes. Diabetes. Obes. Metab. 2017, 19, 1295–1305. [Google Scholar] [CrossRef] [PubMed]
- Rosenstock, J.; Cefalu, W.T.; Lapuerta, P.; Zambrowicz, B.; Ogbaa, I.; Banks, P.; Sands, A. Greater dose-ranging effects on A1C levels than on glucosuria with LX4211, a dual inhibitor of SGLT1 and SGLT2, in patients with type 2 diabetes on metformin monotherapy. Diabetes Care 2015, 38, 431–438. [Google Scholar] [CrossRef] [PubMed]
- Schwingshackl, L.; Chaimani, A.; Hoffmann, G.; Schwedhelm, C.; Boeing, H. Impact of different dietary approaches on glycemic control and cardiovascular risk factors in patients with type 2 diabetes: a protocol for a systematic review and network meta-analysis. Syst. Rev. 2017, 6, 57. [Google Scholar] [CrossRef] [PubMed]
- Aebersold, R.; Mann, M. Mass-spectrometric exploration of proteome structure and function. Nature 2016, 537, 347–355. [Google Scholar] [CrossRef]
- Tanner, S.D.; Baranov, V.I.; Ornatsky, O.I.; Bandura, D.R.; George, T.C. An introduction to mass cytometry: fundamentals and applications. Cancer Immunol. Immunother. 2013, 62, 955–965. [Google Scholar] [CrossRef]
- Zhu, X.; Chen, Y.; Subramanian, R. Comparison of information-dependent acquisition, SWATH, and MS(All) techniques in metabolite identification study employing ultrahigh-performance liquid chromatography-quadrupole time-of-flight mass spectrometry. Anal. Chem. 2014, 86, 1202–1209. [Google Scholar] [CrossRef]
- Gillet, L.C.; Navarro, P.; Tate, S.; Rost, H.; Selevsek, N.; Reiter, L.; Bonner, R.; Aebersold, R. Targeted data extraction of the MS/MS spectra generated by data-independent acquisition: a new concept for consistent and accurate proteome analysis. Mol. Cell. Proteom. 2012, 11, O111.016717. [Google Scholar] [CrossRef]
- Walker, D.E.; Yang, F.; Carver, J.; Joe, K.; Michels, D.A.; Yu, X.C. A modular and adaptive mass spectrometry-based platform for support of bioprocess development toward optimal host cell protein clearance. MAbs 2017, 9, 654–663. [Google Scholar] [CrossRef] [PubMed]
- Matthews, D.R.; Hosker, J.P.; Rudenski, A.S.; Naylor, B.A.; Treacher, D.F.; Turner, R.C. Homeostasis model assessment: insulin resistance and beta-cell function from fasting plasma glucose and insulin concentrations in man. Diabetologia 1985, 28, 412–419. [Google Scholar] [CrossRef] [PubMed]
- Sandhu, M.S.; Gibson, J.M.; Heald, A.H.; Dunger, D.B.; Wareham, N.J. Low circulating IGF-II concentrations predict weight gain and obesity in humans. Diabetes 2003, 52, 1403–1408. [Google Scholar] [CrossRef] [PubMed]
- Heald, A.H.; Kärvestedt, L.; Anderson, S.G.; McLaughlin, J.; Knowles, A.; Wong, L.; Grill, V.; Cruickshank, J.K.; White, A.; Gibson, J.M.; et al. Low Insulin-like Growth Factor-II Levels Predict Weight Gain in Normal Weight Subjects with Type 2 Diabetes. Am. J. Med. 2006, 119, e9–e15. [Google Scholar] [CrossRef] [PubMed]
- Comerford, K.B.; Buchan, W.; Karakas, S.E. The effects of weight loss on FABP4 and RBP4 in obese women with metabolic syndrome. Horm. Metab. Res. 2014, 46, 224–231. [Google Scholar] [CrossRef] [PubMed]
- Marschner, R.A.; Pinto, G.; Borges, J.; Markoski, M.M.; Schaan, B.D.; Lehnen, A.M. Short-Term Detraining does not Change Insulin Sensitivity and RBP4 in Rodents Previously Submitted to Aerobic Exercise. Horm. Metab. Res. 2017, 49, 58–63. [Google Scholar] [CrossRef] [PubMed]
- Ansar, H.; Mirzaei, K.; Malek, A.; Najmafshar, A.; Hossein-nezhad, A. Possible resting metabolic rate modification by the circulating RBP4 in obese subjects. Diabetes Metab. Syndr. 2015, 9, 19–23. [Google Scholar] [CrossRef]
- Murdolo, G.; Tortoioli, C.; Celi, F.; Bini, V.; Papi, F.; Brozzetti, A.; Falorni, A. Fetuin-A, adiposity-linked insulin resistance and responsiveness to an educational-based weight excess reduction program: a population-based survey in prepubertal schoolchildren. Endocrine 2017, 56, 357–365. [Google Scholar] [CrossRef]
- Erdmann, J.; Salmhofer, H.; Knauß, A.; Mayr, M.; Wagenpfeil, S.; Sypchenko, O.; Luppa, P.; Schusdziarra, V. Relationship of fetuin-A levels to weight-dependent insulin resistance and type 2 diabetes mellitus. Regul. Pept. 2012, 178, 6–10. [Google Scholar] [CrossRef]
- Ge, S.; Ryan, A.S. Zinc-α2-glycoprotein expression in adipose tissue of obese postmenopausal women before and after weight loss and exercise + weight loss. Metabolism 2014, 63, 995–999. [Google Scholar] [CrossRef]
- Agueda, M.; Lasa, A.; Simon, E.; Ares, R.; Larrarte, E.; Labayen, I. Association of circulating visfatin concentrations with insulin resistance and low-grade inflammation after dietary energy restriction in Spanish obese non-diabetic women: role of body composition changes. Nutr. Metab. Cardiovasc. Dis. 2014, 22, 208–214. [Google Scholar] [CrossRef] [PubMed]
- Lai, A.; Chen, W.; Helm, K. Effects of visfatin gene polymorphism RS4730153 on exercise-induced weight loss of obese children and adolescents of Han Chinese. Int. J. Biol. Sci. 2013, 9, 16–21. [Google Scholar] [CrossRef] [PubMed]
- Lima, M.M.; Pareja, J.C.; Alegre, S.M.; Geloneze, S.R.; Kahn, S.E.; Astiarraga, B.D.; Chaim, É.A.; Baracat, J.; Geloneze, B. Visceral fat resection in humans: effect on insulin sensitivity, beta-cell function, adipokines, and inflammatory markers. Obesity (Silver Spring) 2013, 21, E182–E189. [Google Scholar] [CrossRef] [PubMed]
- Zhang, T.; Zhao, S.; Li, W.; Ma, L.; Ding, M.; Li, R.; Liu, Y. High-fat diet from perilla oil induces insulin resistance despite lower serum lipids and increases hepatic fatty acid oxidation in rats. Lipids Health Dis. 2014, 13, 15. [Google Scholar] [CrossRef] [PubMed]
- Fernandez-Real, J.M.; Menendez, J.A.; Moreno-Navarrete, J.M.; Matthias, B.; Vazquez-Martin, A.; Vazquez, M.J.; Ortega, F.; Dieguez, C.; Fruhbeck, G.; Ricart, W.; et al. Extracellular fatty acid synthase: A possible surrogate biomarker of insulin resistance. Diabetes 2010, 59, 1506–1511. [Google Scholar] [CrossRef] [PubMed]
- Higa, T.S.; Spinola, A.V.; Fonseca-Alaniz, M.H.; Evangelista, F.S. Remodeling of white adipose tissue metabolism by physical training prevents insulin resistance. Life Sci. 2014, 103, 41–48. [Google Scholar] [CrossRef] [PubMed]
- Ashraf, A.P.; Huisingh, C.; Alvarez, J.A.; Wang, X.; Gower, B.A. Insulin Resistance Indices Are Inversely Associated With Vitamin D Binding Protein Concentrations. J. Clin. Endocrinol. Metab. 2014, 99, 178–183. [Google Scholar] [CrossRef]
- Schenk, S.; Saberi, M.; Olefsky, J.M. Insulin sensitivity: modulation by nutrients and inflammation. J. Clin. Investig. 2008, 118, 2992–3002. [Google Scholar] [CrossRef]
- Meyer, J.G.; Schilling, B. Clinical applications of quantitative proteomics using targeted and untargeted data-independent acquisition techniques. Expert Rev. Proteom. 2017, 14, 419–429. [Google Scholar] [CrossRef]
- Shi, J.; Wang, X.; Lyu, L.; Jiang, H.; Zhu, H.-J. Comparison of protein expression between human livers and the hepatic cell lines HepG2, Hep3B, and Huh7 using SWATH and MRM-HR proteomics: Focusing on drug-metabolizing enzymes. Drug Metab. Pharmacokinet. 2018, 33, 133–140. [Google Scholar] [CrossRef]
- Chan, S.S.; Schedlich, L.J.; Twigg, S.M.; Baxter, R.C. Inhibition of adipocyte differentiation by insulin-like growth factor-binding protein-3. Am. J. Physiol. Endocrinol. Metab. 2009, 296, E654–E663. [Google Scholar] [CrossRef]
- Yakar, S.; Rosen, C.J.; Bouxsein, M.L.; Sun, H.; Mejia, W.; Kawashima, Y.; Wu, Y.; Emerton, K.; Williams, V.; Jepsen, K.; et al. Serum complexes of insulin-like growth factor-1 modulate skeletal integrity and carbohydrate metabolism. FASEB J. 2009, 23, 709–719. [Google Scholar] [CrossRef]
- Nguyen, K.H.; Yao, X.H.; Moulik, S.; Mishra, S.; Nyomba, B.L. Human IGF binding protein-3 overexpression impairs glucose regulation in mice via an inhibition of insulin secretion. Endocrinology 2011, 152, 2184–2196. [Google Scholar] [CrossRef]
- Chan, S.S.; Twigg, S.M.; Firth, S.M.; Baxter, R.C. Insulin-like growth factor binding protein-3 leads to insulin resistance in adipocytes. J. Clin. Endocrinol. Metab. 2015, 90, 6588–6595. [Google Scholar] [CrossRef]
- Frystyk, J. Free insulin-like growth factors-measurements and relationships to growth hormone secretion and glucose homeostasis. Growth Horm. IGF Res. 2004, 14, 337–375. [Google Scholar] [CrossRef]
- Ballerini, M.G.; Braslavsky, D.; Scaglia, P.A.; Keselman, A.; Rodríguez, M.E.; Martínez, A.; Freire, A.V.; Domené, H.M.; Jasper, H.G.; Bergadá, I.; et al. Circulating IGF-I, IGFBP-3 and the IGF-I/IGFBP-3 Molar Ratio Concentration and Height Outcome in Prepubertal Short Children on rhGH Treatment over Two Years of Therapy. Horm. Res. Paediatr. 2017, 88, 354–363. [Google Scholar] [CrossRef]
- Friedrich, N.; Wolthers, O.D.; Arafat, A.M.; Emeny, R.T.; Spranger, J.; Roswall, J.; Kratzsch, J.; Grabe, H.J.; Hübener, C.; Pfeiffer, A.F.; et al. Age- and Sex-Specific Reference Intervals Across Life Span for Insulin-Like Growth Factor Binding Protein 3 (IGFBP-3) and the IGF-I to IGFBP-3 Ratio Measured by New Automated Chemiluminescence Assays. J. Clin. Endocrinol. Metab. 2014, 99, 1675–1686. [Google Scholar] [CrossRef]
- Williams, R.L.; Wood, L.G.; Collins, C.E.; Callister, R. Effectiveness of weight loss interventions--is there a difference between men and women: a systematic review. Obes. Rev. 2015, 16, 171–186. [Google Scholar] [CrossRef]
- Beleigoli, A.M.; Andrade, A.Q.; Cançado, A.G.; Paulo, M.N.; Diniz, M.F.H.; Ribeiro, A.L. Web-Based Digital Health Interventions for Weight Loss and Lifestyle Habit Changes in Overweight and Obese Adults: Systematic Review and Meta-Analysis. J. Med. Internet Res. 2019, 21, e298. [Google Scholar] [CrossRef]
- Griauzde, D.; Kullgren, J.T.; Liestenfeltz, B.; Ansari, T.; Johnson, E.H.; Fedewa, A.; Saslow, L.R.; Richardson, C.; Heisler, M. A Mobile Phone-Based Program to Promote Healthy Behaviors Among Adults With Prediabetes Who Declined Participation in Free Diabetes Prevention Programs: Mixed-Methods Pilot Randomized Controlled Trial. JMIR Mhealth Uhealth 2019, 7, e11267. [Google Scholar] [CrossRef]


| Male (n = 10) Mean ± Std. Error | Female (n = 10) Mean ± Std. Error | p Value | |||
|---|---|---|---|---|---|
| Before | After | Before | After | ||
| Age (years) | 61.5 (4.83) | 60.2 (2.73) | |||
| Weight (Kg) | 108.2 (9.18) | 106.9 (9.26) | 94.8 (5.16) | 91.56 * (5.48) | 0.02 |
| Height (cm) | 175.8 * (2.85) | 161.9 (2.46) | 0.002 | ||
| BMI | 35.0 (2.88) | 34.6 (3.00) | 36.2 (1.94) | 35.06 * (2.11) | 0.03 |
| Waist-hip | 1.00 (0.02) | 1.00 (0.02) | 0.90 (0.01) | 0.90 (0.01) | |
| Before Mean ± Std. Error | After Mean ± Std. Error | p Value | |
|---|---|---|---|
| HDL (mmol/L) | 1.37 (0.16) | 1.31 (0.08) | 0.685 |
| LDL (mmol/L) | 2.75 (0.26) | 2.66 (0.27) | 0.593 |
| Triglycerides (mmol/L) | 1.5 (0.19) | 1.62 (0.16) | 0.464 |
| Insulin (pmol/L) | 190.80 (58.12) | 270.93 (131.58) | 0.482 |
| Before Mean ± Std. Error | After Mean ± Std. Error | p Value | |
|---|---|---|---|
| IGF-I (nmol/L) | 15.7 (1.31) | 15.20 (1.29) | 0.291 |
| IGF-II (nmol/L) | 70.4 (4.68) | 66.9 (4.46) | 0.166 |
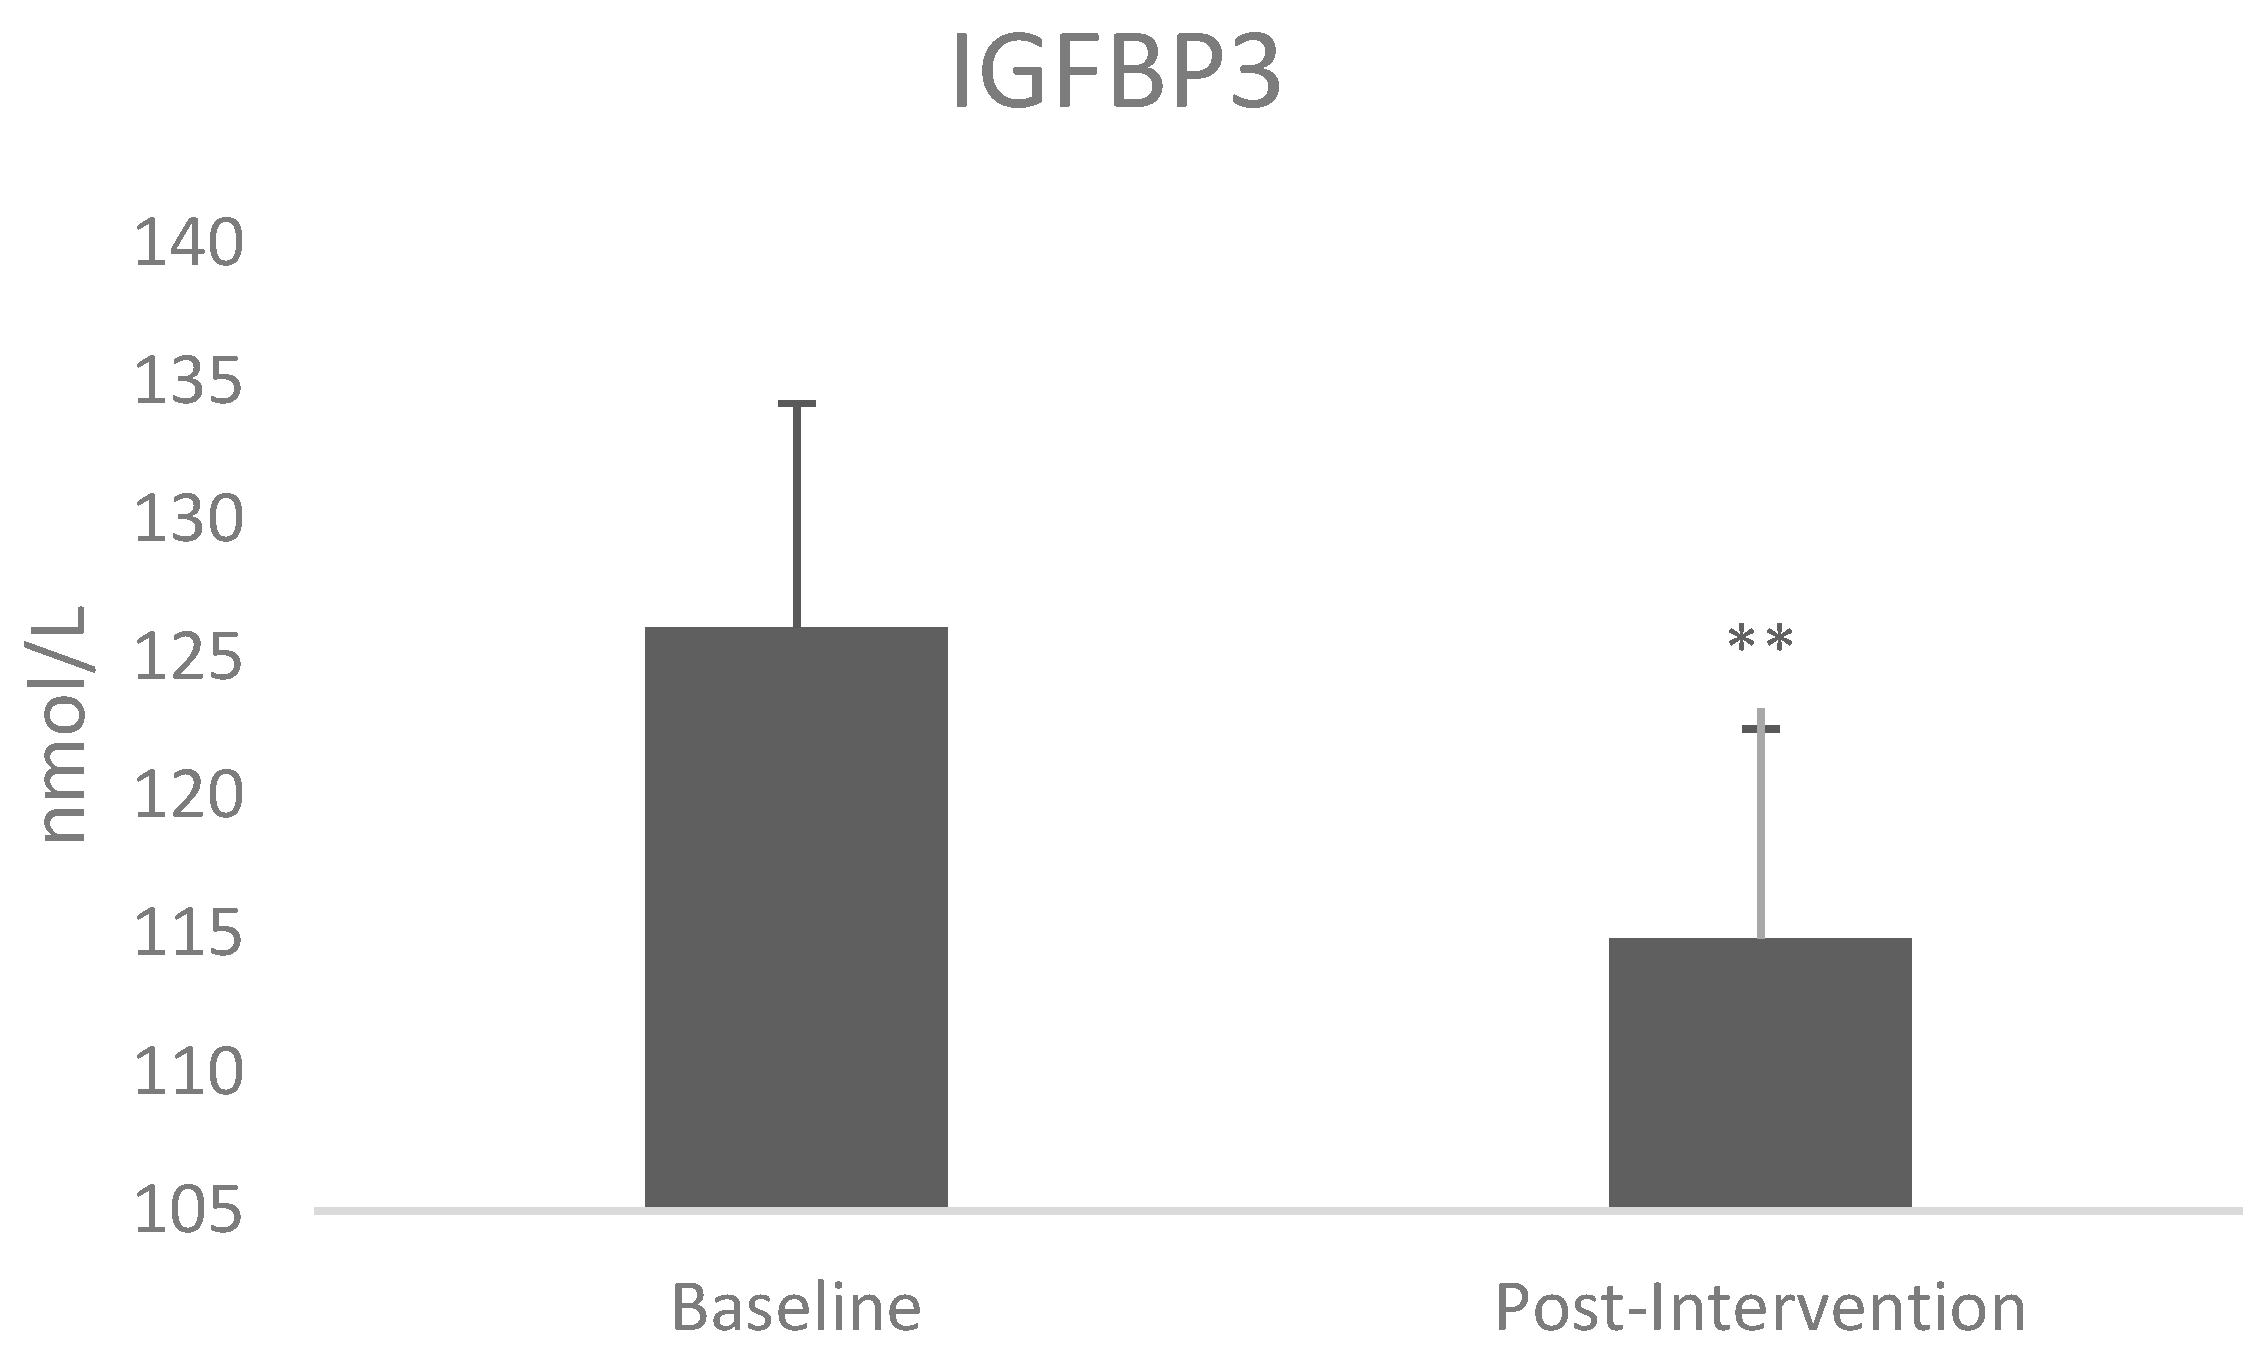
| IGFBP3 (nmol/L) | 126.0 (8.11) | 114.8 (7.59) | 0.003 * |
| IGF-i:IGFBP3 ratio | 0.126 (0.009) | 0.133 (0.008) | 0.033 * |
© 2019 by the authors. Licensee MDPI, Basel, Switzerland. This article is an open access article distributed under the terms and conditions of the Creative Commons Attribution (CC BY) license (http://creativecommons.org/licenses/by/4.0/).
Share and Cite
Malipatil, N.; Fachim, H.A.; Siddals, K.; Geary, B.; Wark, G.; Porter, N.; Anderson, S.; Donn, R.; Harvie, M.; Whetton, A.D.; et al. Data Independent Acquisition Mass Spectrometry Can Identify Circulating Proteins That Predict Future Weight Loss with a Diet and Exercise Programme. J. Clin. Med. 2019, 8, 141. https://doi.org/10.3390/jcm8020141
Malipatil N, Fachim HA, Siddals K, Geary B, Wark G, Porter N, Anderson S, Donn R, Harvie M, Whetton AD, et al. Data Independent Acquisition Mass Spectrometry Can Identify Circulating Proteins That Predict Future Weight Loss with a Diet and Exercise Programme. Journal of Clinical Medicine. 2019; 8(2):141. https://doi.org/10.3390/jcm8020141
Chicago/Turabian StyleMalipatil, Nagaraj, Helene A. Fachim, Kirk Siddals, Bethany Geary, Gwen Wark, Nick Porter, Simon Anderson, Rachelle Donn, Michelle Harvie, Anthony D. Whetton, and et al. 2019. "Data Independent Acquisition Mass Spectrometry Can Identify Circulating Proteins That Predict Future Weight Loss with a Diet and Exercise Programme" Journal of Clinical Medicine 8, no. 2: 141. https://doi.org/10.3390/jcm8020141