Usefulness of Eye Fixation Assessment for Identifying Type 2 Diabetic Subjects at Risk of Dementia

 ,
,  , and
, and
Abstract
: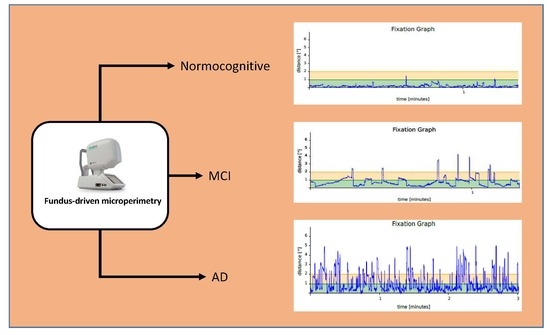
1. Introduction
2. Materials and Methods
Statistical Analysis
3. Results
4. Discussion
Author Contributions
Funding
Conflicts of Interest
References
- American Diabetes Association. 6. Glycemic Targets. Diabetes Care 2017, 40 (Suppl. 1), S48–S56. [Google Scholar] [CrossRef] [PubMed]
- Albert, M.S.; DeKosky, S.T.; Dickson, D.; Dubois, B.; Feldman, H.H.; Fox, N.C.; Gamst, A.; Holtzman, D.M.; Jagust, W.J.; Petersen, R.C.; et al. The diagnosis of mild cognitive impairment due to Alzheimer’s disease: Recommendations from the National Institute on Aging-Alzheimer’s Association workgroups on diagnostic guidelines for Alzheimer’s disease. Alzheimers Dement. 2011, 7, 270–279. [Google Scholar] [CrossRef] [PubMed]
- Biessels, G.J.; Staekenborg, S.; Brunner, E.; Brayne, C.; Scheltens, P. Risk of dementia in diabetes mellitus: A systematic review. Lancet Neurol. 2006, 5, 64–74. [Google Scholar] [CrossRef]
- Kopf, D.; Frölich, L. Risk of incident Alzheimer’s disease in diabetic patients: A systematic review of prospective trials. J. Alzheimers Dis. 2009, 16, 677–685. [Google Scholar] [CrossRef] [PubMed]
- Wang, K.-C.; Woung, L.-C.; Tsai, M.-T.; Liu, C.-C.; Su, Y.-H.; Li, C.-Y. Risk of Alzheimer’s disease in relation to diabetes: A population-based cohort study. Neuroepidemiology 2012, 38, 237–244. [Google Scholar] [CrossRef]
- Huang, C.-C.; Chung, C.-M.; Leu, H.-B.; Lin, L.-Y.; Chiu, C.-C.; Hsu, C.-Y.; Chiang, C.-H.; Huang, P.-H.; Chen, T.-J.; Lin, S.-J.; et al. Diabetes mellitus and the risk of Alzheimer’s disease: A nationwide population-based study. PLoS ONE 2014, 9, e87095. [Google Scholar] [CrossRef] [PubMed]
- Allen, K.V.; Frier, B.M.; Strachan, M.W.J. The relationship between type 2 diabetes and cognitive dysfunction: Longitudinal studies and their methodological limitations. Eur. J. Pharmacol. 2004, 490, 169–175. [Google Scholar] [CrossRef]
- Petersen, R.C.; Morris, J.C. Mild cognitive impairment as a clinical entity and treatment target. Arch. Neurol. 2005, 62, 1160–1163, discussion 1167. [Google Scholar] [CrossRef]
- Morris, J.C.; Storandt, M.; Miller, J.P.; McKeel, D.W.; Price, J.L.; Rubin, E.H.; Berg, L. Mild cognitive impairment represents early-stage Alzheimer disease. Arch. Neurol. 2001, 58, 397–405. [Google Scholar] [CrossRef]
- Alegret, M.; Cuberas-Borrós, G.; Vinyes-Junqué, G.; Espinosa, A.; Valero, S.; Hernández, I.; Roca, I.; Ruíz, A.; Rosende-Roca, M.; Mauleón, A.; et al. A two-year follow-up of cognitive deficits and brain perfusion in mild cognitive impairment and mild Alzheimer’s disease. J. Alzheimers Dis. 2012, 30, 109–120. [Google Scholar] [CrossRef]
- Ciudin, A.; Espinosa, A.; Simó-Servat, O.; Ruiz, A.; Alegret, M.; Hernández, C.; Boada, M.; Simó, R. Type 2 diabetes is an independent risk factor for dementia conversion in patients with mild cognitive impairment. J. Diabetes Complicat. 2017, 31, 1272–1274. [Google Scholar] [CrossRef] [PubMed]
- Hampel, H.; Frank, R.; Broich, K.; Teipel, S.J.; Katz, R.G.; Hardy, J.; Herholz, K.; Bokde, A.L.W.; Jessen, F.; Hoessler, Y.C.; et al. Biomarkers for Alzheimer’s disease: Academic, industry and regulatory perspectives. Nat. Rev. Drug Discov. 2010, 9, 560–574. [Google Scholar] [CrossRef] [PubMed]
- Simó, R.; Ciudin, A.; Simó-Servat, O.; Hernández, C. Cognitive impairment and dementia: A new emerging complication of type 2 diabetes-The diabetologist’s perspective. Acta Diabetol. 2017, 54, 417–424. [Google Scholar] [CrossRef]
- Xu, W.; Von Strauss, E.; Qiu, C.; Winblad, B.; Fratiglioni, L. Uncontrolled diabetes increases the risk of Alzheimer’s disease: A population-based cohort study. Diabetologia 2009, 52, 1031–1039. [Google Scholar] [CrossRef] [PubMed]
- Whitmer, R.A.; Karter, A.J.; Yaffe, K.; Quesenberry, C.P.; Selby, J.V. Hypoglycemic episodes and risk of dementia in older patients with type 2 diabetes mellitus. JAMA 2009, 301, 1565–1572. [Google Scholar] [CrossRef] [PubMed]
- Lin, C.-H.; Sheu, W.H.-H. Hypoglycaemic episodes and risk of dementia in diabetes mellitus: 7-year follow-up study. J. Intern. Med. 2013, 273, 102–110. [Google Scholar] [CrossRef] [PubMed]
- Feinkohl, I.; Aung, P.P.; Keller, M.; Robertson, C.M.; Morling, J.R.; McLachlan, S.; Deary, I.J.; Frier, B.M.; Strachan, M.W.J.; Price, J.F.; et al. Severe hypoglycemia and cognitive decline in older people with type 2 diabetes: The Edinburgh type 2 diabetes study. Diabetes Care 2014, 37, 507–515. [Google Scholar] [CrossRef]
- Simó, R.; Hernández, C. Novel approaches for treating diabetic retinopathy based on recent pathogenic evidence. Prog. Retin. Eye Res. 2015, 48, 160–180. [Google Scholar] [CrossRef]
- Sundstrom, J.M.; Hernández, C.; Weber, S.R.; Zhao, Y.; Dunklebarger, M.; Tiberti, N.; Laremore, T.; Simó-Servat, O.; Garcia-Ramirez, M.; Barber, A.J.; et al. Proteomic analysis of early diabetic retinopathy reveals mediators of neurodegenerative brain diseases. Investig. Ophthalmol. Vis. Sci. 2018, 59, 2264–2274. [Google Scholar] [CrossRef]
- Dong, Y.; Kua, Z.J.; Khoo, E.Y.H.; Koo, E.H.; Merchant, R.A. The Utility of Brief Cognitive Tests for Patients With Type 2 Diabetes Mellitus: A Systematic Review. J. Am. Med. Dir. Assoc. 2016, 17, 889–895. [Google Scholar] [CrossRef]
- Jaeger, J. Digit Symbol Substitution Test: The Case for Sensitivity Over Specificity in Neuropsychological Testing. J. Clin. Psychopharmacol. 2018, 38, 513–519. [Google Scholar] [CrossRef] [PubMed]
- Espinosa, A.; Alegret, M.; Valero, S.; Vinyes-Junqué, G.; Hernández, I.; Mauleón, A.; Rosende-Roca, M.; Ruiz, A.; López, O.; Tárraga, L.; et al. A longitudinal follow-up of 550 mild cognitive impairment patients: Evidence for large conversion to dementia rates and detection of major risk factors involved. J. Alzheimers Dis. 2013, 34, 769–780. [Google Scholar] [CrossRef] [PubMed]
- Corriere, M.; Rooparinesingh, N.; Kalyani, R.R. Epidemiology of diabetes and diabetes complications in the elderly: An emerging public health burden. Curr. Diabetes Rep. 2013, 13, 805–813. [Google Scholar] [CrossRef] [PubMed]
- Simó, R.; Hernández, C. European Consortium for the Early Treatment of Diabetic Retinopathy (EUROCONDOR) Neurodegeneration in the diabetic eye: New insights and therapeutic perspectives. Trends Endocrinol. Metab. 2014, 25, 23–33. [Google Scholar] [CrossRef] [PubMed]
- Simó, R.; Stitt, A.W.; Gardner, T.W. Neurodegeneration in diabetic retinopathy: Does it really matter? Diabetologia 2018, 61, 1902–1912. [Google Scholar] [CrossRef] [PubMed]
- Cheung, C.Y.-L.; Ikram, M.K.; Chen, C.; Wong, T.Y. Imaging retina to study dementia and stroke. Prog. Retin. Eye Res. 2017, 57, 89–107. [Google Scholar] [CrossRef] [PubMed]
- Ciudin, A.; Simó-Servat, O.; Hernández, C.; Arcos, G.; Diego, S.; Sanabria, Á.; Sotolongo, Ó.; Hernández, I.; Boada, M.; Simó, R. Retinal Microperimetry: A New Tool for Identifying Patients With Type 2 Diabetes at Risk for Developing Alzheimer Disease. Diabetes 2017, 66, 3098–3104. [Google Scholar] [CrossRef]
- Molitor, R.J.; Ko, P.C.; Ally, B.A. Eye movements in Alzheimer’s disease. J. Alzheimers Dis. 2015, 44, 1–12. [Google Scholar] [CrossRef]
- Fletcher, W.A.; Sharpe, J.A. Saccadic eye movement dysfunction in Alzheimer’s disease. Ann. Neurol. 1986, 20, 464–471. [Google Scholar] [CrossRef]
- Kapoula, Z.; Yang, Q.; Otero-Millan, J.; Xiao, S.; Macknik, S.L.; Lang, A.; Verny, M.; Martinez-Conde, S. Distinctive features of microsaccades in Alzheimer’s disease and in mild cognitive impairment. Age (Dordr.) 2014, 36, 535–543. [Google Scholar] [CrossRef]
- Bylsma, F.W.; Rasmusson, D.X.; Rebok, G.W.; Keyl, P.M.; Tune, L.; Brandt, J. Changes in visual fixation and saccadic eye movements in Alzheimer’s disease. Int. J. Psychophysiol. 1995, 19, 33–40. [Google Scholar] [CrossRef]
- Garbutt, S.; Matlin, A.; Hellmuth, J.; Schenk, A.K.; Johnson, J.K.; Rosen, H.; Dean, D.; Kramer, J.; Neuhaus, J.; Miller, B.L.; et al. Oculomotor function in frontotemporal lobar degeneration, related disorders and Alzheimer’s disease. Brain 2008, 131, 1268–1281. [Google Scholar] [CrossRef] [PubMed]
- Midena, E.; Vujosevic, S. Microperimetry in diabetic retinopathy. Saudi J. Ophthalmol. Off. J. Saudi Ophthalmol. Soc. 2011, 25, 131–135. [Google Scholar] [CrossRef] [PubMed] [Green Version]
- Fazekas, F.; Chawluk, J.B.; Alavi, A.; Hurtig, H.I.; Zimmerman, R.A. MR signal abnormalities at 1.5 T in Alzheimer’s dementia and normal aging. AJR Am. J. Roentgenol. 1987, 149, 351–356. [Google Scholar] [CrossRef] [PubMed]
- Klemp, K.; Larsen, M.; Sander, B.; Vaag, A.; Brockhoff, P.B.; Lund-Andersen, H. Effect of short-term hyperglycemia on multifocal electroretinogram in diabetic patients without retinopathy. Investig. Ophthalmol. Vis. Sci. 2004, 45, 3812–3819. [Google Scholar] [CrossRef] [PubMed]
- Wilkinson, C.P.; Ferris, F.L.; Klein, R.E.; Lee, P.P.; Agardh, C.D.; Davis, M.; Dills, D.; Kampik, A.; Pararajasegaram, R.; Verdaguer, J.T.; et al. Proposed international clinical diabetic retinopathy and diabetic macular edema disease severity scales. Ophthalmology 2003, 110, 1677–1682. [Google Scholar] [CrossRef]
- Petersen, R.C.; Smith, G.E.; Waring, S.C.; Ivnik, R.J.; Tangalos, E.G.; Kokmen, E. Mild cognitive impairment: Clinical characterization and outcome. Arch. Neurol. 1999, 56, 303–308. [Google Scholar] [CrossRef]
- Molina-Martín, A.; Piñero, D.P.; Pérez-Cambrodí, R.J. Normal values for microperimetry with the MAIA microperimeter: Sensitivity and fixation analysis in healthy adults and children. Eur. J. Ophthalmol. 2017, 27, 607–613. [Google Scholar] [CrossRef]
- Morales, M.U.; Saker, S.; Wilde, C.; Pellizzari, C.; Pallikaris, A.; Notaroberto, N.; Rubinstein, M.; Rui, C.; Limoli, P.; Smolek, M.K.; et al. Reference Clinical Database for Fixation Stability Metrics in Normal Subjects Measured with the MAIA Microperimeter. Transl. Vis. Sci. Technol. 2016, 5, 6. [Google Scholar] [CrossRef] [Green Version]
- Lagun, D.; Manzanares, C.; Zola, S.M.; Buffalo, E.A.; Agichtein, E. Detecting cognitive impairment by eye movement analysis using automatic classification algorithms. J. Neurosci. Methods 2011, 201, 196–203. [Google Scholar] [CrossRef] [Green Version]
- Al-Rahayfeh, A.; Faezipour, M. Eye Tracking and Head Movement Detection: A State-of-Art Survey. IEEE J. Transl. Eng. Health Med. 2013, 1, 2100212. [Google Scholar] [CrossRef]
- Ferhat, O.; Vilariño, F. Low Cost Eye Tracking: The Current Panorama. Comput. Intell. Neurosci. 2016, 2016, 8680541. [Google Scholar] [CrossRef] [PubMed]
- Mele, M.L.; Federici, S. Gaze and eye-tracking solutions for psychological research. Cogn. Process. 2012, 13 (Suppl. 1), 261–265. [Google Scholar] [CrossRef] [PubMed]
- Marseglia, A.; Fratiglioni, L.; Laukka, E.J.; Santoni, G.; Pedersen, N.L.; Bäckman, L.; Xu, W. Early Cognitive Deficits in Type 2 Diabetes: A Population-Based Study. J. Alzheimers Dis. 2016, 53, 1069–1078. [Google Scholar] [CrossRef] [PubMed] [Green Version]
- Martinez-Conde, S. Fixational eye movements in normal and pathological vision. Prog. Brain Res. 2006, 154, 151–176. [Google Scholar] [PubMed]
- Krauzlis, R.J.; Goffart, L.; Hafed, Z.M. Neuronal control of fixation and fixational eye movements. Philos. Trans. R. Soc. Lond. B Biol. Sci. 2017, 372, 20160205. [Google Scholar] [CrossRef] [Green Version]
- Rohrschneider, K.; Bültmann, S.; Springer, C. Use of fundus perimetry (microperimetry) to quantify macular sensitivity. Prog. Retin. Eye Res. 2008, 27, 536–548. [Google Scholar] [CrossRef]
- Jones, E.G. A new view of specific and nonspecific thalamocortical connections. Adv. Neurol. 1998, 77, 49–71, discussion 72–73. [Google Scholar]
- Erskine, D.; Taylor, J.P.; Firbank, M.J.; Patterson, L.; Onofrj, M.; O’Brien, J.T.; McKeith, I.G.; Attems, J.; Thomas, A.J.; Morris, C.M.; et al. Changes to the lateral geniculate nucleus in Alzheimer’s disease but not dementia with Lewy bodies. Neuropathol. Appl. Neurobiol. 2016, 42, 366–376. [Google Scholar] [CrossRef]
- Dugger, B.N.; Tu, M.; Murray, M.E.; Dickson, D.W. Disease specificity and pathologic progression of tau pathology in brainstem nuclei of Alzheimer’s disease and progressive supranuclear palsy. Neurosci. Lett. 2011, 491, 122–126. [Google Scholar] [CrossRef]
- Parvizi, J.; Van Hoesen, G.W.; Damasio, A. The selective vulnerability of brainstem nuclei to Alzheimer’s disease. Ann. Neurol. 2001, 49, 53–66. [Google Scholar] [CrossRef]
- Gella, L.; Raman, R.; Pal, S.S.; Ganesan, S.; Sharma, T. Fixation characteristics among subjects with diabetes: SN-DREAMS II, Report No. 5. Can. J. Ophthalmol. 2015, 50, 302–309. [Google Scholar] [CrossRef] [PubMed]


| AD n = 33 | MCI n = 33 | Normocognitive n = 34 | p | |
|---|---|---|---|---|
| Age (years) | 79 (5.57) | 77.03 (4.38) | 75.53 (6.97) | 0.06 |
| Gender (males, %) | 42.42 | 51.52 | 58.82 | 0.41 |
| BMI | 27.72 (3.79) | 28.28 (4.48) | 30.28 (4.45) | 0.61 |
| Hypertension (%) | 78.79 | 75.76 | 73.53 | 0.88 |
| Dyslipidemia (%) | 63.64 | 66.67 | 71.43 | 0.81 |
| Diabetes duration (years) | 10.45 (6.23) | 13.73 (10.64) | 10.91 (6.12) | 0.22 |
| HbA1c (% of Hb, DCCT *) | 6.79 (1.02) | 6.99 (1.25) | 7.5 (0.95) | 0.37 |
| Retinal sensitivity (dB) | 16.95 (6.01) | 21.05 (4.82) | 23.39 (2.47) | <0.00001 |
| Fixation P1 (%) | 45.03 (24.89) | 58.21 (26.66) | 88.52 (12.19) | <0.00001 |
| Fixation P2 (%) | 70.2 (20.61) | 81.03 (15.60) | 96.09 (3.66) | <0.00001 |
| BCEA95 (degrees) (median, range) | 46.3 (12.5–187.7) | 34.4 (1.2–155.1) | 4.55 (0.3–23.5) | <0.00001 |
| Reliability | 92.83 (14.49) | 97.45 (7.04) | 96.59 (13.59) | 0.28 |
| Duration of the examination (minutes) | 3.1 (1.14) | 2.34 (0.83) | 1.71 (0.42) | <0.00001 |
| Normocognitive vs. MCI | MCI vs. AD | Normocognitive vs. AD | |
|---|---|---|---|
| Retinal Sensitivity | 4.10 (1.78, 6.41) | 2.33 (0.08, 4.59) | 6.43 (4.00, 8.87) |
| Fixation P1 | 13.18 (2.10, 24.26) | 30.30 (19.49, 41.11) | 43.48 (31.83, 55.14) |
| Fixation P2 | 10.83 (3.39, 18.27) | 15.06 (7.80, 22.32) | 25.89 (18.06, 33.72) |
| BCEA95 | −23.27 (−41.23, −5.31) | −35.11 (−52.93, −17.28) | −58.37 (−77.13, −39.61) |
| Fixation P1 | Fixation P2 | BCEA95 | |
|---|---|---|---|
| Retinal Sensitivity | 0.41 * <0.001 | 0.46 * <0.00001 | −0.47 * <0.00001 |
| Fixation P1 | - | 0.93 * <0.00001 | −0.93 * <0.00001 |
| Fixation P2 | - | - | −0.96 * <0.00001 |
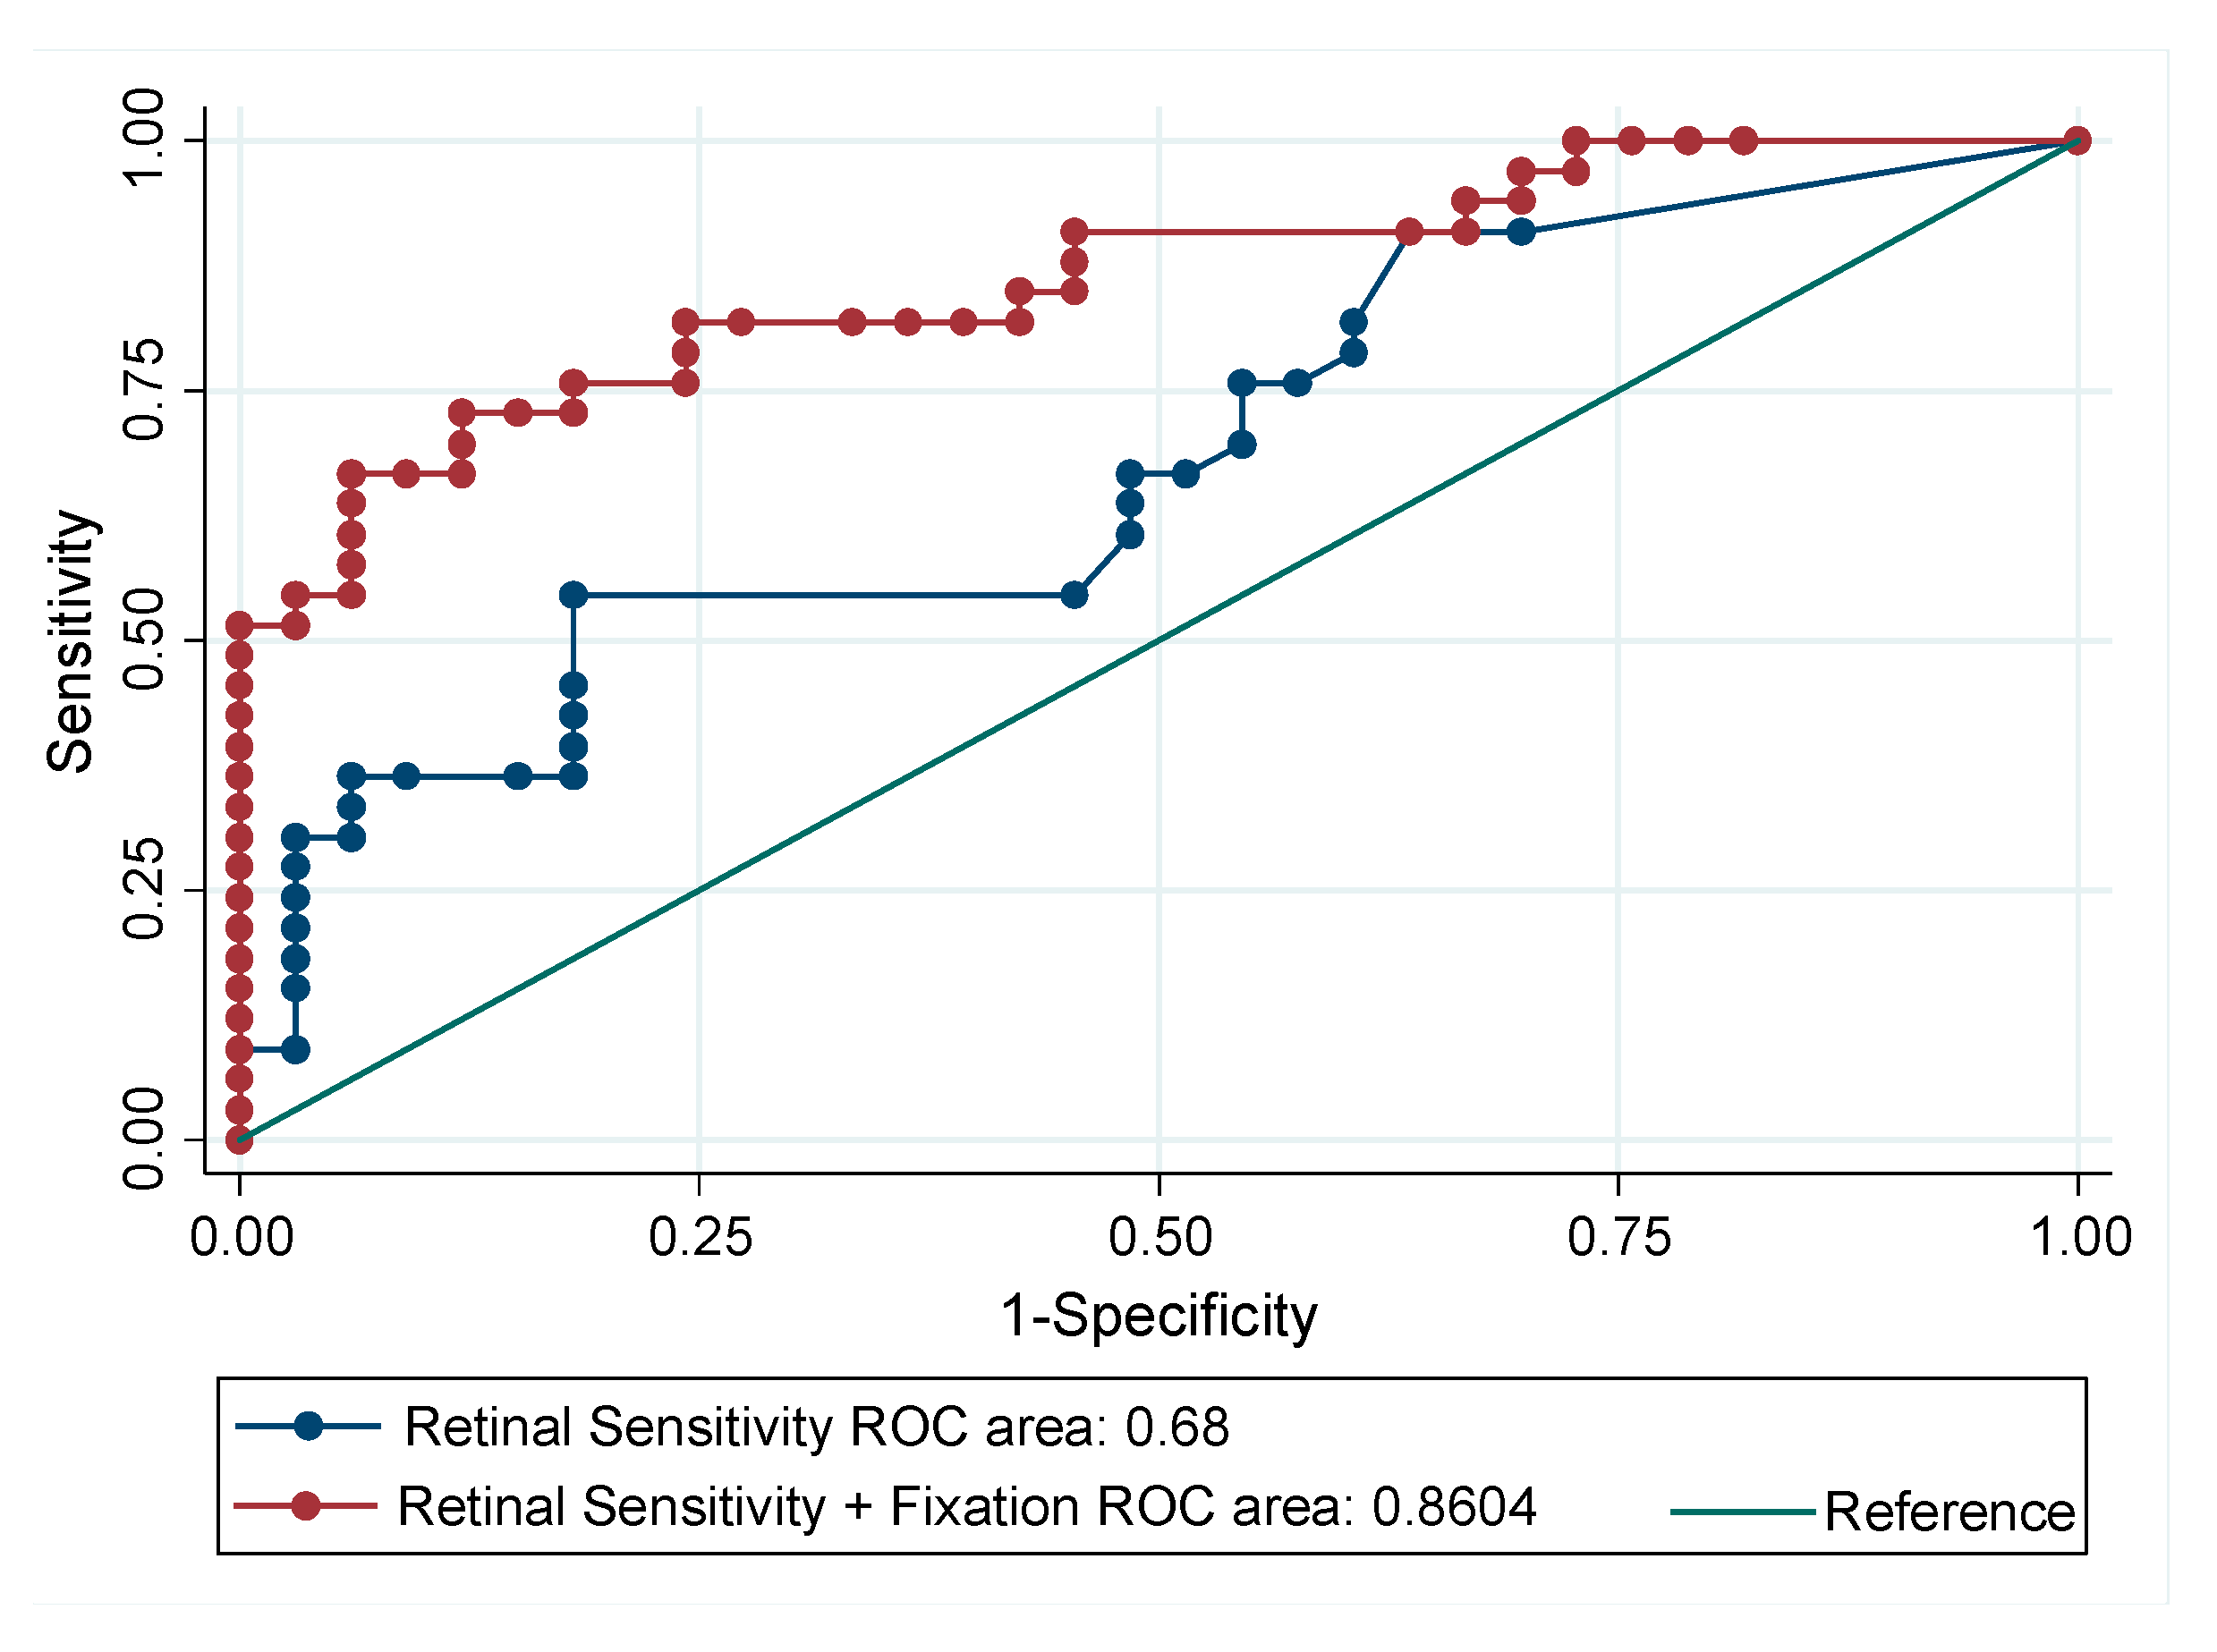
| ROC Area | Std. Err. | 95% CI | p-Value | |
|---|---|---|---|---|
| Retinal Sensitivity | 0.68 | 0.07 | 0.55–0.81 | <0.01 |
| Retinal Sensitivity + BCEA95 + Fixation P1 | 0.86 | 0.05 | 0.77–0.95 |
| VIF | 1/VIF | |
|---|---|---|
| Retinal Sensitivity | 1.15 | 0.87 |
| BCEA95 | 4.45 | 0.22 |
| Fixation P1 | 4.32 | 0.23 |
© 2019 by the authors. Licensee MDPI, Basel, Switzerland. This article is an open access article distributed under the terms and conditions of the Creative Commons Attribution (CC BY) license (http://creativecommons.org/licenses/by/4.0/).
Share and Cite
Simó-Servat, O.; Ciudin, A.; Ortiz-Zúñiga, Á.M.; Hernández, C.; Simó, R. Usefulness of Eye Fixation Assessment for Identifying Type 2 Diabetic Subjects at Risk of Dementia. J. Clin. Med. 2019, 8, 59. https://doi.org/10.3390/jcm8010059
Simó-Servat O, Ciudin A, Ortiz-Zúñiga ÁM, Hernández C, Simó R. Usefulness of Eye Fixation Assessment for Identifying Type 2 Diabetic Subjects at Risk of Dementia. Journal of Clinical Medicine. 2019; 8(1):59. https://doi.org/10.3390/jcm8010059
Chicago/Turabian StyleSimó-Servat, Olga, Andreea Ciudin, Ángel M. Ortiz-Zúñiga, Cristina Hernández, and Rafael Simó. 2019. "Usefulness of Eye Fixation Assessment for Identifying Type 2 Diabetic Subjects at Risk of Dementia" Journal of Clinical Medicine 8, no. 1: 59. https://doi.org/10.3390/jcm8010059