Early Risk Score for Predicting Hypotension in Normotensive Patients with Non-Variceal Upper Gastrointestinal Bleeding

 , , and
Abstract
:1. Introduction
2. Materials and Methods
2.1. Study Population
2.2. Evaluation at Presentation
2.3. Management and Follow-Up
2.4. Definition and Outcomes
2.5. Development and Validation of the New Prognostic Model
2.6. Statistical Analysis
3. Results
3.1. Development of the New Prognostic Model
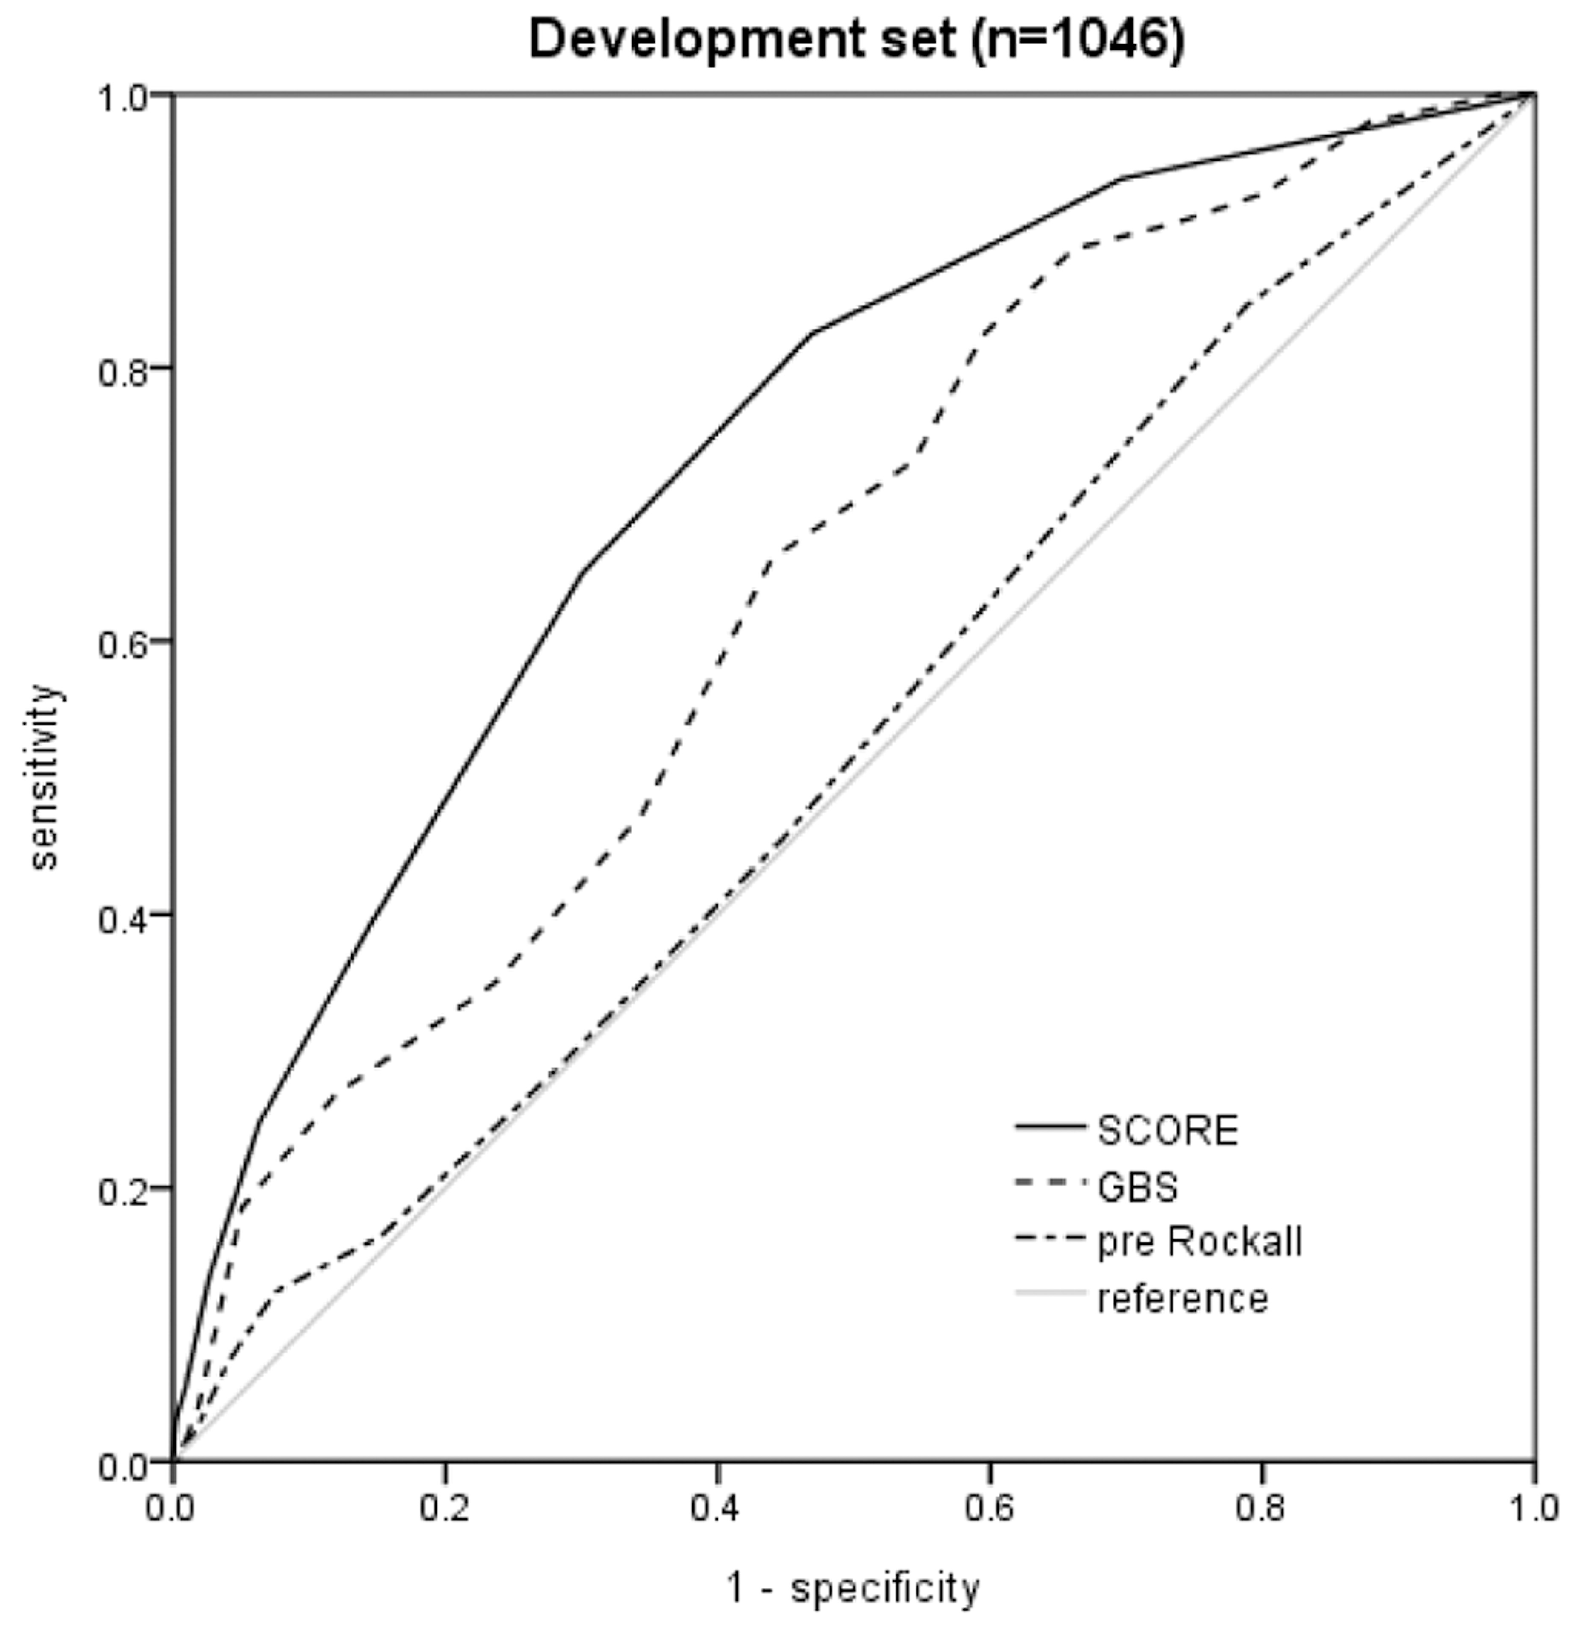
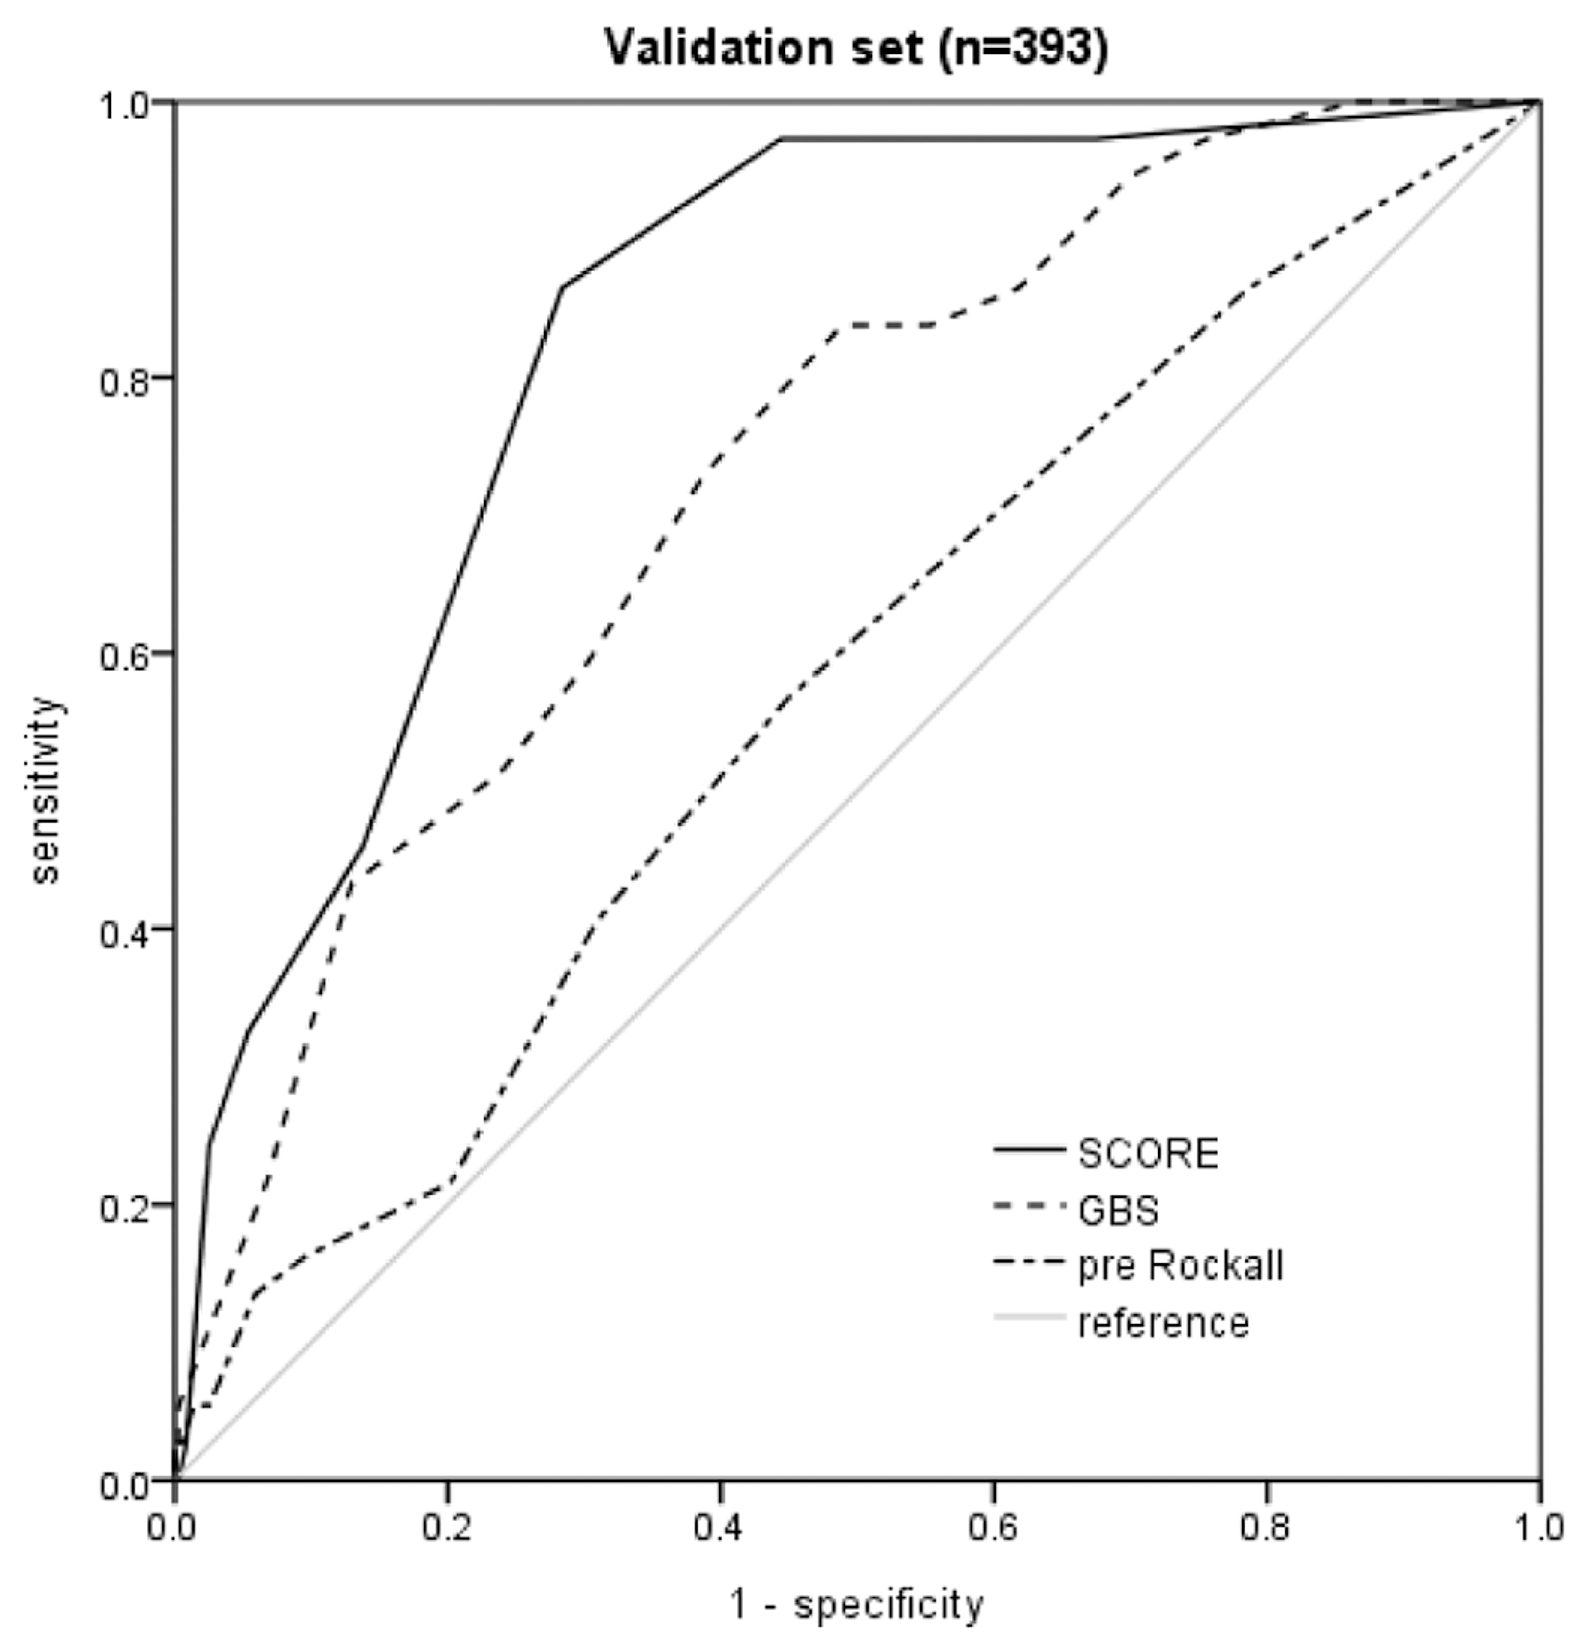
3.2. Score Comparison in the Development and Validation Sets
4. Discussion
5. Conclusions
Supplementary Materials
Author Contributions
Conflicts of Interest
References
- Imperiale, T.F.; Dominitz, J.A.; Provenzale, D.T.; Boes, L.P.; Rose, C.M.; Bowers, J.C.; Musick, B.S.; Azzouz, F.; Perkins, S.M. Predicting poor outcome from acute upper gastrointestinal hemorrhage. Arch. Intern. Med. 2007, 167, 1291–1296. [Google Scholar] [CrossRef] [PubMed]
- Barkun, A.N.; Bardou, M.; Kuipers, E.J.; Sung, J.; Hunt, R.H.; Martel, M.; Sinclair, P.; International Consensus Upper Gastrointestinal Bleeding Conference Group. International consensus recommendations on the management of patients with nonvariceal upper gastrointestinal bleeding. Ann. Intern. Med. 2010, 152, 101–113. [Google Scholar] [CrossRef] [PubMed]
- Cheng, D.W.; Lu, Y.W.; Teller, T.; Sekhon, H.K.; Wu, B.U. A modified Glasgow Blatchford Score improves risk stratification in upper gastrointestinal bleed: A prospective comparison of scoring systems. Aliment. Pharmacol. Ther. 2012, 36, 782–789. [Google Scholar] [CrossRef] [PubMed]
- Hyett, B.H.; Abougergi, M.S.; Charpentier, J.P.; Kumar, N.L.; Brozovic, S.; Claggett, B.L.; Travis, A.C.; Saltzman, J.R. The AIMS65 score compared with the Glasgow-Blatchford score in predicting outcomes in upper GI bleeding. Gastrointest. Endosc. 2013, 77, 551–557. [Google Scholar] [CrossRef] [PubMed]
- Stanley, A.J. Update on risk scoring systems for patients with upper gastrointestinal haemorrhage. World J. Gastroenterol. 2012, 18, 2739–2744. [Google Scholar] [CrossRef]
- Blatchford, O.; Murray, W.R.; Blatchford, M. A risk score to predict need for treatment for upper-gastrointestinal haemorrhage. Lancet 2000, 356, 1318–1321. [Google Scholar] [CrossRef]
- Rockall, T.A.; Logan, R.F.; Devlin, H.B.; Northfield, T.C. Risk assessment after acute upper gastrointestinal haemorrhage. Gut 1996, 38, 316–321. [Google Scholar] [CrossRef]
- Khamaysi, I.; Gralnek, I.M. Acute upper gastrointestinal bleeding (UGIB)—initial evaluation and management. Best Pract. Res. Clin. Gastroenterol. 2013, 27, 633–638. [Google Scholar] [CrossRef]
- Srygley, F.D.; Gerardo, C.J.; Tran, T.; Fisher, D.A. Does this patient have a severe upper gastrointestinal bleed? JAMA 2012, 307, 1072–1079. [Google Scholar] [CrossRef]
- Ko, B.S.; Kim, W.Y.; Ryoo, S.M.; Ahn, S.; Sohn, C.H.; Seo, D.W.; Lee, Y.S.; Lim, K.S.; Jung, H.Y. Predicting the Occurrence of Hypotension in Stable Patients with Nonvariceal Upper Gastrointestinal Bleeding: Point-of-Care Lactate Testing. Crit. Care Med. 2015, 43, 2409–2415. [Google Scholar] [CrossRef]
- Stanley, A.J.; Laine, L.; Dalton, H.R.; Ngu, J.H.; Schultz, M.; Abazi, R.; Zakko, L.; Thornton, S.; Wilkinson, K.; Khor, C.J.; et al. Comparison of risk scoring systems for patients presenting with upper gastrointestinal bleeding: International multicentre prospective study. BMJ 2017, 356, i6432. [Google Scholar] [CrossRef] [PubMed]
- Sullivan, L.M.; Massaro, J.M.; D’Agostino, R.B., Sr. Presentation of multivariate data for clinical use: The Framingham Study risk score functions. Stat. Med. 2004, 23, 1631–1660. [Google Scholar] [CrossRef]
- Laine, L.; Jensen, D.M. Management of patients with ulcer bleeding. Am. J. Gastroenterol. 2012, 107, 345–360. [Google Scholar] [CrossRef]
- Laursen, S.B.; Dalton, H.R.; Murray, I.A.; Michell, N.; Johnston, M.R.; Schultz, M.; Hansen, J.M.; Schaffalitzky de Muckadell, O.B.; Blatchford, O.; Stanley, A.J.; et al. Performance of new thresholds of the Glasgow Blatchford score in managing patients with upper gastrointestinal bleeding. Clin. Gastroenterol. Hepatol. 2015, 13, 115–121. [Google Scholar] [CrossRef] [PubMed]
- Kraut, J.A.; Madias, N.E. Lactic acidosis. N. Engl. J. Med. 2014, 371, 2309–2319. [Google Scholar] [CrossRef] [PubMed]
- Shah, A.; Chisolm-Straker, M.; Alexander, A.; Rattu, M.; Dikdan, S.; Manini, A.F. Prognostic use of lactate to predict inpatient mortality in acute gastrointestinal hemorrhage. Am. J. Emerg. Med. 2014, 32, 752–755. [Google Scholar] [CrossRef]
- El-Kersh, K.; Chaddha, U.; Sinha, R.S.; Saad, M.; Guardiola, J.; Cavallazzi, R. Predictive role of admission lactate level in critically Ill patients with acute upper gastrointestinal bleeding. J. Emerg. Med. 2015, 49, 318–325. [Google Scholar] [CrossRef]
- Lee, S.H.; Min, Y.W.; Bae, J.; Lee, H.; Min, B.H.; Lee, J.H.; Rhee, P.L.; Kim, J.J. Lactate parameters predict clinical outcomes in patients with nonvariceal upper gastrointestinal bleeding. J. Korean Med. Sci. 2017, 32, 1820–1827. [Google Scholar] [CrossRef]
- Singer, M.; Deutschman, C.S.; Seymour, C.W.; Shankar-Hari, M.; Annane, D.; Bauer, M.; Bellomo, R.; Bernard, G.R.; Chiche, J.D.; Coopersmith, C.M.; et al. The third international consensus definitions for sepsis and septic shock (sepsis-3). JAMA 2016, 315, 801–810. [Google Scholar] [CrossRef]
- Sammour, T.; Kahokehr, A.; Caldwell, S.; Hill, A.G. Venous glucose and arterial lactate as biochemical predictors of mortality in clinically severely injured trauma patients—a comparison with ISS and TRISS. Injury 2009, 40, 104–108. [Google Scholar] [CrossRef]
- Barkun, A.; Bardou, M.; Marshall, J.K.; Nonvariceal Upper GI Bleeding Consensus Conference Group. Consensus recommendations for managing patients with nonvariceal upper gastrointestinal bleeding. Ann. Intern. Med. 2003, 139, 843–857. [Google Scholar] [CrossRef] [PubMed]
- Gormican, S.P. CRAMS scale: Field triage of trauma victims. Ann. Emerg. Med. 1982, 11, 132–135. [Google Scholar] [CrossRef]
- Sartorius, D.; Le Manach, Y.; David, J.S.; Rancurel, E.; Smail, N.; Thicoipe, M.; Wiel, E.; Ricard-Hibon, A.; Berthier, F.; Gueugniaud, P.Y.; et al. Mechanism, glasgow coma scale, age, and arterial pressure (MGAP): A new simple prehospital triage score to predict mortality in trauma patients. Crit. Care Med. 2010, 38, 831–837. [Google Scholar] [CrossRef] [PubMed]
- Hasler, R.M.; Nuesch, E.; Juni, P.; Bouamra, O.; Exadaktylos, A.K.; Lecky, F. Systolic blood pressure below 110 mmHg is associated with increased mortality in penetrating major trauma patients: Multicentre cohort study. Resuscitation 2012, 83, 476–481. [Google Scholar] [CrossRef] [PubMed]
- Corley, D.A.; Stefan, A.M.; Wolf, M.; Cook, E.F.; Lee, T.H. Early indicators of prognosis in upper gastrointestinal hemorrhage. Am. J. Gastroenterol. 1998, 93, 336–340. [Google Scholar] [CrossRef] [PubMed]
- Lin, H.J.; Perng, C.L.; Lee, F.Y.; Lee, C.H.; Lee, S.D. Clinical courses and predictors for rebleeding in patients with peptic ulcers and non-bleeding visible vessels: A prospective study. Gut 1994, 35, 1389–1393. [Google Scholar] [CrossRef] [PubMed]
- Zimmerman, J.; Siguencia, J.; Tsvang, E.; Beeri, R.; Arnon, R. Predictors of mortality in patients admitted to hospital for acute upper gastrointestinal hemorrhage. Scand. J. Gastroenterol. 1995, 30, 327–331. [Google Scholar] [CrossRef] [PubMed]
- Palamidessi, N.; Sinert, R.; Falzon, L.; Zehtabchi, S. Nasogastric aspiration and lavage in emergency department patients with hematochezia or melena without hematemesis. Acad. Emerg. Med. 2010, 17, 126–132. [Google Scholar] [CrossRef]
- Witting, M.D.; Magder, L.; Heins, A.E.; Mattu, A.; Granja, C.A.; Baumgarten, M. Usefulness and validity of diagnostic nasogastric aspiration in patients without hematemesis. Ann. Emerg. Med. 2004, 43, 525–532. [Google Scholar] [CrossRef]
- Pateron, D.; Vicaut, E.; Debuc, E.; Sahraoui, K.; Carbonell, N.; Bobbia, X.; Thabut, D.; Adnet, F.; Nahon, P.; Amathieu, R.; et al. Erythromycin infusion or gastric lavage for upper gastrointestinal bleeding: A multicenter randomized controlled trial. Ann. Emerg. Med. 2011, 57, 582–589. [Google Scholar] [CrossRef]
- Huang, E.S.; Karsan, S.; Kanwal, F.; Singh, I.; Makhani, M.; Spiegel, B.M. Impact of nasogastric lavage on outcomes in acute GI bleeding. Gastrointest. Endosc. 2011, 74, 971–980. [Google Scholar] [CrossRef] [PubMed]
- Aljebreen, A.M.; Fallone, C.A.; Barkun, A.N. Nasogastric aspirate predicts high-risk endoscopic lesions in patients with acute upper-GI bleeding. Gastrointest. Endosc. 2004, 59, 172–178. [Google Scholar] [CrossRef]

| Characteristics | No hypotension Occurrence (n = 949) | Hypotension Occurrence (n = 97) | OR | 95% CI | p |
|---|---|---|---|---|---|
| Demographics | |||||
| Age | |||||
| Mean ± SD | 61.0 ± 16.7 | 60.9 ± 13.4 | 0.999 | 0.989–1.012 | 0.936 |
| Male, n (%) | 286 (30.1) | 17 (17.5) | 0.493 | 0.287–0.847 | 0.010 |
| Comorbidities, n (%) | |||||
| Diabetes mellitus | 197 (20.7) | 26 (26.8) | 1.398 | 0.869–2.250 | 0.168 |
| Hypertension | 358 (37.7) | 38 (39.1) | 1.063 | 0.693–1.632 | 0.779 |
| Chronic liver disease | 37 (3.9) | 1 (1.0) | 0.257 | 0.035–1.892 | 0.182 |
| Coagulopathy | 157 (16.5) | 20 (20.6) | 1.310 | 0.778–2.206 | 0.309 |
| Ischemic heart disease | 123 (12.9) | 9 (9.3) | 0.687 | 0.337–1.399 | 0.301 |
| Heart failure | 27 (2.8) | 6 (6.2) | 2.252 | 0.906–5.596 | 0.081 |
| Neoplasm | 124 (13.0) | 18 (18.5) | 1.516 | 1.516–2.616 | 0.135 |
| CKD | 81 (8.5) | 7 (7.2) | 0.833 | 0.374–1.859 | 0.656 |
| Previous GIB history | 144 (15.1) | 17 (17.5) | 1.188 | 0.684–2.064 | 0.541 |
| COPD | 21 (2.2) | 2 (2.1) | 0.927 | 0.214–4.016 | 0.920 |
| Stroke | 87 (9.2) | 5 (5.2) | 0.538 | 0.213–1.360 | 0.190 |
| Associated symptom and signs | |||||
| Syncope | 34 (3.6) | 4 (4.1) | 1.157 | 0.402–3.333 | 0.786 |
| Melena on rectal examination | 406 (42.7) | 54 (55.6) | 1.944 | 1.241–3.045 | 0.004 |
| Fresh blood on nasogastric tube | 90 (9.5) | 23 (23.7) | 3.082 | 1.827–5.201 | <0.001 |
| Mental change | |||||
| Yes | 20 (2.1) | 4 (4.1) | 1.998 | 0.669–5.969 | 0.215 |
| Drug history | |||||
| Antiplatelet agent | 195 (20.5) | 12 (12.3) | 0.546 | 0.292–1.019 | 0.057 |
| NSAIDs | 34 (3.6) | 3 (3.1) | 0.859 | 0.259–2.850 | 0.804 |
| Anticoagulation | 71 (7.5) | 10 (10.3) | 1.421 | 0.707–2.856 | 0.323 |
| Vital signs (mean ± SD) | |||||
| SBP (mmHg) | 127.4 ± 20.2 | 113.9 ± 19.1 | 0.957 | 0.943–0.971 | <0.001 |
| DBP (mmHg) | 77.5 ± 15.1 | 72.3 ± 17.4 | 0.976 | 0.961–0.991 | 0.001 |
| Heart rate (/min) | 91.2 ± 20.5 | 95.3 ± 19.5 | 1.010 | 0.999–1.020 | 0.063 |
| Respiratory rate (/min) | 19.7 ± 1.5 | 20.1 ± 2.2 | 1.133 | 1.017–1.262 | 0.024 |
| Body temperature (°C) | 36.5 ± 0.5 | 36.4 ± 0.6 | 0.647 | 0.427–0.979 | 0.039 |
| Laboratory findings, median (mean, SD) | |||||
| Hemoglobin (g/dL) | 10.4 ± 2.9 | 9.5 ± 2.7 | 0.900 | 0.837–0.967 | 0.004 |
| Platelet count | 230 ± 97 | 224 ± 92 | 0.999 | 0.997–1.002 | 0.587 |
| (×103/mm3) | |||||
| PT/INR (%) | 90.1 ± 24.2 | 83.5 ± 24.5 | 0.990 | 0.982–0.998 | 0.012 |
| PT/INR (s) | 13.7 ± 10.9 | 14.3 ± 9.1 | 1.004 | 0.988–1.021 | 0.597 |
| BUN (mg/dL) | 30.5 ± 23.5 | 36.3 ± 23.9 | 1.008 | 1.001–1.016 | 0.023 |
| Creatinine (mg/dL) | 1.3 ± 1.6 | 1.3 ± 1.6 | 1.027 | 0.906–1.164 | 0.677 |
| Albumin (g/dL) | 3.3 ± 0.6 | 3.0 ± 0.6 | 0.505 | 0.365–0.698 | <0.001 |
| Lactate (mmol/L) | 1.7 ± 1.3 | 2.6 ± 2.9 | 1.260 | 1.145–1.386 | <0.001 |
| Base deficit (mmol/L) | 1.3 ± 3.9 | 0.1 ± 5.6 | 0.937 | 0.896–0.981 | 0.005 |
| Risk scores, median (mean, SD) | |||||
| GBS | 9.4 ± 3.6 | 11.2 ± 3.1 | 1.175 | 1.099–1.256 | <0.001 |
| Pre-endoscopy Rockall score | 1.8 ± 1.7 | 2.0 ± 1.8 | 1.060 | 0.941–1.195 | 0.335 |
| Factors | Values | Points |
|---|---|---|
| Lactate (mmol/L) | 2–3.9 | 1 |
| ≥4 | 2 | |
| Blood in NG | Yes | 2 |
| SBP (mmHg) | <100 | 5 |
| 100–109 | 4 | |
| 110–119 | 3 | |
| 120–129 | 2 | |
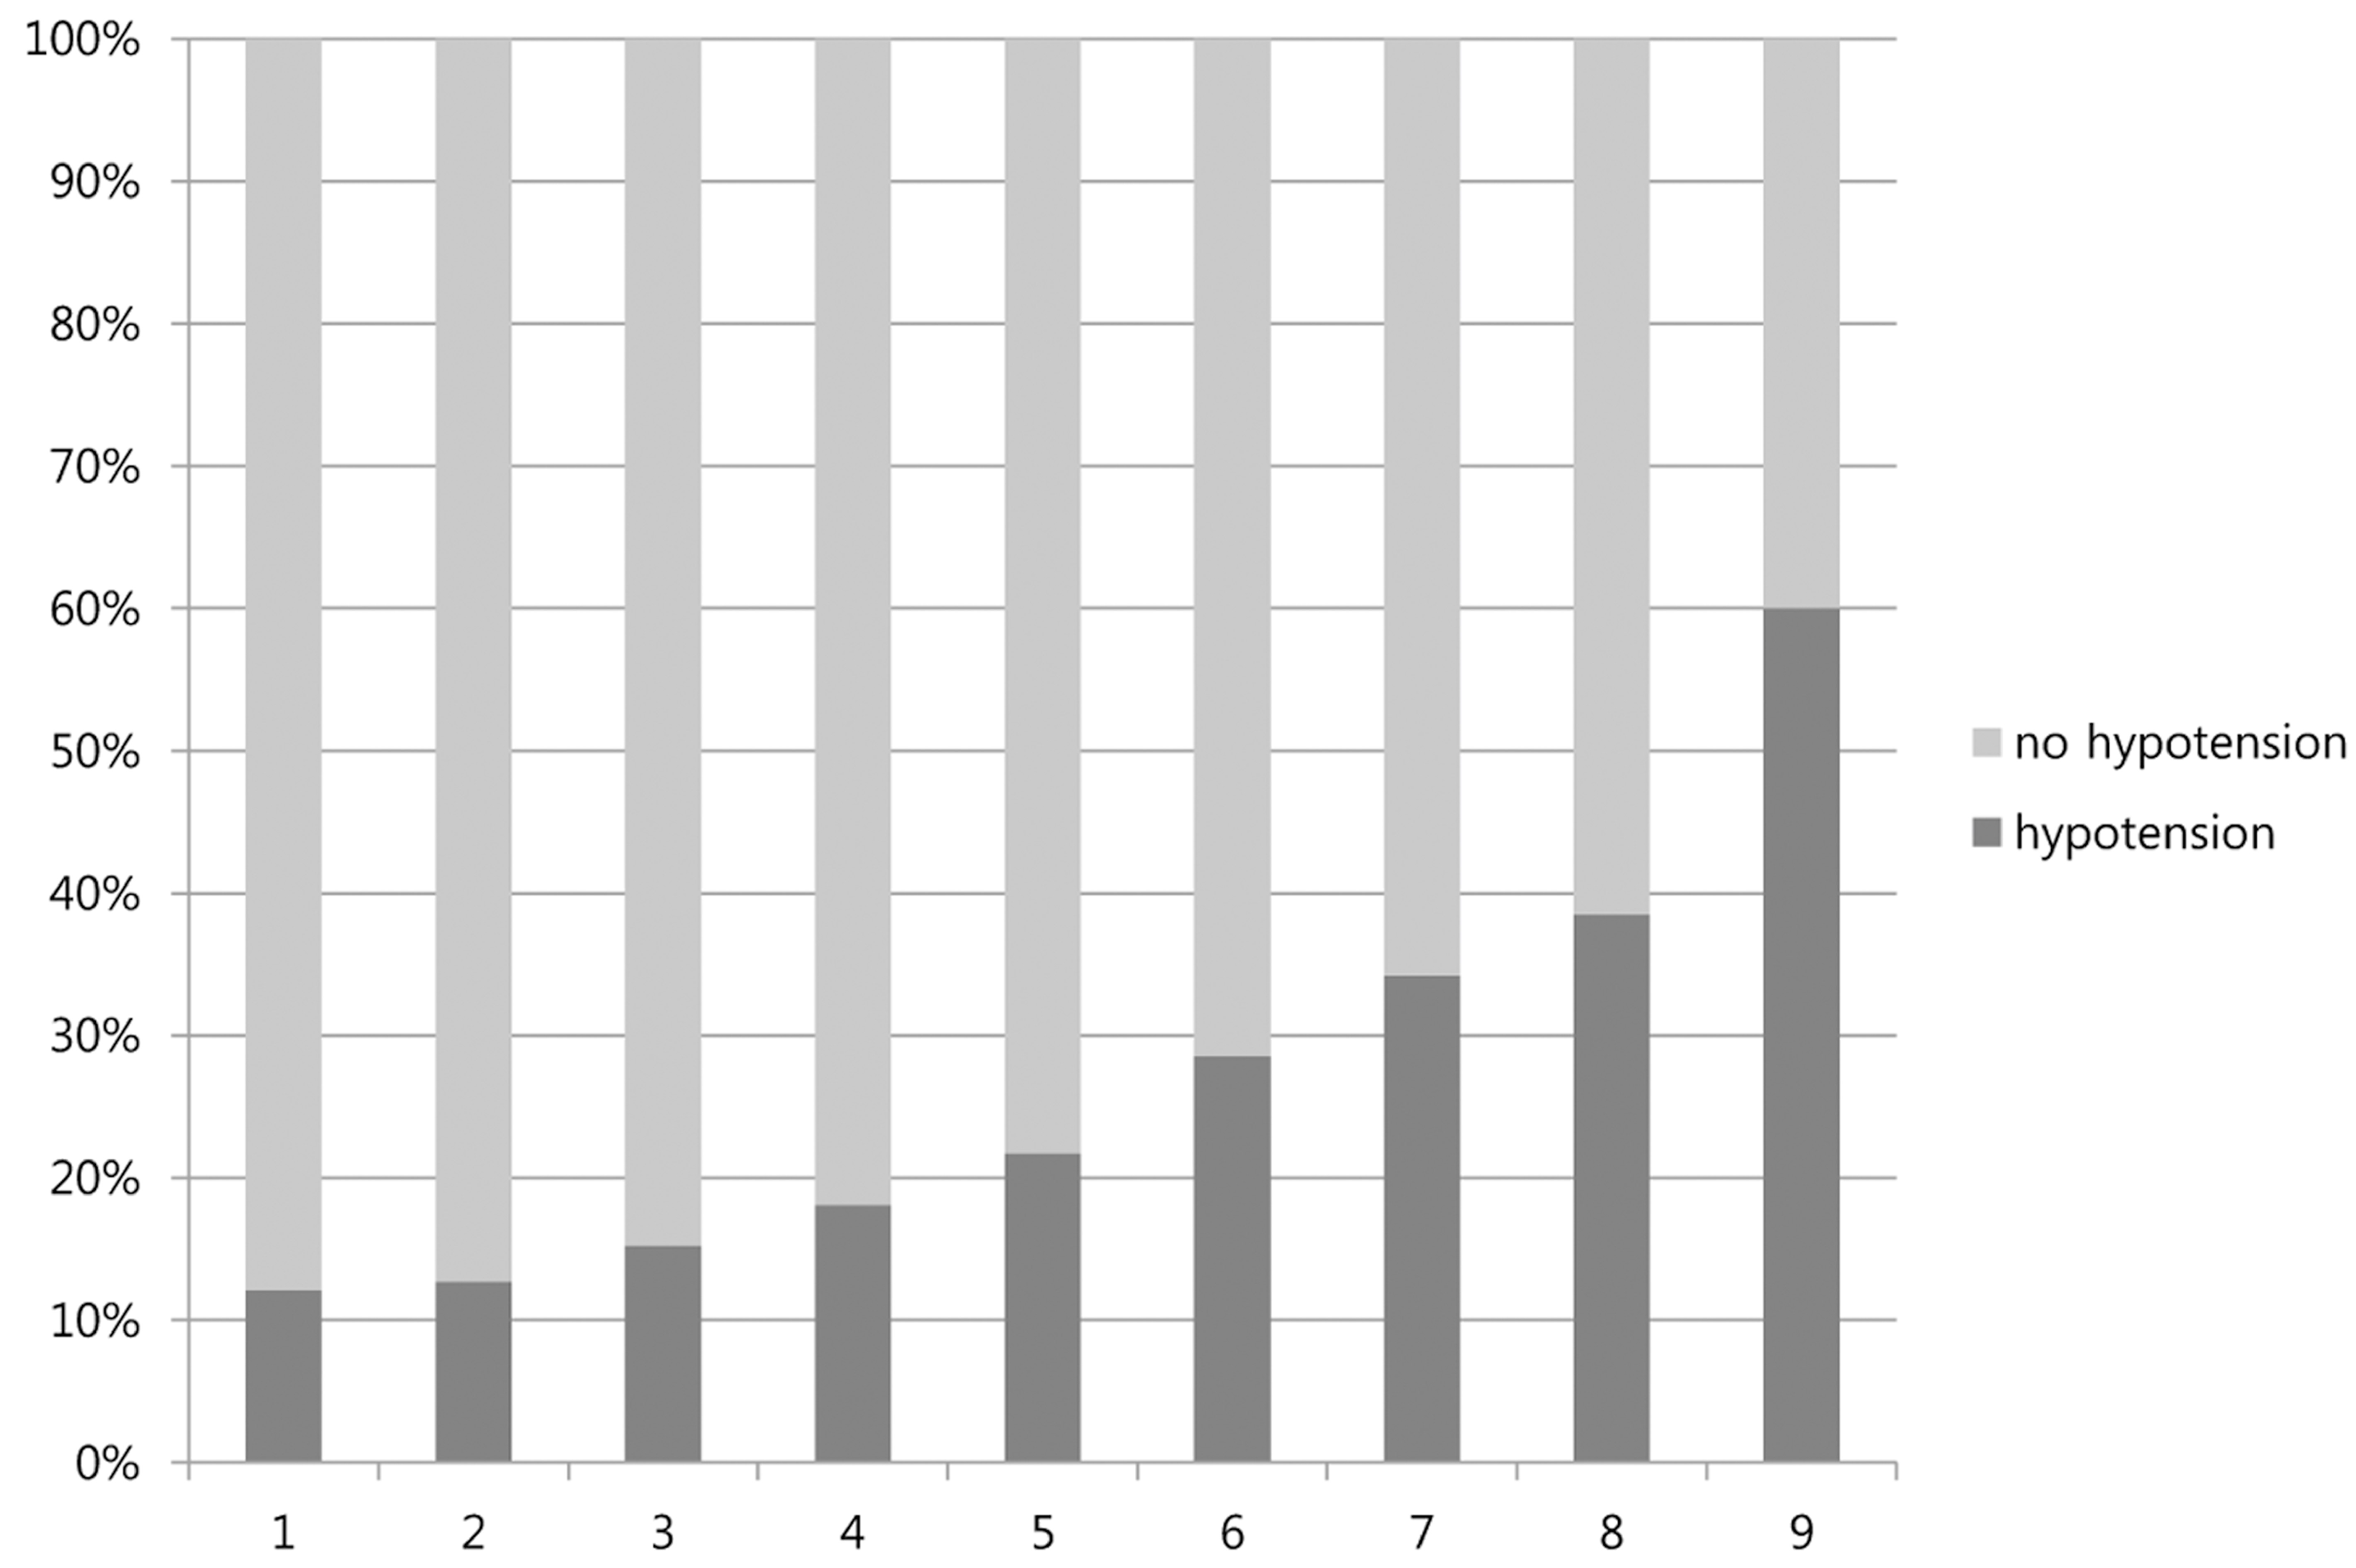
| Sum | 9 |
| Cutoff Point | Number of Hypotension | Sensitivity | Specificity | PPV | NPV | AUC |
|---|---|---|---|---|---|---|
| ≥1 | 91 | 93.8 | 30.3 | 12.1 | 97.9 | 0.620 |
| ≥2 | 88 | 90.7 | 36.5 | 12.7 | 97.5 | 0.638 |
| ≥3 | 80 | 82.5 | 53.1 | 15.2 | 96.7 | 0.682 |
| ≥4 | 63 | 64.9 | 69.9 | 18.1 | 95.1 | 0.680 |
| ≥5 | 38 | 39.1 | 85.5 | 21.7 | 93.2 | 0.627 |
| ≥6 | 24 | 24.7 | 93.6 | 28.5 | 92.4 | 0.586 |
| ≥7 | 13 | 13.4 | 97.3 | 34.2 | 91.6 | 0.541 |
| ≥8 | 5 | 5.1 | 99.1 | 38.4 | 91.0 | 0.515 |
| ≥9 | 3 | 3.1 | 99.7 | 60.0 | 90.9 | 0.513 |
| Score | Number of Hypotension | Sensitivity (%) | Specificity (%) | PPV (%) | NPV (%) | AUC |
|---|---|---|---|---|---|---|
| New score (≤2) | 36 | 97.3 | 55.6 | 18.6 | 99.5 | 0.755 |
| New score (≥7) | 9 | 24.3 | 97.5 | 50.0 | 92.5 | 0.606 |
| GBS (≥7) | 35 | 94.5 | 30.1 | 12.3 | 98.1 | 0.612 |
© 2019 by the authors. Licensee MDPI, Basel, Switzerland. This article is an open access article distributed under the terms and conditions of the Creative Commons Attribution (CC BY) license (http://creativecommons.org/licenses/by/4.0/).
Share and Cite
Ko, B.S.; Kim, Y.-J.; Jung, D.H.; Sohn, C.H.; Seo, D.W.; Lee, Y.-S.; Lim, K.S.; Jung, H.-y.; Kim, W.Y. Early Risk Score for Predicting Hypotension in Normotensive Patients with Non-Variceal Upper Gastrointestinal Bleeding. J. Clin. Med. 2019, 8, 37. https://doi.org/10.3390/jcm8010037
Ko BS, Kim Y-J, Jung DH, Sohn CH, Seo DW, Lee Y-S, Lim KS, Jung H-y, Kim WY. Early Risk Score for Predicting Hypotension in Normotensive Patients with Non-Variceal Upper Gastrointestinal Bleeding. Journal of Clinical Medicine. 2019; 8(1):37. https://doi.org/10.3390/jcm8010037
Chicago/Turabian StyleKo, Byuk Sung, Youn-Jung Kim, Dae Ho Jung, Chang Hwan Sohn, Dong Woo Seo, Yoon-Seon Lee, Kyoung Soo Lim, Hwoon-yong Jung, and Won Young Kim. 2019. "Early Risk Score for Predicting Hypotension in Normotensive Patients with Non-Variceal Upper Gastrointestinal Bleeding" Journal of Clinical Medicine 8, no. 1: 37. https://doi.org/10.3390/jcm8010037