Salivary Biomarkers of Oxidative Stress in Children with Chronic Kidney Disease

 ,
,  , ,
, ,
Abstract
:1. Introduction
2. Materials and Methods
2.1. Patients
2.2. Saliva Collection
2.3. Dental Examination
2.4. Blood Collection
2.5. Redox Assays
2.6. Salivary Antioxidants
2.7. Total Antioxidant/Oxidant Status
2.8. Oxidative Damage Markers
2.9. Statistical Analysis
3. Results
3.1. Patients
3.2. Salivary Gland Function
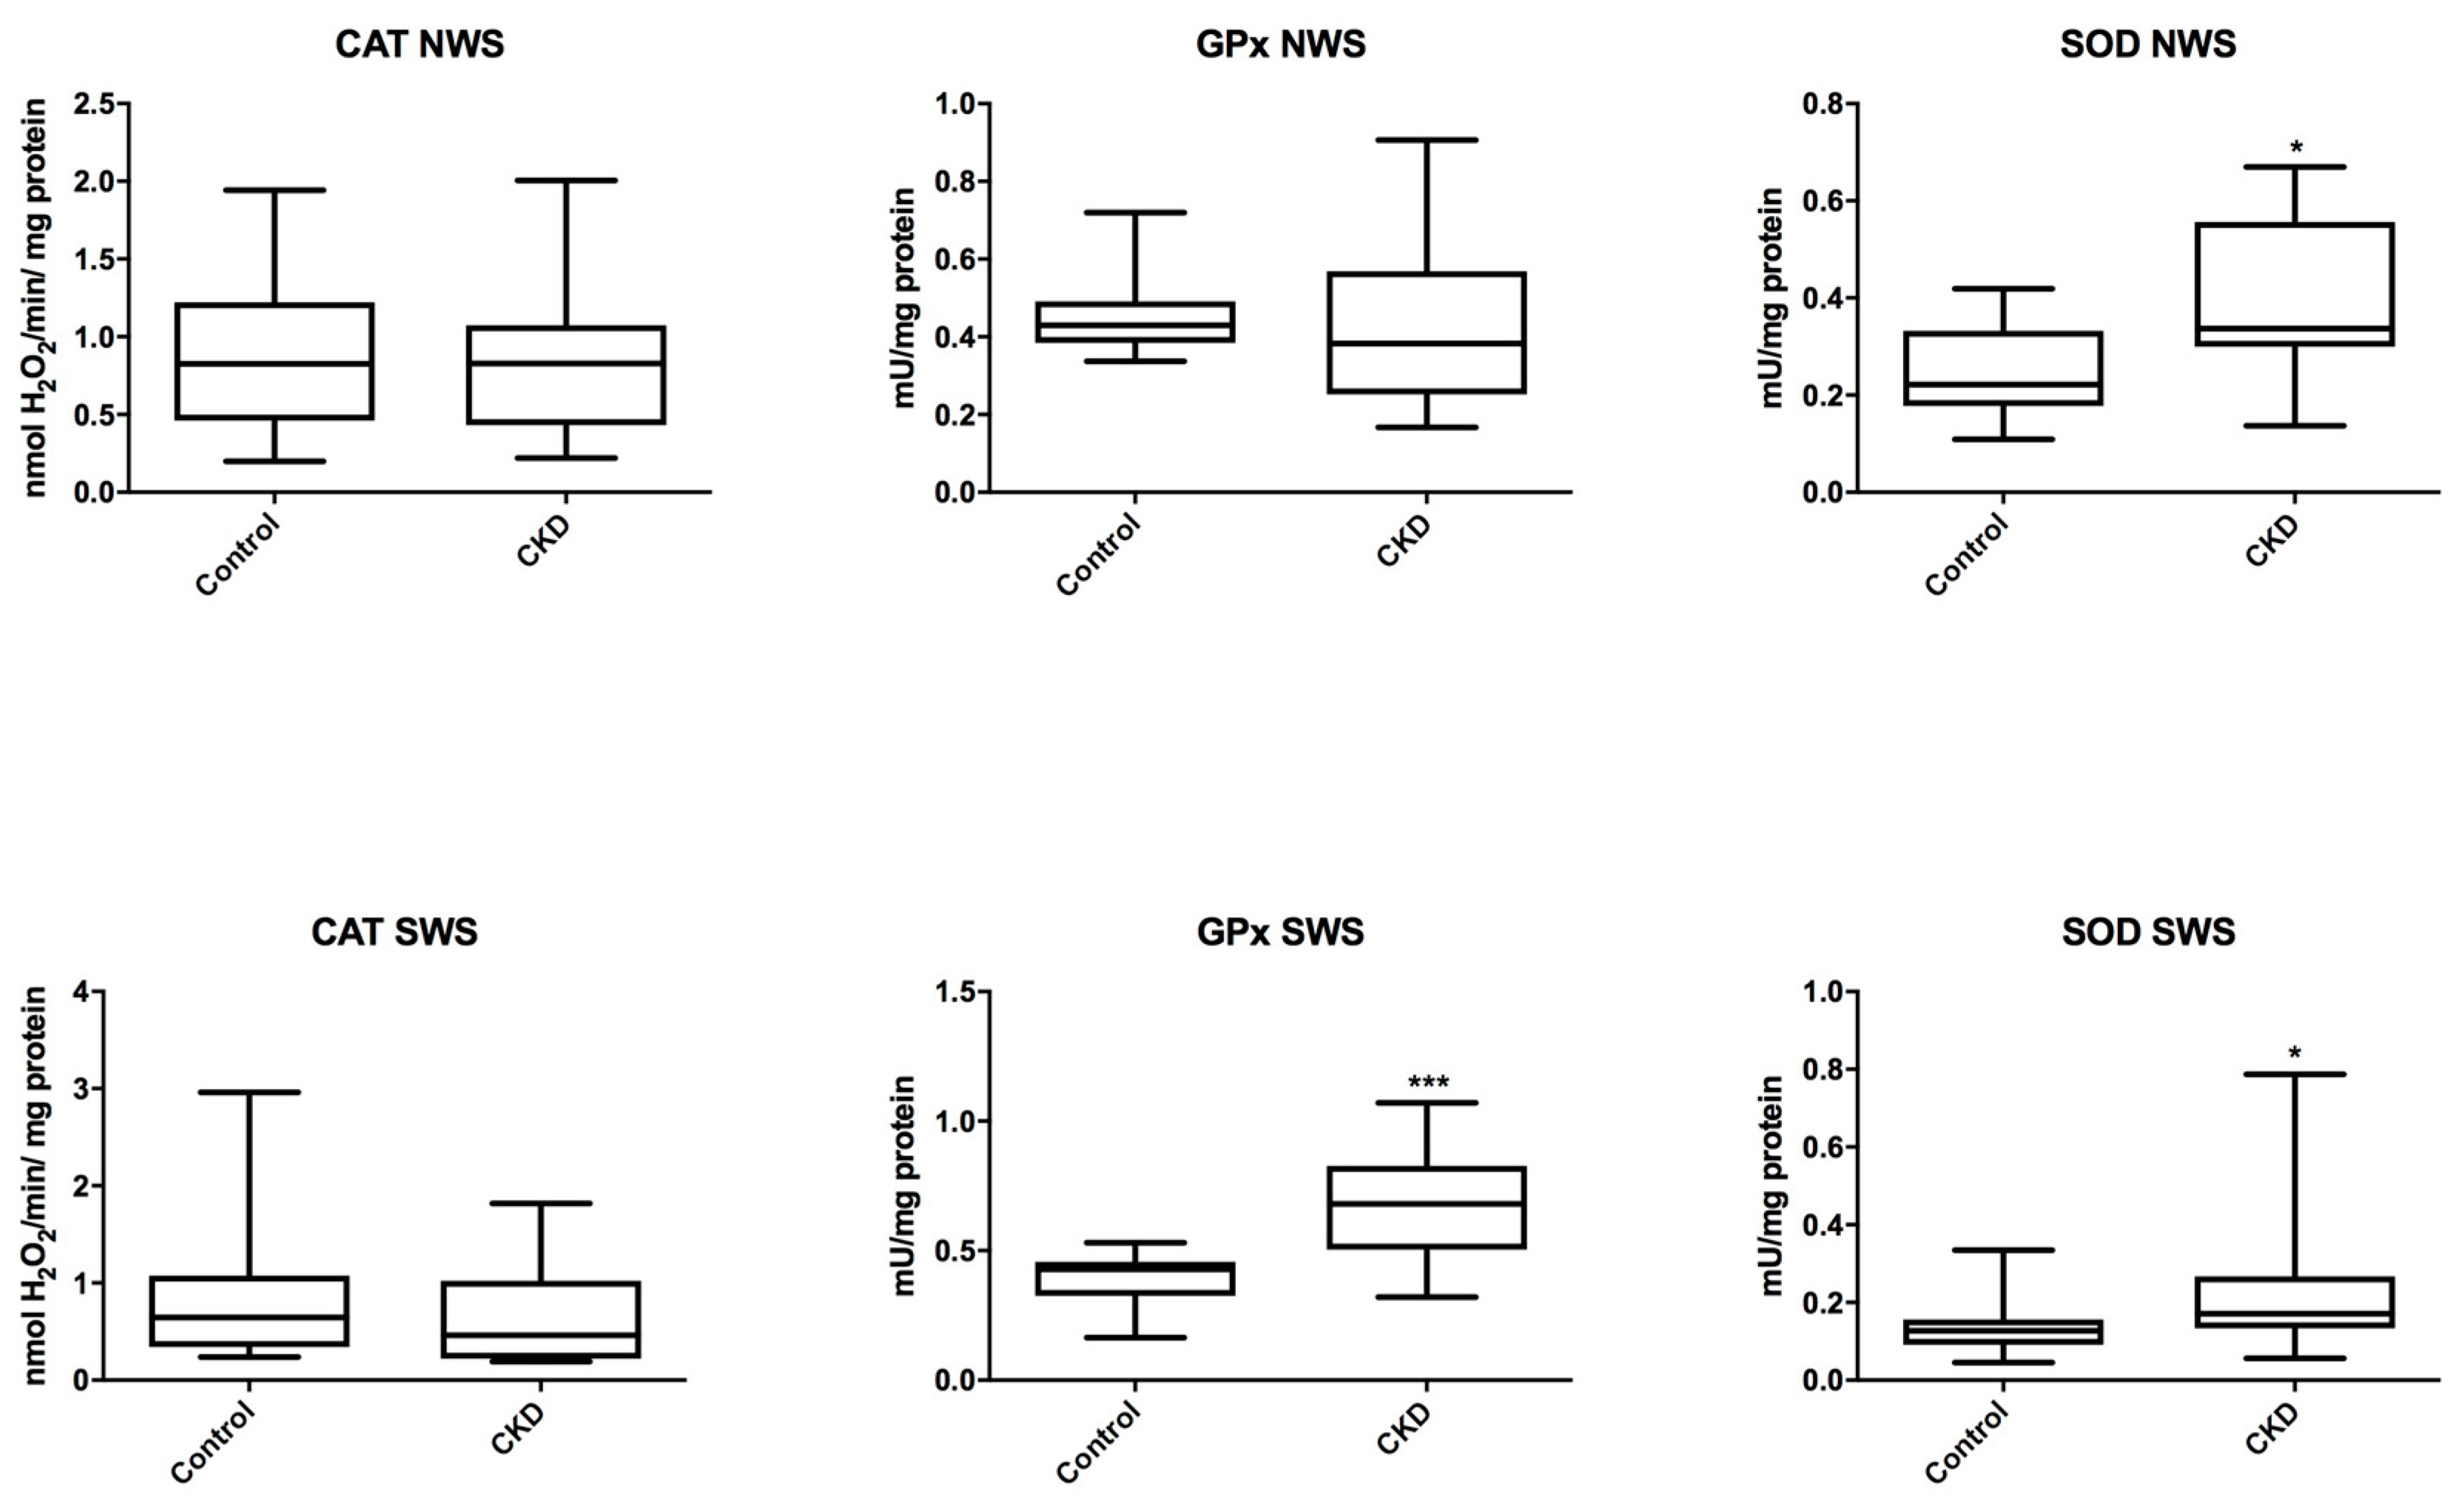
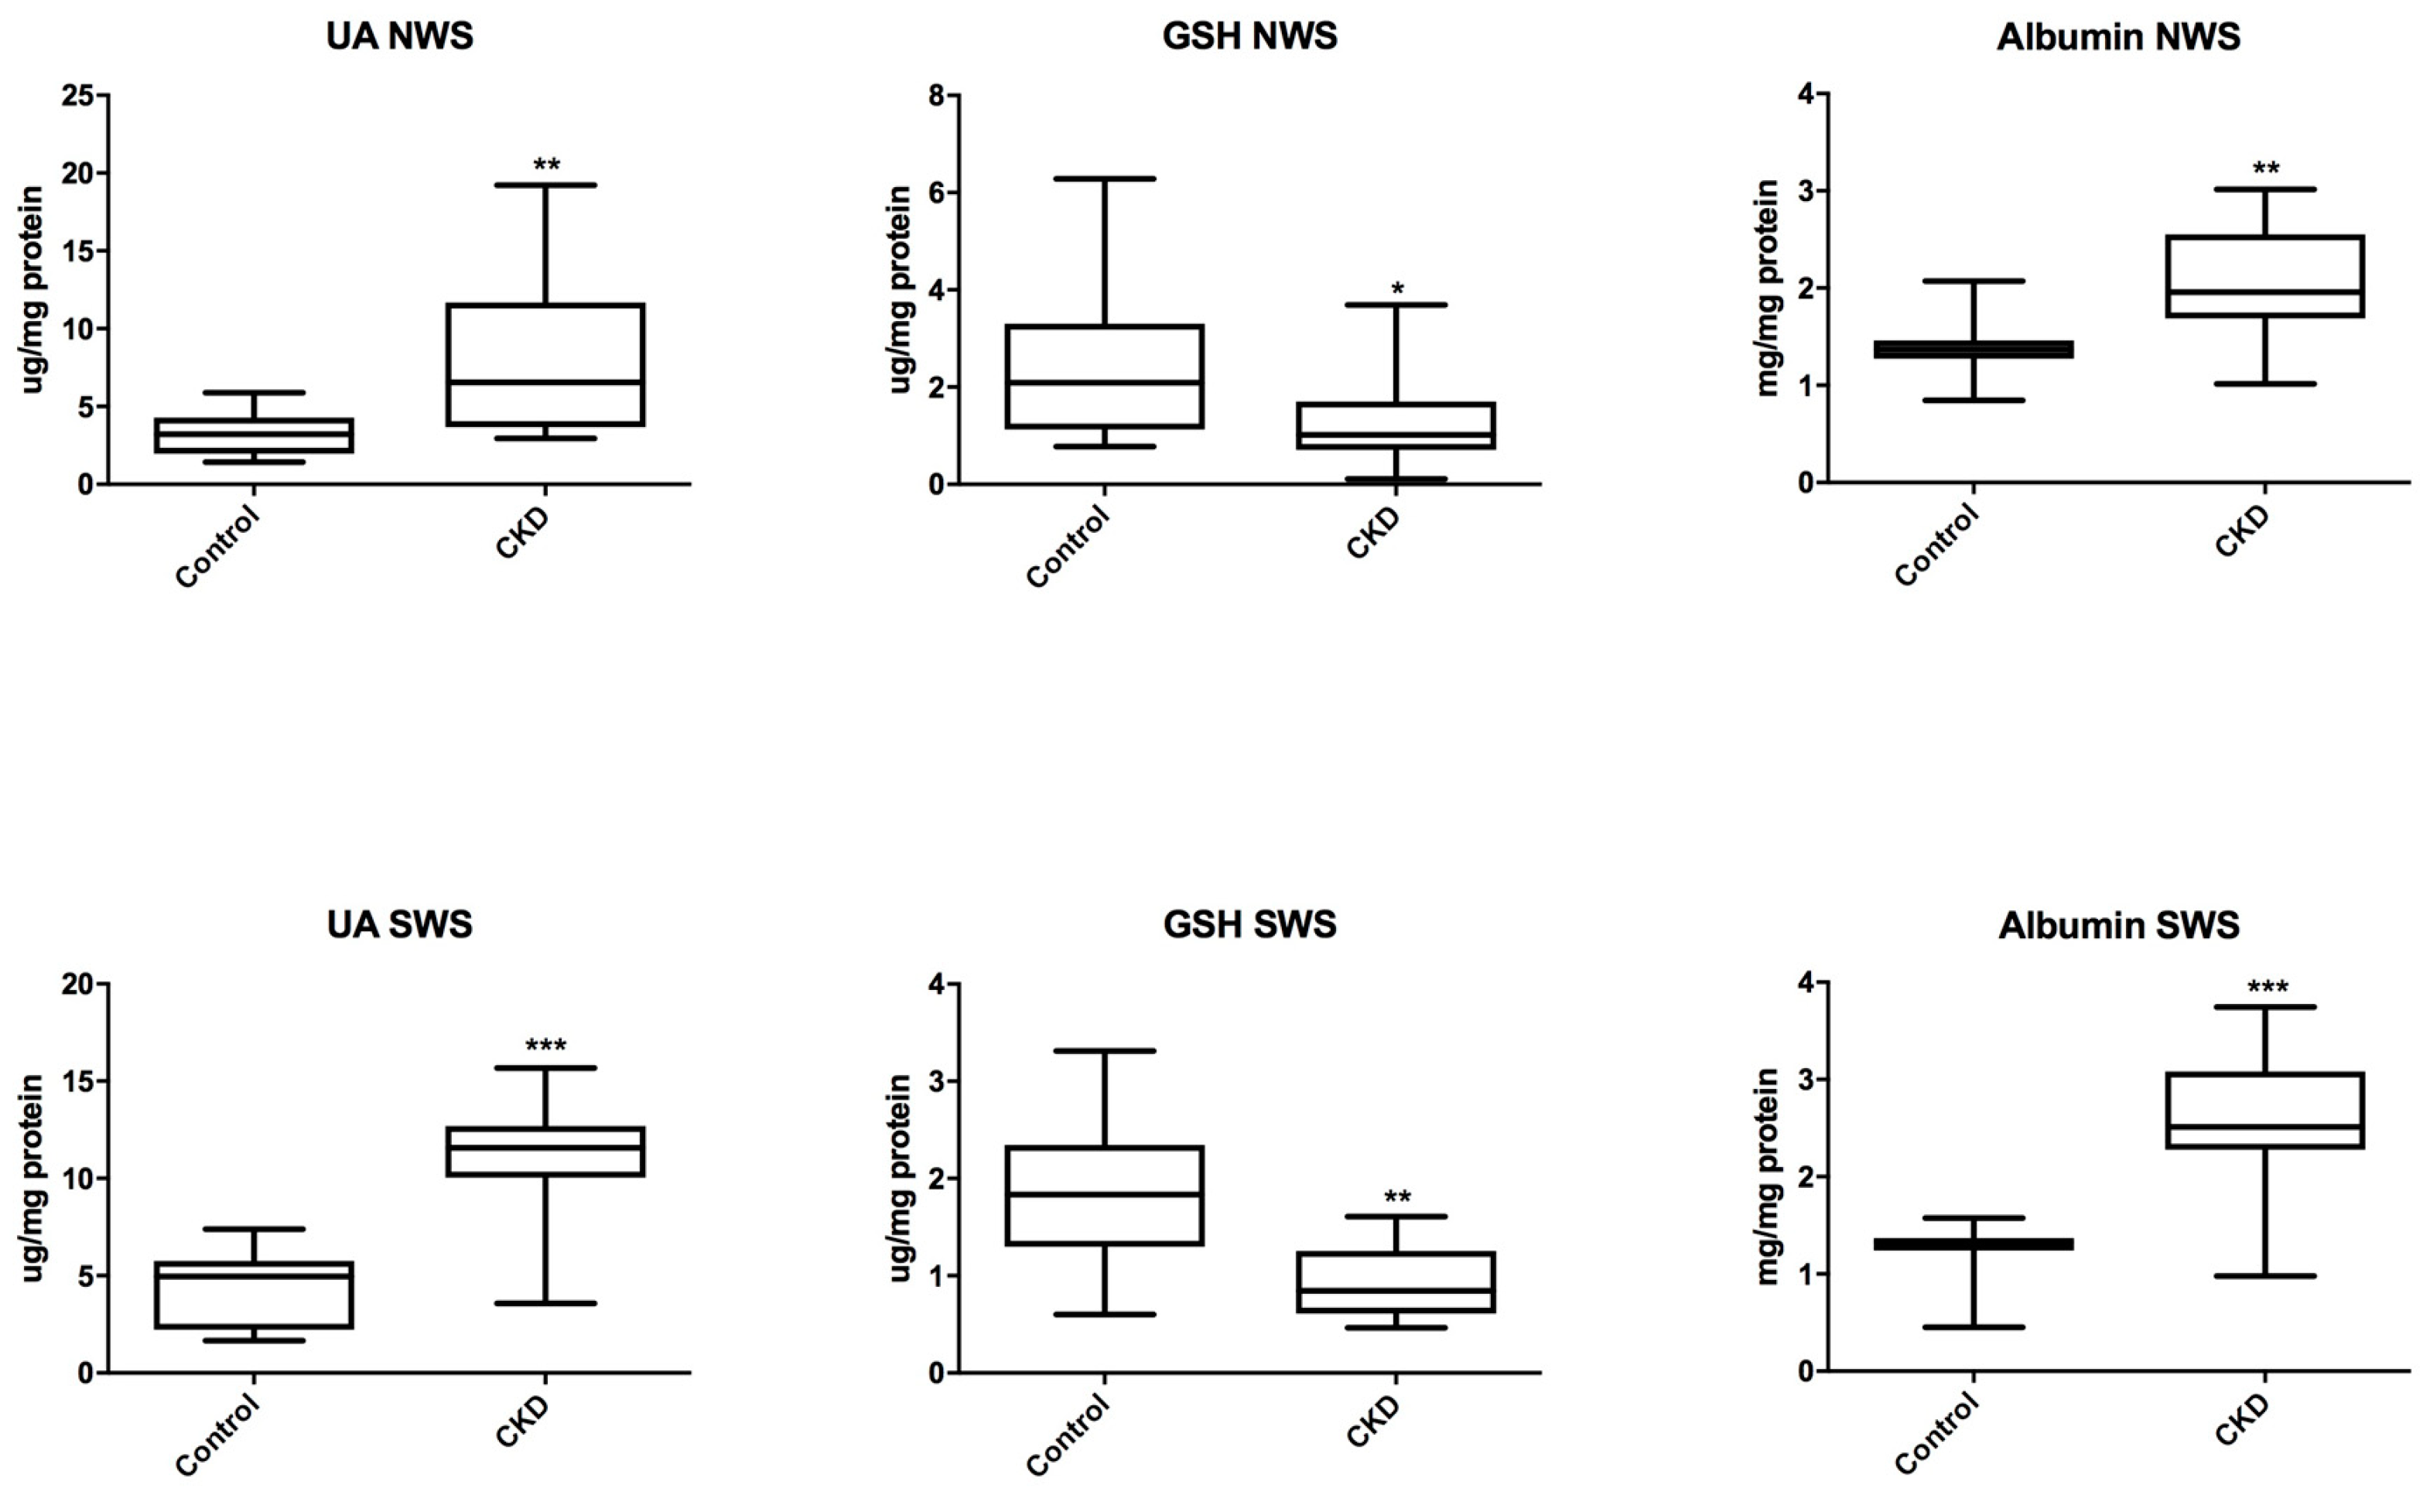
3.3. Salivary Antioxidants
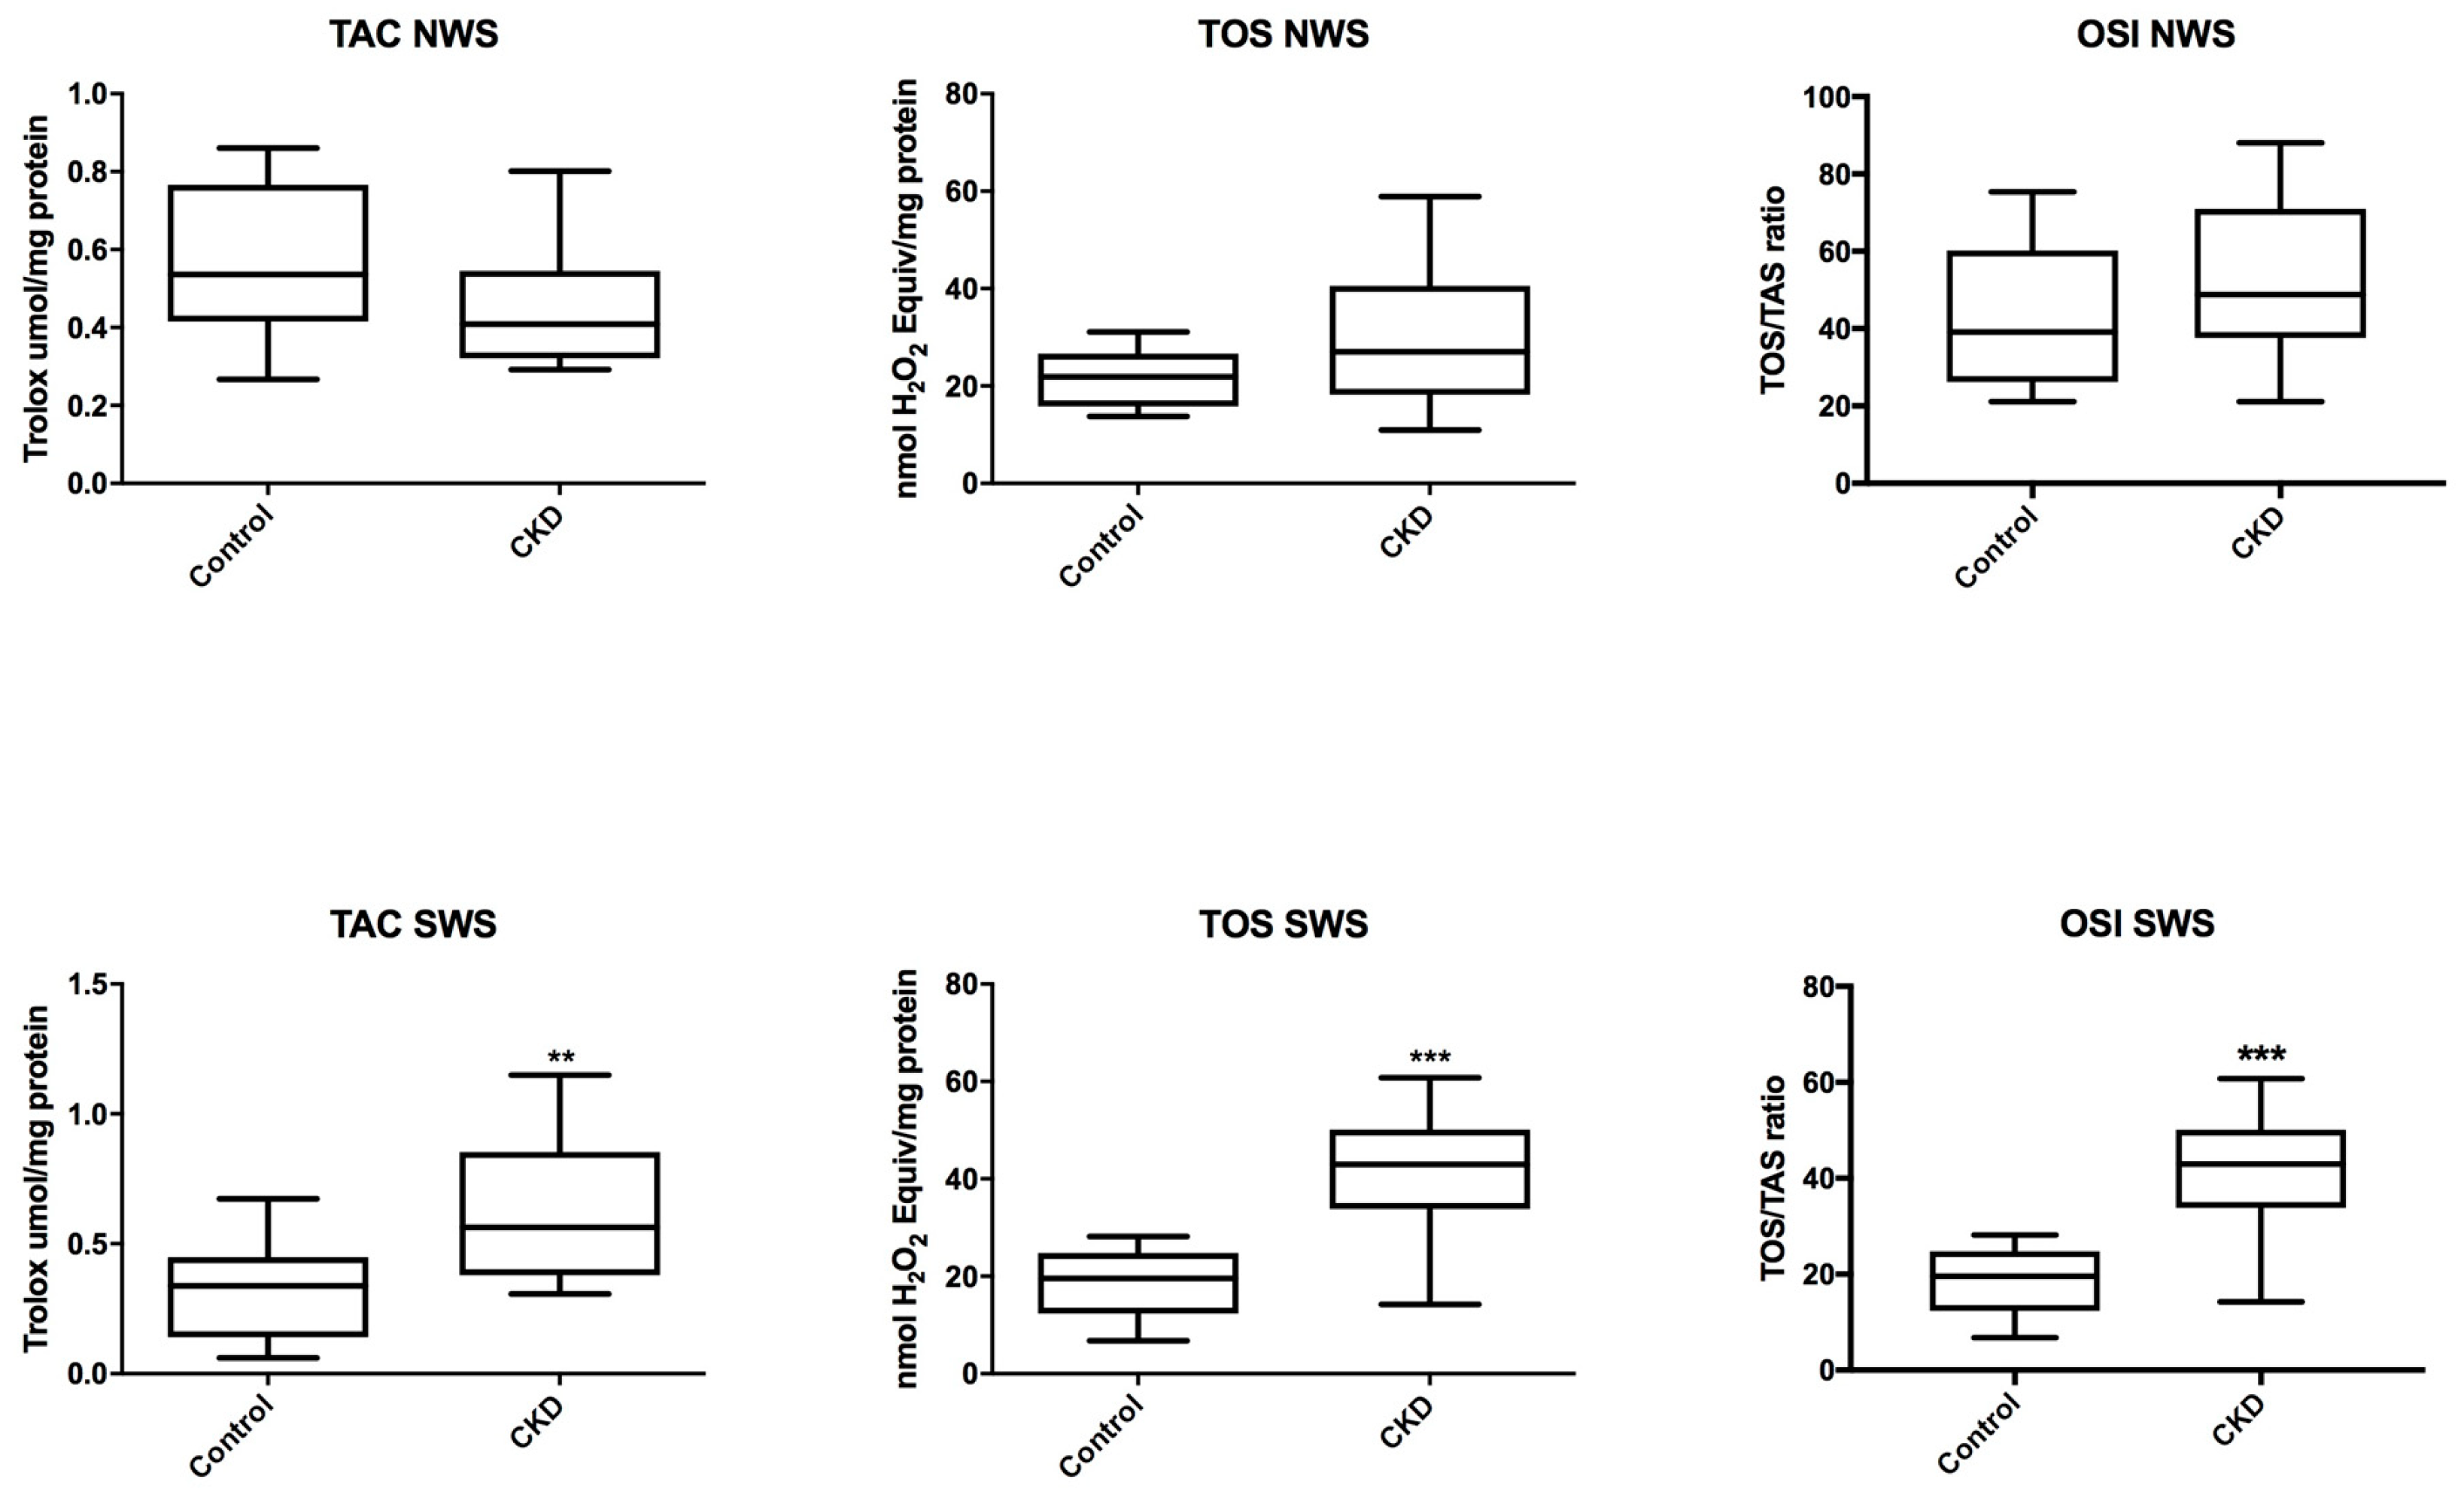
3.4. Total Antioxidant/Oxidant Status
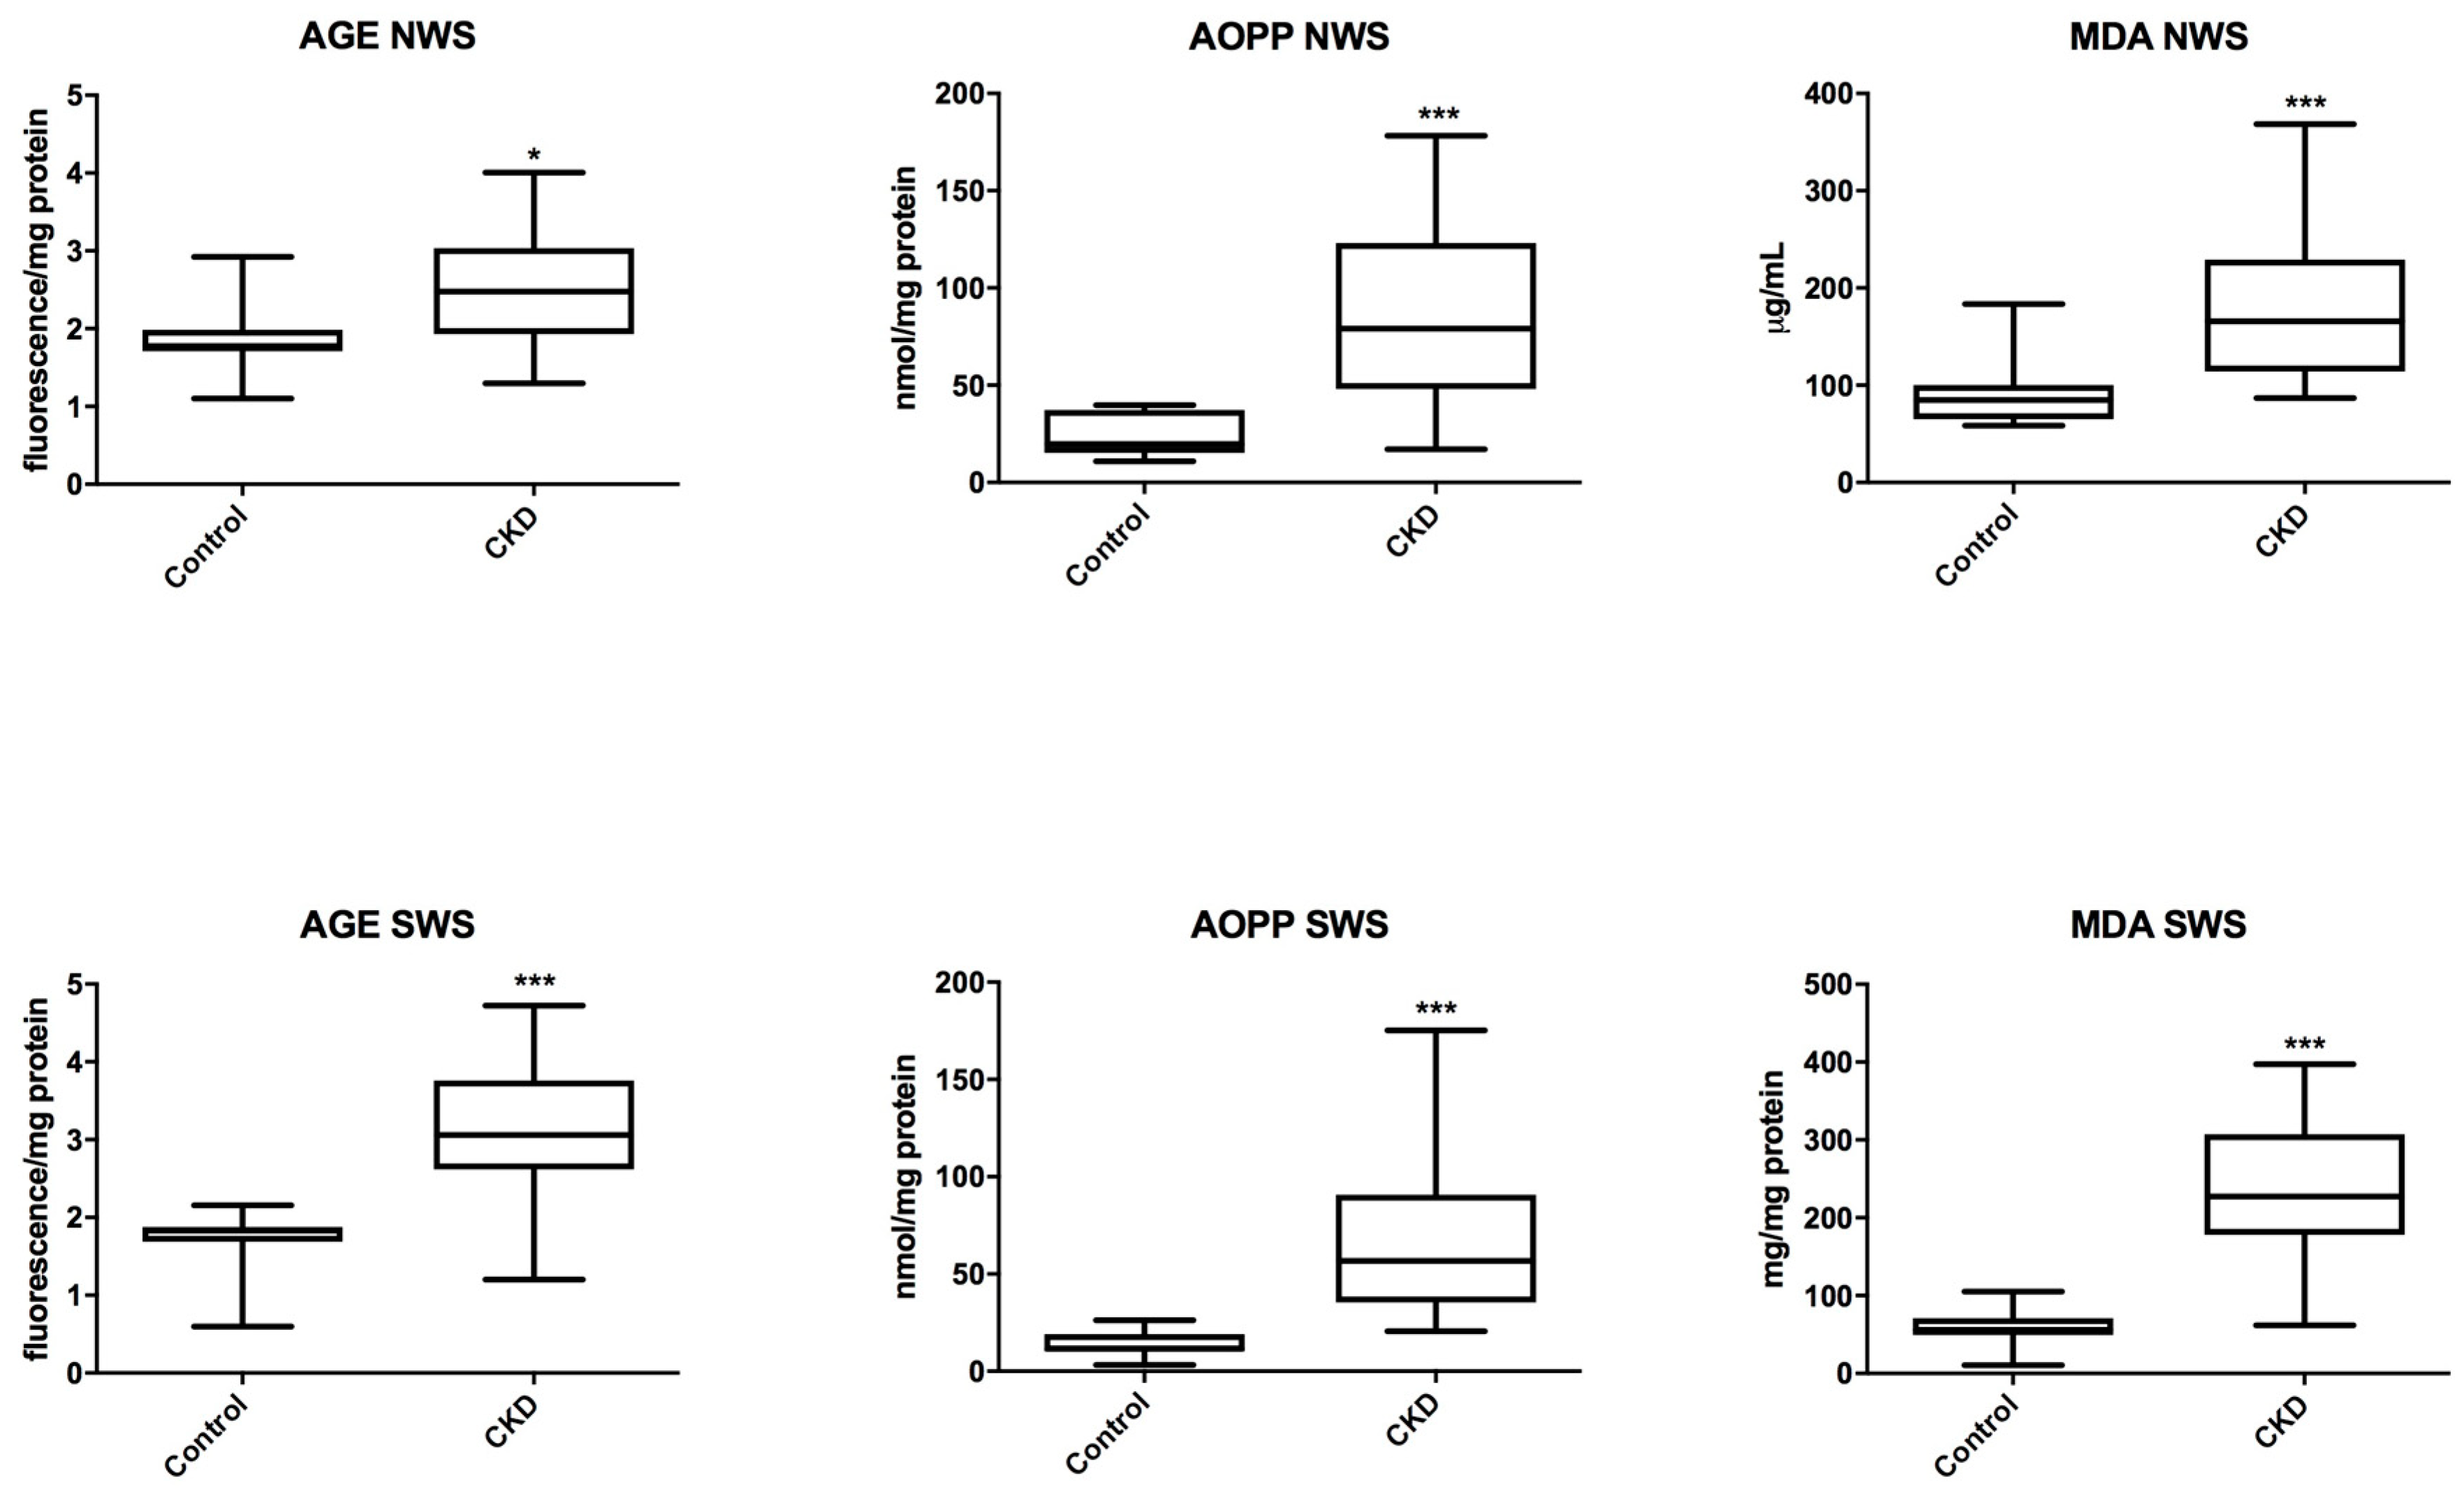
3.5. Oxidative Modification Products
3.6. Erythrocytes and Plasma Redox Markers
3.7. Correlations
3.8. ROC Analysis
4. Discussion
5. Conclusions
Author Contributions
Funding
Conflicts of Interest
References
- Hill, N.R.; Fatoba, S.T.; Oke, J.L.; Hirst, J.A.; O’Callaghan, C.A.; Lasserson, D.S.; Hobbs, F.D. Global Prevalence of Chronic Kidney Disease—A Systematic Review and Meta-Analysis. PLoS ONE 2016, 11, e0158765. [Google Scholar] [CrossRef] [PubMed]
- Schwartz, G.J.; Muñoz, A.; Schneider, M.F.; Mak, R.H.; Kaskel, F.; Warady, B.A.; Furth, S.L. New Equations to Estimate GFR in Children with CKD. J. Am. Soc. Nephrol. 2009, 20, 629–637. [Google Scholar] [CrossRef] [PubMed] [Green Version]
- Harambat, J.; Van Stralen, K.J.; Kim, J.J.; Tizard, E.J. Epidemiology of chronic kidney disease in children. Pediatr. Nephrol. 2012, 27, 363–373. [Google Scholar] [CrossRef] [PubMed]
- Sung, C.C.; Hsu, Y.C.; Chen, C.C.; Lin, Y.F.; Wu, C.C. Oxidative Stress and Nucleic Acid Oxidation in Patients with Chronic Kidney Disease. Oxid. Med. Cell. Longev. 2013, 2013, 1–15. [Google Scholar] [CrossRef] [PubMed]
- Nakanishi, T.; Kuragano, T.; Nanami, M.; Nagasawa, Y.; Hasuike, Y. Misdistribution of Iron and Oxidative Stress in Chronic Kidney Disease. Free Radic. Biol. Med. 2018. [Google Scholar] [CrossRef] [PubMed]
- Sureshbabu, A.; Ryter, S.W.; Choi, M.E. Oxidative stress and autophagy: Crucial modulators of kidney injury. Redox Biol. 2015, 4, 208–214. [Google Scholar] [CrossRef] [PubMed] [Green Version]
- Maciejczyk, M.; Mikoluc, B.; Pietrucha, B.; Heropolitanska-Pliszka, E.; Pac, M.; Motkowski, R.; Car, H. Oxidative stress, mitochondrial abnormalities and antioxidant defense in Ataxia-telangiectasia, Bloom syndrome and Nijmegen breakage syndrome. Redox Biol. 2017, 11, 375–383. [Google Scholar] [CrossRef] [PubMed]
- Borys, J.; Maciejczyk, M.; Krȩtowski, A.J.; Antonowicz, B.; Ratajczak-Wrona, W.; Jablonska, E.; Zaleski, P.; Waszkiel, D.; Ladny, J.R.; Zukowski, P.; et al. The redox balance in erythrocytes, plasma, and periosteum of patients with titanium fixation of the jaw. Front. Physiol. 2017, 8, 386. [Google Scholar] [CrossRef] [PubMed]
- Beetham, K.S.; Howden, E.J.; Small, D.M.; Briskey, D.R.; Rossi, M.; Isbel, N.; Coombes, J.S. Oxidative stress contributes to muscle atrophy in chronic kidney disease patients. Redox Rep. 2015, 20, 126–132. [Google Scholar] [CrossRef] [PubMed]
- Tothova, L.; Kamodyova, N.; Cervenka, T.; Celec, P. Salivary markers of oxidative stress in oral diseases. Front. Cell. Infect. Microbiol. 2015, 5, 73. [Google Scholar] [CrossRef] [PubMed]
- Wang, J.; Schipper, H.M.; Velly, A.M.; Mohit, S.; Gornitsky, M. Salivary biomarkers of oxidative stress: A critical review. Free Radic. Biol. Med. 2015, 85, 95–104. [Google Scholar] [CrossRef] [PubMed]
- Kołodziej, U.; Maciejczyk, M.; Niklińska, W.; Waszkiel, D.; Żendzian-Piotrowska, M.; Żukowski, P.; Zalewska, A. Chronic high-protein diet induces oxidative stress and alters the salivary gland function in rats. Arch. Oral Biol. 2017, 84, 6–12. [Google Scholar] [CrossRef] [PubMed]
- Knaś, M.; Maciejczyk, M.; Sawicka, K.; Hady, H.R.; Niczyporuk, M.; Ładny, J.R.; Matczuk, J.; Waszkiel, D.; Żendzian-Piotrowska, M.; Zalewska, A. Impact of morbid obesity and bariatric surgery on antioxidant/oxidant balance of the unstimulated and stimulated human saliva. J. Oral Pathol. Med. 2016, 45, 455–464. [Google Scholar] [CrossRef] [PubMed]
- Knaś, M.; Maciejczyk, M.; Daniszewska, I.; Klimiuk, A.; Matczuk, J.; Kołodziej, U.; Waszkiel, D.; Ładny, J.R.; Zendzian-Piotrowska, M.; Zalewska, A. Oxidative Damage to the Salivary Glands of Rats with Streptozotocin-Induced Diabetes-Temporal Study: Oxidative Stress and Diabetic Salivary Glands. J. Diabetes Res. 2016, 2016. [Google Scholar] [CrossRef] [PubMed]
- Choromańska, M.; Klimiuk, A.; Kostecka-Sochoń, P.; Wilczyńska, K.; Kwiatkowski, M.; Okuniewska, N.; Waszkiewicz, N.; Zalewska, A.; Maciejczyk, M. Antioxidant defence, oxidative stress and oxidative damage in saliva, plasma and erythrocytes of dementia patients. Can salivary AGE be a marker of dementia? Int. J. Mol. Sci. 2017, 18, 2205. [Google Scholar] [CrossRef] [PubMed]
- NIH. The Fourth Report on the Diagnosis, Evaluation, and Treatment of High Blood Pressure in Children and Adolescents. Natl. Institutes Heal. 2005, 05–5267, 1–60. [Google Scholar] [CrossRef]
- National Kidney Foundation. K/DOQI clinical practice guidelines for chronic kidney disease: Evaluation, classification, and stratification. Am. J. Kidney Dis. 2002, 39, 1–266. [Google Scholar]
- Fejfer, K.; Buczko, P.; Niczyporuk, M.; Ładny, J.R.; Hady, R.H.; Knaś, M.; Waszkiel, D.; Klimiuk, A.; Zalewska, A.; Maciejczyk, M. Oxidative Modification of Biomolecules in the Nonstimulated and Stimulated Saliva of Patients with Morbid Obesity Treated with Bariatric Surgery. Biomed Res. Int. 2017, 2017. [Google Scholar] [CrossRef] [PubMed]
- World Health Organization. Oral Health Surveys: Basic Methods, 5th ed.; World Health Organization: Geneva, Switzerland, 2013. [Google Scholar]
- Silness, J.; Löe, H. Periodontal disease in pregnancy II. Correlation between oral hygiene and periodontal condition. Acta Odontol. Scand. 1964, 22, 121–135. [Google Scholar] [CrossRef] [PubMed]
- Borys, J.; Maciejczyk, M.; Antonowicz, B.; Krętowski, A.; Waszkiel, D.; Bortnik, P.; Czarniecka-Bargłowska, K.; Kocisz, M.; Szulimowska, J.; Czajkowski, M.; et al. Exposure to Ti4Al4V Titanium Alloy Leads to Redox Abnormalities, Oxidative Stress, and Oxidative Damage in Patients Treated for Mandible Fractures. Oxid. Med. Cell. Longev. 2018, 10. [Google Scholar] [CrossRef] [PubMed]
- Aebi, H. Catalase in vitro. Meth. Enzymol. 1984, 105, 121–126. [Google Scholar] [PubMed]
- Mansson-Rahemtulla, B.; Baldone, D.C.; Pruitt, K.M.; Rahemtulla, F. Specific assays for peroxidases in human saliva. Arch. Oral Biol. 1986, 31, 661–668. [Google Scholar] [CrossRef]
- Misra, H.P.; Fridovich, I. The role of superoxide anion in the autoxidation of epinephrine and a simple assay for superoxide dismutase. J. Biol. Chem. 1972, 247, 3170–3175. [Google Scholar] [PubMed]
- Griffith, O.W. Determination of glutathione and glutathione disulfide using glutathione reductase and 2-vinylpyridine. Anal. Biochem. 1980, 106, 207–212. [Google Scholar] [CrossRef]
- Doumas, B.T.; Watson, W.A.; Biggs, H.G. Albumin standards and the measurement of serum albumin with bromcresol green. Clin. Chim. Acta 1971, 31, 87–96. [Google Scholar] [CrossRef]
- Erel, O. A novel automated direct measurement method for total antioxidant capacity using a new generation, more stable ABTS radical cation. Clin. Biochem. 2004, 37, 277–285. [Google Scholar] [CrossRef] [PubMed]
- Erel, O. A new automated colorimetric method for measuring total oxidant status. Clin. Biochem. 2005, 38, 1103–1111. [Google Scholar] [CrossRef] [PubMed]
- Kalousová, M.; Skrha, J.; Zima, T. Advanced glycation end-products and advanced oxidation protein products in patients with diabetes mellitus. Physiol. Res. 2002, 51, 597–604. [Google Scholar] [PubMed]
- Buege, J.A.; Aust, S.D. Microsomal lipid peroxidation. Methods Enzymol. 1978, 52, 302–310. [Google Scholar] [PubMed]
- Kolodziej, U.; Maciejczyk, M.; Miasko, A.; Matczuk, J.; Knas, M.; Zukowski, P.; Zendzian-Piotrowska, M.; Borys, J.; Zalewska, A. Oxidative modification in the salivary glands of high fat-diet induced insulin resistant rats. Front. Physiol. 2017, 8, 20. [Google Scholar] [CrossRef] [PubMed]
- Maciejczyk, M.; Kossakowska, A.; Szulimowska, J.; Klimiuk, A.; Knaś, M.; Car, H.; Niklińska, W.; Ładny, J.R.; Chabowski, A.; Zalewska, A. Lysosomal Exoglycosidase Profile and Secretory Function in the Salivary Glands of Rats with Streptozotocin-Induced Diabetes. J. Diabetes Res. 2017, 2017. [Google Scholar] [CrossRef] [PubMed]
- Zalewska, A.; Knaś, M.; Maciejczyk, M.; Waszkiewicz, N.; Klimiuk, A.; Choromańska, M.; Matczuk, J.; Waszkiel, D.; Car, H. Antioxidant profile, carbonyl and lipid oxidation markers in the parotid and submandibular glands of rats in different periods of streptozotocin induced diabetes. Arch. Oral Biol. 2015, 60, 1375–1386. [Google Scholar] [CrossRef] [PubMed]
- Zhang, C.Z.; Cheng, X.Q.; Li, J.Y.; Zhang, P.; Yi, P.; Xu, X.; Zhou, X.D. Saliva in the diagnosis of diseases. Int. J. Oral Sci. 2016, 8, 133–137. [Google Scholar] [CrossRef] [PubMed] [Green Version]
- Witko-Sarsat, V.; Friedlander, M.; Capeillère-Blandin, C.; Nguyen-Khoa, T.; Nguyen, A.T.; Zingraff, J.; Jungers, P.; Descamps-Latscha, B. Advanced oxidation protein products as a novel marker of oxidative stress in uremia. Kidney Int. 1996, 49, 1304–1313. [Google Scholar] [CrossRef] [PubMed]
- Falkowski, M.; Maciejczyk, M.; Koprowicz, T.; Mikołuć, B.; Milewska, A.; Zalewska, A.; Car, H. Whey Protein Concentrate WPC-80 Improves Antioxidant Defense Systems in the Salivary Glands of 14-Month Wistar Rats. Nutrients 2018, 10, 782. [Google Scholar] [CrossRef] [PubMed]
- Gersch, C.; Palii, S.P.; Imaram, W.; Kim, K.M.; Karumanchi, S.A.; Angerhofer, A.; Johnson, R.J.; Henderson, G.N. Reactions of peroxynitrite with uric acid: Formation of reactive intermediates, alkylated products and triuret, and in vivo production of triuret under conditions of oxidative stress. Nucleos. Nucleot. Nucl. 2009, 28, 118–149. [Google Scholar] [CrossRef] [PubMed]
- Sautin, Y.Y.; Johnson, R.J. Uric acid: The oxidant-antioxidant paradox. Nucleos. Nucleot. Nucl. 2008, 27, 608–619. [Google Scholar] [CrossRef] [PubMed]
- Lytvyn, Y.; Perkins, B.A.; Cherney, D.Z.I. Uric Acid as a Biomarker and a Therapeutic Target in Diabetes. Can. J. Diabetes 2015, 39, 239–246. [Google Scholar] [CrossRef] [PubMed]
- Kang, D.H.; Nakagawa, T. Uric acid and chronic renal disease: Possible implication of hyperuricemia on progression of renal disease. Semin. Nephrol. 2005, 25, 43–49. [Google Scholar] [CrossRef] [PubMed]
- Giordano, C.; Karasik, O.; King-Morris, K.; Asmar, A. Uric Acid as a Marker of Kidney Disease: Review of the Current Literature. Dis. Markers 2015, 2015. [Google Scholar] [CrossRef] [PubMed]
- Kim, I.Y.; Lee, D.W.; Lee, S.B.; Kwak, I.S. The role of uric acid in kidney fibrosis: Experimental evidences for the causal relationship. Biomed Res. Int. 2014, 2014. [Google Scholar] [CrossRef] [PubMed]
- Tsai, C.W.; Lin, S.Y.; Kuo, C.C.; Huang, C.C. Serum Uric Acid and Progression of Kidney Disease: A Longitudinal Analysis and Mini-Review. PLoS ONE 2017, 12, e0170393. [Google Scholar] [CrossRef] [PubMed]
- Feng, W.; Zhang, K.; Liu, Y.; Chen, J.; Cai, Q.; He, W.H.; Zhang, Y.; Wang, M.H.; Wang, J.; Huang, H. Advanced oxidation protein products aggravate cardiac remodeling via cardiomyocyte apoptosis in chronic kidney disease. Am. J. Physiol. Heart Circ. Physiol. 2017, 314, 475–483. [Google Scholar] [CrossRef] [PubMed]
- Li, H.Y.; Hou, F.F.; Zhang, X.; Chen, P.Y.; Liu, S.X.; Feng, J.X.; Liu, Z.Q.; Shan, Y.X.; Wang, G.B.; Zhou, Z.M.; et al. Advanced Oxidation Protein Products Accelerate Renal Fibrosis in a Remnant Kidney Model. J. Am. Soc. Nephrol. 2007, 18, 528–538. [Google Scholar] [CrossRef] [PubMed] [Green Version]
- Liu, Y. Advanced oxidation protein products: A causative link between oxidative stress and podocyte depletion. Kidney Int. 2009, 76, 1125–1127. [Google Scholar] [CrossRef] [PubMed]
- Zhou, L.L.; Hou, F.F.; Wang, G.B.; Yang, F.; Xie, D.; Wang, Y.P.; Tian, J.W. Accumulation of advanced oxidation protein products induces podocyte apoptosis and deletion through NADPH-dependent mechanisms. Kidney Int. 2009, 76, 1148–1160. [Google Scholar] [CrossRef] [PubMed]
- Ott, C.; Jacobs, K.; Haucke, E.; Navarrete Santos, A.; Grune, T.; Simm, A. Role of advanced glycation end products in cellular signaling. Redox Biol. 2014, 2, 411–429. [Google Scholar] [CrossRef] [PubMed]
- Zhou, L.L.; Cao, W.; Xie, C.; Tian, J.; Zhou, Z.; Zhou, Q.; Zhu, P.; Li, A.; Liu, Y.; Miyata, T.; et al. The receptor of advanced glycation end products plays a central role in advanced oxidation protein products-induced podocyte apoptosis. Kidney Int. 2012, 82, 759–770. [Google Scholar] [CrossRef] [PubMed] [Green Version]
- Wolff, A.; Stark, H.; Sarnat, H.; Binderman, I.; Eisenstein, B.; Drukker, A. The dental status of children with chronic renal failure. Int. J. Pediatr. Nephrol. 1985, 6, 127–132. [Google Scholar] [PubMed]

| Patient Characteristic | Stage 1 | Stage 2 | Stage 3 | Stage 4 | Stage 5 | All CKD Patients | Control Group | |
|---|---|---|---|---|---|---|---|---|
| Sex | Male n | 1 | 5 | 5 | 2 | 4 | 17 | 17 |
| Female n | 2 | 3 | 2 | 1 | 1 | 9 | 9 | |
| Age | 16.75 (9.25–17.75) | 14.03 (9.25–18.00) | 11.50 (7.25–15.50) | 13.00 (9.25–14.50) | 10.50 (6.50–17.80) | 12.90 (6.50–18.00) | 12.90 (6.50–18.00) | |
| Weight (kg) | 53.00 (36.80–59.00) | 51.25 (23.90–75.00) | 34.00 (25.50–49.50) | 22.70 (22.00–39.00) | 26.00 (19.30–60.00) | 34.30 (19.30–75.00) | 37.30 (19.00–71.00) | |
| Height (cm) | 161.50 (135.50–166.00) | 154.50 (126.00–168.00) | 131.50 (114.50–163.00) | 129.00 (125.00–150.00) | 130.00 (102.00–164.00) | 136.80 (102.00–168.00) | 135.20 (100.00–173.00) | |
| Systolic BP (mmHg) | 112.00 (97.00–136.00) | 116.50 (101.00–140.00) | 117.00 (96.00–125.00) | 112.00 (109.00–116.00) | 111.00 (108.00–139.00) | 114.00 (96.00–140.00) | 106.00 (100.00–120.00) | |
| Diastolic BP (mmHg) | 68.00 (63.00–80.00) | 67.00 (56.00–80.00) | 73.00 (60.00–77.00) | 75.00 (74.00–77.00) | 80.00 (64.00–94.00) | 73.50 (56.00–94.00) | 69.00 (55.00–77.00) | |
| Hypertension n | 1 | 1 | 2 | 1 | 3 | 8 | 0 | |
| Dialysis n | 0 | 0 | 0 | 1 | 5 | 6 | 0 | |
| Albuminuria (mg/24 h) | 9.15 (8.71–10.62) | 11.18 (8.40–135.10) | 238.50 (150.20–310.90) | 345.50 (238.50–626.40) | 1002.00 (750.20–1576.00) | 150.20 (8.40–1576.00) * | 7.15 (5.15–9.23) | |
| Proteinuria (mg/24 h) | 91.50 (84.00–99.00) | 191.50 (99.00–1109.00) | 123.70 (48.30–1886.00) | 1172.00 (686.00–1411.00) | 1428.00 (1172.00–1882.00) | 192.50 (48.30–1886.00) * | 55.50 (25.15–89.00) | |
| eGFR (mL/min/1.73 m2) | 113.90 (93.20–172.70) | 76.50 (64.18–89.40) | 41.60 (27.90–52.20) | 15.30 (15.50–17.90) | 11.60 (10.50–13.90) | 51.39 (10.50–172.70) * | 120.00 (110.00–180.00) | |
| Serum Cr (mg/dL) | 0.95 (0.43–1.02) | 0.97 (0.75–1.66) | 1.66 (1.22–2.66) | 4.03 (2.66–4.11) | 7.23 (6.16–8.93) | 1.59 (1.43–8.93) * | 0.55 (0.30–0.65) | |
| Serum Urea (mg/dL) | 29.00 (18.00–54.00) | 51.50 (26.00–130.00) | 58.00 (26.00–141.00) | 114.00 (93.00–141.00) | 157.00 (108.00–192.00) | 62.50 (18.00–192.00) * | 15.00 (13.50–36.00) | |
| Hemoglobin (g/dL) | 13.00 (11.70–16.10) | 13.55 (10.60–16.70) | 11.50 (10.60–15.70) | 10.50 (10.40–10.90) | 11.70 (9.20–13.00) | 11.70 (9.20–16.70) | 14.10 (13.20–15.00) | |
| Hematocrit (%) | 38.00 (36.60–47.50) | 38.00 (31.50–48.70) | 36.20 (29.70–40.80) | 31.00 (35.50–31.70) | 35.30 (26.00–38.70) | 36.35 (26.00–48.70) | 39.00 (35.5–45.00) | |
| Iron (µg/dL) | 28.50 (22.00–35.00) | 84.00 (22.00–132.00) | 57.00 (40.00–105.00) | 82.00 (80.00–90.00) | 89.00 (67.00–161.00) | 82.00 (22.00–161.00) | 79.00 (43.00–154.00) | |
| Ferritin (ng/mL) | 32.55 (25.00–40.10) | 40.10 (26.32–264.80) | 63.12 (11.63–291.60) | 291.60 (12.84–332.60) | 320.20 (33.12–386.70) | 53.26 (11.63–386.70) * | 25.5 (17.00–34.00) | |
| ALP (U/L) | 67.00 (64.00–197.00) | 201.00 (64.00–346.00) | 188.50 (124.00–284.00) | 160.00 (72.00–487.00) | 196.00 (106.00–531.00) | 188.50 (64.00–531.00) * | 45.5 (20.00–85.00) | |
| Ca2+ (mmol/L) | 2.47 (2.41–2.61) | 2.40 (1.95–2.61) | 2.45 (2.18–264) | 2.35 (2.34–2.40) | 2.48 (2.30–2.67) | 2.41 (1.95–2.67) | 2.30 (2.20–2.55) | |
| PTH (pg/mL) | 36.10 (33.40–64.20) | 47.00 (24.30–117.00) | 50.90 (34.10–123.80) | 34.70 (24.10–125.50) | 84.00 (27.00–121.00) | 52.90 (24.10–125.50) * | 36.00 (8.52–51.50) | |
| Drugs | iron n | 1 | 1 | 2 | 1 | 2 | 7 | 0 |
| loop diuretics n | 0 | 2 | 2 | 2 | 3 | 9 | 0 | |
| ACEI n | 1 | 1 | 2 | 1 | 2 | 7 | 0 | |
| β-blockers n | 0 | 1 | 1 | 1 | 2 | 5 | 0 | |
| CCB n | 0 | 0 | 0 | 0 | 1 | 1 | 0 | |
| Characteristic | Control n = 25 | CKD n = 25 |
|---|---|---|
| DMFT | 4.00 (0.00–6.00) | 4.00 (0.00–8.00) |
| SBI | 0.00 (0.00–0.05) | 0.00 (0.00–0.05) |
| GI | 0.00 (0.00–0.05) | 0.00 (0.00–0.05) |
| API | 5.00 (10.00–18.00) | 6.00 (12.00–19.00) |
| Parameter | NWS | SWS | ||
|---|---|---|---|---|
| Control n = 25 | Study Group n = 25 | Control n = 25 | Study Group n = 25 | |
| Salivary flow (μL/min) | 0.43 (0.33–0.33) | 0.25 (0.10–0.50) * | 1.40 (1.00–1.90) | 0.80 (0.20–1.60) * |
| Total protein (μg/mL) | 1759.00 (1103.00–2753.00) | 1248.00 (797.70–2768.00) | 1741.00 (1482.00–3193.00) | 1001.00 (654.70–2477.00) * |
| Salivary amylase (μmol/mg protein) | 0.23 (0.16–0.41) | 0.07 (0.02–0.17) * | 0.25 (0.12–0.81) | 0.20 (0.07–0.47) * |
| Salivary pH | 7.56 (7.12–7.94) | 7.77 (7.32–8.21) | 7.22 (6.26–7.90) | 7.40 (5.35–8.18) |
| Parameter | Control | CKD | P |
|---|---|---|---|
| Non-enzymatic antioxidants | |||
| UA (μg/mg protein) | 0.52 (0.27–1.39) | 5.05 (3.80–6.92) | <0.0001 |
| GSH (μg/mg protein) | 3.67 (2.01–5.77) | 1.23 (0.37–4.12) | 0.0056 |
| Albumin (mg/mg protein) | 2.19 (1.03–3.26) | 2.71 (2.06–4.50) | 0.0241 |
| Enzymatic antioxidants | |||
| CAT (nmol H2O2/min/mg protein) | 0.28 (0.04–0.66) | 0.24 (0.05–0.87) | 0.8032 |
| Px (mU/mg protein) | 0.28 (0.22–0.44) | 0.32 (0.26–0.65) | 0.1101 |
| SOD (mU/mg protein) | 0.05 (0.02–0.13) | 0.09 (0.02–0.12) | 0.0235 |
| Total antioxidant/oxidant status | |||
| TAC (Trolox μmol/mg protein) | 0.11 (0.01–0.44) | 0.35 (0.03–1.52) | 0.0012 |
| TOS (nmol H2O2Equiv/mg protein) | 9.99 (4.54–21.82) | 13.98 (6.76–25.04) | 0.2703 |
| OSI (TOS/TAC ratio) | 33.97 (13.15–405.8) | 81.67 (22.16–389.2) | 0.0122 |
| Oxidative damage products | |||
| AGE (fluorescence/mg protein) | 0.74 (0.36–1.13) | 1.23 (0.73–1.90) | <0.0001 |
| AOPP (nmol/mg protein) | 5.26 (2.68–12.17) | 10.50 (6.49–19.83) | <0.0001 |
| MDA (μmol/mg protein) | 207.20 (109.30–327.00) | 267.40 (151.00–611.20) | 0.0387 |
| Pair of Variable | r | P |
|---|---|---|
| NWS GSH & Albuminuria | 0.872 | 0.011 |
| NWS GSH & Serum Urea | 0.600 | 0.018 |
| NWS AOPP & eGFR | −0.646 | 0.007 |
| SWS UA & eGFR | −0.567 | 0.018 |
| SWS UA & Proteinuria | 0.576 | 0.015 |
| SWS UA & ALP | 0.632 | 0.010 |
| SWS Albumin & eGFR | −0.552 | 0.027 |
| SWS Albumin & Proteinuria | 0.625 | 0.010 |
| SWS MDA & PTH | −0.554 | 0.023 |
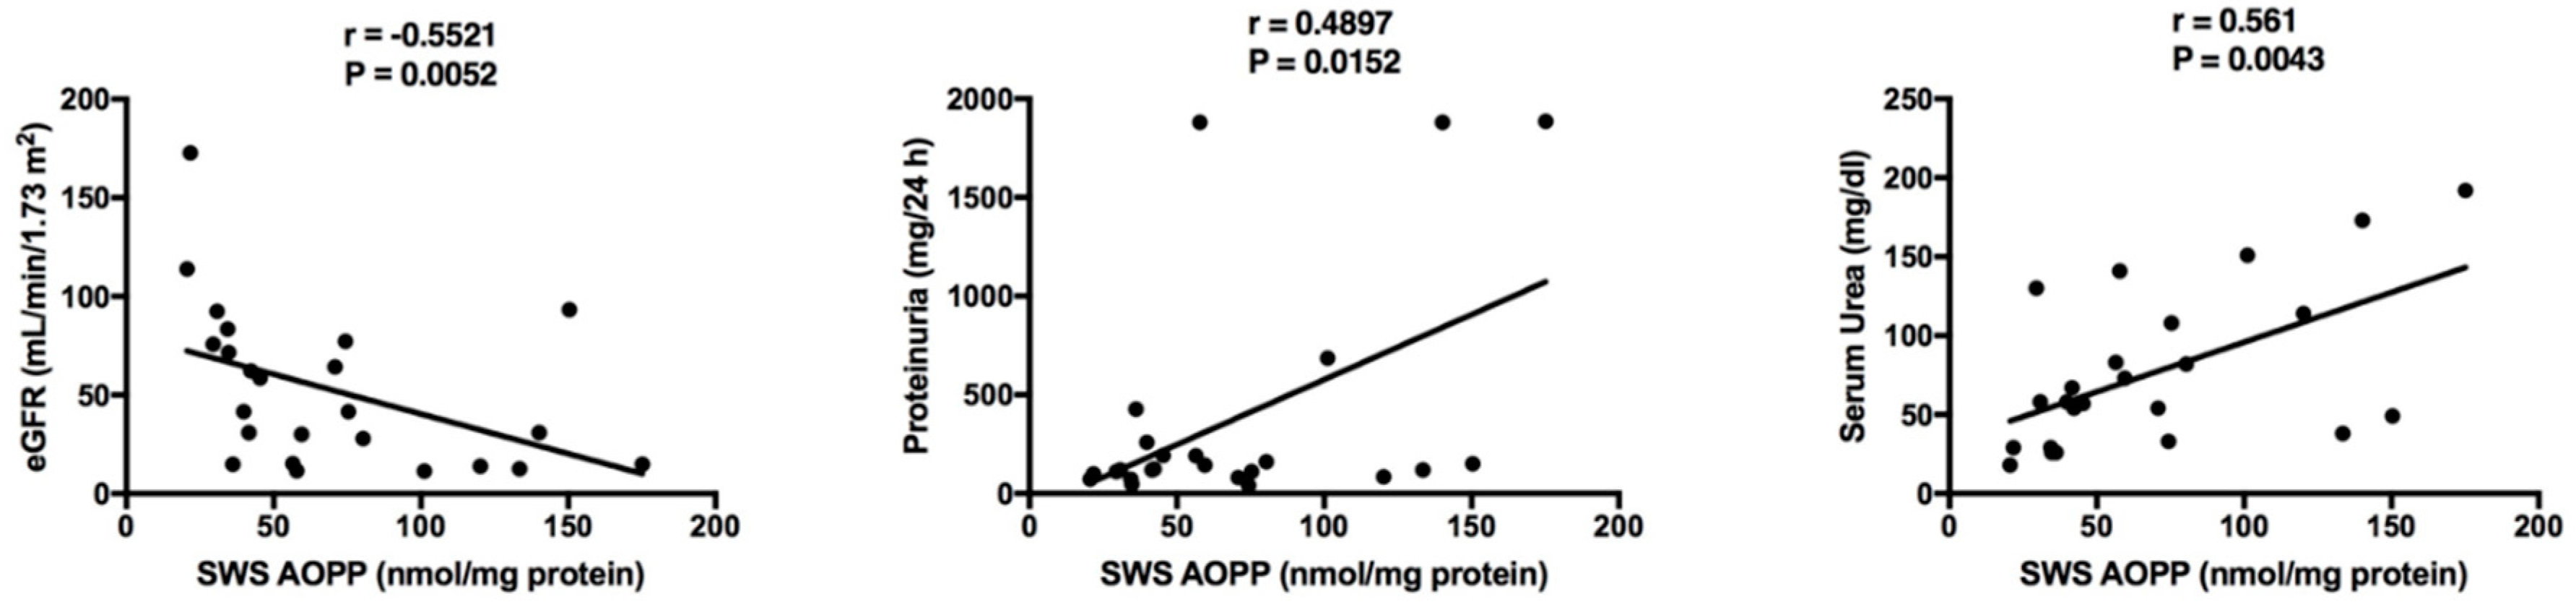
| SWS AOPP & eGFR | −0.552 | 0.005 |
| SWS AOPP & Proteinuria | 0.490 | 0.015 |
| SWS AOPP & Serum Urea | 0.561 | 0.004 |
| Pairs of Variable | r | P |
|---|---|---|
| Control group | ||
| NWS UA & plasma UA | 0.436 | 0.016 |
| NWS albumin & plasma albumin | 0.682 | 0.010 |
| NWS AOPP & plasma AOPP | 0.591 | 0.010 |
| SWS AOPP & plasma AOPP | 0.495 | 0.029 |
| CKD children | ||
| NWS UA & plasma UA | 0.668 | 0.005 |
| NWS albumin & plasma albumin | 0.566 | 0.018 |
| SWS albumin & plasma albumin | 0.483 | 0.015 |
| NWS TAC & plasma TAC | 0.633 | 0.004 |
| SWS TOS & plasma TOS | 0.531 | 0.023 |
| NWS AOPP & plasma AOPP | 0.665 | 0.015 |
| SWS AOPP & plasma AOPP | 0.550 | 0.004 |
| NWS MDA & plasma MDA | 0.518 | 0.016 |
| Parameter | NWS | SWS | ||||||||
|---|---|---|---|---|---|---|---|---|---|---|
| AUC | P Value | Cutt-Off | Sensitivity (%) | Specificity (%) | AUC | P Value | Cutt-Off | Sensitivity (%) | Specificity (%) | |
| Non-enzymatic antioxidants | ||||||||||
| UA (μg/mg protein) | 0.82 | 0.0040 | >4.03 | 64.71 | 66.67 | 0.93 | <0.0001 | >7.30 | 88.24 | 92.31 |
| GSH (μg/mg protein) | 0.75 | 0.0282 | <1.42 | 66.67 | 66.67 | 0.84 | 0.0025 | <1.26 | 80.00 | 83.33 |
| Albumin (mg/mg protein) | 0.79 | 0.0094 | >1.55 | 81.25 | 83.33 | 0.94 | 0.0002 | >1.55 | 93.33 | 90.91 |
| Enzymatic antioxidants | ||||||||||
| CAT (nmol H2O2/min/mg protein) | 0.52 | 0.8823 | >0.83 | 50.00 | 54.55 | 0.58 | 0.4472 | <0.54 | 60.00 | 61.54 |
| Px (mU/mg protein) | 0.61 | 0.3097 | <0.42 | 61.11 | 66.67 | 0.86 | 0.0007 | >0.47 | 83.33 | 84.62 |
| SOD (mU/mg protein) | 0.79 | 0.0160 | >0.31 | 71.43 | 72.73 | 0.74 | 0.0250 | >0.14 | 72.22 | 69.23 |
| Total antioxidant/oxidant status | ||||||||||
| TAC (Trolox μmol/mg protein) | 0.68 | 0.1074 | <0.51 | 66.67 | 66.67 | 0.81 | 0.0050 | >0.42 | 75.00 | 76.92 |
| TOS (nmol H2O2Equiv/mg protein) | 0.66 | 0.1385 | >23.26 | 55.56 | 58.33 | 0.95 | <0.0001 | >25.90 | 88.89 | 84.62 |
| OSI (TOS/TAC ratio) | 0.59 | 0.46 | >48.82 | 50.00 | 54.55 | 0.95 | < 0.0001 | >27.20 | 88.89 | 92.31 |
| Oxidative damage products | ||||||||||
| AGE (fluorescence/mg protein) | 0.75 | 0.0223 | >1.98 | 77.78 | 75.00 | 0.91 | 0.0001 | >2.08 | 88.89 | 92.31 |
| AOPP (nmol/mg protein) | 0.92 | 0.0003 | >37.85 | 81.25 | 81.82 | 0.98 | <0.0001 | >25.58 | 92.00 | 92.31 |
| MDA (μmol/mg protein) | 0.86 | 0.0006 | >100.10 | 77.78 | 75.00 | 0.95 | <0.0001 | > 100.00 | 83.33 | 84,62 |
© 2018 by the authors. Licensee MDPI, Basel, Switzerland. This article is an open access article distributed under the terms and conditions of the Creative Commons Attribution (CC BY) license (http://creativecommons.org/licenses/by/4.0/).
Share and Cite
Maciejczyk, M.; Szulimowska, J.; Skutnik, A.; Taranta-Janusz, K.; Wasilewska, A.; Wiśniewska, N.; Zalewska, A. Salivary Biomarkers of Oxidative Stress in Children with Chronic Kidney Disease. J. Clin. Med. 2018, 7, 209. https://doi.org/10.3390/jcm7080209
Maciejczyk M, Szulimowska J, Skutnik A, Taranta-Janusz K, Wasilewska A, Wiśniewska N, Zalewska A. Salivary Biomarkers of Oxidative Stress in Children with Chronic Kidney Disease. Journal of Clinical Medicine. 2018; 7(8):209. https://doi.org/10.3390/jcm7080209
Chicago/Turabian StyleMaciejczyk, Mateusz, Julita Szulimowska, Anna Skutnik, Katarzyna Taranta-Janusz, Anna Wasilewska, Natalia Wiśniewska, and Anna Zalewska. 2018. "Salivary Biomarkers of Oxidative Stress in Children with Chronic Kidney Disease" Journal of Clinical Medicine 7, no. 8: 209. https://doi.org/10.3390/jcm7080209