
Development of Machine-Learning Models for Tinnitus-Related Distress Classification Using Wavelet-Transformed Auditory Evoked Potential Signals and Clinical Data

 , ,
, ,  , , and
Abstract
:1. Introduction
1.1. Tinnitus
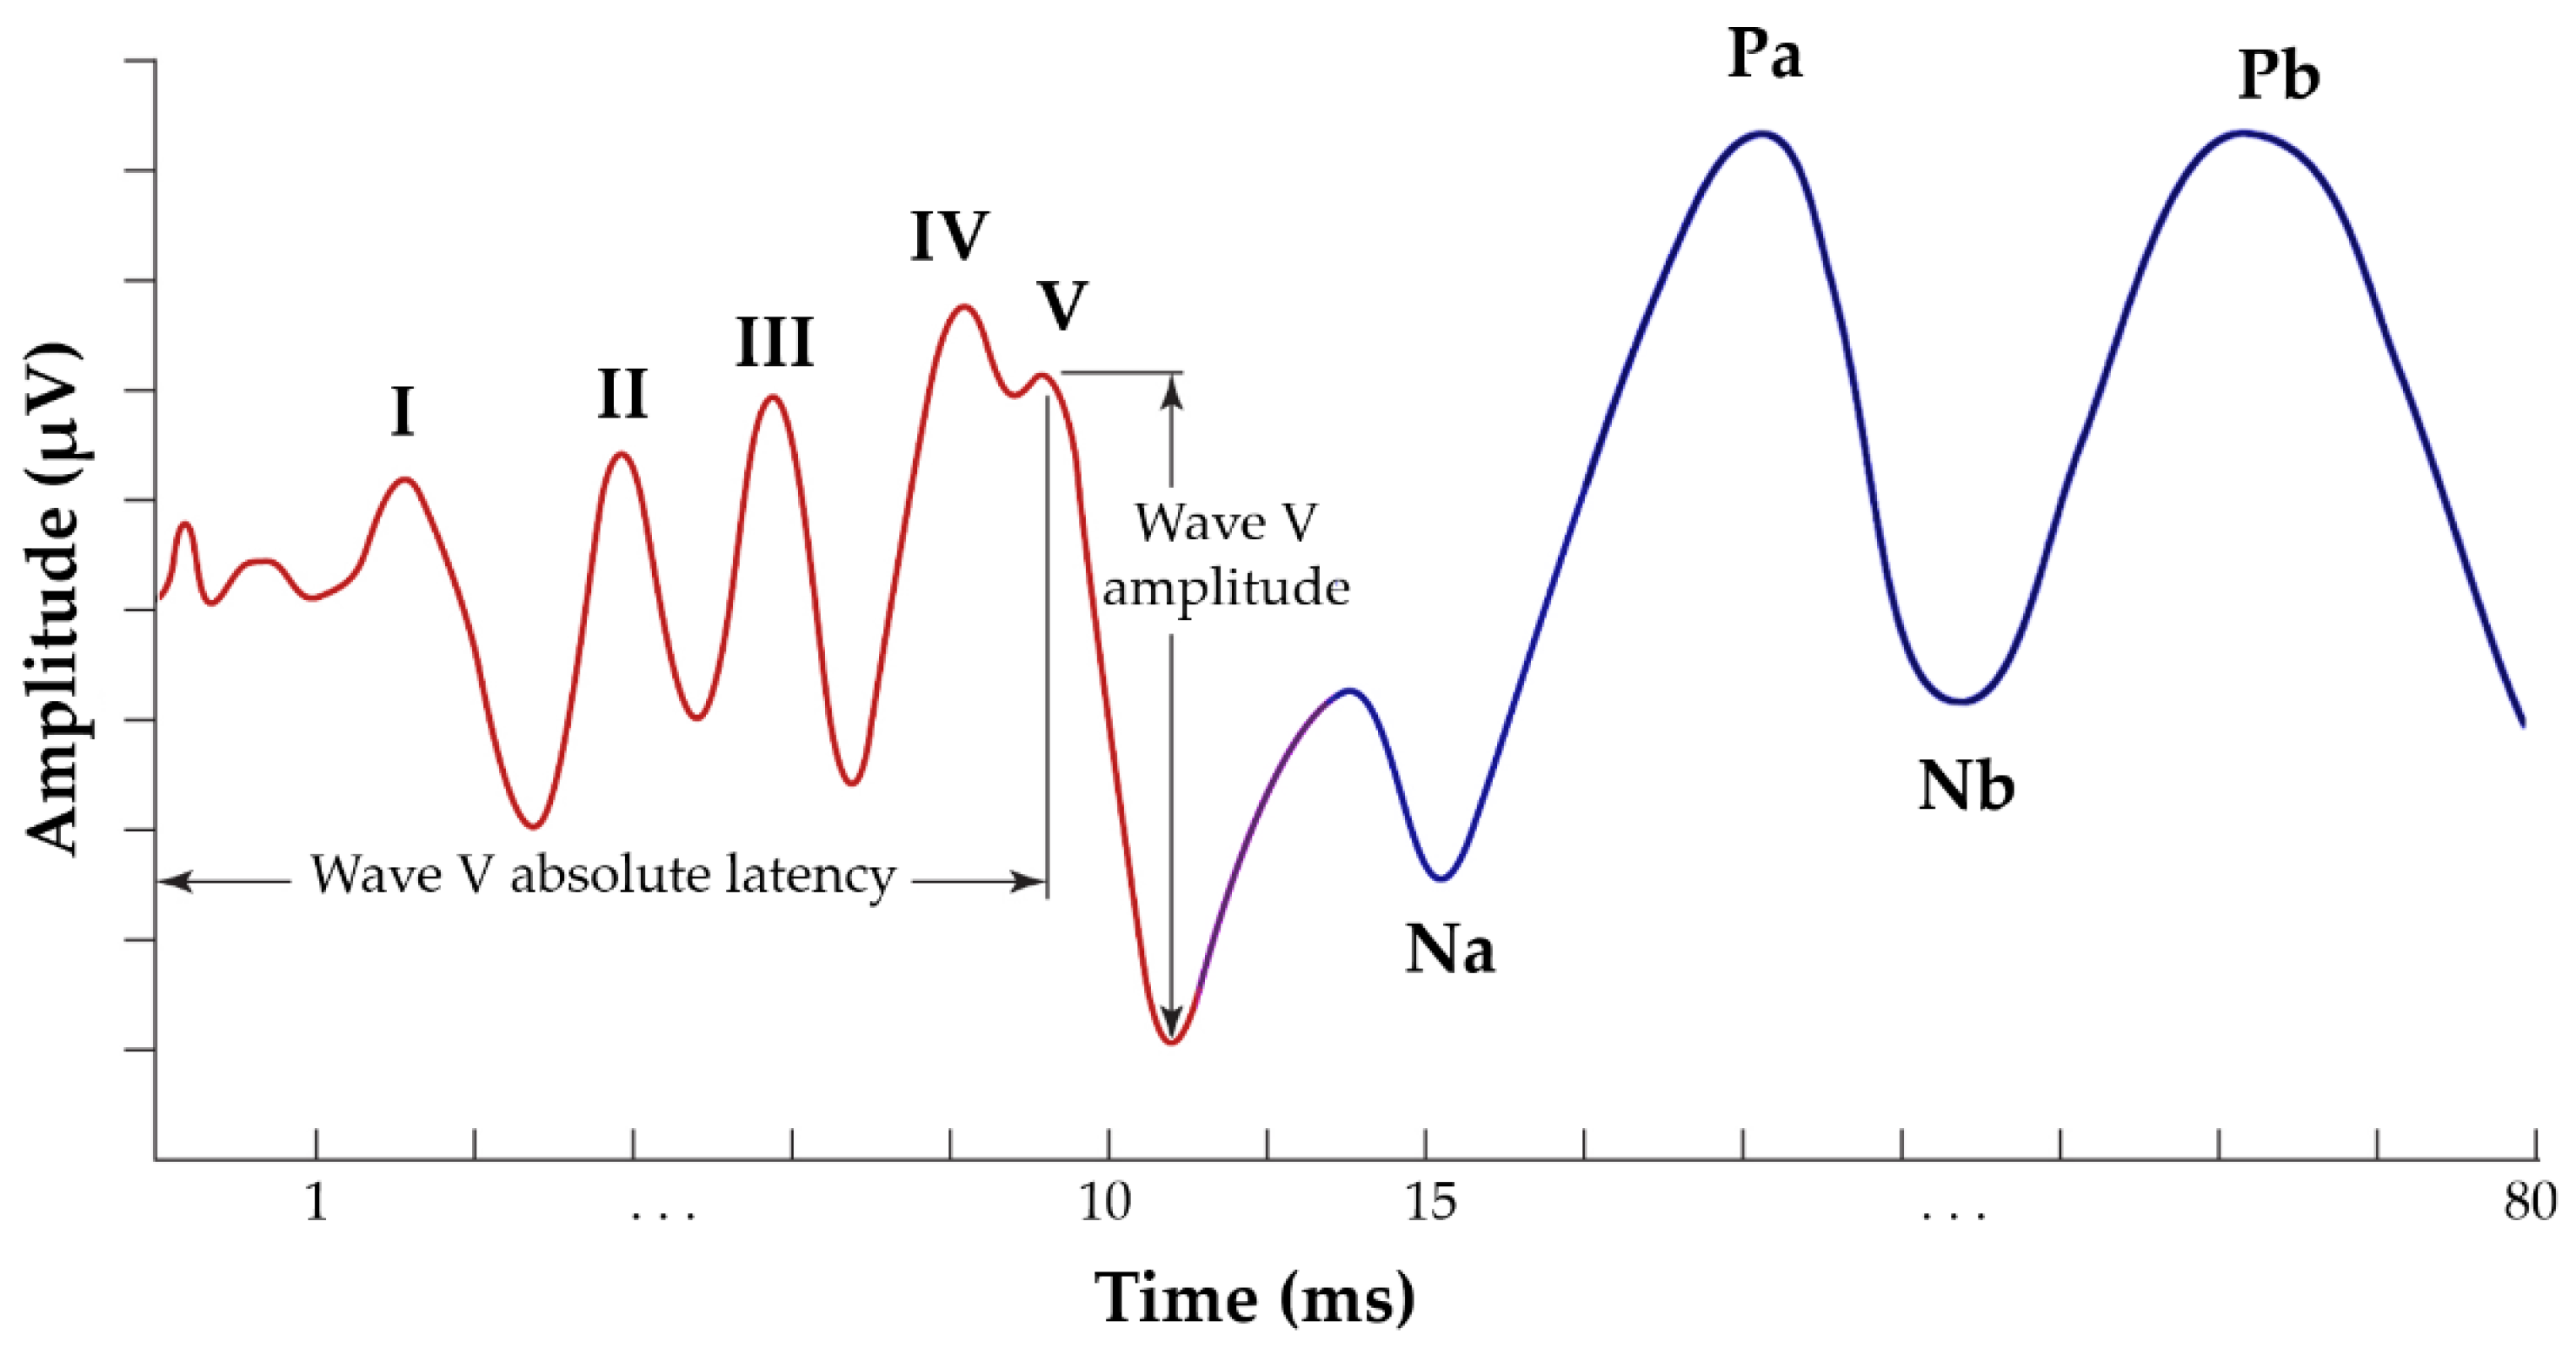
1.2. Auditory Evoked Potentials (AEPs)
1.3. The Scope of the Study
2. Materials and Methods
2.1. Data Origin, Recruitment Process, and Patient Characteristics
2.2. Electrophysiological Measurements
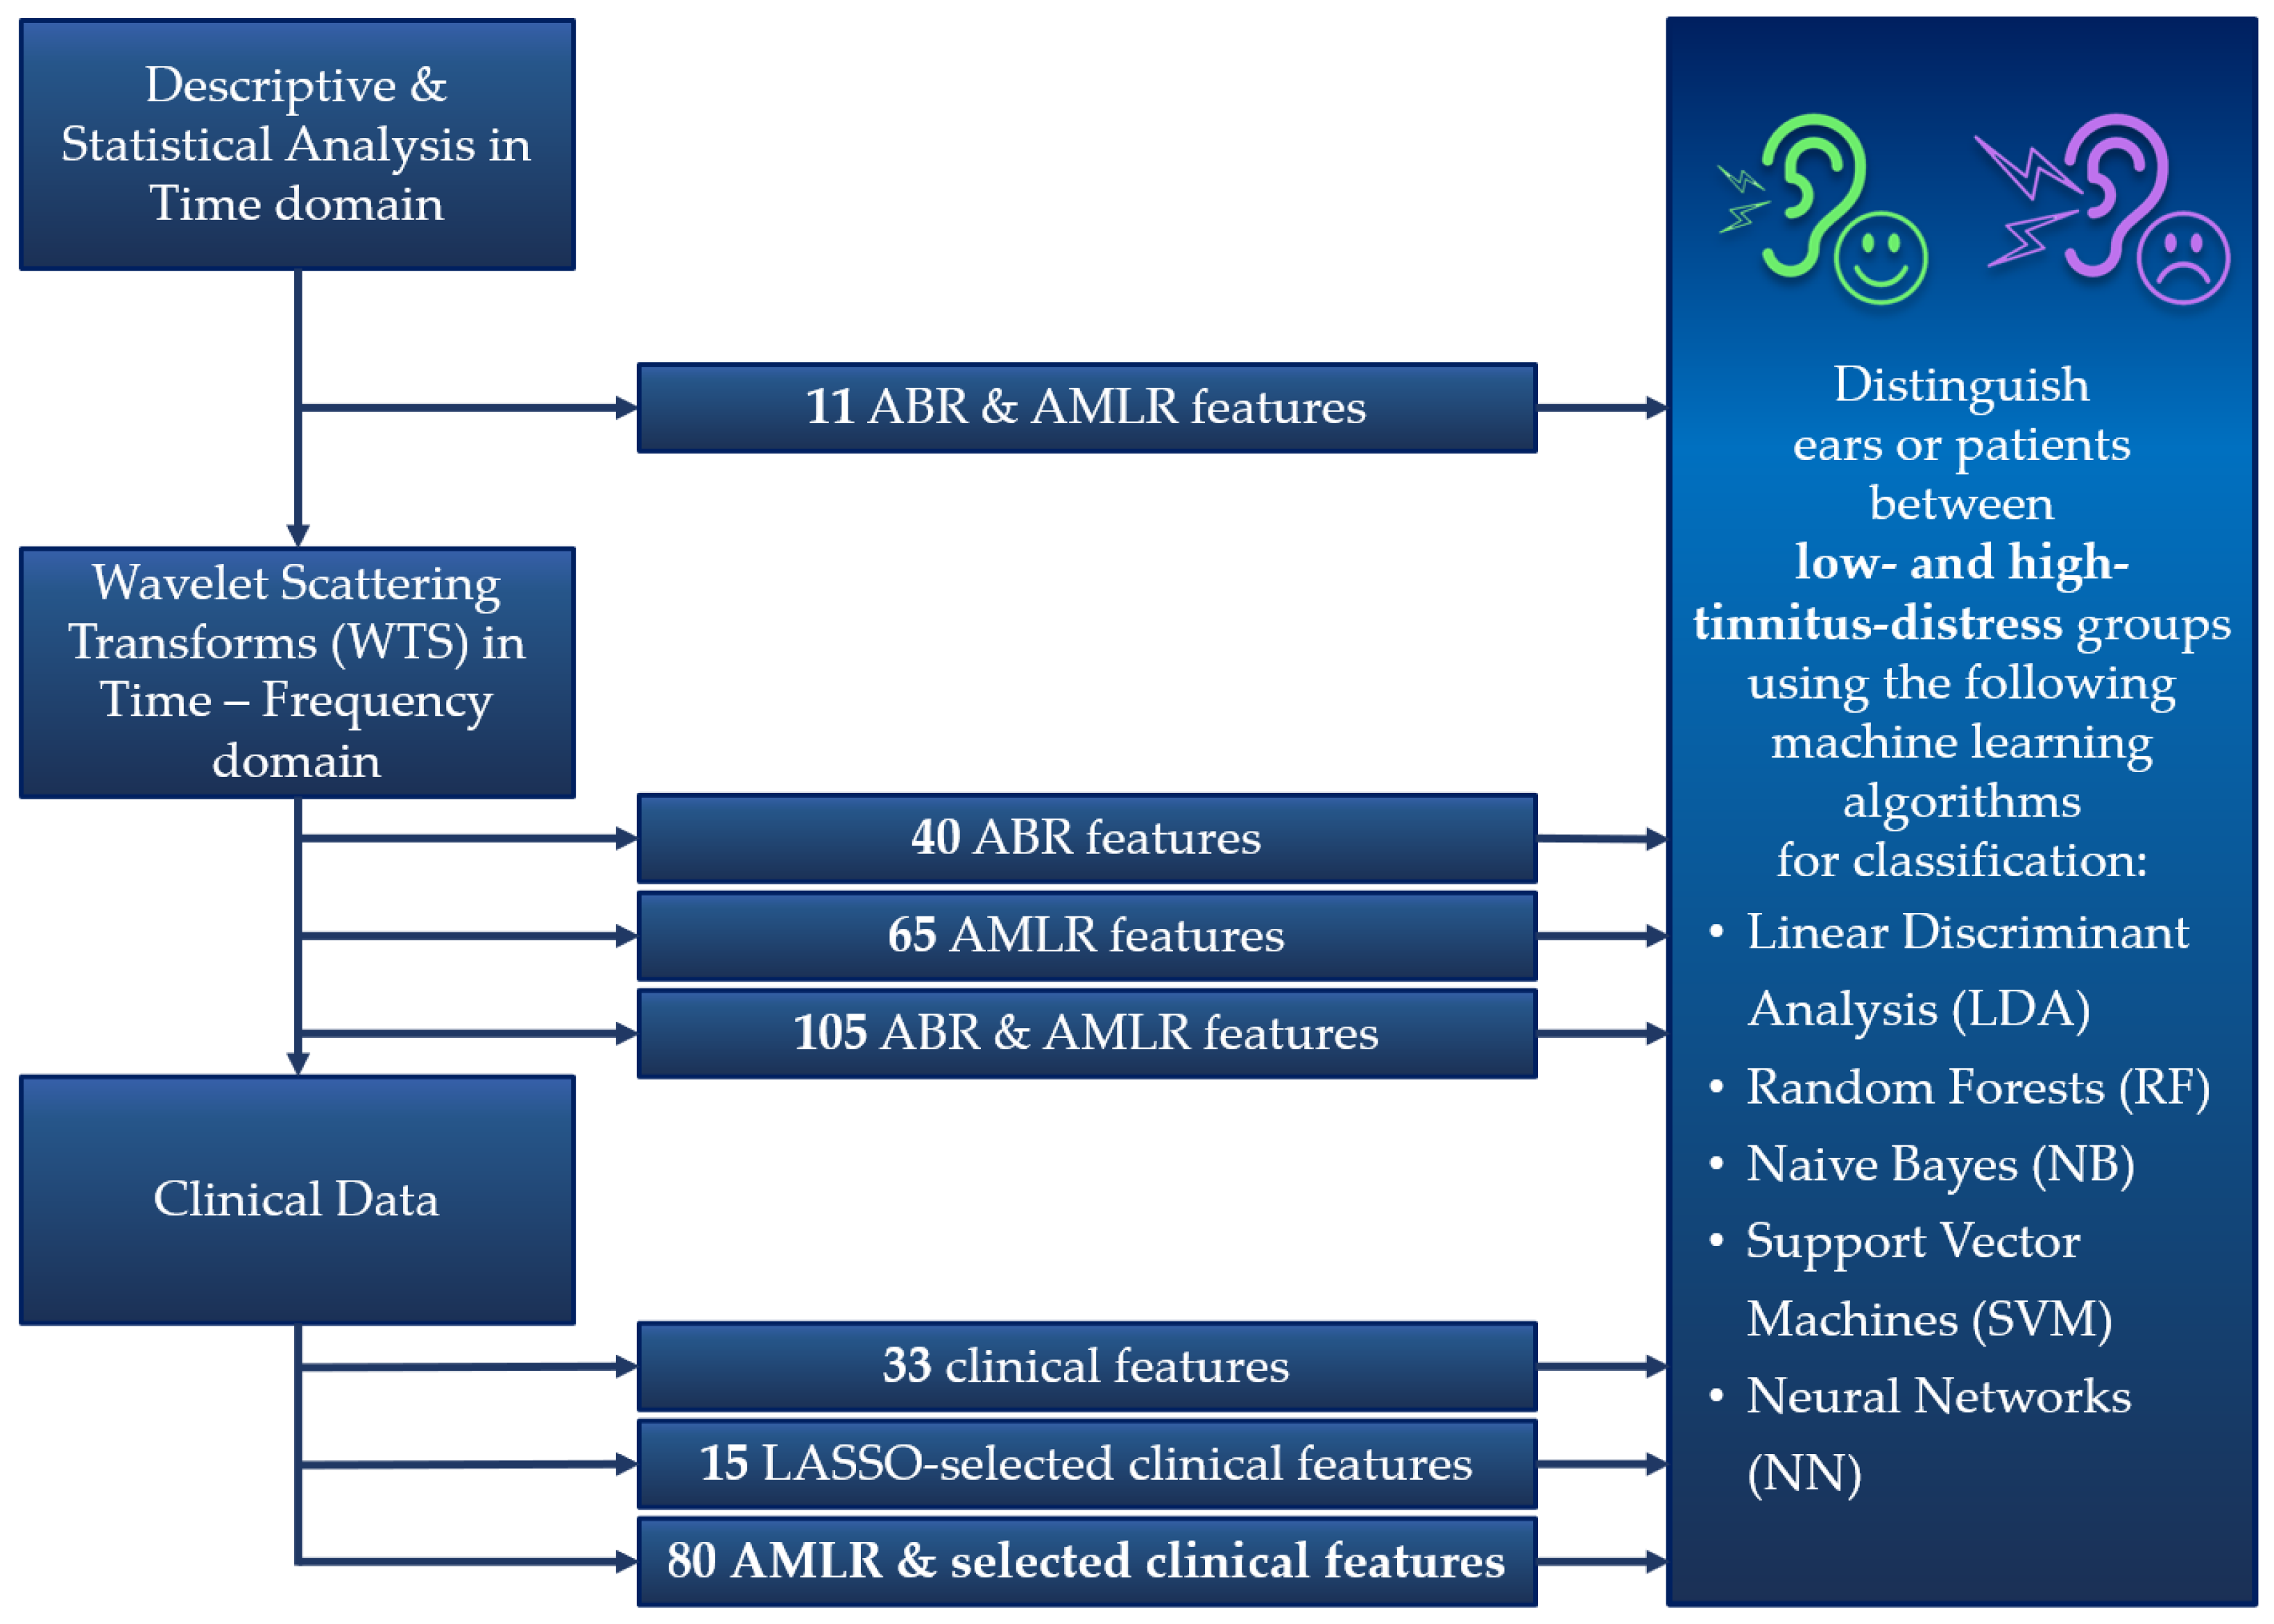
2.3. Overall Study Workflow: From AEP Metrics to Classification Models Building
2.4. Descriptive and Statistical Analyses in Time Domain
2.5. Wavelet Scattering Transform in Time–Frequency Domain
2.6. Patients’ Clinical Data Integration
2.7. Building Classification Models
2.7.1. Classification Models and Performance Evaluation
2.7.2. Feature Selection in Clinical Data Using LASSO
2.7.3. Integration of AEP Metrics and Clinical Characteristics
3. Results
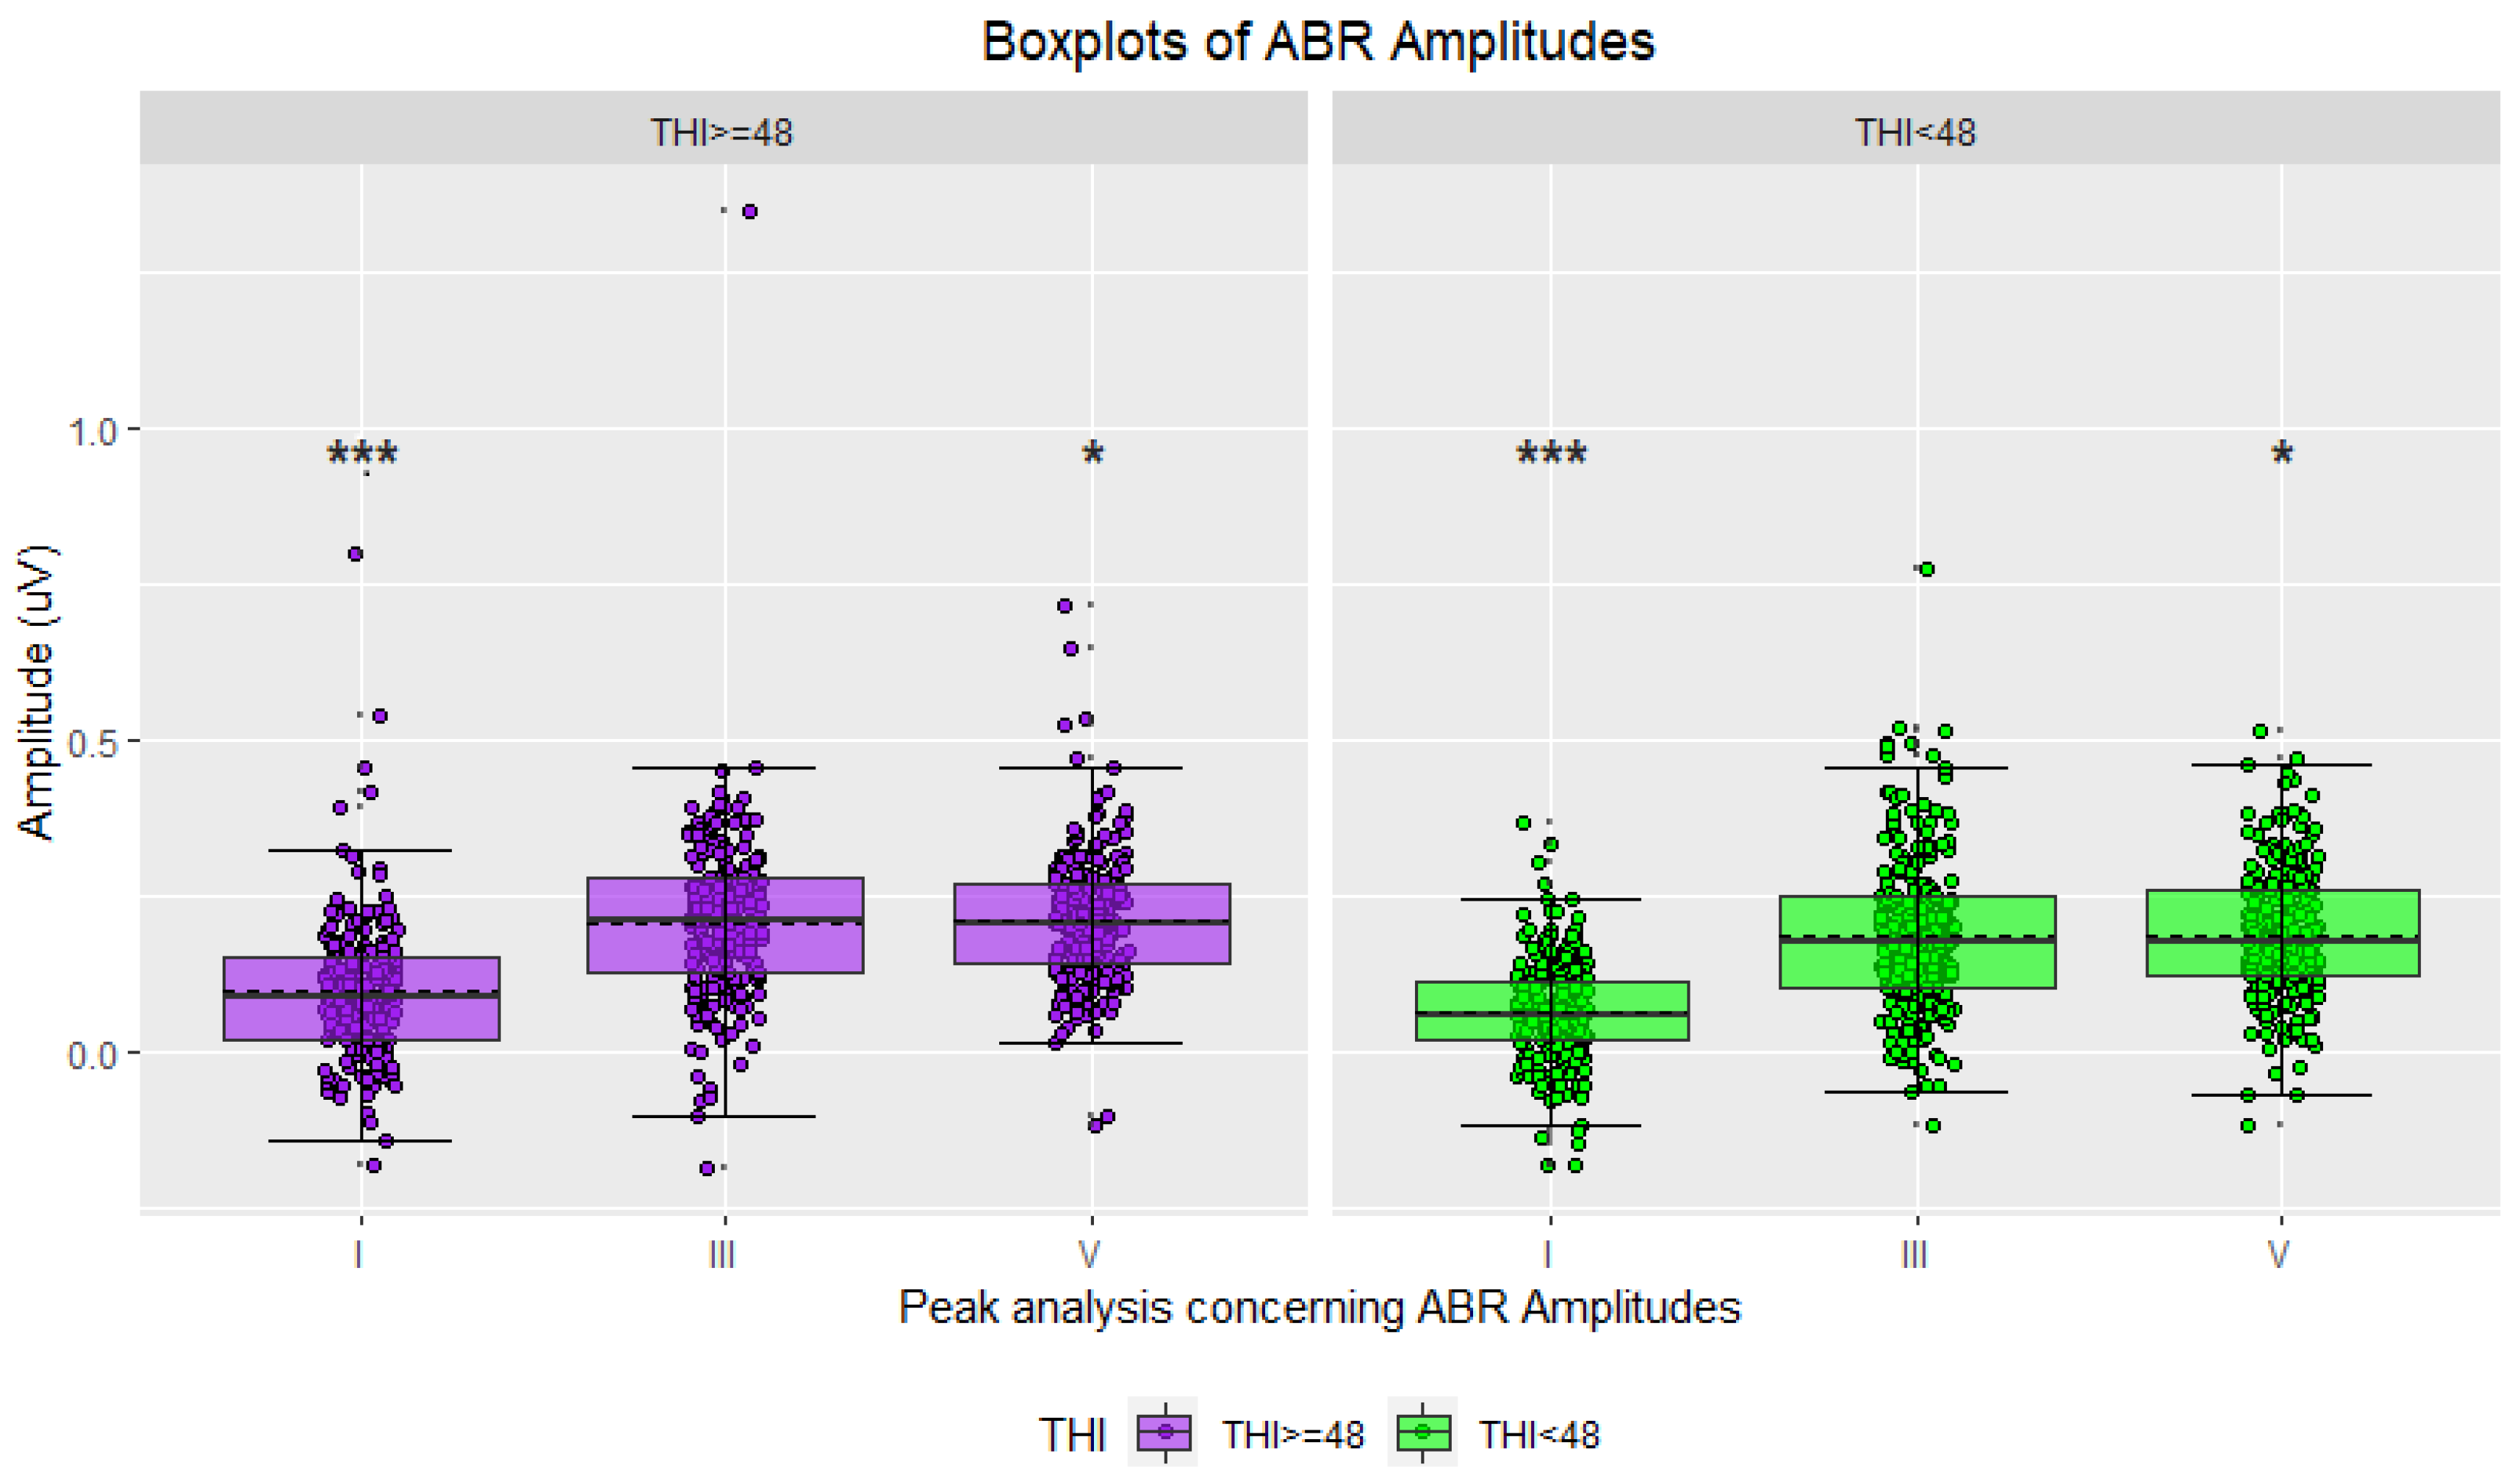
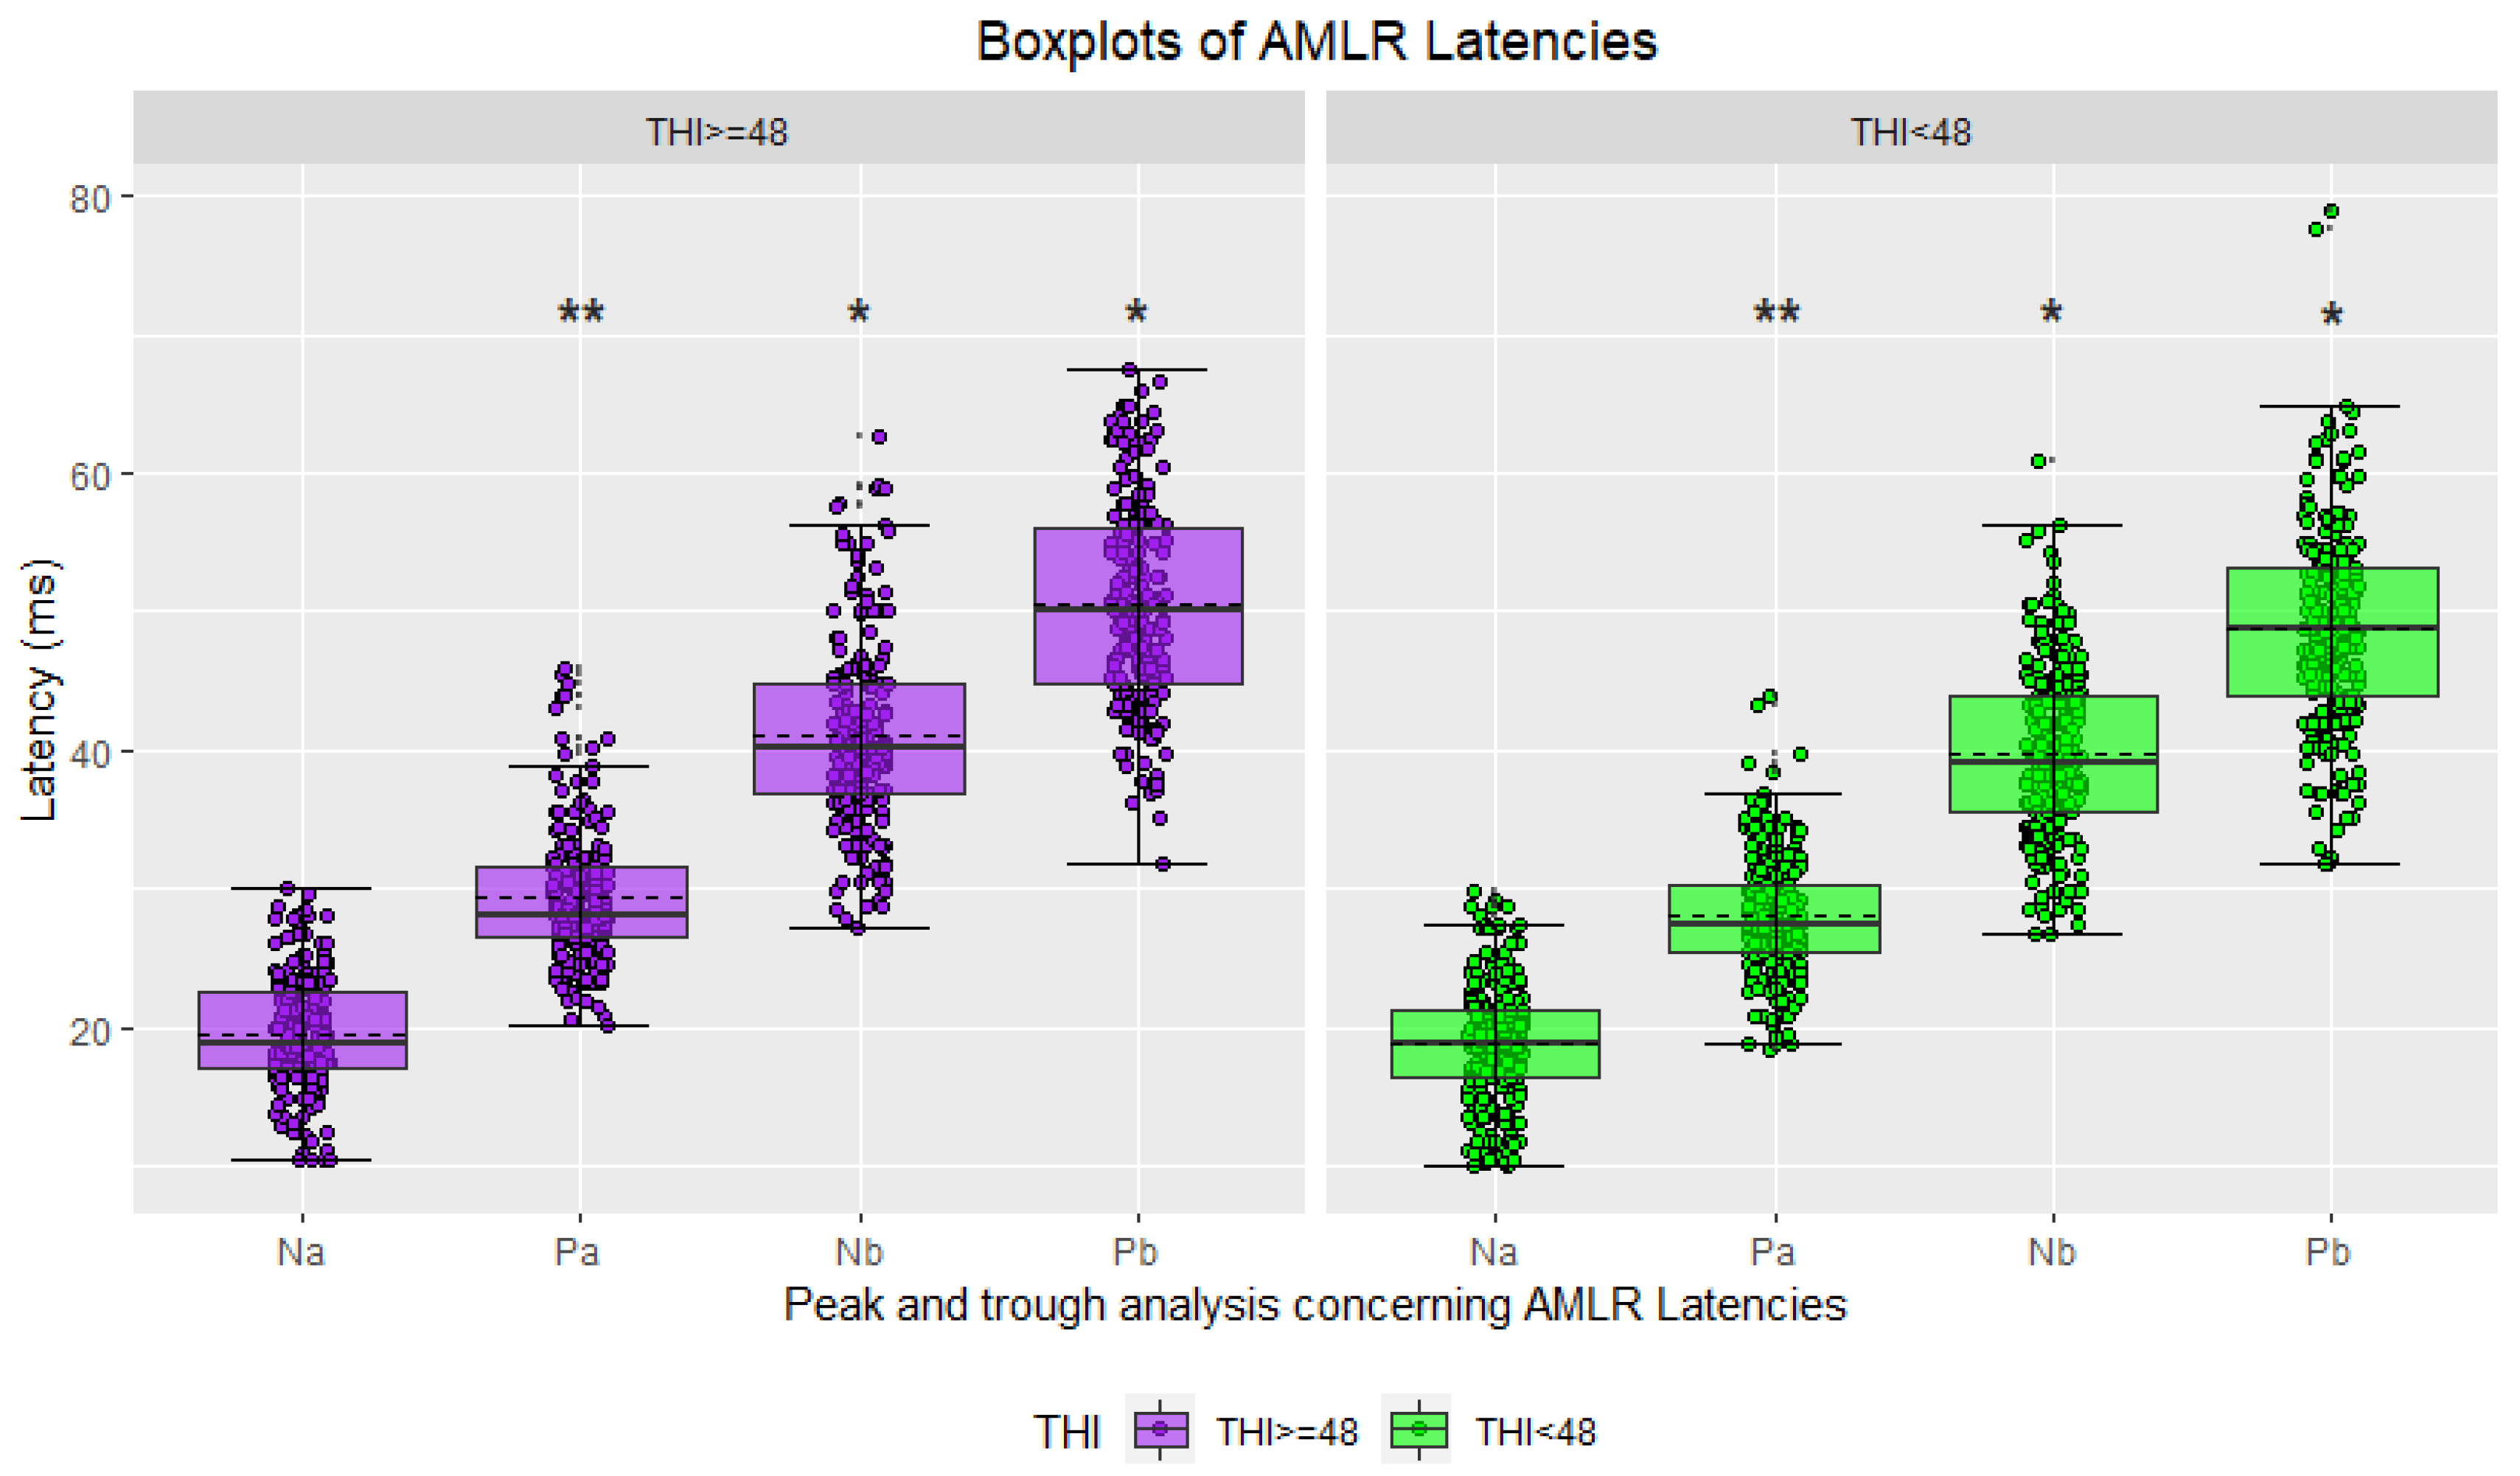
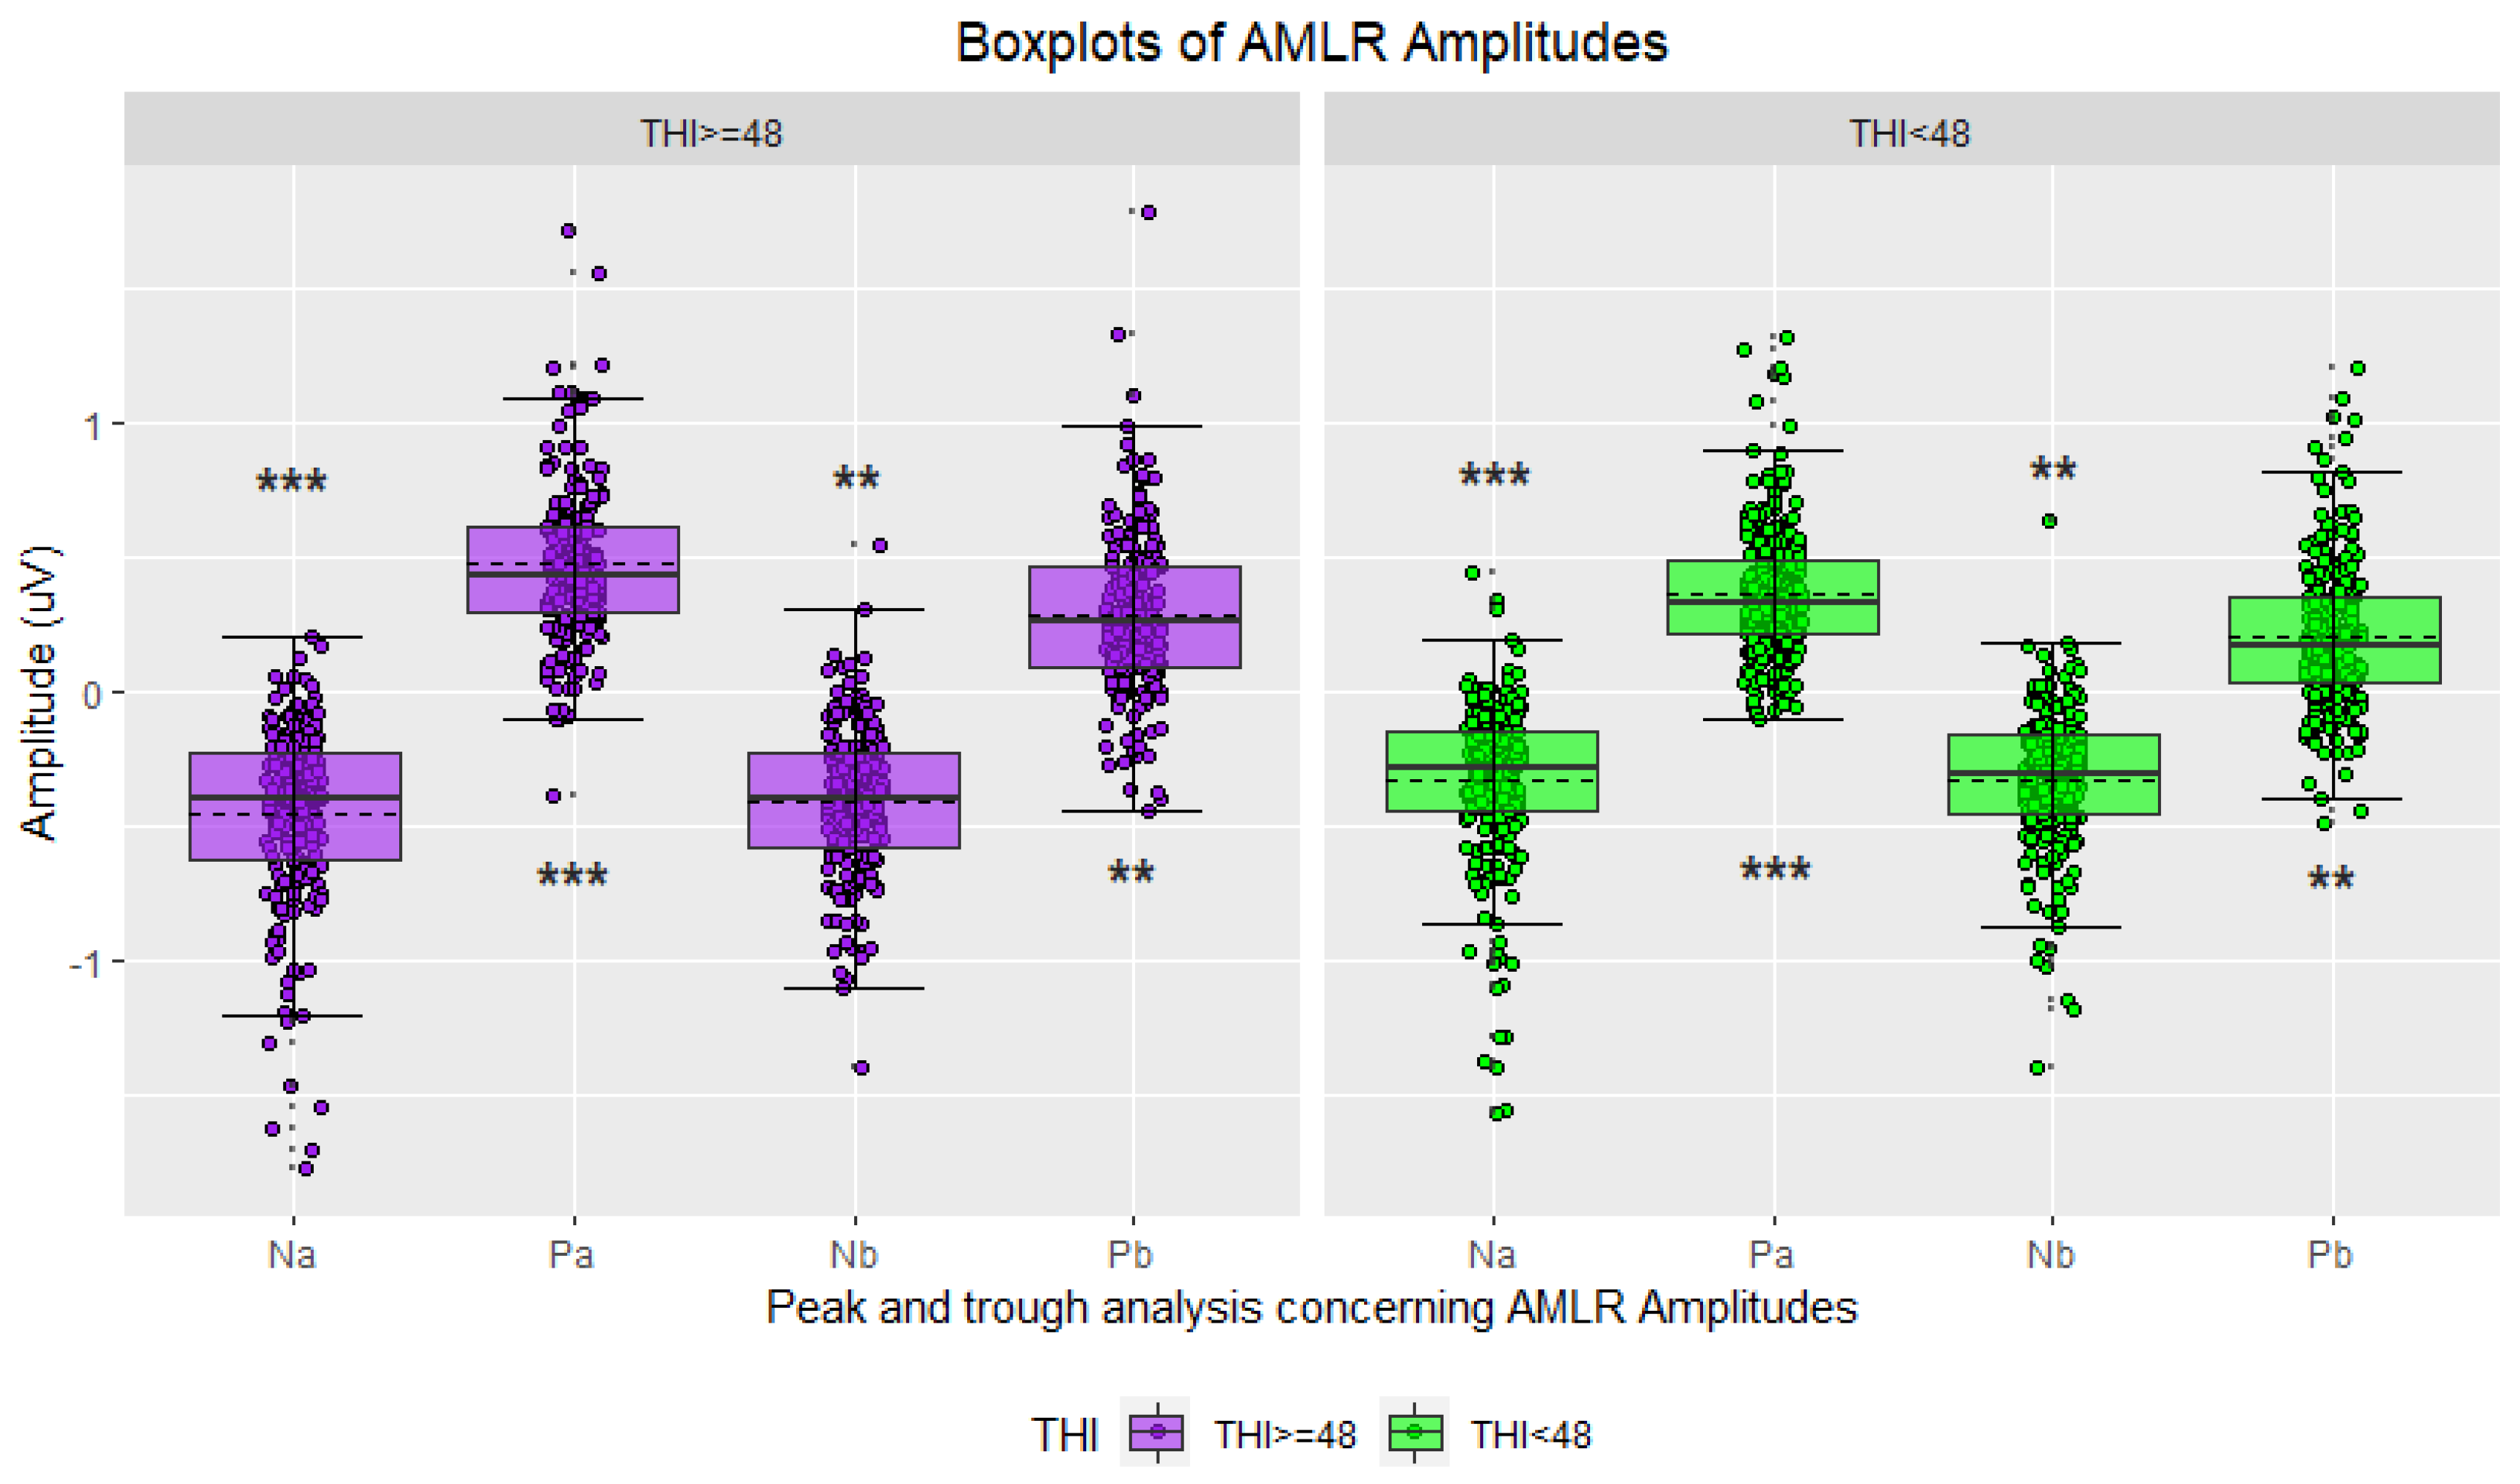
3.1. Descriptive and Statistical Analyses in the Time Domain
3.1.1. Grouping Using the THI Score
3.1.2. Grouping Using the THI Score Combined with Gender and Hearing Level
- “Males with normal hearing” with respect to peak III latency and peak V amplitude;
- “Females with mild hearing loss” with respect to peak III and peak V latencies, and peak I amplitude;
- “Males with mild hearing loss” with respect to peak I amplitude;
- “Females with severe hearing loss” with respect to peak III and peak V latencies, and peak III amplitude;
- “Males with severe hearing loss” with respect to peak III latency.
- “Females with normal hearing” with respect to Nb trough and Pb peak latencies;
- “Females with mild hearing loss” with respect to Pa peak and Nb trough amplitudes;
- “Males with mild hearing loss” with respect to Nb trough latency and Na trough, Pa peak, and Nb trough amplitudes;
- “Males with severe hearing loss” with respect to Na trough amplitudes.
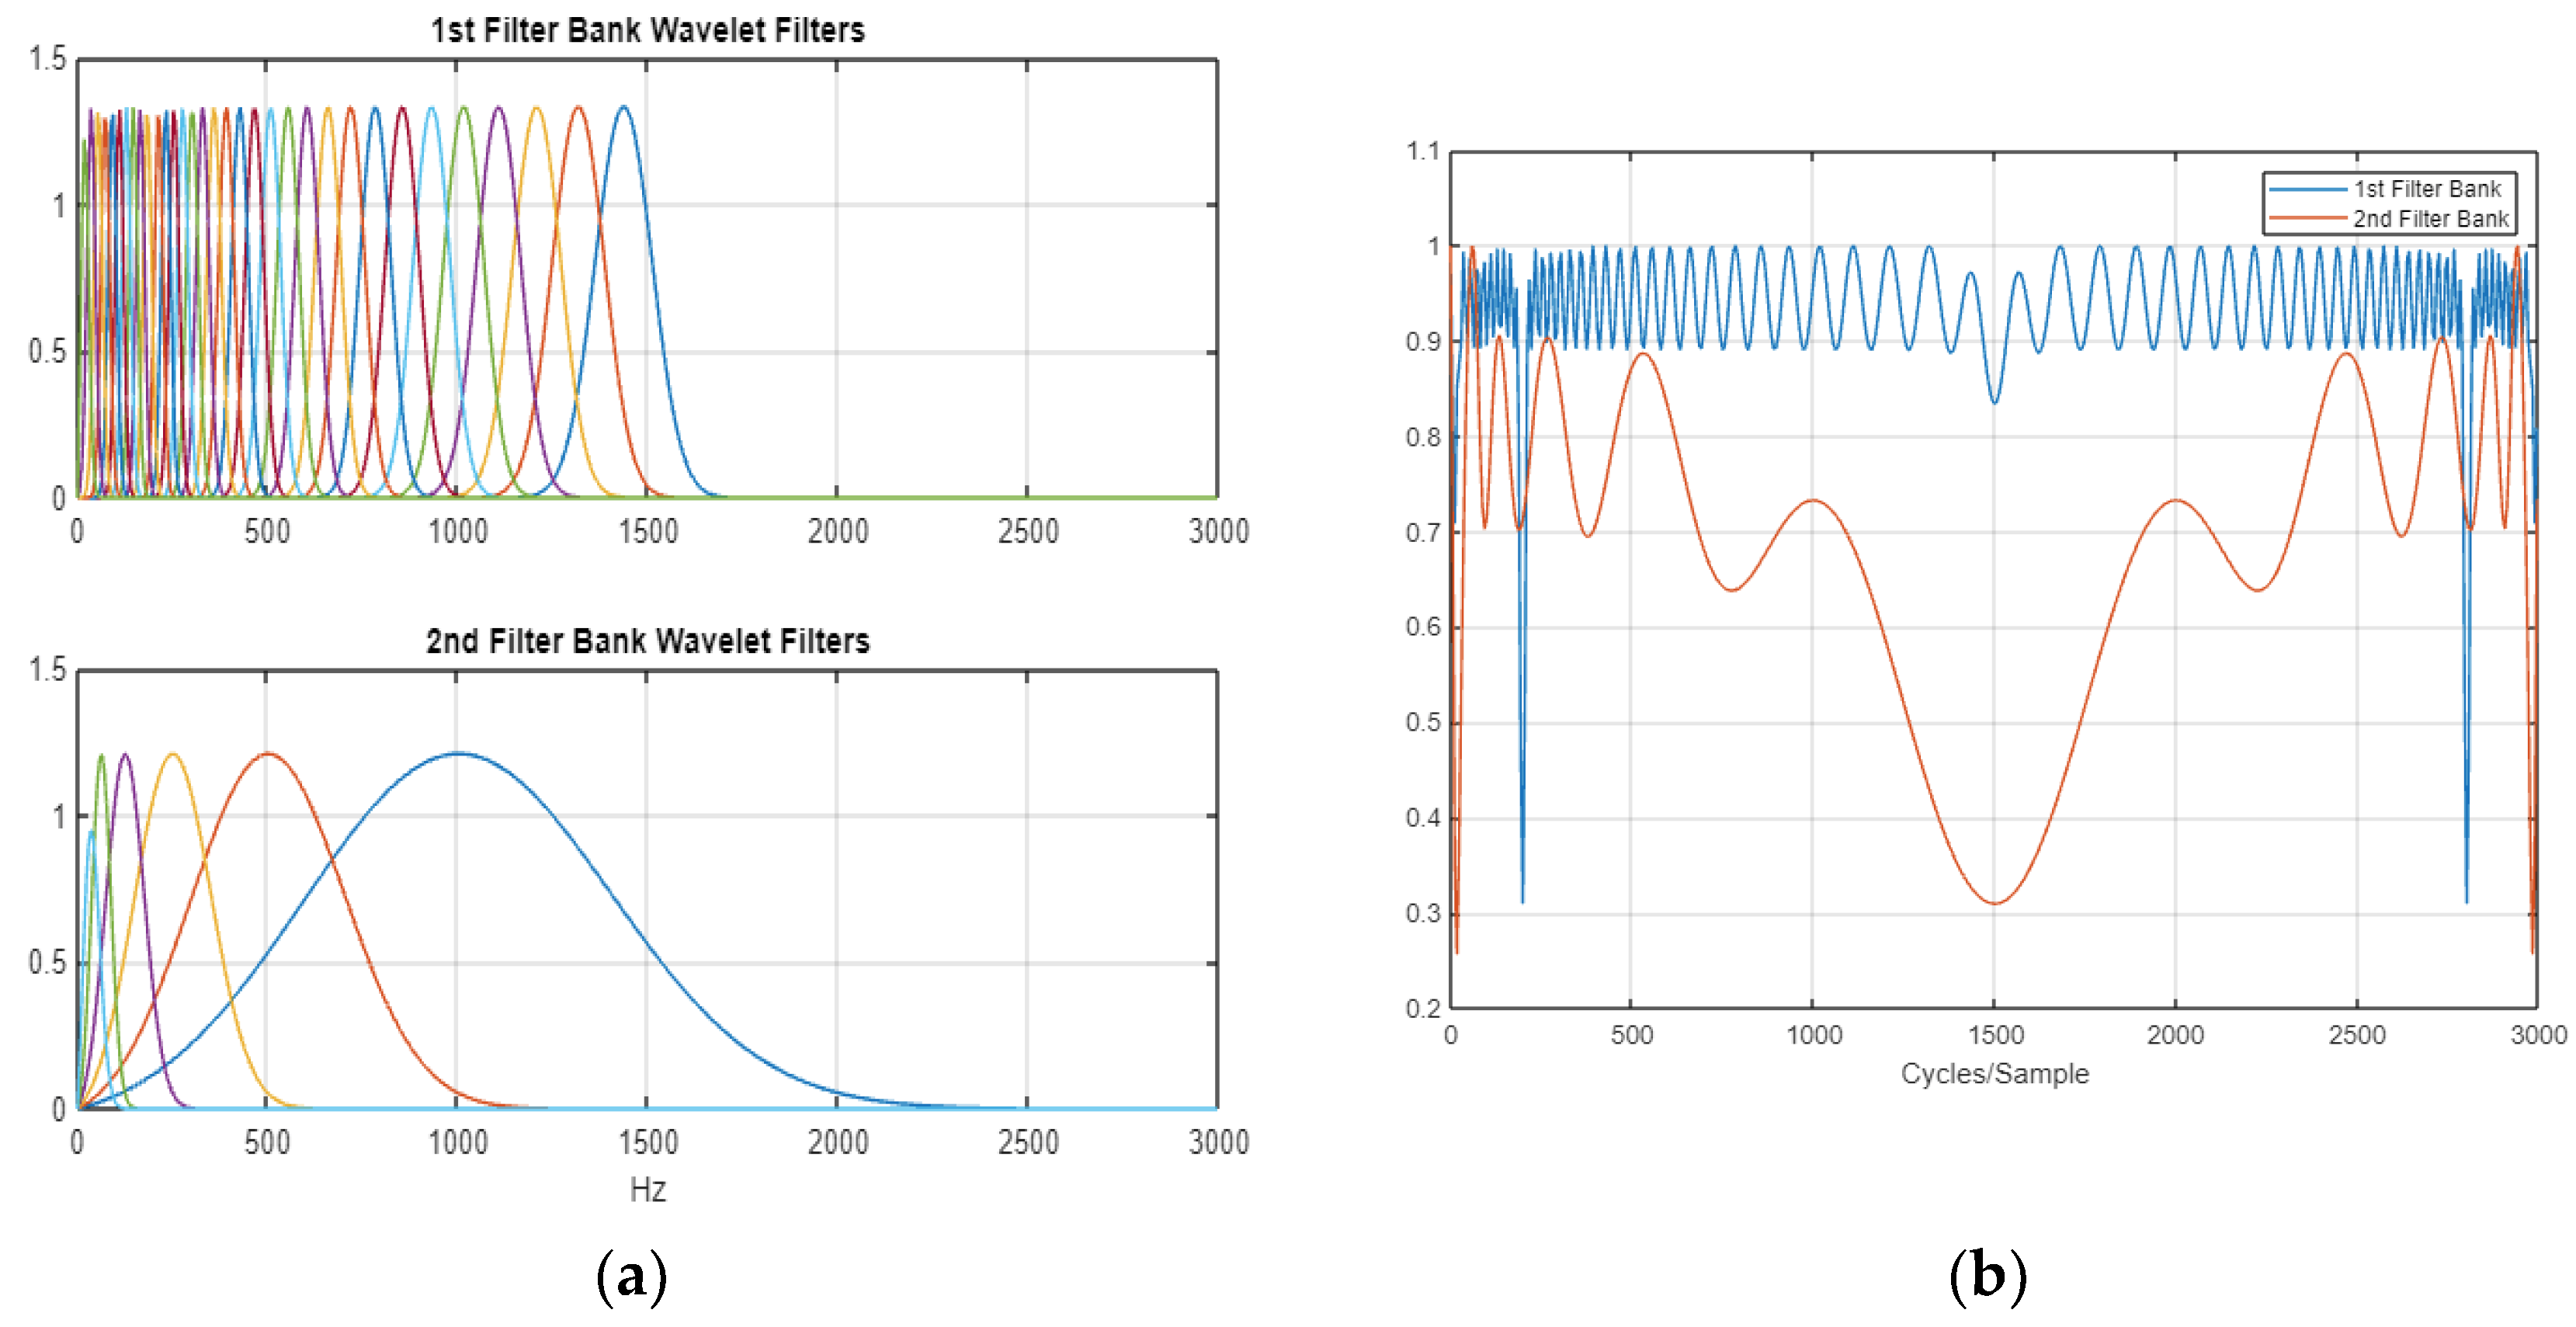
3.2. Wavelet Scattering Transform (WST) in the Time–Frequency Domain
3.2.1. The Wavelet Scattering Transform Method
3.2.2. Dimensionality Reduction in WST
3.3. Patients’ Clinical Data Integration
3.4. Classification Models
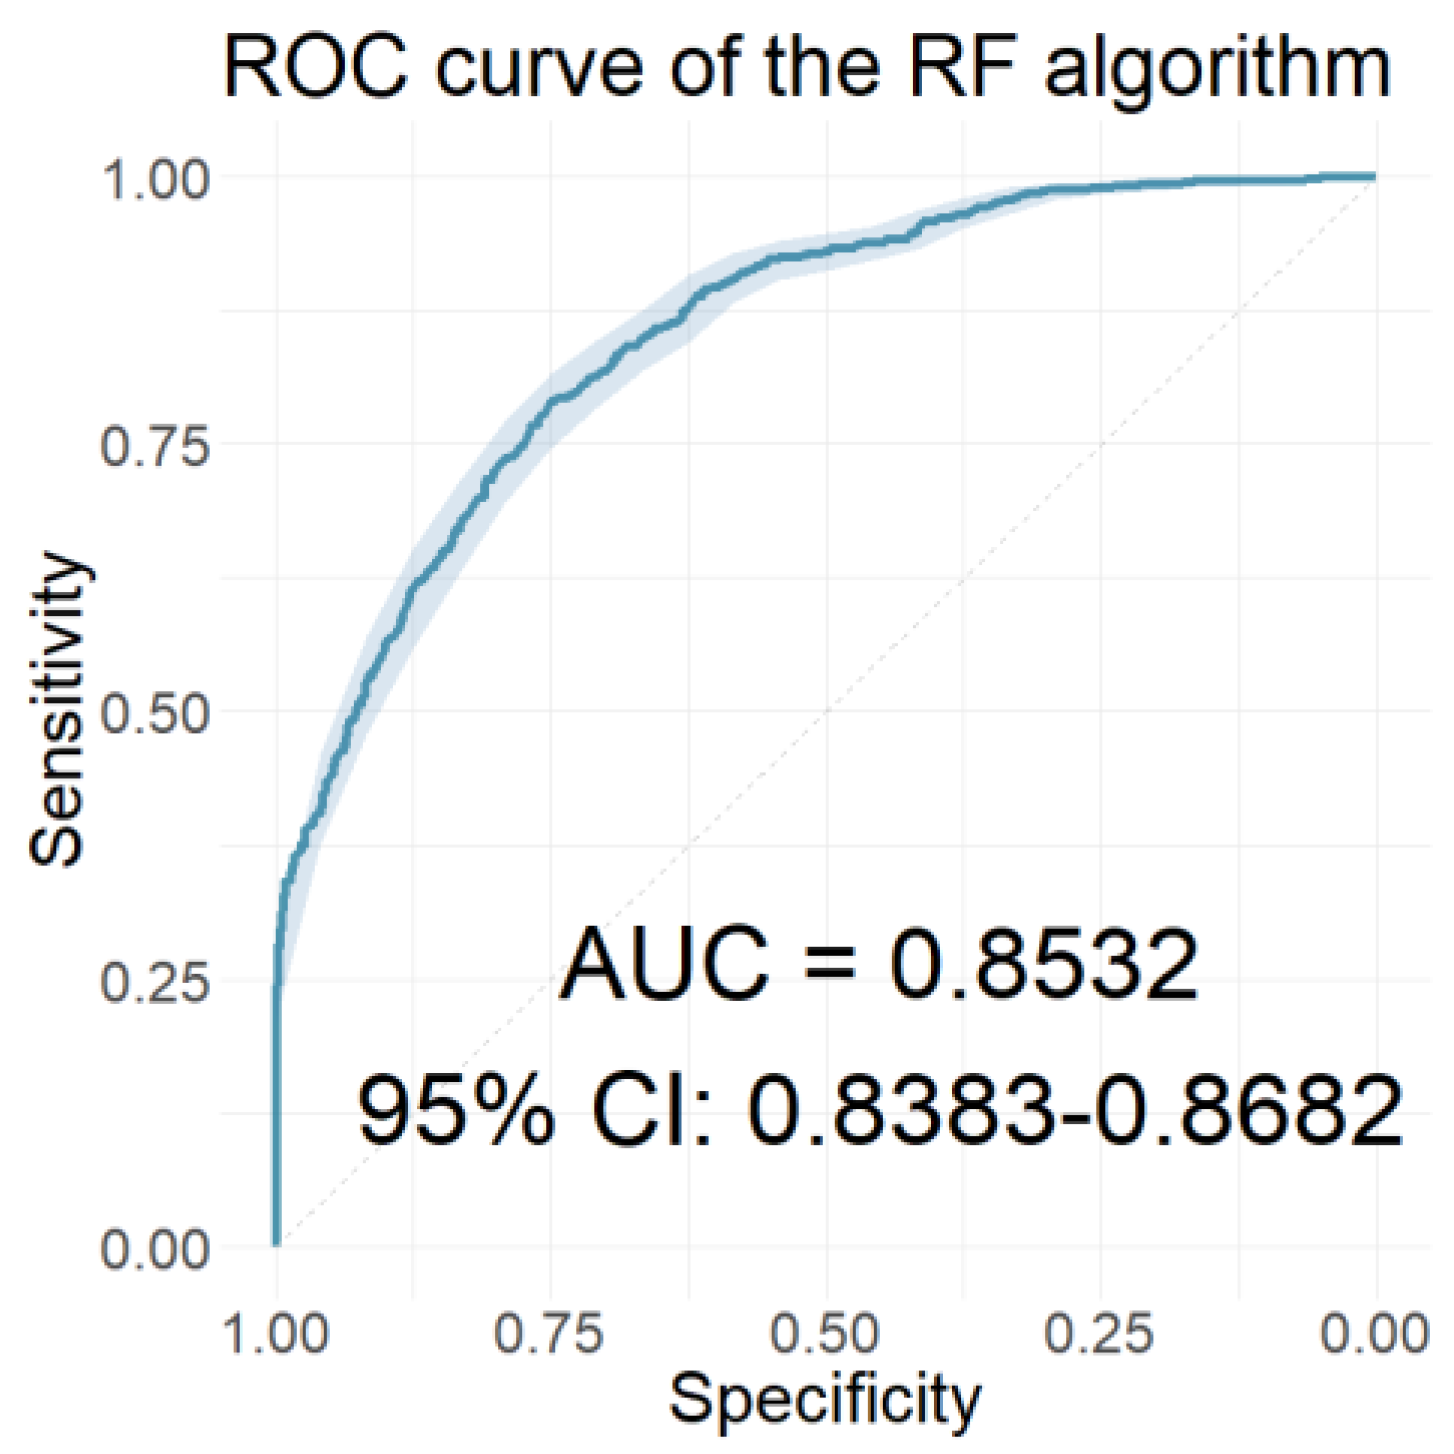
3.4.1. Time-Domain Models
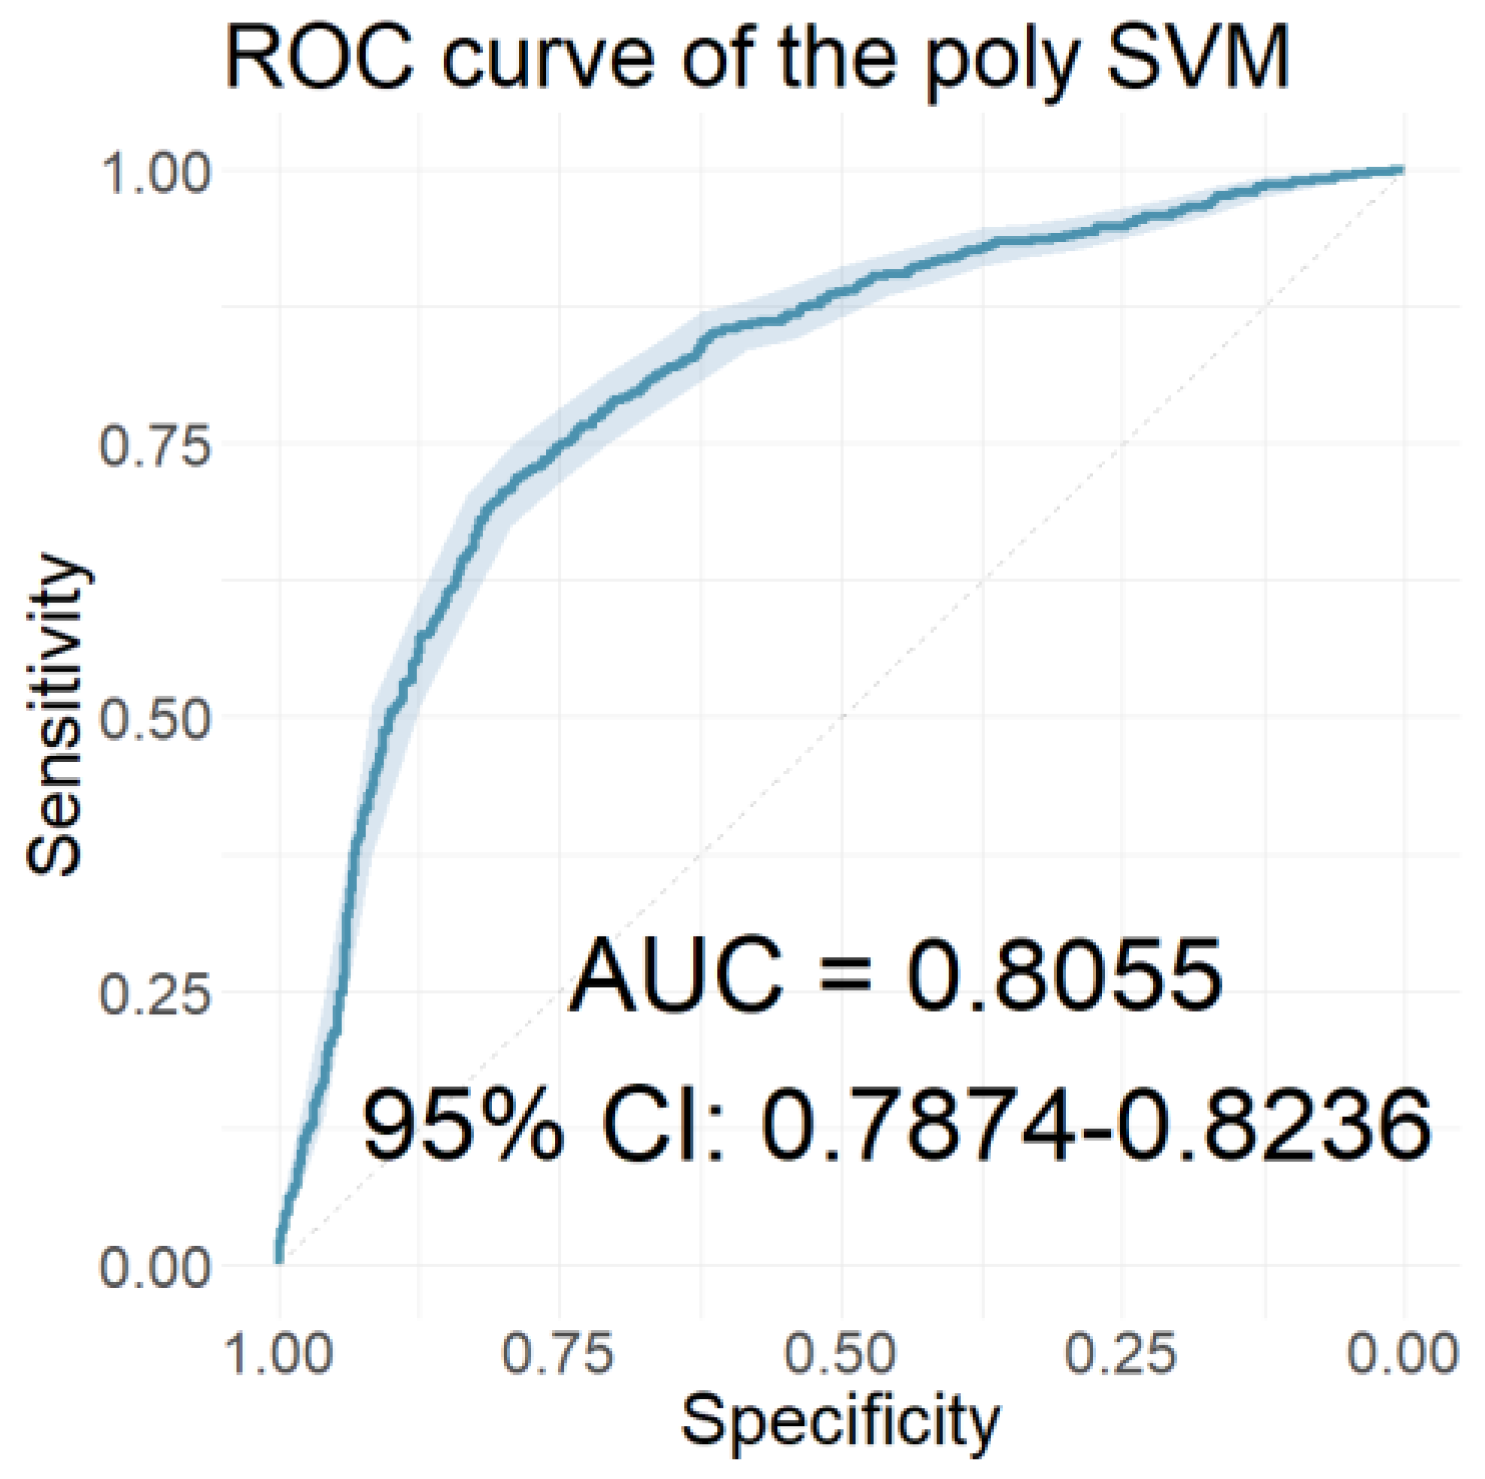
3.4.2. Time–Frequency-Domain Models
3.4.3. Integration of Clinical Features
3.4.4. Integrated Models Combining AEP and Clinical Features
4. Discussion
5. Conclusions
Supplementary Materials
Author Contributions
Funding
Institutional Review Board Statement
Informed Consent Statement
Data Availability Statement
Acknowledgments
Conflicts of Interest
References
- Cima, R.F.F.; Mazurek, B.; Haider, H.; Kikidis, D.; Lapira, A.; Noreña, A.; Hoare, D.J. A Multidisciplinary European Guideline for Tinnitus: Diagnostics, Assessment, and Treatment. HNO 2019, 67, 10–42. [Google Scholar] [CrossRef] [Green Version]
- Kreuzer, P.M.; Vielsmeier, V.; Langguth, B. Chronic Tinnitus: An Interdisciplinary Challenge. Dtsch. Arztebl. Int. 2013, 110, 278. [Google Scholar] [CrossRef] [PubMed] [Green Version]
- Gopinath, B.; McMahon, C.M.; Rochtchina, E.; Karpa, M.J.; Mitchell, P. Incidence, Persistence, and Progression of Tinnitus Symptoms in Older Adults: The Blue Mountains Hearing Study. Ear Hear. 2010, 31, 407–412. [Google Scholar] [CrossRef] [PubMed]
- Cima, R.F.F.; Kikidis, D.; Mazurek, B.; Haider, H.; Cederroth, C.R.; Norena, A.; Lapira, A.; Bibas, A.; Hoare, D.J. Tinnitus Healthcare: A Survey Revealing Extensive Variation in Opinion and Practices across Europe. BMJ Open 2020, 10, e029346. [Google Scholar] [CrossRef] [PubMed]
- Baguley, D.; McFerran, D.; Hall, D. Tinnitus. Lancet 2013, 382, 1600–1607. [Google Scholar] [CrossRef] [Green Version]
- Langguth, B.; Elgoyhen, A.B. Current Pharmacological Treatments for Tinnitus. Expert Opin. Pharmacother. 2012, 13, 2495–2509. [Google Scholar] [CrossRef]
- Person, O.C.; Veiga, F.; Junior, A.; Altoé, J.; Portes, L.M.; Lopes, P.R.; Dos, M.E.; Puga, S.; Clayton, O.; Brasileiros De Ciências Da, A.; et al. O Que Revisões Sistemáticas Cochrane Dizem Sobre Terapêutica Para Zumbido? ABCS Heal. Sci. 2022, 47, e022301. [Google Scholar] [CrossRef]
- Gallus, S.; Lugo, A.; Garavello, W.; Bosetti, C.; Santoro, E.; Colombo, P.; Perin, P.; La Vecchia, C.; Langguth, B. Prevalence and Determinants of Tinnitus in the Italian Adult Population. Neuroepidemiology 2015, 45, 12–19. [Google Scholar] [CrossRef] [Green Version]
- Nondahl, D.M.; Cruickshanks, K.J.; Huang, G.H.; Klein, B.E.K.; Klein, R.; Tweed, T.S.; Zhan, W. Generational Differences in the Reporting of Tinnitus. Ear Hear. 2012, 33, 640. [Google Scholar] [CrossRef] [Green Version]
- Hasson, D.; Theorell, T.; Westerlund, H.; Canlon, B. Prevalence and Characteristics of Hearing Problems in a Working and Non-Working Swedish Population. J. Epidemiol. Community Health 2010, 64, 453–460. [Google Scholar] [CrossRef]
- McFerran, D.; Hoare, D.J.; Carr, S.; Ray, J.; Stockdale, D. Tinnitus Services in the United Kingdom: A Survey of Patient Experiences. BMC Health Serv. Res. 2018, 18, 110. [Google Scholar] [CrossRef] [PubMed] [Green Version]
- Hoare, D.J.; Gander, P.E.; Collins, L.; Smith, S.; Hall, D.A. Management of Tinnitus in English NHS Audiology Departments: An Evaluation of Current Practice. J. Eval. Clin. Pract. 2012, 18, 326–334. [Google Scholar] [CrossRef] [Green Version]
- Hall, D.A.; Láinez, M.J.A.; Newman, C.W.; Sanchez, T.; Egler, M.; Tennigkeit, F.; Koch, M.; Langguth, B. Treatment Options for Subjective Tinnitus: Self Reports from a Sample of General Practitioners and ENT Physicians within Europe and the USA. BMC Health Serv. Res. 2011, 11, 302. [Google Scholar] [CrossRef] [PubMed] [Green Version]
- El-Shunnar, S.K.; Hoare, D.J.; Smith, S.; Gander, P.E.; Kang, S.; Fackrell, K.; Hall, D.A. Primary Care for Tinnitus: Practice and Opinion among GPs in England. J. Eval. Clin. Pract. 2011, 17, 684–692. [Google Scholar] [CrossRef] [PubMed] [Green Version]
- Cima: TINNET COST Action BM1306-Clinical WG1: Establishme—Google Scholar. Available online: https://scholar.google.com/scholar_lookup?title=Establishment of a standard for Tinnitus%3B patient assessment%2C characterization%2C and treatment options&publication_year=2016&author=Cima%2CRFF&author=Haider%2CH&author=Mazurek%2CB&author=Cederroth%2CCR&author=Lapira%2CA&author=Kikidis%2CD&author=Noreña%2CA (accessed on 15 October 2022).
- Elgoyhen, A.B.; Langguth, B.; De Ridder, D.; Vanneste, S. Tinnitus: Perspectives from Human Neuroimaging. Nat. Rev. Neurosci. 2015, 16, 632–642. [Google Scholar] [CrossRef] [PubMed]
- Sarafidis, M.; Manta, O.; Kouris, I.; Schlee, W.; Kikidis, D.; Vellidou, E.; Koutsouris, D. Why a Clinical Decision Support System Is Needed for Tinnitus. In Proceedings of the 2021 43rd Annual International Conference of the IEEE Engineering in Medicine & Biology Society (EMBC), Online, 1–5 November 2021; pp. 2075–2078. [Google Scholar] [CrossRef]
- Schlee, W.; Schoisswohl, S.; Staudinger, S.; Schiller, A.; Lehner, A.; Langguth, B.; Schecklmann, M.; Simoes, J.; Neff, P.; Marcrum, S.C.; et al. Towards a unification of treatments and interventions for tinnitus patients: The EU research and innovation action UNITI. In Progress in Brain Research; Elsevier B.V.: Amsterdam, The Netherlands, 2021; Volume 260, pp. 441–451. ISBN 9780128215869. [Google Scholar]
- Husain, F.T.; Gander, P.E.; Jansen, J.N.; Shen, S. Expectations for Tinnitus Treatment and Outcomes: A Survey Study of Audiologists and Patients. J. Am. Acad. Audiol. 2018, 29, 313–336. [Google Scholar] [CrossRef] [PubMed]
- Cima, R.F.F. Stress-related tinnitus treatment protocols. In Tinnitus and Stress: An Interdisciplinary Companion for Healthcare Professionals; Springer: Berlin/Heidelberg, Germany, 2017; pp. 139–172. [Google Scholar] [CrossRef]
- Humes, L.E.; Rogers, S.E.; Quigley, T.M.; Main, A.K.; Kinney, D.L.; Herring, C. The Effects of Service-Delivery Model and Purchase Price on Hearing-Aid Outcomes in Older Adults: A Randomized Double-Blind Placebo-Controlled Clinical Trial. Am. J. Audiol. 2017, 26, 53–79. [Google Scholar] [CrossRef] [PubMed] [Green Version]
- Manta, O.; Sarafidis, M.; Schlee, W.; Consoulas, C.; Kikidis, D.; Koutsouris, D. Electrophysiological Differences in Distinct Hearing Threshold Level Individuals with and without Tinnitus Distress. In Proceedings of the 2022 44th Annual International Conference of the IEEE Engineering in Medicine & Biology Society (EMBC), Glasgow, UK, 11–15 July 2022; Volume 2022, pp. 1630–1633. [Google Scholar] [CrossRef]
- Searchfield, G.D.; Zhang, J. The Behavioral Neuroscience of Tinnitus; Springer: Berlin/Heidelberg, Germany, 2021; Volume 51. [Google Scholar] [CrossRef]
- Zhang, L.; Wu, C.; Martel, D.T.; West, M.; Sutton, M.A.; Shore, S.E. Noise Exposure Alters Glutamatergic and GABAergic Synaptic Connectivity in the Hippocampus and Its Relevance to Tinnitus. Neural Plast. 2021, 2021, 8833087. [Google Scholar] [CrossRef] [PubMed]
- Picton, T.W.; John, M.S.; Purcell, D.W.; Plourde, G. Human Auditory Steady-State Responses: The Effects of Recording Technique and State of Arousal. Anesth. Analg. 2003, 97, 1396–1402. [Google Scholar] [CrossRef]
- Paulraj, M.P.; Subramaniam, K.; Bin Yaccob, S.; Bin Adom, A.H.; Hema, C.R. Auditory Evoked Potential Response and Hearing Loss: A Review. Open Biomed. Eng. J. 2015, 9, 17. [Google Scholar] [CrossRef] [Green Version]
- Polonenko, M.J.; Maddox, R.K. The Parallel Auditory Brainstem Response. Trends Hear. 2019, 23, 17. [Google Scholar] [CrossRef] [PubMed] [Green Version]
- Hall, J.W. (Ed.) Handbook of Auditory Evoked Responses; Pearson Education, Inc.: New York, NY, USA, 2015; ISBN 0205135668. [Google Scholar]
- Sörnmo, L.; Laguna, P. Evoked Potentials. In Bioelectrical Signal Processing in Cardiac and Neurological Applications; Academic Press: Cambridge, MA, USA, 2005; pp. 181–336. [Google Scholar] [CrossRef]
- Winkler, I.; Denham, S.; Escera, C. Auditory Event-Related Potentials. In Encyclopedia of Computational Neuroscience; Springer: New York, NY, USA, 2013; pp. 1–29. [Google Scholar] [CrossRef] [Green Version]
- Young, A.; Cornejo, J.; Spinner, A. Auditory Brainstem Response; StatPearls Publishing: Treasure Island, FL, USA, 2022. [Google Scholar]
- Milloy, V.; Fournier, P.; Benoit, D.; Noreña, A.; Koravand, A. Auditory Brainstem Responses in Tinnitus: A Review of Who, How, and What? Front. Aging Neurosci. 2017, 9, 237. [Google Scholar] [CrossRef] [PubMed] [Green Version]
- Melcher, J.R.; Kiang, N.Y.S. Generators of the Brainstem Auditory Evoked Potential in Cat. III: Identified Cell Populations. Hear. Res. 1996, 93, 52–71. [Google Scholar] [CrossRef]
- Chalak, S.; Kale, A.; Deshpande, V.K.; Biswas, D.A. Establishment of Normative Data for Monaural Recordings of Auditory Brainstem Response and Its Application in Screening Patients with Hearing Loss: A Cohort Study. J. Clin. Diagn. Res. 2013, 7, 2677–2679. [Google Scholar] [CrossRef]
- Schoisswohl, S.; Langguth, B.; Schecklmann, M.; Bernal-Robledano, A.; Boecking, B.; Cederroth, C.R.; Chalanouli, D.; Cima, R.; Denys, S.; Dettling-Papargyris, J.; et al. Unification of Treatments and Interventions for Tinnitus Patients (UNITI): A Study Protocol for a Multi-Center Randomized Clinical Trial. Trials 2021, 22, 875. [Google Scholar] [CrossRef] [PubMed]
- Watson, D.R. The Effects of Cochlear Hearing Loss, Age and Sex on the Auditory Brainstem Response. Int. J. Audiol. 2007, 35, 246–258. [Google Scholar] [CrossRef] [PubMed]
- Konadath, S.; Manjula, P. Auditory Brainstem Response and Late Latency Response in Individuals with Tinnitus Having Normal Hearing. Intractable Rare Dis. Res. 2016, 5, 262–268. [Google Scholar] [CrossRef] [Green Version]
- Eggermont, J.J. Auditory Brainstem Response. Handb. Clin. Neurol. 2019, 160, 451–464. [Google Scholar] [CrossRef]
- McFadden, D.; Champlin, C.A.; Pho, M.H.; Pasanen, E.G.; Malone, M.M.; Leshikar, E.M. Auditory Evoked Potentials: Differences by Sex, Race, and Menstrual Cycle and Correlations with Common Psychoacoustical Tasks. PLoS ONE 2021, 16, e0251363. [Google Scholar] [CrossRef]
- Nahak, S.; Pathak, A.; Saha, G. Fragment-Level Classification of ECG Arrhythmia Using Wavelet Scattering Transform. Expert Syst. Appl. 2023, 224, 120019. [Google Scholar] [CrossRef]
- Schlee, W.; Langguth, B.; Pryss, R.; Allgaier, J.; Mulansky, L.; Vogel, C.; Spiliopoulou, M.; Schleicher, M.; Unnikrishnan, V.; Puga, C.; et al. Using Big Data to Develop a Clinical Decision Support System for Tinnitus Treatment. Curr. Top. Behav. Neurosci. 2021, 51, 175–189. [Google Scholar] [PubMed]
- Nasreddine, Z.S.; Phillips, N.A.; Bédirian, V.; Charbonneau, S.; Whitehead, V.; Collin, I.; Cummings, J.L.; Chertkow, H. The Montreal Cognitive Assessment, MoCA: A Brief Screening Tool For Mild Cognitive Impairment. J. Am. Geriatr. Soc. 2005, 53, 695–699. [Google Scholar] [CrossRef] [PubMed]
- Newman, C.W.; Jacobson, G.P.; Spitzer, J.B. Development of the Tinnitus Handicap Inventory. Arch. Otolaryngol. Neck Surg. 1996, 122, 143–148. [Google Scholar] [CrossRef] [PubMed]
- Interacoustics Eclipse EP25 Manuals|ManualsLib. Available online: https://www.manualslib.com/products/Interacoustics-Eclipse-Ep25-11647463.html (accessed on 18 October 2022).
- Ballas, A.; Katrakazas, P. Ωto_abR: A Web Application for the Visualization and Analysis of Click-Evoked Auditory Brainstem Responses. Digital 2021, 1, 188–197. [Google Scholar] [CrossRef]
- Lang, D.T. Tools for Parsing and Generating XML Within R and S-Plus [R Package XML Version 3.99-0.11]. 2022. Available online: https://cran.r-project.org/web/packages/XML/index.html (accessed on 25 May 2023).
- Parse XML [R Package Xml2 Version 1.3.3]. 2021. Available online: https://cran.r-project.org/web/packages/xml2/index.html (accessed on 25 May 2023).
- Wickham, H. Ggplot2; Springer: New York, NY, USA, 2016. [Google Scholar] [CrossRef]
- R-Forge: Signal: Project Home. Available online: https://r-forge.r-project.org/projects/signal/ (accessed on 18 October 2022).
- Sueur, J.; Aubin, T.; Simonis, C. Seewave, a Free Modular Tool For Sound Analysis and Synthesis. Bioacoustics 2012, 18, 213–226. [Google Scholar] [CrossRef]
- Analysis of Music and Speech [R Package TuneR Version 1.4.0]. 2022. Available online: https://rdrr.io/cran/tuneR/ (accessed on 25 May 2023).
- Van Boxtel, G. Gsignal: Signal Processing. 2021. Available online: https://cran.r-project.org/web/packages/gsignal/gsignal.pdf (accessed on 25 May 2023).
- John, D.; Tang, Q.; Albinali, F.; Intille, S. An Open-Source Monitor-Independent Movement Summary for Accelerometer Data Processing. J. Meas. Phys. Behav. 2019, 2, 268–281. [Google Scholar] [CrossRef]
- Base Package—RDocumentation. Available online: https://rdocumentation.org/packages/base/versions/3.6.2 (accessed on 18 October 2022).
- Fan, S.; Li, S. Objective Detection of Tinnitus Based on Electrophysiology. Brain Sci. 2022, 12, 12. [Google Scholar] [CrossRef]
- Manta, O.; Sarafidis, M.; Vasileiou, N.; Schlee, W.; Consoulas, C.; Kikidis, D.; Vassou, E.; Matsopoulos, G.K.; Koutsouris, D.D. Development and Evaluation of Automated Tools for Auditory-Brainstem and Middle-Auditory Evoked Potentials Waves Detection and Annotation. Brain Sci. 2022, 12, 1675. [Google Scholar] [CrossRef]
- Fox, J. Applied Regression Analysis and Generalized Linear Models; SAGE Publications: London, UK, 2016; ISBN 1452205663. [Google Scholar]
- Fox, J.; Weisberg, S. An R Companion to Applied Regression; SAGE Publications: London, UK, 2019; ISBN 1544336470. [Google Scholar]
- RDocumentation. T.Test Function. Available online: https://www.rdocumentation.org/packages/stats/versions/3.6.2/topics/t.test (accessed on 24 October 2022).
- Aoki, S. Effect Sizes of the Differences between Means without Assuming Variance Equality and between a Mean and a Constant. Heliyon 2020, 6, e03306. [Google Scholar] [CrossRef] [Green Version]
- Marco Torchiano, M. Package “effsize” Type Package Title Efficient Effect Size Computation. 2022. Available online: https://cran.r-project.org/web/packages/effsize/effsize.pdf (accessed on 25 May 2023).
- Soro, B.; Lee, C. A Wavelet Scattering Feature Extraction Approach for Deep Neural Network Based Indoor Fingerprinting Localization. Sensors 2019, 19, 1790. [Google Scholar] [CrossRef] [Green Version]
- Mallat, S. Group Invariant Scattering. Commun. Pure Appl. Math. 2012, 65, 1331–1398. [Google Scholar] [CrossRef] [Green Version]
- Liu, Z.; Yao, G.; Zhang, Q.; Zhang, J.; Zeng, X. Wavelet Scattering Transform for ECG Beat Classification. Comput. Math. Methods Med. 2020, 2020, 3215681. [Google Scholar] [CrossRef] [PubMed]
- Bruna, J.; Mallat, S. Invariant Scattering Convolution Networks. IEEE Trans. Pattern Anal. Mach. Intell. 2013, 35, 1872–1886. [Google Scholar] [CrossRef] [PubMed] [Green Version]
- Wang, J.; Zhang, X.; Gao, Q.; Ma, X.; Feng, X.; Wang, H. Device-Free Simultaneous Wireless Localization & Activity Recognition with Wavelet Feature. IEEE Trans. Veh. Technol. 2017, 66, 1659–1669. [Google Scholar] [CrossRef]
- Oyallon, E.; Belilovsky, E.; Zagoruyko, S. Scaling the Scattering Transform: Deep Hybrid Networks. In Proceedings of the IEEE International Conference on Computer Vision (ICCV), Venice, Italy, 22–29 October 2017; pp. 5618–5627. [Google Scholar] [CrossRef]
- Mallat, S. Understanding Deep Convolutional Networks. Philos. Trans. A. Math. Phys. Eng. Sci. 2016, 374, 20150203. [Google Scholar] [CrossRef] [PubMed] [Green Version]
- MATLAB. Understanding Wavelets, Part 5: Machine Learning and Deep Learning with Wavelet Scattering Video. Available online: https://www.mathworks.com/videos/understanding-wavelets-part-5-machine-learning-and-deep-learning-with-wavelet-scattering-1577170399650.html (accessed on 13 October 2022).
- Buriro, A.B.; Ahmed, B.; Baloch, G.; Ahmed, J.; Shoorangiz, R.; Weddell, S.J.; Jones, R.D. Classification of Alcoholic EEG Signals Using Wavelet Scattering Transform-Based Features. Comput. Biol. Med. 2021, 139, 104969. [Google Scholar] [CrossRef]
- Bruna, J.; Mallat, S. Classification with Scattering Operators. In Proceedings of the IEEE Conference on Computer Vision and Pattern Recognition (CVPR 2011), Colorado Springs, CO, USA, 20–25 June 2011; pp. 1561–1566. [Google Scholar] [CrossRef] [Green Version]
- Ahmad, M.Z.; Kamboh, A.M.; Saleem, S.; Khan, A.A. Mallat’s Scattering Transform Based Anomaly Sensing for Detection of Seizures in Scalp EEG. IEEE Access 2017, 5, 16919–16929. [Google Scholar] [CrossRef]
- Wavelet Time Scattering for ECG Signal Classification—MATLAB & Simulink Example. Available online: https://www.mathworks.com/help/wavelet/ug/ecg-signal-classification-using-wavelet-time-scattering.html (accessed on 1 November 2022).
- Wavelet Scattering—MATLAB & Simulink. Available online: https://www.mathworks.com/help/wavelet/ug/wavelet-scattering.html (accessed on 1 November 2022).
- Susu, A.A.; Agboola, H.A.; Solebo, C.; Lesi, F.E.A.; Aribike, D.S. Wavelet Time Scattering Based Classification of Interictal and Preictal EEG Signals. J. Brain Res. 2020, 3, 1–9. [Google Scholar]
- Wavelet Time Scattering Classification of Phonocardiogram Data—MATLAB & Simulink Example. Available online: https://www.mathworks.com/help/wavelet/ug/wavelet-time-scattering-classification-of-phonocardiogram-data.html (accessed on 1 November 2022).
- Mei, N.; Wang, H.; Zhang, Y.; Liu, F.; Jiang, X.; Wei, S. Classification of Heart Sounds Based on Quality Assessment and Wavelet Scattering Transform. Comput. Biol. Med. 2021, 137, 104814. [Google Scholar] [CrossRef]
- British Society of Audiology—BSA. Available online: https://www.thebsa.org.uk/ (accessed on 4 November 2022).
- Meikle, M.B.; Henry, J.A.; Griest, S.E.; Stewart, B.J.; Abrams, H.B.; McArdle, R.; Myers, P.J.; Newman, C.W.; Sandridge, S.; Turk, D.C.; et al. The Tinnitus Functional Index: Development of a New Clinical Measure for Chronic, Intrusive Tinnitus. Ear Hear. 2012, 33, 153–176. [Google Scholar] [CrossRef]
- Coles: Tinnitus Severity Gradings: Cross-Sectional Studies—Google Scholar. Available online: https://scholar.google.com/scholar_lookup?title=Tinnitus severity gradings%3A cross sectional studies&pages=453-455&publication_year=1991&author=Coles%2CRRA&author=Lutman%2CME&author=Axelsson%2CA&author=Hazell%2CJWP (accessed on 8 September 2021).
- Hallam, R.S. Manual of the Tinnitus Questionnaire. 1996. Available online: https://scholar.google.com/scholar?hl=en&as_sdt=0%2C5&q=Hallam+RS+%281996%29+Manual+of+the+tinnitus+questionnaire+%28TQ%29.+Psychological+Corporation%2C+London&btnG= (accessed on 8 September 2021).
- Psychological Aspects of Tinnitus. Available online: https://www.researchgate.net/publication/306164435_Psychological_aspects_of_tinnitus (accessed on 14 October 2021).
- Fackrell, K.; Fearnley, C.; Hoare, D.J.; Sereda, M. Hyperacusis Questionnaire as a Tool for Measuring Hypersensitivity to Sound in a Tinnitus Research Population. Biomed Res. Int. 2015, 2015, 290425. [Google Scholar] [CrossRef] [PubMed] [Green Version]
- Anari, M.; Axelsson, A.; Eliasson, A.; Magnusson, L. Hypersensitivity to Sound--Questionnaire Data, Audiometry and Classification. Scand. Audiol. 1999, 28, 219–230. [Google Scholar] [CrossRef] [PubMed]
- Kroenke, K.; Spitzer, R.L.; Williams, J.B.W. The PHQ-9: Validity of a Brief Depression Severity Measure. J. Gen. Intern. Med. 2001, 16, 606. [Google Scholar] [CrossRef] [PubMed]
- The World Health Organization. WHOQOL—Measuring Quality of Life. Available online: https://www.who.int/tools/whoqol (accessed on 4 November 2022).
- Genitsaridi, E.; Partyka, M.; Gallus, S.; Lopez-Escamez, J.A.; Schecklmann, M.; Mielczarek, M.; Trpchevska, N.; Santacruz, J.L.; Schoisswohl, S.; Riha, C.; et al. Standardised Profiling for Tinnitus Research: The European School for Interdisciplinary Tinnitus Research Screening Questionnaire (ESIT-SQ). Hear. Res. 2019, 377, 353–359. [Google Scholar] [CrossRef]
- Malpass, A.; Wiles, N.; Dowrick, C.; Robinson, J.; Gilbody, S.; Duffy, L.; Lewis, G. Usefulness of PHQ-9 in Primary Care to Determine Meaningful Symptoms of Low Mood: A Qualitative Study. Br. J. Gen. Pract. 2016, 66, e78–e84. [Google Scholar] [CrossRef] [PubMed] [Green Version]
- Ford, J.; Thomas, F.; Byng, R.; McCabe, R. Use of the Patient Health Questionnaire (PHQ-9) in Practice: Interactions between Patients and Physicians. Qual. Health Res. 2020, 30, 2146–2159. [Google Scholar] [CrossRef] [PubMed]
- Bläsing, L.; Goebel, G.; Flötzinger, U.; Berthold, A.; Kröner-Herwig, B. Hypersensitivity to Sound in Tinnitus Patients: An Analysis of a Construct Based on Questionnaire and Audiological Data. Int. J. Audiol. 2010, 49, 518–526. [Google Scholar] [CrossRef]
- Tharwat, A.; Gaber, T.; Ibrahim, A.; Hassanien, A.E. Linear Discriminant Analysis: A Detailed Tutorial. AI Commun. 2017, 30, 169–190. [Google Scholar] [CrossRef] [Green Version]
- Caie, P.D.; Dimitriou, N.; Arandjelović, O. Precision Medicine in Digital Pathology via Image Analysis and Machine Learning. In Artificial Intelligence and Deep Learning in Pathology; Elsevier: Amsterdam, The Netherlands, 2021; pp. 149–173. [Google Scholar] [CrossRef]
- Naive Bayes—Scikit-Learn 1.1.3 Documentation. Available online: https://scikit-learn.org/stable/modules/naive_bayes.html (accessed on 7 December 2022).
- Chen, L. Support Vector Machine—Simply Explained towards Data Science. Available online: https://towardsdatascience.com/support-vector-machine-simply-explained-fee28eba5496 (accessed on 7 December 2022).
- Knocklein, O. Classification Using Neural Networks towards Data Science. Available online: https://towardsdatascience.com/classification-using-neural-networks-b8e98f3a904f (accessed on 7 December 2022).
- Powers, D.M.W. Evaluation: From Precision, Recall and F-Measure to ROC, Informedness, Markedness and Correlation. Int. J. Mach. Learn. Technol. 2020, 2, 37–63. [Google Scholar] [CrossRef]
- Huang, J.; Ling, C.X. Using AUC and Accuracy in Evaluating Learning Algorithms. IEEE Trans. Knowl. Data Eng. 2005, 17, 299–310. [Google Scholar] [CrossRef] [Green Version]
- Friedman, J.; Hastie, T.; Tibshirani, R. Regularization Paths for Generalized Linear Models via Coordinate Descent. J. Stat. Softw. 2010, 33, 1–22. [Google Scholar] [CrossRef] [PubMed] [Green Version]
- Biesinger, E.; Heiden, C.; Greimel, V.; Lendle, T.; Hoing, R.; Albegger, K. Strategies in Ambulatory Treatment of Tinnitus. HNO 1998, 46, 157–169. [Google Scholar] [CrossRef] [PubMed]
- Theodoroff, S.M. Tinnitus Questionnaires for Research and Clinical Use. Curr. Top. Behav. Neurosci. 2021, 51, 403–418. [Google Scholar] [CrossRef]
- Strategien in Der Ambulaten Behandlung Des Tinnitus. Available online: https://www.infona.pl/resource/bwmeta1.element.springer-4546a6c9-8888-3eef-af2d-3c006bff692d (accessed on 8 September 2021).
- Tinnitus—Ear, Nose, and Throat Disorders—MSD Manual Professional Edition. Available online: https://www.msdmanuals.com/professional/ear,-nose,-and-throat-disorders/approach-to-the-patient-with-ear-problems/tinnitus?query=tinnitus (accessed on 17 November 2022).
- Musiek, F.; Nagle, S. The Middle Latency Response: A Review of Findings in Various Central Nervous System Lesions. J. Am. Acad. Audiol. 2018, 29, 855–867. [Google Scholar] [CrossRef] [PubMed]
- Cardon, E.; Joossen, I.; Vermeersch, H.; Jacquemin, L.; Mertens, G.; Vanderveken, O.M.; Topsakal, V.; Van De Heyning, P.; Van Rompaey, V.; Gilles, A. Systematic Review and Meta-Analysis of Late Auditory Evoked Potentials as a Candidate Biomarker in the Assessment of Tinnitus. PLoS ONE 2020, 15, e0243785. [Google Scholar] [CrossRef]
- De Azevedo, A.A.; Figueiredo, R.R.; Penido, N. de O. Tinnitus and Event Related Potentials: A Systematic Review. Braz. J. Otorhinolaryngol. 2020, 86, 119–126. [Google Scholar] [CrossRef]
- Dos Santos Filha, V.A.V.; Samelli, A.G.; Matas, C.G. Middle Latency Auditory Evoked Potential (MLAEP) in Workers with and without Tinnitus Who Are Exposed to Occupational Noise. Med. Sci. Monit. 2015, 21, 2701–2706. [Google Scholar] [CrossRef] [Green Version]


| Inclusion Criteria |
|
|
|
|
|
|
|
|
|
| Exclusion Criteria |
|
|
|
|
|
|
|
|
|
|
|
| ABR | |||
| Stimulus Parameters | Acquisition Parameters | ||
| Type of transducer | Insert phone | Analysis time | 15 ms |
| Sample rate | 30 kHz | Sweeps | 4000 |
| Type of stimulus | Click | Mode | Monaural |
| Polarity | Alternate | Electrode montage | Vertical (Fpz, Cz, M1/M2) |
| Repetition rate | Stimuli per second: 22 Hz | Filter setting for input amplifier | Low Pass: 1500 Hz; high Pass: 33 Hz, 6 dB per octave |
| Intensity | 80 dB nHL | Preliminary display settings | Low pass: 1500 Hz;high Pass: 150 Hz |
| Masking | Off | ||
| AMLR | |||
| Stimulus Parameters | Acquisition Parameters | ||
| Type of transducer | Insert phone | Analysis time | 150 ms |
| Sample rate | 3 kHz | Sweeps | 500 |
| Type of stimulus | 2 kHz Tone Burst, Manual window | Mode | Monaural |
| Duration of stimulus | total of 28 sine waves; rise/fall: 4; plateau: 20 | Electrode montage | Vertical (Fpz, Cz, M1/M2) |
| Polarity | Rarefaction | Filter setting for input amplifier | Low Pass: 1500 Hz; high Pass: 10 Hz, 12 dB per octave |
| Repetition rate | Stimuli per second: 6.1 Hz | Preliminary display settings | Low pass: 100 Hz; high Pass: 15 Hz |
| Intensity | 70 dB nHL | ||
| Masking | Off | ||
| Number of Features | Description | Type of Values |
|---|---|---|
| 40 | ABR scattering coefficients | Numeric |
| 65 | AMLR scattering coefficients | Numeric |
| 105 | ABR and AMLR scattering coefficients | Numeric |
| Description | Range of Values | |
|---|---|---|
| 1 | III peak latency | Numeric |
| 2 | V peak latency | Numeric |
| 3 | I peak amplitude | Numeric |
| 4 | V peak amplitude | Numeric |
| 5 | Pa peak latency | Numeric |
| 6 | Nb trough latency | Numeric |
| 7 | Pb peak latency | Numeric |
| 8 | Na trough amplitude | Numeric |
| 9 | Pa peak amplitude | Numeric |
| 10 | Nb trough amplitude | Numeric |
| 11 | Pb peak amplitude | Numeric |
| Machine Learning Classifier | No of Features | AUC | Sensitivity | Specificity |
|---|---|---|---|---|
| LDA | 11 | 0.7213 | 0.7879 | 0.5411 |
| Linear SVM | 11 | 0.7131 | 0.7895 | 0.5171 |
| NB | 11 | 0.7482 | 0.7394 | 0.6410 |
| NN | 11 | 0.7300 | 0.7220 | 0.6578 |
| Poly SVM | 11 | 0.7462 | 0.8359 | 0.5516 |
| Radial SVM | 11 | 0.7667 | 0.7762 | 0.6619 |
| RF | 11 | 0.8532 | 0.8097 | 0.7005 |
| Machine-Learning Classifier | No. of Features | AUC | Sensitivity | Specificity |
|---|---|---|---|---|
| LDA | 40 | 0.7970 | 0.7743 | 0.6639 |
| Linear SVM | 40 | 0.8023 | 0.7897 | 0.6322 |
| NB | 40 | 0.6522 | 0.4767 | 0.7234 |
| NN | 40 | 0.7986 | 0.7609 | 0.6796 |
| Poly SVM | 40 | 0.8055 | 0.8302 | 0.6729 |
| Radial SVM | 40 | 0.7331 | 0.7498 | 0.5858 |
| RF | 40 | 0.7923 | 0.7762 | 0.6819 |
| Machine-Learning Classifier | No. of Features | AUC | Sensitivity | Specificity |
|---|---|---|---|---|
| LDA | 65 | 0.8715 | 0.8009 | 0.7849 |
| Linear SVM | 65 | 0.8459 | 0.8122 | 0.7374 |
| NB | 65 | 0.7464 | 0.6560 | 0.7450 |
| NN | 65 | 0.8595 | 0.8167 | 0.7722 |
| Poly SVM | 65 | 0.8816 | 0.8335 | 0.7711 |
| Radial SVM | 65 | 0.8836 | 0.8257 | 0.7618 |
| RF | 65 | 0.8913 | 0.8192 | 0.8101 |
| Machine-Learning Classifier | No. of Features | AUC | Sensitivity | Specificity |
|---|---|---|---|---|
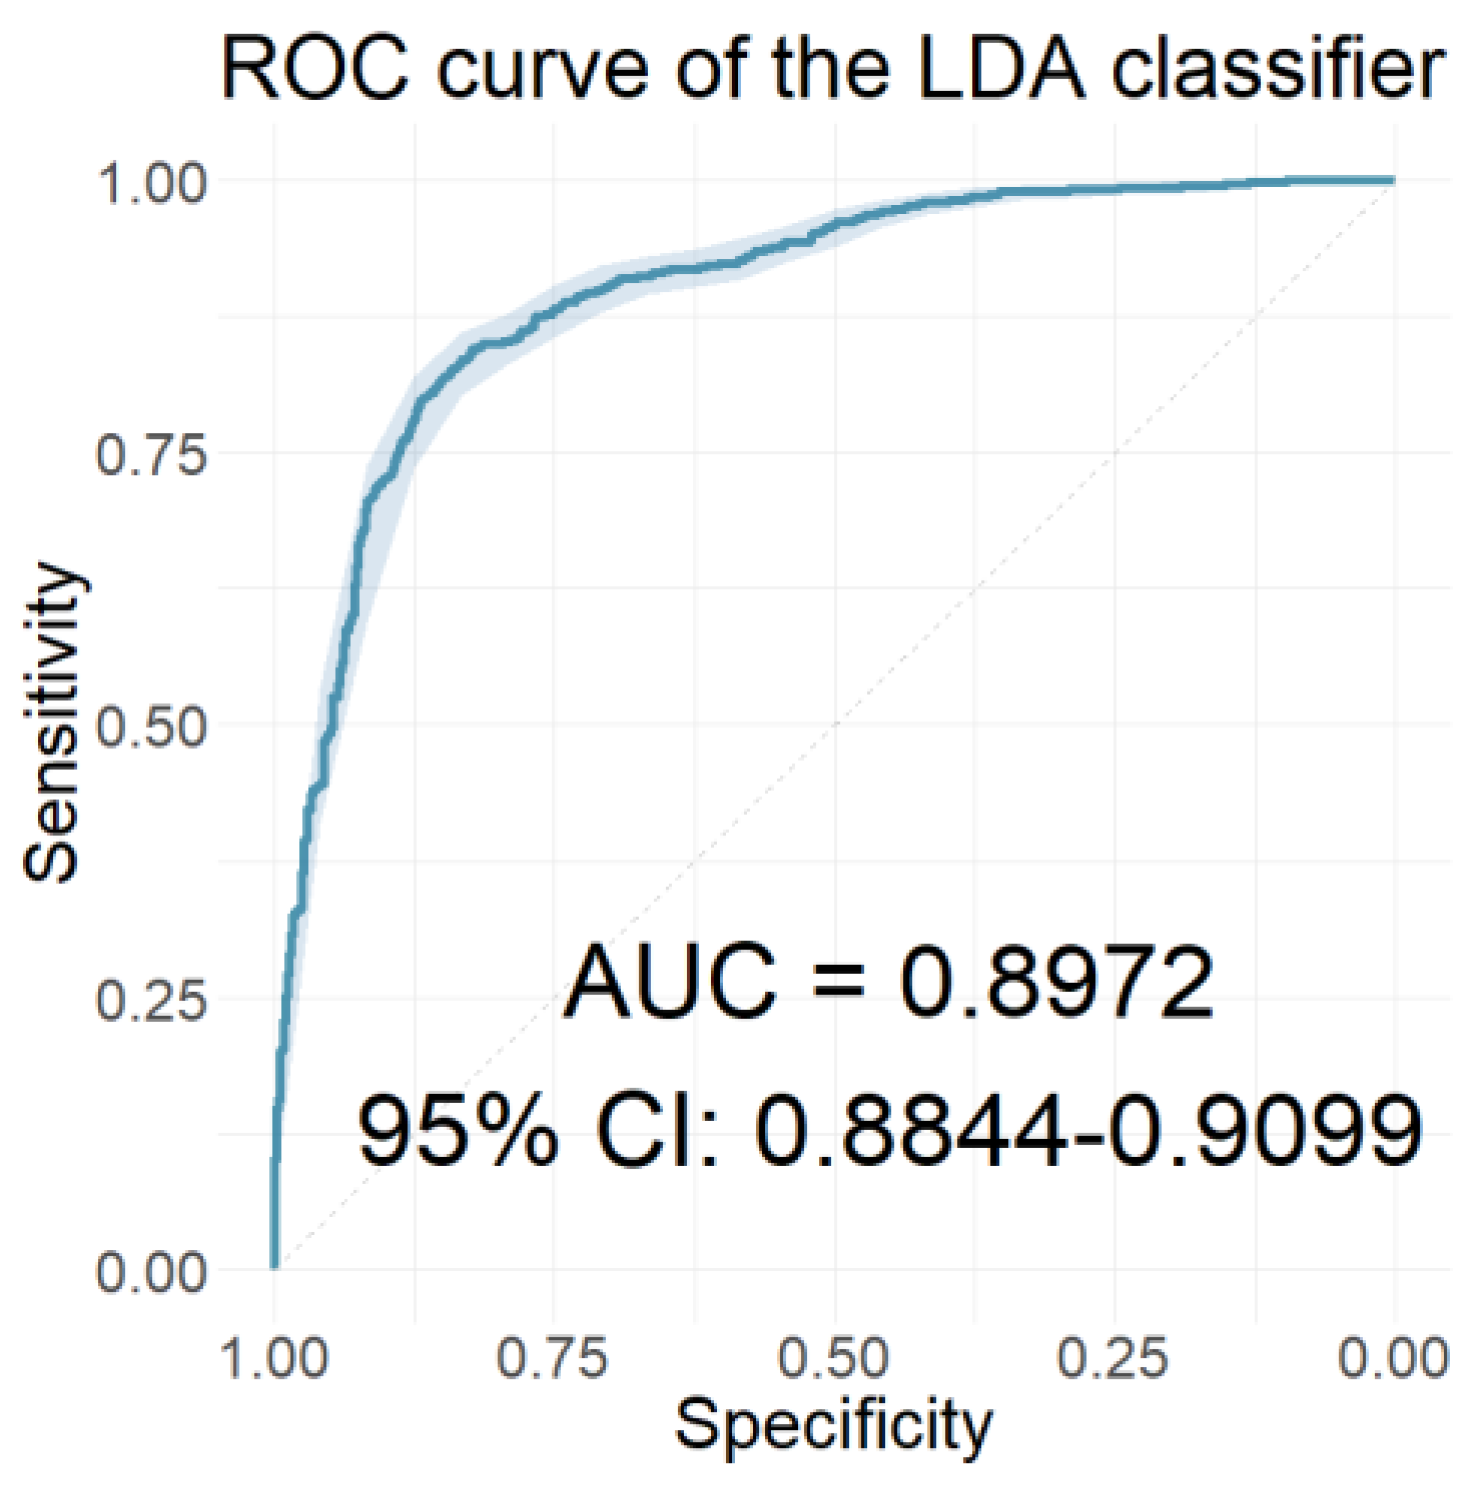
| LDA | 105 | 0.8972 | 0.8486 | 0.8161 |
| Linear SVM | 105 | 0.8902 | 0.8622 | 0.8040 |
| NB | 105 | 0.7441 | 0.6293 | 0.7488 |
| NN | 105 | 0.8926 | 0.8295 | 0.8158 |
| Poly SVM | 105 | 0.8966 | 0.8526 | 0.7934 |
| Radial SVM | 105 | 0.8703 | 0.8234 | 0.7418 |
| RF | 105 | 0.8903 | 0.8260 | 0.7887 |
| Machine-Learning Classifier | No. of Features | AUC | Sensitivity | Specificity |
|---|---|---|---|---|
| LDA | 33 | 0.6981 | 0.7310 | 0.5495 |
| Linear SVM | 33 | 0.6834 | 0.7789 | 0.4508 |
| NB | 33 | 0.6928 | 0.7771 | 0.4466 |
| NN | 33 | 0.5368 | 0.7256 | 0.3154 |
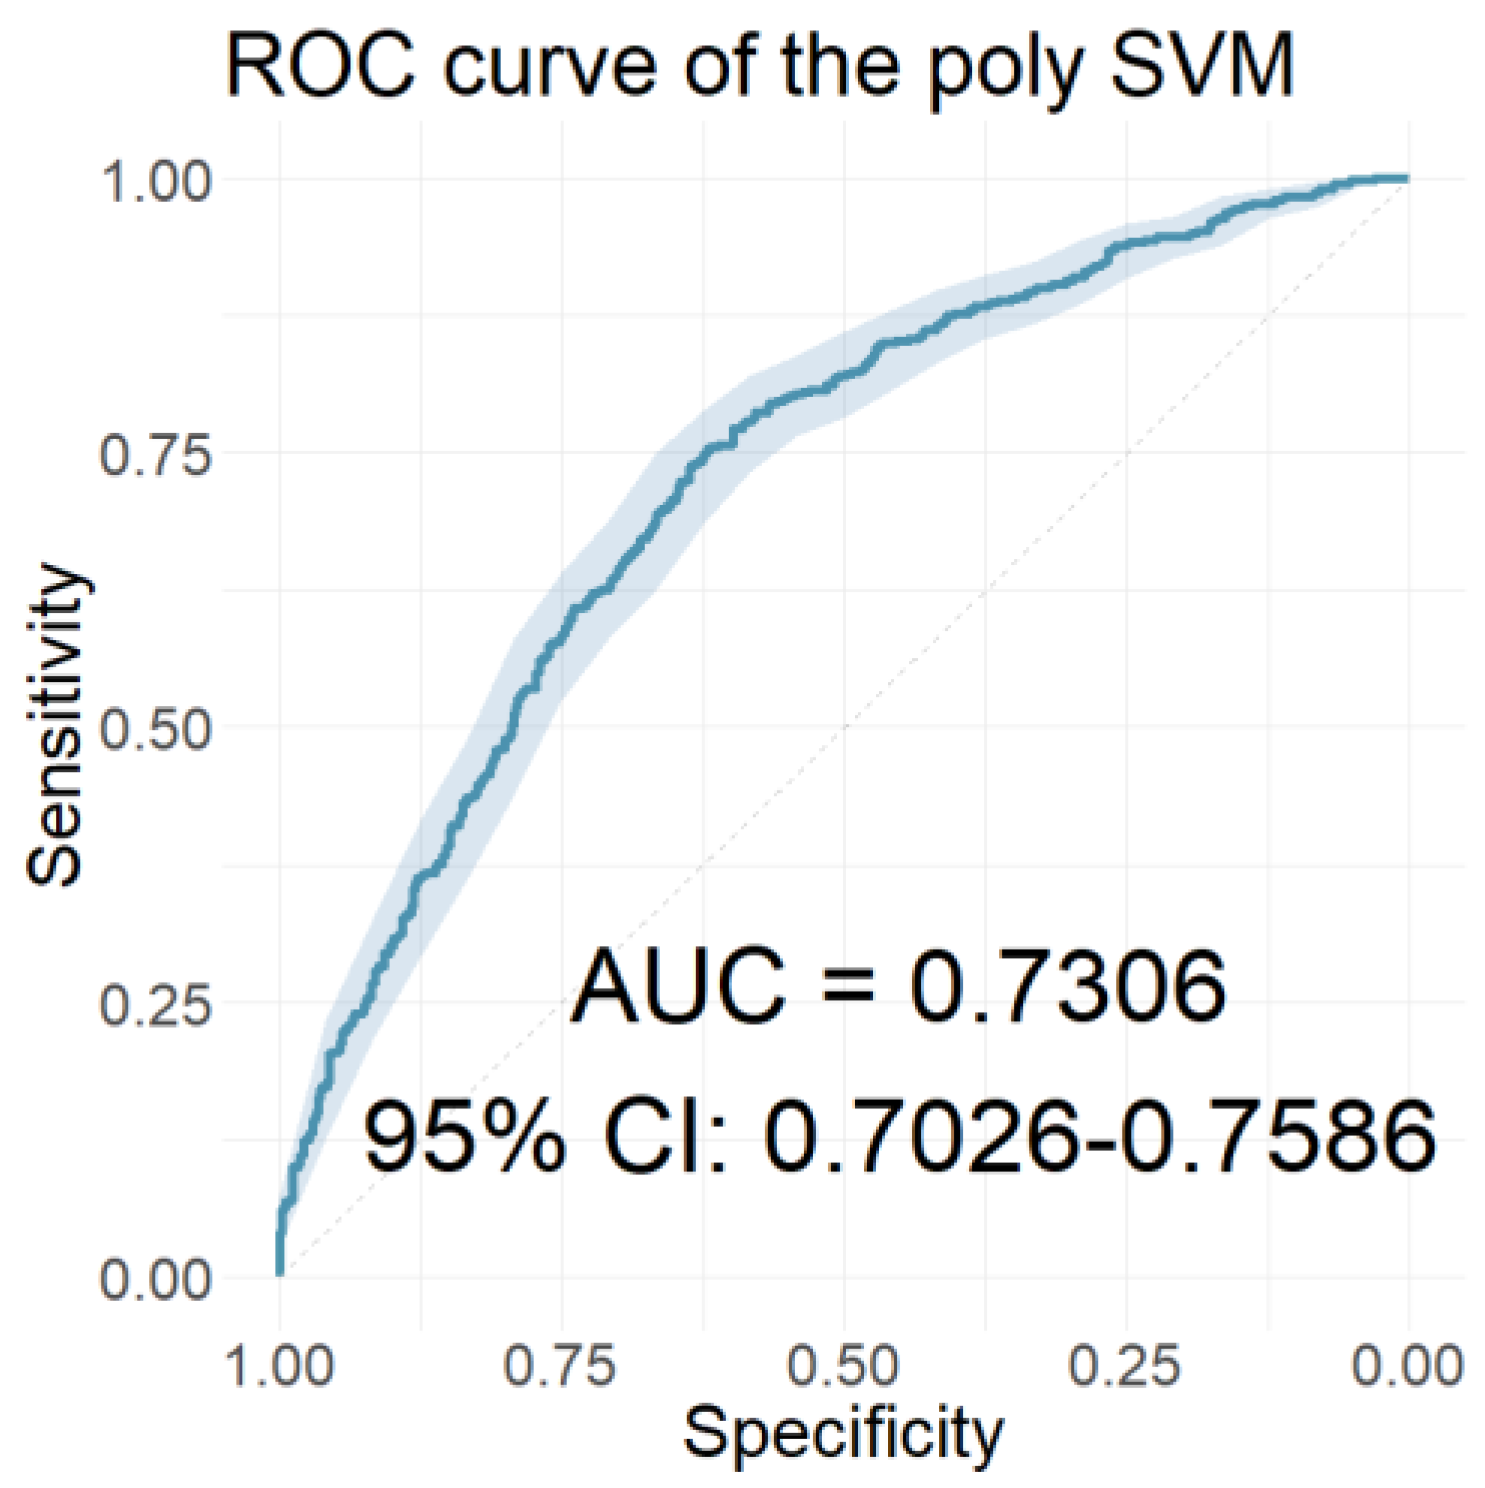
| Poly SVM | 33 | 0.7306 | 0.7496 | 0.5667 |
| Radial SVM | 33 | 0.7221 | 0.7116 | 0.6150 |
| RF | 33 | 0.7034 | 0.7157 | 0.5612 |
| Machine-Learning Classifier | No. of Features | AUC | Sensitivity | Specificity |
|---|---|---|---|---|
| LDA | 15 | 0.7560 | 0.7460 | 0.6374 |
| Linear SVM | 15 | 0.7649 | 0.7819 | 0.6159 |
| NB | 15 | 0.7548 | 0.7792 | 0.5662 |
| NN | 15 | 0.7390 | 0.5929 | 0.7342 |
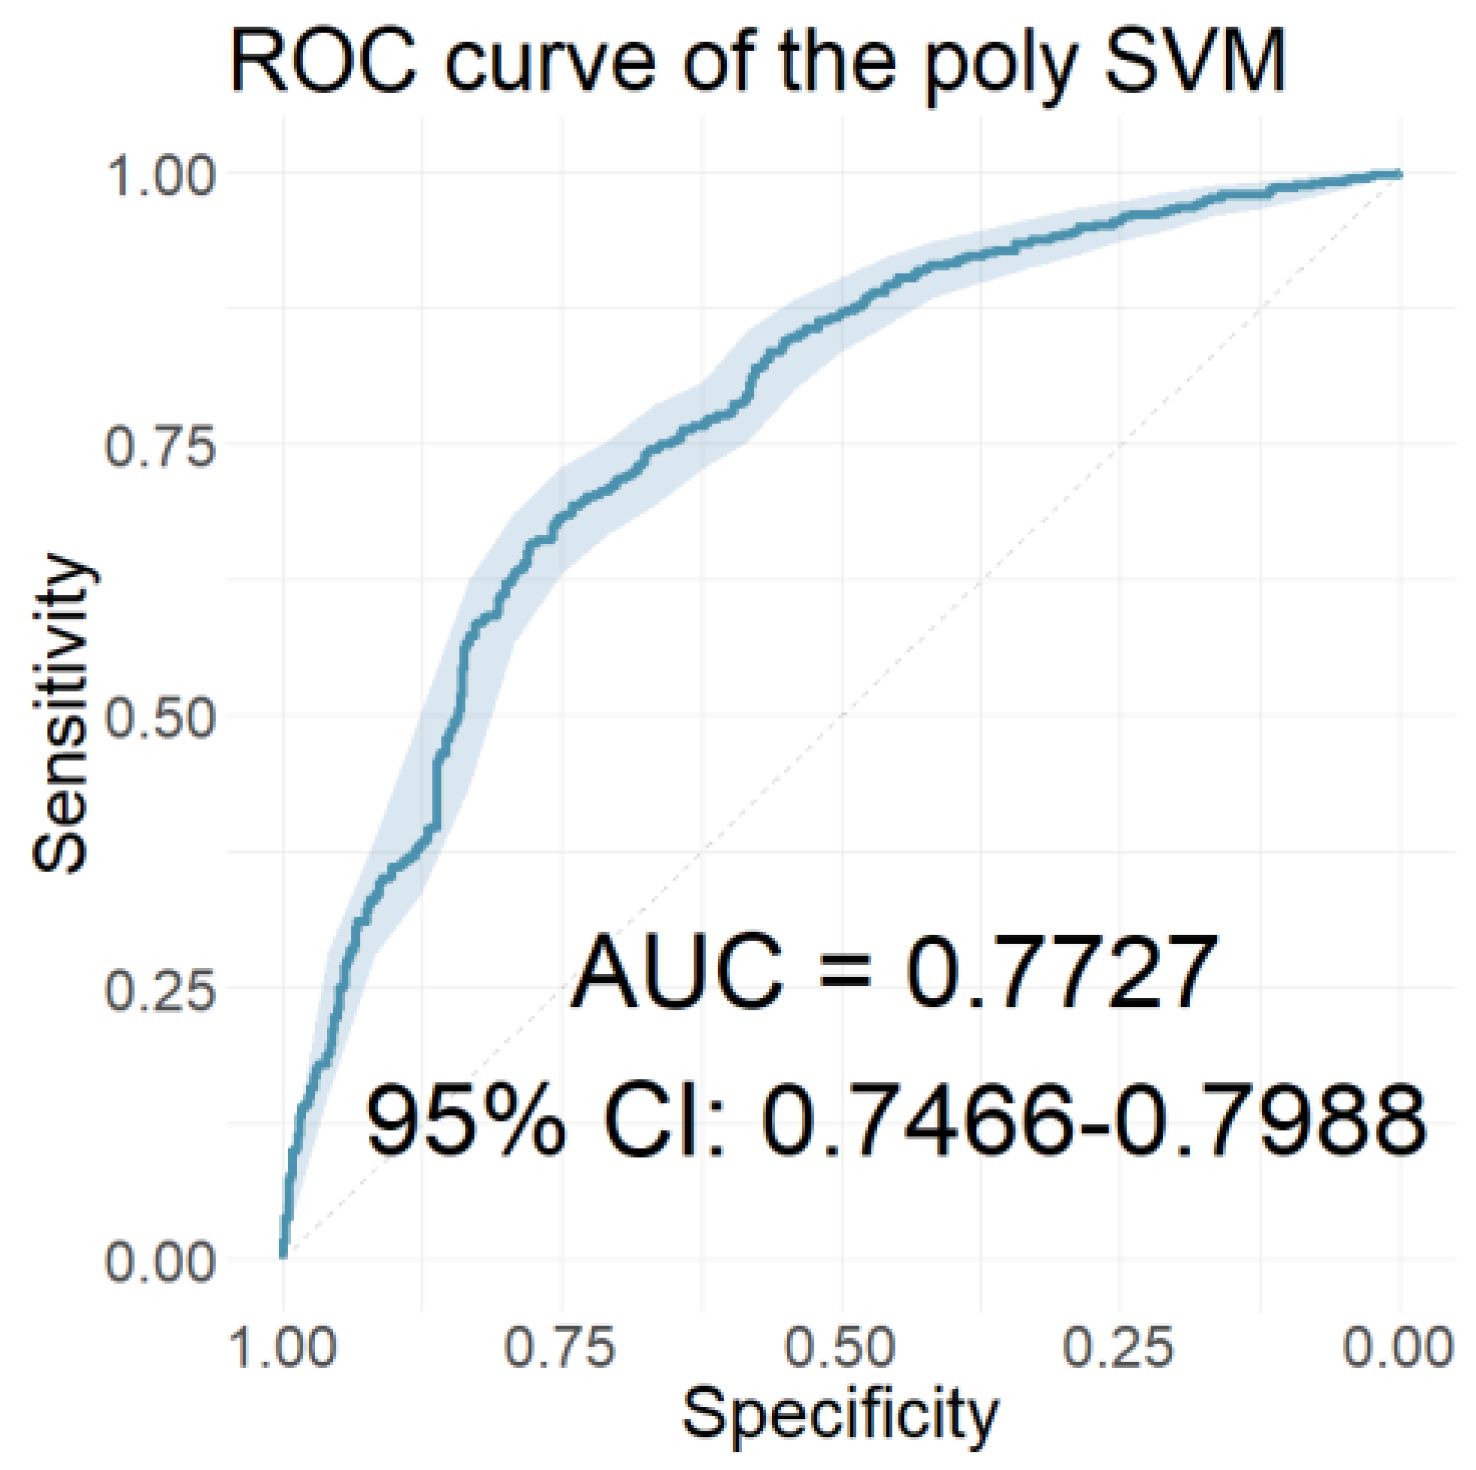
| Poly SVM | 15 | 0.7727 | 0.7732 | 0.6680 |
| Radial SVM | 15 | 0.7493 | 0.7392 | 0.6261 |
| RF | 15 | 0.7186 | 0.7505 | 0.5867 |
| Machine-Learning Classifier | No. of Features | AUC | Sensitivity | Specificity |
|---|---|---|---|---|
| LDA | 80 | 0.8886 | 0.8128 | 0.7690 |
| Linear SVM | 80 | 0.9087 | 0.8591 | 0.8201 |
| NB | 80 | 0.8098 | 0.7053 | 0.7981 |
| NN | 80 | 0.9075 | 0.8367 | 0.8395 |
| Poly SVM | 80 | 0.9250 | 0.8647 | 0.8599 |
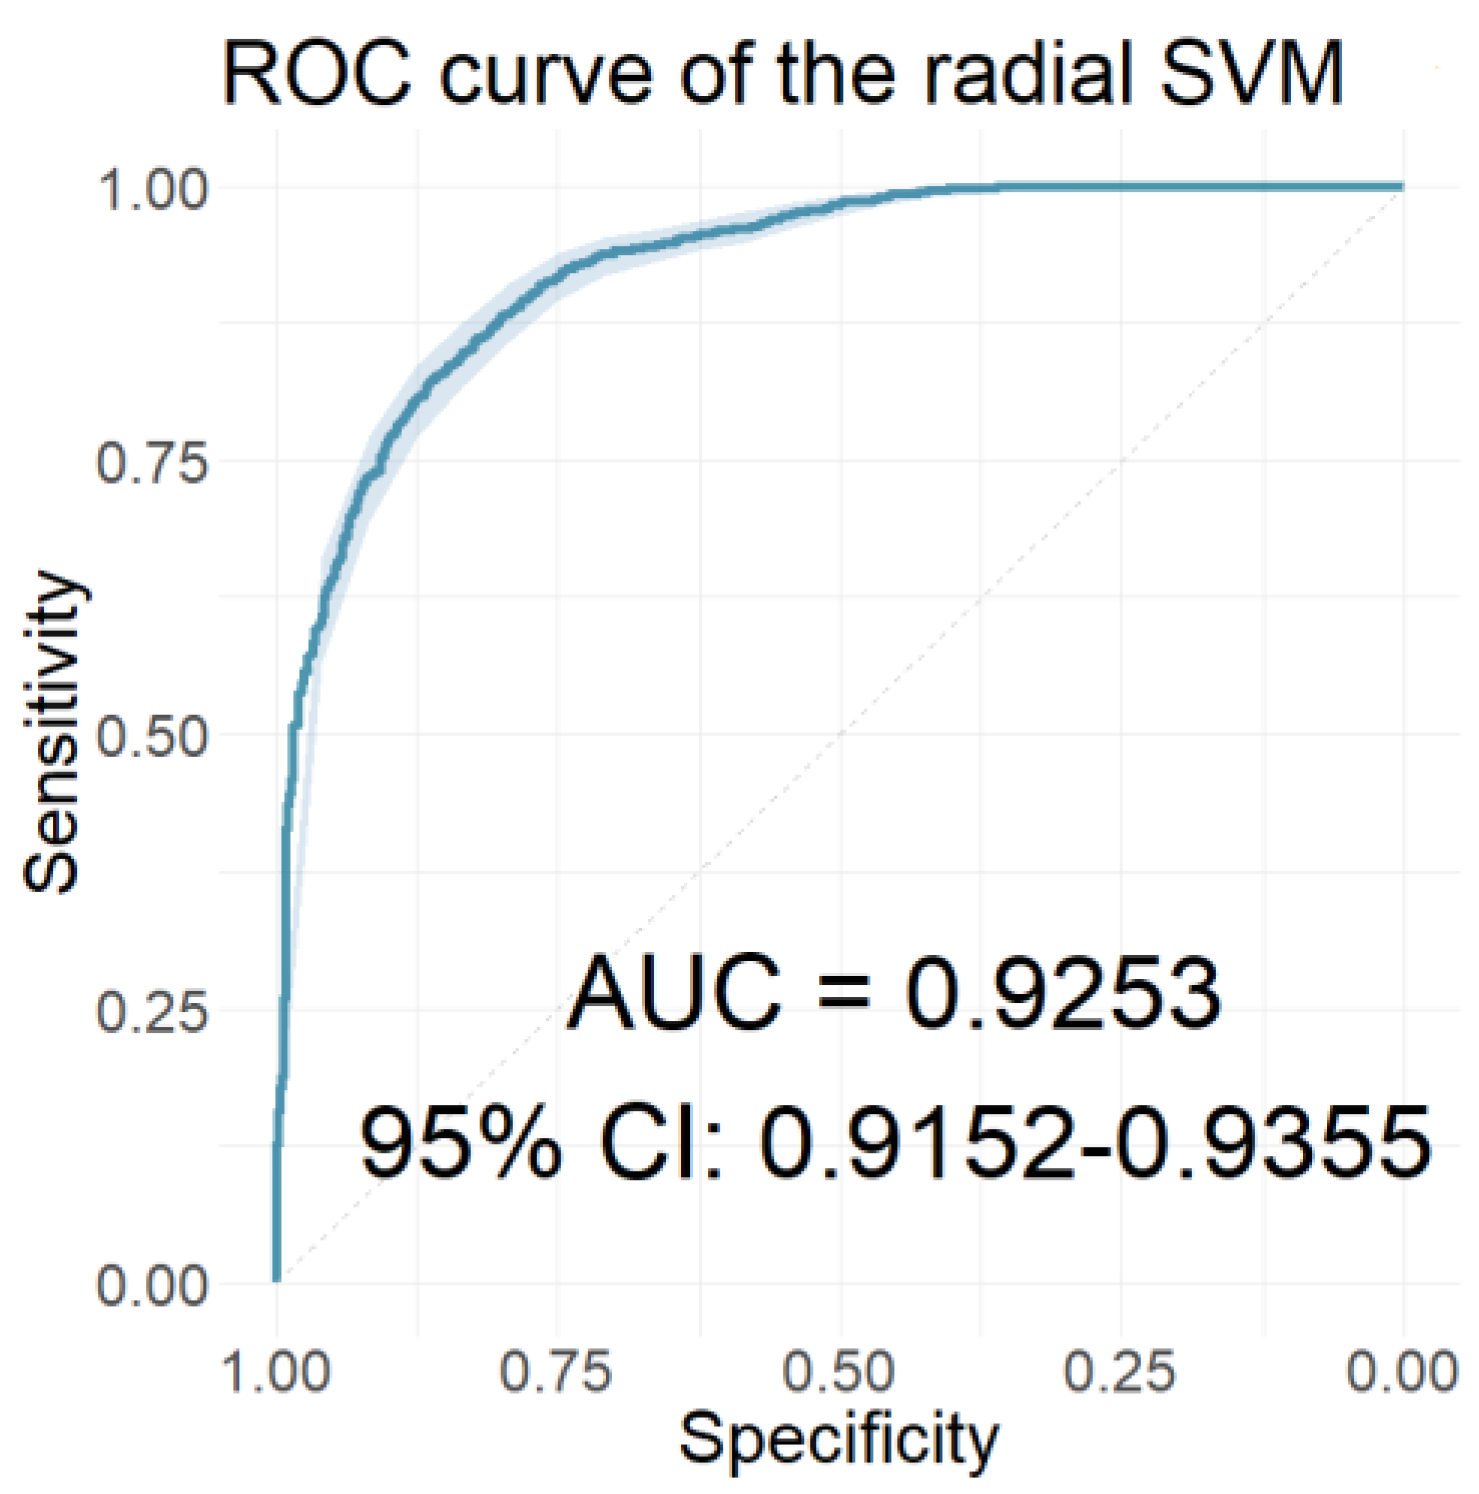
| Radial SVM | 80 | 0.9253 | 0.8484 | 0.8304 |
| RF | 80 | 0.9240 | 0.8598 | 0.8209 |
Disclaimer/Publisher’s Note: The statements, opinions and data contained in all publications are solely those of the individual author(s) and contributor(s) and not of MDPI and/or the editor(s). MDPI and/or the editor(s) disclaim responsibility for any injury to people or property resulting from any ideas, methods, instructions or products referred to in the content. |
© 2023 by the authors. Licensee MDPI, Basel, Switzerland. This article is an open access article distributed under the terms and conditions of the Creative Commons Attribution (CC BY) license (https://creativecommons.org/licenses/by/4.0/).
Share and Cite
Manta, O.; Sarafidis, M.; Schlee, W.; Mazurek, B.; Matsopoulos, G.K.; Koutsouris, D.D. Development of Machine-Learning Models for Tinnitus-Related Distress Classification Using Wavelet-Transformed Auditory Evoked Potential Signals and Clinical Data. J. Clin. Med. 2023, 12, 3843. https://doi.org/10.3390/jcm12113843
Manta O, Sarafidis M, Schlee W, Mazurek B, Matsopoulos GK, Koutsouris DD. Development of Machine-Learning Models for Tinnitus-Related Distress Classification Using Wavelet-Transformed Auditory Evoked Potential Signals and Clinical Data. Journal of Clinical Medicine. 2023; 12(11):3843. https://doi.org/10.3390/jcm12113843
Chicago/Turabian StyleManta, Ourania, Michail Sarafidis, Winfried Schlee, Birgit Mazurek, George K. Matsopoulos, and Dimitrios D. Koutsouris. 2023. "Development of Machine-Learning Models for Tinnitus-Related Distress Classification Using Wavelet-Transformed Auditory Evoked Potential Signals and Clinical Data" Journal of Clinical Medicine 12, no. 11: 3843. https://doi.org/10.3390/jcm12113843