


Chitosan Membranes for Direct Methanol Fuel Cell Applications

1
Department of Chemical Engineering, University of South Africa, Florida 1710, South Africa
2
Department of Mechanical Engineering, Faculty of Engineering and the Built Environment, Durban University of Technology, Durban 4000, South Africa
*
Author to whom correspondence should be addressed.
Membranes 2023, 13(10), 838; https://doi.org/10.3390/membranes13100838
Submission received: 4 July 2023
/
Revised: 9 October 2023
/
Accepted: 10 October 2023
/
Published: 20 October 2023
(This article belongs to the Special Issue Advanced Membranes for Fuel Cells and Redox Flow Batteries)
Abstract
:The purpose of this study is to identify the steps involved in fabricating silica/chitosan composite membranes and their suitability for fuel cell applications. It also intends to identify the physical characteristics of chitosan composite membranes, including their degree of water absorption, proton conductivity, methanol permeability, and functional groups. In this investigation, composite membranes were fabricated using the solution casting method with a chitosan content of 5 g and silica dosage variations of 2% and 4% while stirring at a constant speed for 2 h. According to the findings, the analysis of composite membranes produced chitosan membranes that were successfully modified with silica. The optimum membrane was found to be 4% s-SiO2 from the Sol-gel method with the composite membrane’s optimal condition of 0.234 cm/s proton conductivity, water uptake of 56.21%, and reduced methanol permeability of 0.99 × 10⁻⁷ cm2/s in the first 30 min and 3.31 × 10⁻⁷ in the last 150 min. Maintaining lower water uptake capacity at higher silica content is still a challenge that needs to be addressed. In conclusion, the fabricated membranes showed exceptional results in terms of proton conductivity and methanol permeability.
1. Introduction
The increasing scarcity of fossil fuels has highlighted the need for alternative energy sources [1,2,3]. Fossil fuels are not renewable, which makes them a threat to energy security. The use of these non-renewable resources also endangers the lives of individuals as they release harmful greenhouse gases like methane and carbon monoxide into the atmosphere [4]. Reducing our dependency on fossil fuels by switching to alternative energy sources like fuel cells increases energy stability and security [5]. Fuel cells can work well with other clean energy sources, such as methanol. Depending on the electrolyte’s type, the fuel cell can be categorized into different types, such as proton exchange membrane fuel cells, also known as PEMFCs, solid oxide fuel cells (SOFCs), alkali fuel cells (AFCs), and molten carbonate fuel cells (MCFCs) fuel cells [4,6,7,8]. The PEMFC is one of the most widely used energy techniques in the world due to its high energy conversion efficiency and lack of pollution [9,10]. Direct methanol fuel cell (DMFC) is a promising technology that is expected to revolutionize the way we produce and use electricity [4,9]. DMFCs have attracted widespread attention due to their unique attributes, such as their low emissions, easy liquid fuel storage, and high energy density [11,12]. DMFCs are based on liquid-fuel technology and utilize direct methanol as their fuel for electricity generation [13]. They are market leaders in the field and are commonly utilized in mobile and off-grid power applications [14,15]. Polymer membranes are the main components of direct methanol fuel cells [16,17,18]. DMFCs must be designed to provide high ion exchange capacity and low water uptake. They should also have good proton conductivity and a long life span [19,20]. The high proton conductivity of PEM ensures that it can conduct protons efficiently from the anode to the cathode. Its robust fuel barrier helps prevent degradation or even the termination of fuel cell performance [8]. Its good mechanical properties ensure that it operates in both wet and dry environments. Today’s membranes are made from perflurosulphonic acids, which are commonly referred to as Nafion. Unfortunately, Nafion has drawbacks such as high methanol permeability and high cost, which also contribute to its application in fuel cells [20,21]. Natural and low-cost, abundant chitosan-based polymers can be utilized as an alternative in fuel cells. However, due to their high hydrophilic nature and low proton conductivity, they are not ideal for DMFC applications [4]. The biopolymer chitosan is made from chitin, which is found in the shells of insects and crustaceans. With the help of hygroscopic oxide fillers such as silica (SiO2), titanium dioxide (TiO2), and zirconium oxide (ZrO2), they can achieve good membrane properties such as high proton conductivity, low water uptake, high membrane selectivity, and reduced methanol permeability [22,23]. Several studies have also shown that chitosan membranes made with pure/sulfonated silica exhibit better proton conductivity and water uptake than those made without this modification. Chitosan membranes are commonly modified with silica nanoparticles to enhance their mechanical strength, stability, and barrier properties. The addition of silica can improve the overall performance of the membrane by reducing the permeability of certain molecules, including methanol [22,23]. The chitosan structure has two major groups: the amino and the hydroxy groups, which makes it easy to modify. Depending on the modification process, chitosan can undergo physical and chemical transformations [24]. Chemical modification can be performed on either the amino or the hydroxy groups, depending on the reaction [24]. Although the primary group of chitosan reacts actively to the amino group, it is less reactive than the secondary group. When a chemical modification is carried out on the amino group, it will be labeled as N, while it will be O modified on the other side. Physical methods can be utilized to modify chitosan, such as mechanical grinding, ultrasonic treatment, and ionizing radiation [25]. DMFC utilizes different types of membranes based on their morphological attributes. These include thick, thin, layered, porous, and pore-filled membranes [26]. Although the properties of chitosan can be modified to improve its suitability for fuel cells, membrane morphology can still have a significant impact on its performance. For example, DMFC’s thin membranes are prone to experiencing high methanol crossover when compared to thick ones. In this manuscript, modification of the chitosan membrane with silica was found to improve the membrane proton conductivity and ion exchange while reducing methanol permeability.
2. Experiment
2.1. Materials
Chitosan flakes, Medium molecular weight, (Merck, Rahway, NJ, USA), Tetraethyl orthosilicate, Si(OC2H5)4, 98%, (Merck), Ammonia, NH3, 25%, (Merck), Acetic acid, CH3COOH, 99%, (Merck), Sodium hydroxide, NaOH, (Merck), Ethanol, C2H5OH, 99.9%, (Merck), Methanol, CH3OH, 99.9% (Merck), Sodium chloride, NaCl, (Merck), Hydrochloric acid, HCl, 37%, (Merck), Sulfuric acid, H2SO4, 99%, (Merck), Taurine, C2H7NO3S, 99%, (Merck).
2.2. Synthesises of SiO2 Nanoparticles
- (i)
- Sol-gel Process
The process for producing silica particles using tetraethyl orthosilicate involves the condensation and hydrolysis of TEOS. Various substances, such as 200 mL of ethanol, 80 mL of TEOS, and ammonia, were stirred at varying temperatures for around 30 min. A substance resembling a sol-gel was then dried at a rate of 100 °C for a single day. The silica particles were then catalyzed to remove impurities by calcinating them at a rate of 600 °C for 2 h. The dried silica particles were stored in sample bottles for use in membrane fabrication.
- (ii)
- Stober Process
The precursor for silica was TEOS during the Stober process, which involved the addition of ammonia, water, and ethanol. The mixture, which was then centrifuged for over 30 min, was then purified using a gasifier. The white solid materials, which were dried at a rate of 100 °C for 24 h, were then subjected to a similar process as those of Sol-gel.
2.3. Sulfonation Process
Sulfuric acid was used to prepare silica nanoparticles. These particles were sulfonated to improve their proton conductivity. The process used for producing sulfonated silica nanoparticles for the Sol-gel and Stober processes was the same. In a mixing process, 10 g of silica particles synthesized in Section 2.2 (i and ii) were mixed with 5 mL of sulfuric acid and 200 mL of methanol. At 1500 rpm, the mixture was vigorously stirred. It was then subjected to a continuous centrifuge for about 31 min. The centrifuged silica particles were separated from the liquid solution and subjected to a drying process before they were stored.
2.4. Fabrication of Composite Membranes (Casting Method)
Chitosan flakes were used to make chitosan membranes. The casting technique was used to create the membranes. Chitosan flakes weighing 5 g were added to a 2% v/v acetic acid solution and agitated for an hour. Dimethyl sulfoxide (DMSO), taurine/2-aminoethanesulfonic acid (C2H7NO3S), and silica particles (SiO2/s-SiO2) at different weight ratios (2% or 4%) were also added. 250 mL of the chitosan gel solution was cast into porcelain plates and then dried at 70 °C for 5 h. The acquired dried membrane was cross-linked with 2 M sulfuric acid for 30 min before being submerged in NaOH. The membrane surface was then cleansed with deionized water to remove any surplus acid, then dried. The dried membranes produced have a membrane thickness of 0.041 cm. silica-chitosan membranes were also processed in this manner.
3. Characterization Techniques
3.1. Water Uptake
The water uptake ratio is a measure of how much water can be absorbed by a membrane. This is very important in the design and construction of fuel cell membranes. The water uptake rate is also a factor that contributes to the membrane’s swelling capacity. Cell efficiency can be affected by high water uptake. The difference in the membranes’ mass between those that are dehydrated and hydrated is used to determine how much water they take up. Two independent experiments were used to calculate the water uptake of chitosan membranes having dimensions of 2 cm × 2 cm at room temperature. The mass of the membrane in a dry state (Wdry) was measured before it was soaked in water for 24 h. The mass of the wet state membrane (Wwet) was obtained after the membrane was soaked in distilled water for 24 h, then wiped with a paper towel to remove moisture. Water uptake was calculated as follows:
where MW is described as the weight of wet membranes and MD is the dry membrane’s weight.
3.2. Ion Exchange Capacity (IEC)
The ion exchange capacity was measured using the method used by [27]. The dried membranes were soaked in 20 mL of a 2 M NaCl solution for 24 h for Na+ to interchange H+ ions. The H+ ion solution was titrated with a solution of sodium hydroxide using a phenolphthalein indicator. The protons that were released were titrated with 0.01 M NaOH until they reached the end point. Ion exchange capacity was calculated as follows:
where IEC is the ion exchange capacity of the membrane, CNaOH is- the concentration of NaOH in mol/L, VNaOH is- the volume of NaOH that will be used to neutralize H+ in mL, and Mdry is- the mass of the dry membrane in g.
3.3. Methanol Permeability
Membrane permeability to methanol was determined at room temperature by a two-compartment diffusion cell with the membrane in between. Both A and B cell compartments were loaded with the same amount of methanol fuel and water, respectively. Both sides of the cell were stirred. Permeability values were calculated as follows:
P is the permeability thickness of the membrane, A is the area available for diffusion in the membrane volume of receiving compartment, Ca is the concentration of sample in component A, ΔC is the change in methanol concentration, and Δt is the permeation time.
3.4. Brunauer-Emmett-Teller (BET) Measurements
The BET analysis was carried out using the micrometric 3-Flex system. After the gas has been purged, a dry sample will be cooled down to around 77 K using liquid nitrogen. The inert gas will then adhere to the surface of the sample and lower the pressure inside the analysis chamber [28,29]. Then the adsorption isotherm of the experiment was used to determine the surface area of the samples. All samples were degassed under a pressure of around 3 × 10⁻⁵ mbar. Particle size can be determined using the following equation:
—denote the theoretical density of the material, and —denote the size of the particle in nm.
3.5. X-ray Powder Diffraction Analysis (XRD)
XRD includes structures, preferred crystal orientations (texture), and additional structural elements such as crystallinity, average grain size, crystal flaws, and strain. The constructive interference of a monochromatic beam of X-rays dispersed at precise angles from each pair of a sample’s lattice planes results in the formation of X-ray diffraction peaks. The arrangement of atoms within the lattice affects peak intensities. As a result, each material’s periodic atomic configurations are identified by its X-ray diffraction peaks. According to Bragg’s law, constructive interference (and a diffracted ray) take place when incident rays come into contact with a sample [30]. Bragg’s law equation:
This theory relates the diffraction angle and lattice spacing of a crystalline sample to the electromagnetic radiation spectrum. After that, the diffracted X-rays are detected, examined, and counted. Due to the non-uniform dispersion of the powdered material, scanning the sample at a range of 2 should reveal all possible lattice diffraction orientations. The chemical can be recognized by converting the diffraction peaks to d-spacings, even though each material has a unique set of d-spacings. This is typically accomplished by comparing d-spacings to recognized reference patterns.
4. Results and Discussion
4.1. Fourier Transform Infrared for Chitosan Membranes
FTIR spectra were used to analyze the SiO2 creation in the hybrid chitosan-silica composite. The spectra were obtained for both the modified and pure chitosan membranes. The analysis of the membranes using FTIR is shown in Figure 1 and Figure 2, which revealed that the membranes exhibited a peak between 3370 and 3250 cm−1. This peak represents the presence of the N-H group, which has an overlapping relationship with the O-H group [31]. The peak was shifted in the composition of modified chitosan membranes from 3331 cm−1 to (a and b) 3338 cm−1, (c) 3294 cm−1, and (d) 3333 cm−1 of Figure 1, and in Figure 2 it shifted to (a) 3343 cm−1, (b) 3379 cm−1, (c) 3409 cm−1, and (d) 3428 cm−1. The shift in the peak shows that the interaction between the N-H of chitosan and silica’s O-H groups is occurring. The peaks at 2846 cm−1 and 2921 cm−1 are respectively related to the vibrations produced by the C-N and C-H stretching [32]. The CS and the CS/(SiO2/s-SiO2) membrane’s amino group’s N-H bond deformation is at 1518 cm−1. The absorption bands found on the Stober (1020 cm−1) and Sol-gel (1014 cm−1) membranes are believed to be caused by Si-O-S vibration. On the other hand, the absorption bands found on the 873 and 862 cm−1 membranes were attributed to Si-OH [33] Although the spectra did not show a new functional group, the membranes made by sol-gel exhibited high-intensity peaks, which is a result of their interaction with chitosan and silica.
4.2. X-ray Diffraction of Chitosan Membranes
The interactions between the chitosan molecules’ intramolecular and intermolecular components contribute to their crystallinity. The X-ray diffraction (XRD) method was used to determine SiO2’s impact on the crystallinity of CS. Figure 3 and Figure 4 show the XRD analysis of various types of membranes, including 2% s-SiO2 and 4% s-SiO2. The chitosan membrane exhibits semi-crystalline characteristics at 19°. The modified membranes exhibited an amorphous structure with different angles of refraction, such as 19.78, 20.29, 21.26, and 21.35 degrees, as shown in Figure 3 and Figure 4. Figure 3 and Figure 4 show the crystallinity loss experienced during the modification process. The figure shows the decline in the crystallinity peak of the modified chitosan membranes. The addition of silica fragments containing sulfuric acid caused the modified membranes to have an amorphous structure and decreased the total crystallinity.
4.3. SEM of Chitosan Membranes
Figure 5 and Figure 6 indicates the morphologies of the chitosan membranes. The changes in Chitosan’s morphology were observed using SEM. These transformations were observed before and after SiO2 modification. The image in Figure 5a shows a smooth and complex surface that does not have any visible pores on it. The results support the findings of a study conducted by Riek and colleagues in 2017, who discovered that the chitosan membrane has uniform and homogenous flat surfaces and a consistent thickness. A lot of silica nanoparticles are visible in membranes a and b, while in membranes c and d, a little amount of silica was detected in Figure 5. This is due to the number of silica nanoparticles that were added to the membranes, as membranes a and b have a high silica content compared to those of c and d. It is evident that although silica nanoparticles were dispersed, they were not evenly distributed in the polymer matrix of the membrane. It also appears that the dispersed nanoparticles form aggregates, and the more silica added, the higher the number of agglomerated silica nanoparticles. The high energy level of silica particles causes silica agglomeration. However, modification of silica with sulfur seems to reduce this agglomeration since membranes b and e have lower agglomerates compared with those of their unmodified silica membranes.
The physical morphologies of membranes with silica synthesized through Stober are indicated in Figure 6 The SEM images indicate membranes with dense morphologies and hard surfaces. Membranes with silica from Stober have similar morphologies to those of Sol-gel. However, membrane (a) (2% SiO2) in Figure 6 has lumps on it, which may have developed during the drying process, but these lumps are not visible in other membranes. When looking at membrane c in Figure 6, it can be observed that it has a better distribution of silica on its surface, but agglomeration is also visible. The agglomeration phenomena have occurred in all of the fabricated membranes (Sol-gel and Stober) and membranes with silica synthesized, though Stober has more agglomerates on its surface compared to those of Sol-gel. The challenge is still to synthesize silica particles that will form little to no agglomerates for the modification of chitosan.
4.4. Water Uptake of Chitosan Membranes
- (i)
- Effect of Silica Content on Water Uptake
The membrane’s water uptake is a vital part of its physical properties. The water uptake of chitosan membranes as a function of silica (SiO2/s-SiO2) is shown in Figure 7. The chitosan contains different silica contents of 2% and 4%. It can be seen that the incorporation of silica into the chitosan matrix suppresses the water absorption of the membrane uptake by 22% on 2% SiO2/Cs; however, adding more silica content to the membrane resulted in an increase in water uptake as membranes containing 4% SiO2 had higher water uptake of 45.34% and 47.98%, whereas those of the corresponding 4% s-SiO2 had 51.97% and 56.21% Stober and Sol-gel, respectively. The increase in water uptake at higher silica levels can be attributed to silica hygroscopic affinity and bonding interaction between the silanol group and chitosan amine, acetyl, and silanol groups interacting more strongly and increasing membrane hydrophilicity [34]. The increase in water uptake of chitosan membranes containing high silica content can be attributed to the high water affinity of silica particles, which contribute to the total hydrophilic property of the membrane. As chitosan also has a high hydroscopic property, this caused the membrane’s overall water uptake to be high [35]. The highest water uptake is 56.21%, belonging to the 4% s-SiO2 membrane. Higher values in s-SiO2 membranes are due to the presence of sulfonic acid groups on the surface of the silica particles, which can interact with water molecules and promote their uptake. These findings indicate that making use of chitosan modified with a small quantity of silica can lead to significant improvements in the membranes’ water uptake capacities, potentially affecting a wide range of applications.
- (ii)
- Effect of Temperature on Water Uptake
Figure 8 represents the effect of temperature on the water uptake of chitosan membranes. The temperature can influence how the chitosan and silica composites will expand. This is because higher temperatures can cause the molecules of the solvent to expand into the matrix. The processing conditions and composition of the composite will determine how much swelling will occur. As shown above, in Figure 8, the membranes show an increase in water uptake when the temperature rises from 40 °C to 60 °C; however, the water uptake on modified membranes was lower than that of pure chitosan, recorded to be 60%. In Figure 9, modified membranes have uptake between 53.26 °C and 68.92 °C (Sol-gel), and those of Stober are 53.25 °C–69.39 °C at 40 °C–60 °C. The increase is due to membrane water diffusivity, chain mobility, and membrane-free volume. However, the 4% s-SiO2 Sol-gel membrane does not show a significant change from 40 to 60 °C, as its water uptake is 65.17% and 65.35% at 40 °C and 60 °C, respectively. The minimal water uptake rate on the 4% s-SiO2 membrane can be attributed to the chitosan and silica interaction as well as the lack of free void volume, which enables the membranes to endure high temperatures. It can be concluded that membranes with silica synthesized through Sol-gel have high water uptake compared to those of Stober, with s-SiO2/Cs membranes having the highest water uptake. This can reduce membrane application if the membranes become spongy, reducing their life span. In conclusion, Stober membranes’ low water uptake is an ideal property for fuel cell applications. Also, the minimal water uptake can improve their durability.
4.5. Ion Exchange Capacity of Chitosan Membranes
The ion exchange capacity of the membranes is illustrated in Figure 10. It is indicated in Figure 10 that pure chitosan has the lowest IEC of 0.77 meq/g, and the addition of silica improves the chitosan membrane’s IEC from 1.12 meq/g (2% SiO2) to the highest exchange value of 2.32 meq/g (4% s-SiO2). Sulfonated Sol-gel membranes have the highest IEC, and it is mainly due to the presence of acid groups caused by SiO2-SO3H particles’ acidity. The overall results indicate that incorporating silica nanoparticles can boast superior ion exchange capacities compared to their chitosan counterpart. The increase in IEC can be attributed to (i) chitosan having amino groups that can be deprotonated or protonated to allow for the exchange of ions, and (ii) the addition of functional groups in the chitosan layer that improves the site available for exchange [34]. (iii) The incorporation of silica nanoparticles into chitosan membranes can improve the surface accessibility of certain functional groups, and the silica’s structure facilitates the movement of ions into the matrix, enhancing the exchange of ions. (iv) The chemical and mechanical properties of chitosan-based membranes can be improved through the incorporation of silica, which will extend their service life and improve their ability to exchange ions.
4.6. Proton Conductivity of Chitosan Membranes
Figure 11 indicates the proton conductivity of the chitosan membrane at room temperature. The proton conductivity of the membrane is an important contributing factor in the application of membranes in fuel cells. It helps in determining if the membrane can produce the energy needed. The vehicle and the Grotthuss mechanisms are responsible for proton transfers in PEM [36]. In Figure 11, an increase in proton conductivity was observed when more filler was added. This is due to the influence of the ionic group Si-OH, which facilitates proton conduction. Chitosan was reported to have a proton conductivity of 0.151 cm/s and that of modified membranes (2% SiO2) having the lowest proton conductivity of 0.206 cm/s and 0.21 cm/s with the highest conductivity (4% s-SiO2) of 0.229 cm/s and 0.234 cm/s, Stober and Sol-gel, respectively. The high increase in proton conductivity of s-SiO2 Sol-gel membranes can be attributed to the high water uptake of the membranes reported in Figure 7, Figure 8 and Figure 9. The proton conductivity of PEM is affected by the presence of water as well as the dissociation of the groups of mobile protons and sulfonic groups; therefore, enhanced water uptake helps facilitate proton transfers through membranes’ ionic channels [37]. The reason why the conductivity of the membranes is outstanding is due to the presence of high-proton-conducting sulfonating compounds that are stuck in the routes of the sulfonating polymers and SiO2.
4.7. Methanol Permeability of Chitosan Membranes
DMFCs are powered by methanol as fuel, and the low permeability of PEM will contribute to their efficiency. Figure 12 and Figure 13 display the influence of the silica particle content on the methanol permeability of the chitosan composite membranes, as well as the relationship between time and the permeability behaviors of a membrane at 30, 60, 90, 120, and 150 min. It shows that the permeability of the chitosan membrane increases as the time interval is increased from 30 to 150 min. Additionally, Figure 12 and Figure 13 show that silica nanoparticles in varying wt% reduce the crossover between the membrane and methanol. Figure 12 illustrates the lowest methanol permeability on the modified membrane, which is found on a 4% s-SiO2 membrane, with values of 1.79 × 10⁻⁷ cm2/s at 30 min and 2.31 × 10⁻⁷ cm2/s at 90 min. The decrease in permeability is due to ion-exchangeable acid groups that promote proton conduction by forming a hydrogen bond network that is strong enough to resist methanol permeability [38,39]. The permeability of the modified chitosan membrane decreases by almost 2% when compared to the unmodified chitosan membrane. This phenomenon is due to the cross-linked structure of the modified membranes. The Stober membranes have the lowest methanol permeability of 2.6 × 10⁻⁷ on a 2% s-SiO2 membrane for the first 30 min, as shown in Figure 13. Figure 13 demonstrates that as time increases, the methanol permeability on Stober membranes also increases to 0.99 × 10⁻⁷ at 30 min and 2.4 × 10 −7 at 90 min on 4% s-SiO2 membranes, respectively.
4.8. Tensile Strength of Chitosan Membranes
The mechanical properties of chitosan membranes are shown in Figure 14. The results indicate that the strength of these membranes improved when 2% inorganic filler was added, but it then weakened when 4% was added. The chitosan membranes’ tensile strength was 3.33 MPa before modification. When silica was added, the tensile strength increased to 5.56 and 4.97 MPa. This was followed by a significant increase of 5.76 and 5.89 MPa when 2% s-SiO2 Sol-gel and Stober were used, respectively. This suggests that the sulfonation of these particles has a significant impact on the chitosan membranes’ mechanical strength. An increase in the filler content to 4% resulted in a decline in its strength. The lowest value was 4% SiO2 (4.32 MPa) Stober. This is consistent with the findings of a 2014 study by Narsito et al., who stated that high silica content can harden a membrane [40]. Silica particles are known to be brittle [40], hence adding more silica to the chitosan matrix breaks its chain entanglement, causing the membrane to have low mechanical strength due to the membrane being hard and stiff, resulting in it fracturing [41,42]. The membrane tensile strength in membranes with silica synthesized through Sol-gel and Stober processes has similar behavior concerning the effect of silica on tensile strength. It can be concluded that the modification of silica with sulfur successfully improves the membrane’s tensile strength. However, it is also important to keep the quantity of silica incorporated into the membrane at a minimum so as to strengthen its mechanical strength.
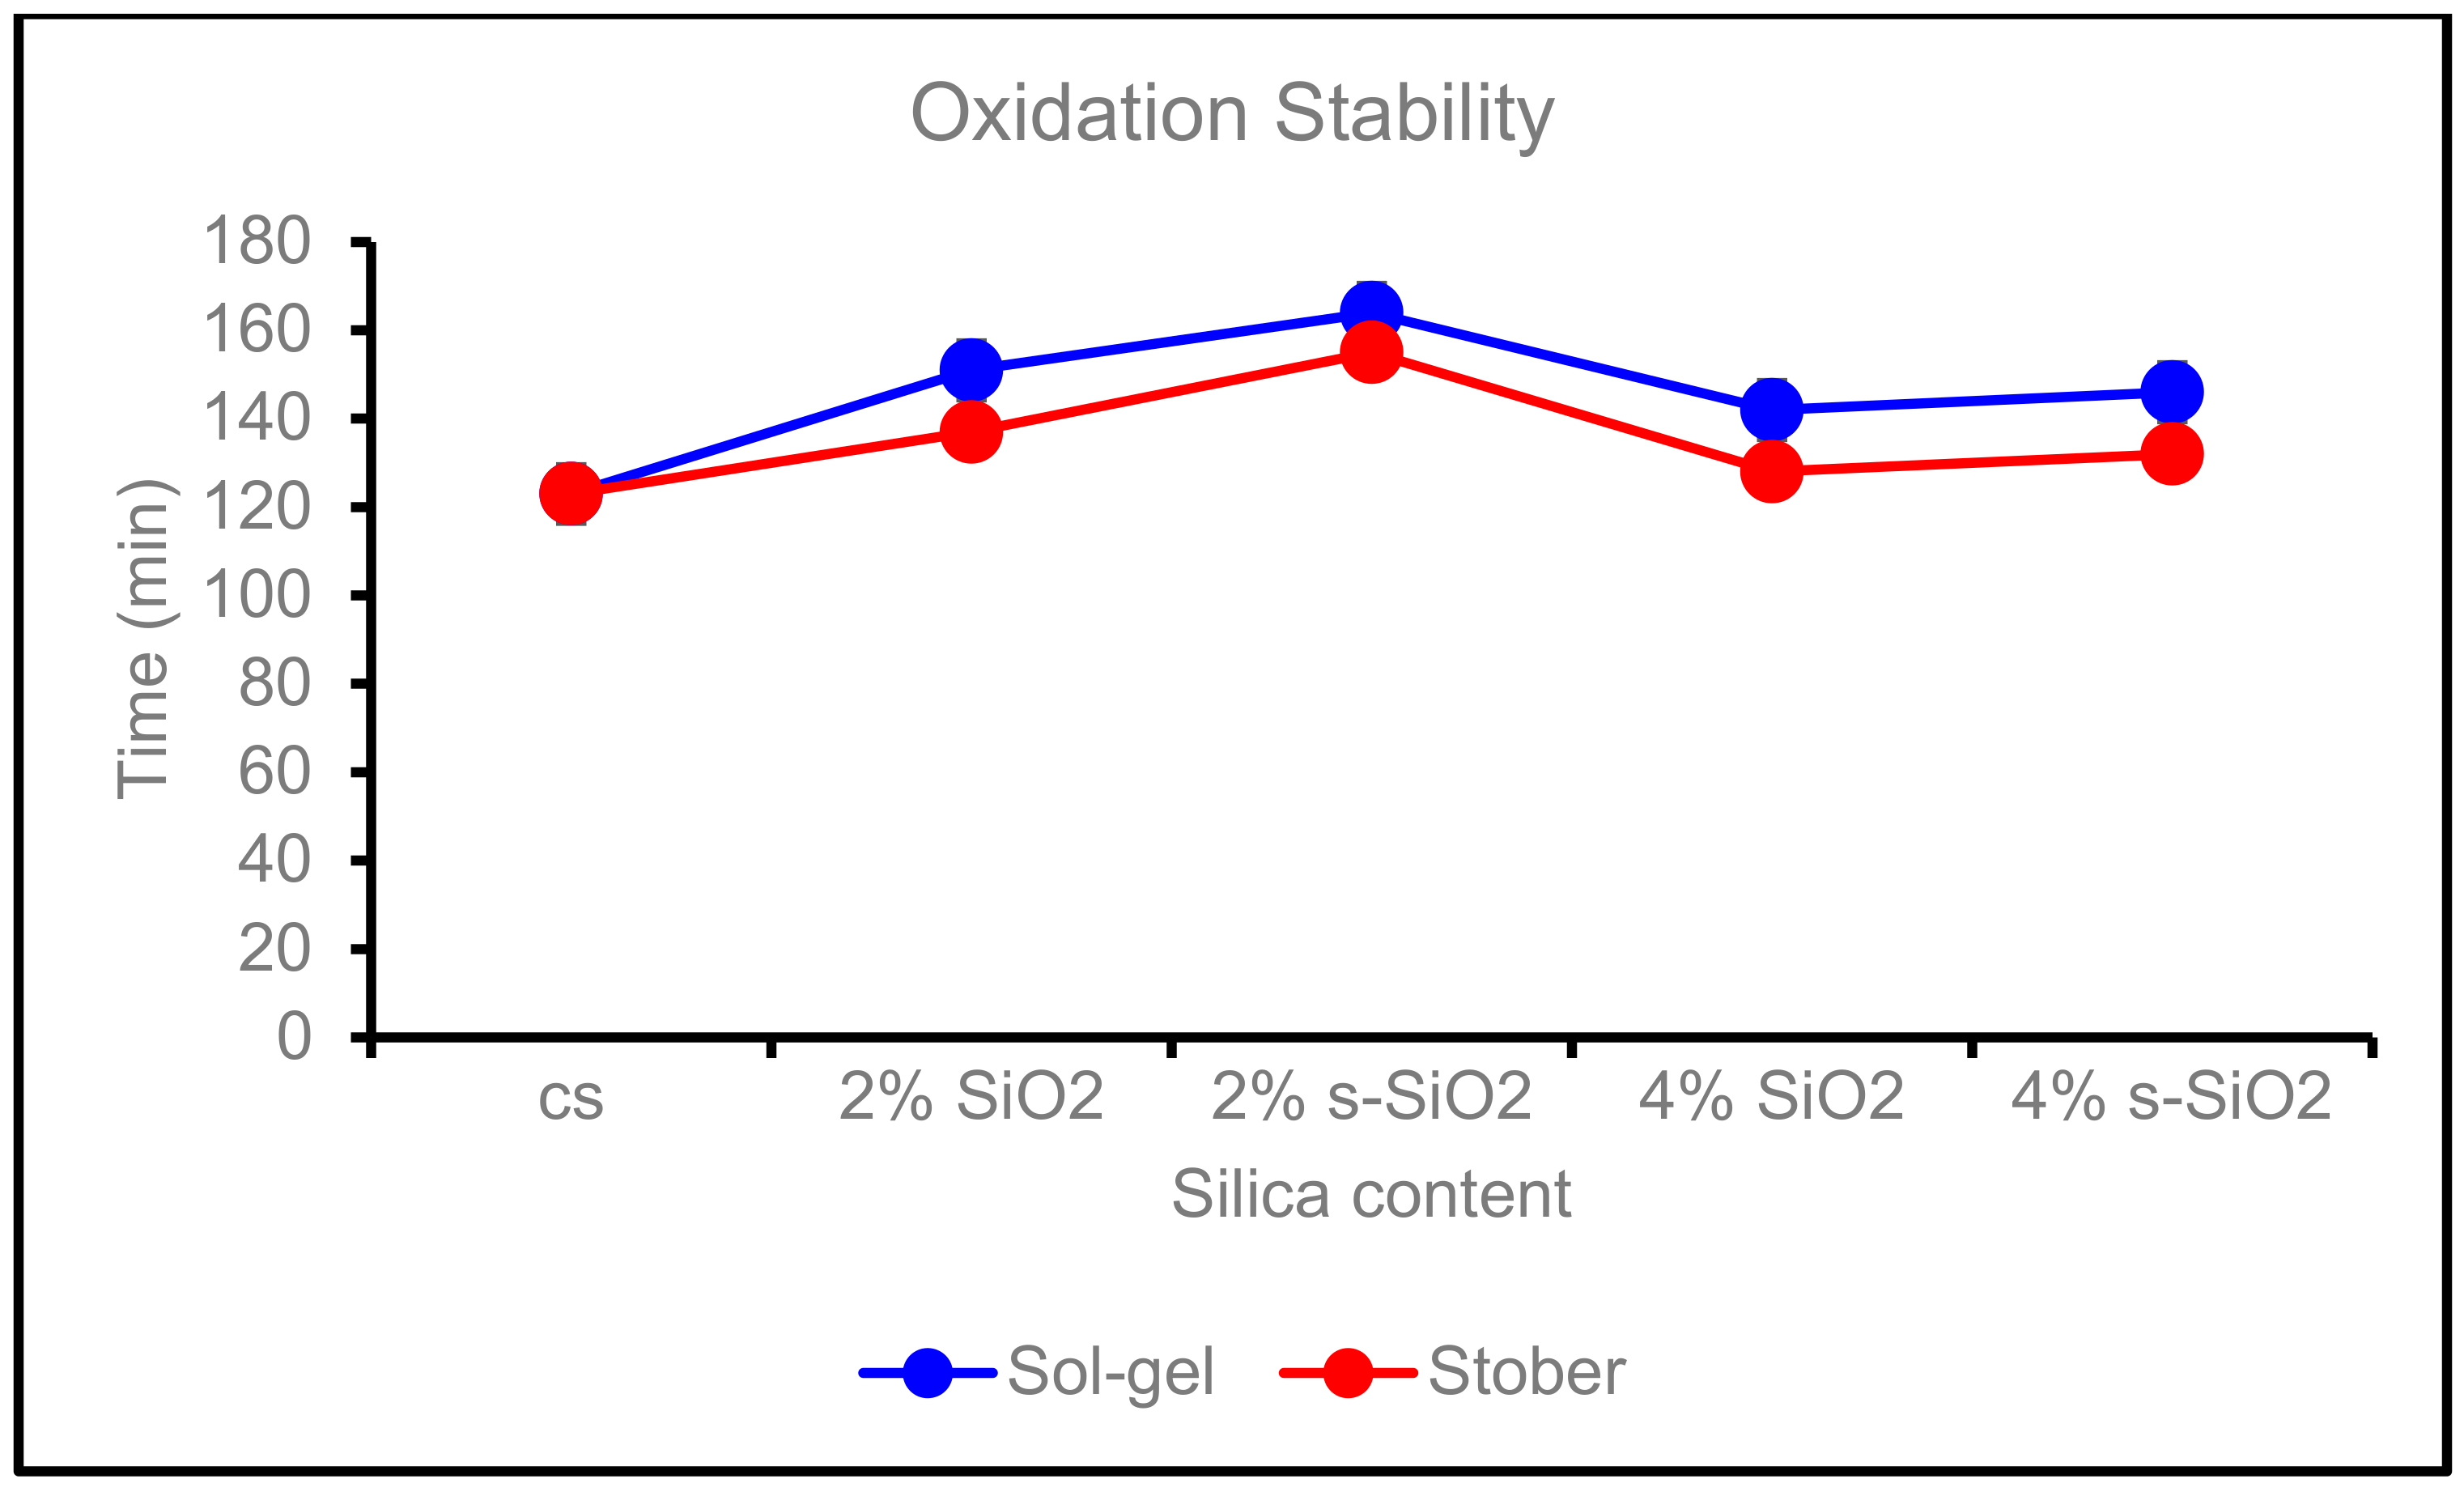
4.9. Oxidation Stability
Figure 15 represents the oxidation stability of chitosan membranes with different types and amounts of silica. The membrane stability test was performed at 80 °C using Fenton reagent 3% H2O2 containing 3 ppm Fe(SO4)2.7H2O. The oxidation stability was evaluated as a function of the time the membrane starts to dissociate in the fenton reagent. The unmodified Cs membrane starts to dissociate after 123 min. The incorporation of chitosan with a small amount of silica tends to improve the membrane resistance to chemical attack as the 2% s-SiO2 membrane (Sol-gel) degrades after 164 min, followed by the 2% s-SiO2 (Stöber process), which degrades after 155 min. However, membranes with high silica content start to degrade at 128 and 142 min on 4% SiO2 membranes for Stober and Sol-gel, respectively, making these membranes have the lowest oxidation stability compared with those have a small amount of silica. The decrease in chemical stability of membranes having high silica quantities is due to silica agglomeration in the chitosan matrix reported in Figure 5 and Figure 6. When agglomeration occurs, the membrane’s internal structure becomes weaker in areas where silica aggregates are present, making it more vulnerable to chemical deterioration [43,44]. Temperature also affects the membrane’s rate of deterioration as it increases the system’s energy, which encourages chemical reactions, particularly oxidative activities [45,46]. The composite may degrade more quickly as a result of the accelerated oxidation rate of the chitosan and other components [45,46]. The high temperature might result in the separation of phases or morphological alterations, which can influence how accessible chitosan molecules are to oxidizing agents and impact overall oxidation stability [47].
5. Conclusions
The FTIR spectra show no chemical reactions between chitosan and modified silica particles. Instead, a physical interaction between the two occurs. As the elevated silica content increases, its favorable characteristics, such as water uptake and proton conductivity, increase while the methanol permeability decreases. This makes it an ideal material for fuel cells. The amount of water absorbed by chitosan membranes containing silica was observed to increase from 2% to 4% SiO2. Silica-based membranes that have been calcined for two hours show an increase in water uptake from 37.9% to 51.97% Stober and from 40% to 56.21% Sol-gel. Sulfonated membranes exhibited exceptional proton conductivities of 0.229 cm/s and 0.234 cm/s on 4% Stober and Sol-gel, respectively. Despite having a lower proton conductivity than membranes modified with sulfonated silica, pure silica-incorporated membranes had a greater proton conductivity than pure chitosan (0.151 S/cm). The reduction in methanol permeability was observed in developed membranes when silica was added, from 2% to 4%. In conclusion, silica-modified chitosan membranes have enormous potential for use in direct methanol fuel cells (DMFC). The addition of silica to chitosan membranes has several benefits that improve their functionality and appropriateness for DMFCs. First, silica enhances the stability and mechanical strength of chitosan membranes. Under the demanding operating circumstances of DMFCs, silica particles support the chitosan matrix, preventing membrane deformation and maintaining structural integrity. The membranes’ durability is increased by this mechanical robustness, which allows them to tolerate mechanical loads. The chitosan membranes with silica particles have better barrier properties against the flow of methanol, which is a critical issue when it comes to DMFCs. By minimizing the crossover between the fuel cell and the membrane, the modified membranes can help improve their efficiency and prevent it from running over the chemical. Furthermore, the addition of silica nanoparticles enhances proton conductivity in chitosan membranes. Silica acts as a proton conductor, facilitating the transport of protons across the membrane and improving the overall cell performance. This increased proton conductivity will contribute to the higher power output and efficiency of the DMFC. Additionally, chitosan membrane proton conductivity was improved by the addition of silica nanoparticles, and proton transport across the membrane was made easier by the role of silica as a proton conductor, which enhances cell function in general. The improvement in proton conductivity and methanol permeability makes the fabricated membranes suitable for applications in fuel cells. It can be concluded that the modification of chitosan with modified silica is necessary to improve the suitability of chitosan in fuel cell technology. Although membrane membranes modified with sulfonated silica show exceptional results in terms of proton conductivity and chemical stability, water uptake is a challenge that still needs to be addressed. However, fuel cell performance must also be improved to support the reliability of the fabricated membranes in fuel cells. Optimizing the synthesis processes and exploring the full potential of chitosan membranes modified with silica for DMFC applications still require additional research and development, which is crucial.
Author Contributions
Conceptualization, R.S., T.M. and F.N.; Methodology, R.S., T.M. and F.N.; Software, L.M. and R.S.; Validation, T.M.; Formal analysis, L.M., R.S. and T.M.; Investigation, L.M.; Data curation, L.M.; Writing—review & editing, L.M., R.S., T.M. and F.N.; Supervision, T.M. and F.N. All authors have read and agreed to the published version of the manuscript.
Funding
This research was funded by the internal funding of the University of South Africa and the National Research Council of South Africa (NRF), Grant number: 150341.
Institutional Review Board Statement
Not applicable.
Data Availability Statement
Not applicable.
Conflicts of Interest
Authors declare no conflict of interest.
References
- Bayrak, Z.U.; Gencoglu, M.T. Application areas of fuel cells. In Proceedings of the 2013 International Conference on Renewable Energy Research and Applications (ICRERA), Madrid, Spain, 20–23 October 2013; IEEE Computer Society: Washington, DC, USA, 2013; pp. 452–457. [Google Scholar] [CrossRef]
- Kasyanova, A.V.; Zvonareva, I.A.; Tarasova, N.A.; Bi, L.; Medvedev, D.A.; Shao, Z. Electrolyte materials for protonic ceramic electrochemical cells: Main limitations and potential solutions. Mater. Rep. Energy 2022, 2, 100158. [Google Scholar] [CrossRef]
- Halim, F.; Hasran, U.; Masdar, M.; Kamarudin, S.; Daud, W. Overview on Vapor Feed Direct Methanol Fuel Cell. APCBEE Procedia 2012, 3, 40–45. [Google Scholar] [CrossRef]
- Vaghari, H.; Jafarizadeh-Malmiri, H.; Berenjian, A.; Anarjan, N. Recent advances in application of chitosan in fuel cells. Sustain. Chem. Process. 2013, 1, 16. [Google Scholar] [CrossRef]
- Kadirkhan, F.; Goh, P.S.; Ismail, A.F.; Wan Mustapa, W.N.F.; Halim, M.H.M.; Soh, W.K.; Yeo, S.Y. Recent Advances of Polymeric Membranes in Tackling Plasticization and Aging for Practical Industrial CO2/CH4 Applications—A Review. Membranes 2022, 12, 71. [Google Scholar] [CrossRef] [PubMed]
- Ebrahimi, M.; Kujawski, W.; Fatyeyeva, K.; Kujawa, J. A Review on Ionic Liquids-Based Membranes for Middle and High Temperature Polymer Electrolyte Membrane Fuel Cells (PEM FCs). Int. J. Mol. Sci. 2021, 22, 5430. [Google Scholar] [CrossRef] [PubMed]
- Qussay, R.; Mahmood, M.; Al-Zaidi, M.K.; Al-Khafaji, R.Q.; Al-Zubaidy, D.K.; Salman, M.M. A Review: Fuel Cells Types and their Applications. Int. J. Sci. Eng. Appl. Sci. 2021, 7, 2395–3470. Available online: https://www.ijseas.com (accessed on 27 May 2023).
- Ramadhani, F.; Hussain, M.A.; Mokhlis, H. A comprehensive review and technical guideline for optimal design and opera-tions of fuel cell-based cogeneration systems. Processes 2019, 7, 950. [Google Scholar] [CrossRef]
- Tellez-Cruz, M.M.; Escorihuela, J.; Solorza-Feria, O.; Compañ, V. Proton Exchange Membrane Fuel Cells (PEMFCs): Advances and Challenges. Polymers 2021, 13, 3064. [Google Scholar] [CrossRef]
- Olabi, A.G.; Wilberforce, T.; Alanazi, A.; Vichare, P.; Sayed, E.T.; Maghrabie, H.M.; Elsaid, K.; Abdelkareem, M.A. Novel Trends in Proton Exchange Membrane Fuel Cells. Energies 2022, 15, 4949. [Google Scholar] [CrossRef]
- Ohashi, M. Direct Methanol Fuel Cell as the Next Generation Power Source. Available online: https://www.fujikura.co.jp/eng/rd/gihou/backnumber/pages/__icsFiles/afieldfile/2013/05/23/42e_29.pdf (accessed on 27 May 2023).
- Baruah, B.; Deb, P. Performance and application of carbon-based electrocatalysts in direct methanol fuel cell. Mater. Adv. 2021, 2, 5344–5364. [Google Scholar] [CrossRef]
- Ahmed, A.A.; Al Labadidi, M.; Hamada, A.T.; Orhan, M.F. Design and Utilization of a Direct Methanol Fuel Cell. Membranes 2022, 12, 1266. [Google Scholar] [CrossRef] [PubMed]
- Baquero, L.; Moiz, M.; Labib, M. Off-Grid Photovoltaic System with Battery Storage and Direct Methanol Fuel Cell as a Back-Up; University of Oldenburg: Oldenburg, Germany, 2020; pp. 1–10. [Google Scholar] [CrossRef]
- Chou, C.-J.; Jiang, S.-B.; Yeh, T.-L.; Tsai, L.-D.; Kang, K.-Y.; Liu, C.-J. A Portable Direct Methanol Fuel Cell Power Station for Long-Term Internet of Things Applications. Energies 2020, 13, 3547. [Google Scholar] [CrossRef]
- Goor, M.; Menkin, S.; Peled, E. High power direct methanol fuel cell for mobility and portable applications. Int. J. Hydrogen Energy 2019, 44, 3138–3143. [Google Scholar] [CrossRef]
- Kamarudin, S.K.; Achmad, F.; Daud, W.R.W. Overview on the application of direct methanol fuel cell (DMFC) for portable electronic devices. Int. J. Hydrogen Energy 2009, 34, 6902–6916. [Google Scholar] [CrossRef]
- Ghouse, M. Fuel Cells and Their Applications; Energy Research Institute King Abdulaziz City for Science and Technology (KACST): Riyadh, Saudi Arabia, 2012. [Google Scholar] [CrossRef]
- Sari, A.K.; Yunus, R.M.; Majlan, E.H.; Loh, K.S.; Wong, W.Y.; Saidin, N.U.; Alva, S.; Khaerudini, D.S. Nata de Cassava Type of Bacterial Cellulose Doped with Phosphoric Acid as a Proton Exchange Membrane. Membranes 2023, 13, 43. [Google Scholar] [CrossRef] [PubMed]
- Selim, A.; Szijjártó, G.P.; Tompos, A. Insights into the Influence of Different Pre-Treatments on Physicochemical Properties of Nafion XL Membrane and Fuel Cell Performance. Polymers 2022, 14, 3385. [Google Scholar] [CrossRef]
- Sherazi, T.A.; Guiver, M.D.; Kingston, D.; Ahmad, S.; Kashmiri, M.A.; Xue, X. Radiation-grafted membranes based on polyethylene for direct methanol fuel cells. J. Power Sources 2010, 195, 21–29. [Google Scholar] [CrossRef]
- Hwang, S.; Lee, H.; Jeong, Y.-G.; Choi, C.; Hwang, I.; Song, S.; Nam, S.Y.; Lee, J.H.; Kim, K. Polymer Electrolyte Membranes Containing Functionalized Organic/Inorganic Composite for Polymer Electrolyte Membrane Fuel Cell Applications. Int. J. Mol. Sci. 2022, 23, 14252. [Google Scholar] [CrossRef]
- Chowdury, S.K.; Cho, Y.J.; Park, S.B.; Park, Y.-I. Review—Functionalized Graphene Oxide Membranes as Electrolytes. J. Electrochem. Soc. 2023, 170, 033503. [Google Scholar] [CrossRef]
- Adiyar, S.R.; Satriyatama, A.; Azjuba, A.N.; Sari, N.K.A.K. An overview of synthetic polymer-based membrane modified with chitosan for direct methanol fuel cell application. IOP Conf. Ser. Mater. Sci. Eng. 2021, 1143, 012002. [Google Scholar] [CrossRef]
- Fatullayeva, S.; Tagiyev, D.; Zeynalov, N.; Mammadova, S.; Aliyeva, E. Recent advances of chitosan-based polymers in bio-medical applications and environmental protection. J. Polym. Res. 2022, 29, 259. [Google Scholar] [CrossRef]
- Junoh, H.; Jaafar, J.; Nordin, N.A.H.M.; Ismail, A.F.; Othman, M.H.D.; Rahman, M.A.; Aziz, F.; Yusof, N. Performance of Polymer Electrolyte Membrane for Direct Methanol Fuel Cell Application: Perspective on Morphological Structure. Membranes 2020, 10, 34. [Google Scholar] [CrossRef] [PubMed]
- Sigwadi, R.A.; Mokrain, T.; Msomi, P.; Nemavhola, F. The effect of sulfated zirconia and zirconium phosphate nanocomposite membranes on fuel cell efficiency. Polymers 2022, 14, 263. [Google Scholar] [CrossRef]
- Peyrovi, M.H.; Parizi, M.A. The Modification of the BET Surface Area by Considering the Excluded Area of Adsorbed Molecules. Phys. Chem. Res. 2022, 10, 173–177. [Google Scholar]
- Ambroz, F.; Macdonald, T.J.; Martis, V.; Parkin, I.P. Evaluation of the BET theory for the characterization of meso and microporous MOFs. Small Methods 2018, 2. [Google Scholar] [CrossRef]
- Bunaciu, A.A.; Udriştioiu, E.G.; Aboul-Enein, H.Y. X-ray Diffraction: Instrumentation and Applications. Crit. Rev. Anal. Chem. 2014, 45, 289–299. [Google Scholar] [CrossRef]
- Lee, E.-J.; Shin, D.-S.; Kim, H.-E.; Kim, H.-W.; Koh, Y.-H.; Jang, J.-H. Membrane of hybrid chitosan–silica xerogel for guided bone regeneration. Biomaterials 2009, 30, 743–750. [Google Scholar] [CrossRef]
- Nur, Y.; Rohaeti, E.; Darusman, L.K. Optical sensor for the determination of Pb2+ based on immobilization of dithizone onto Chitosan-Silica membrane. Indones. J. Chem. 2017, 17, 7–14. [Google Scholar] [CrossRef]
- Diaconu, M. Structural characterization of chitosan coated silicon nanoparticles -A FT-IR approach. UPB Sci. Bull. Ser. B Chem. Mater. Sci. 2010, 72, 115–122. [Google Scholar]
- Purwanto, M.; Widiastuti, N.; Saga, B.H.; Gusmawan, H. Synthesis of Composite Membrane Based Biopolymer Chitosan with Silica from Rice Husk Ash for Direct Methanol Fuel Cell Application. IOP Conf. Ser. Earth Environ. Sci. 2021, 830, 012021. [Google Scholar] [CrossRef]
- Xu, B.; Zhang, Q. Preparation and Properties of Hydrophobically Modified Nano-SiO2with Hexadecyltrimethoxysilane. ACS Omega 2021, 6, 9764–9770. [Google Scholar] [CrossRef] [PubMed]
- Zuo, Z.; Fu, Y.; Manthiram, A. Novel Blend Membranes Based on Acid-Base Interactions for Fuel Cells. Polymers 2012, 4, 1627–1644. [Google Scholar] [CrossRef]
- Bai, H.; Zhang, H.; He, Y.; Liu, J.; Zhang, B.; Wang, J. Enhanced proton conduction of chitosan membrane enabled by hal-loysite nanotubes bearing sulfonate polyelectrolyte brushes. J. Memb. Sci. 2014, 454, 220–232. [Google Scholar] [CrossRef]
- Kusumastuti Widasari, T.S.; Widhi Mahatmati, F. Modification of chitosan membranes with nanosilica particles as polymer electrolyte membranes. AIP Conf. Proc. 2016, 1725, 020037. [Google Scholar]
- Lue, S.J.; Pai, Y.-L.; Shih, C.-M.; Wu, M.-C.; Lai, S.-M. Novel bilayer well-aligned Nafion/graphene oxide composite membranes prepared using spin coating method for direct liquid fuel cells. J. Membr. Sci. 2015, 493, 212–223. [Google Scholar] [CrossRef]
- Mahatmanti, F.W.; Nuryono, N.; Narsito, N. Physical Characteristics of Chitosan Based Film Modified With Silica and Polyethylene Glycol. Indones. J. Chem. 2014, 14, 131–137. [Google Scholar] [CrossRef]
- Lim, C.; Hwang, D.S.; Lee, D.W. Intermolecular interactions of chitosan: Degree of acetylation and molecular weight. Carbohydr. Polym. 2021, 259, 117782. [Google Scholar] [CrossRef]
- Sami, R.; Soltane, S.; Helal, M. Microscopic Image Segmentation and Morphological Characterization of Novel Chitosan/Silica Nanoparticle/Nisin Films Using Antimicrobial Technique for Blueberry Preservation. Membranes 2021, 11, 303. [Google Scholar] [CrossRef]
- Dutta, P.K.; Dutta, J.; Tripathi, V.S. Chitin and chitosan: Chemistry, properties and applications. J. Sci. Ind. Res. 2004, 63, 20–31. [Google Scholar]
- Li, B.; Elango, J.; Wu, W. Recent advancement of molecular structure and biomaterial function of chitosan from marine or-ganisms for pharmaceutical and nutraceutical application. Appl. Sci. 2020, 10, 30–50. [Google Scholar]
- Khamaruddin, P.F.; Bustam, M.A.; Omar, A.A. Using Fenton’s Reagents for the Degradation of Diisopropanolamine: Effect of Temperature and pH. In Proceedings of the 2011 International Conference on Environment and Industrial Innovation IPCBEE, Kuala Lumpur, Malaysia, 4–5 June 2011; IACSIT Press: Singapore, 2011. [Google Scholar]
- He, B.; Xu, G.; Zhou, M.; Yuan, Q. Effect of Oxidation Temperature on the Oxidation Process of Silicon-Containing Steel. Metals 2016, 6, 137. [Google Scholar] [CrossRef]
- Pellis, A.; Guebitz, G.M.; Nyanhongo, G.S. Chitosan: Sources, Processing and Modification Techniques. Gels 2022, 8, 393. [Google Scholar] [CrossRef] [PubMed]
Figure 1.
FTIR of (a) 4% s-SiO2/Cs, (b) 4% SiO2/Cs, (c) 2% SiO2/Cs, (d) 2% s-SiO2/Cs, and (e) Cs–Sol-gel (2 h).
Figure 1.
FTIR of (a) 4% s-SiO2/Cs, (b) 4% SiO2/Cs, (c) 2% SiO2/Cs, (d) 2% s-SiO2/Cs, and (e) Cs–Sol-gel (2 h).
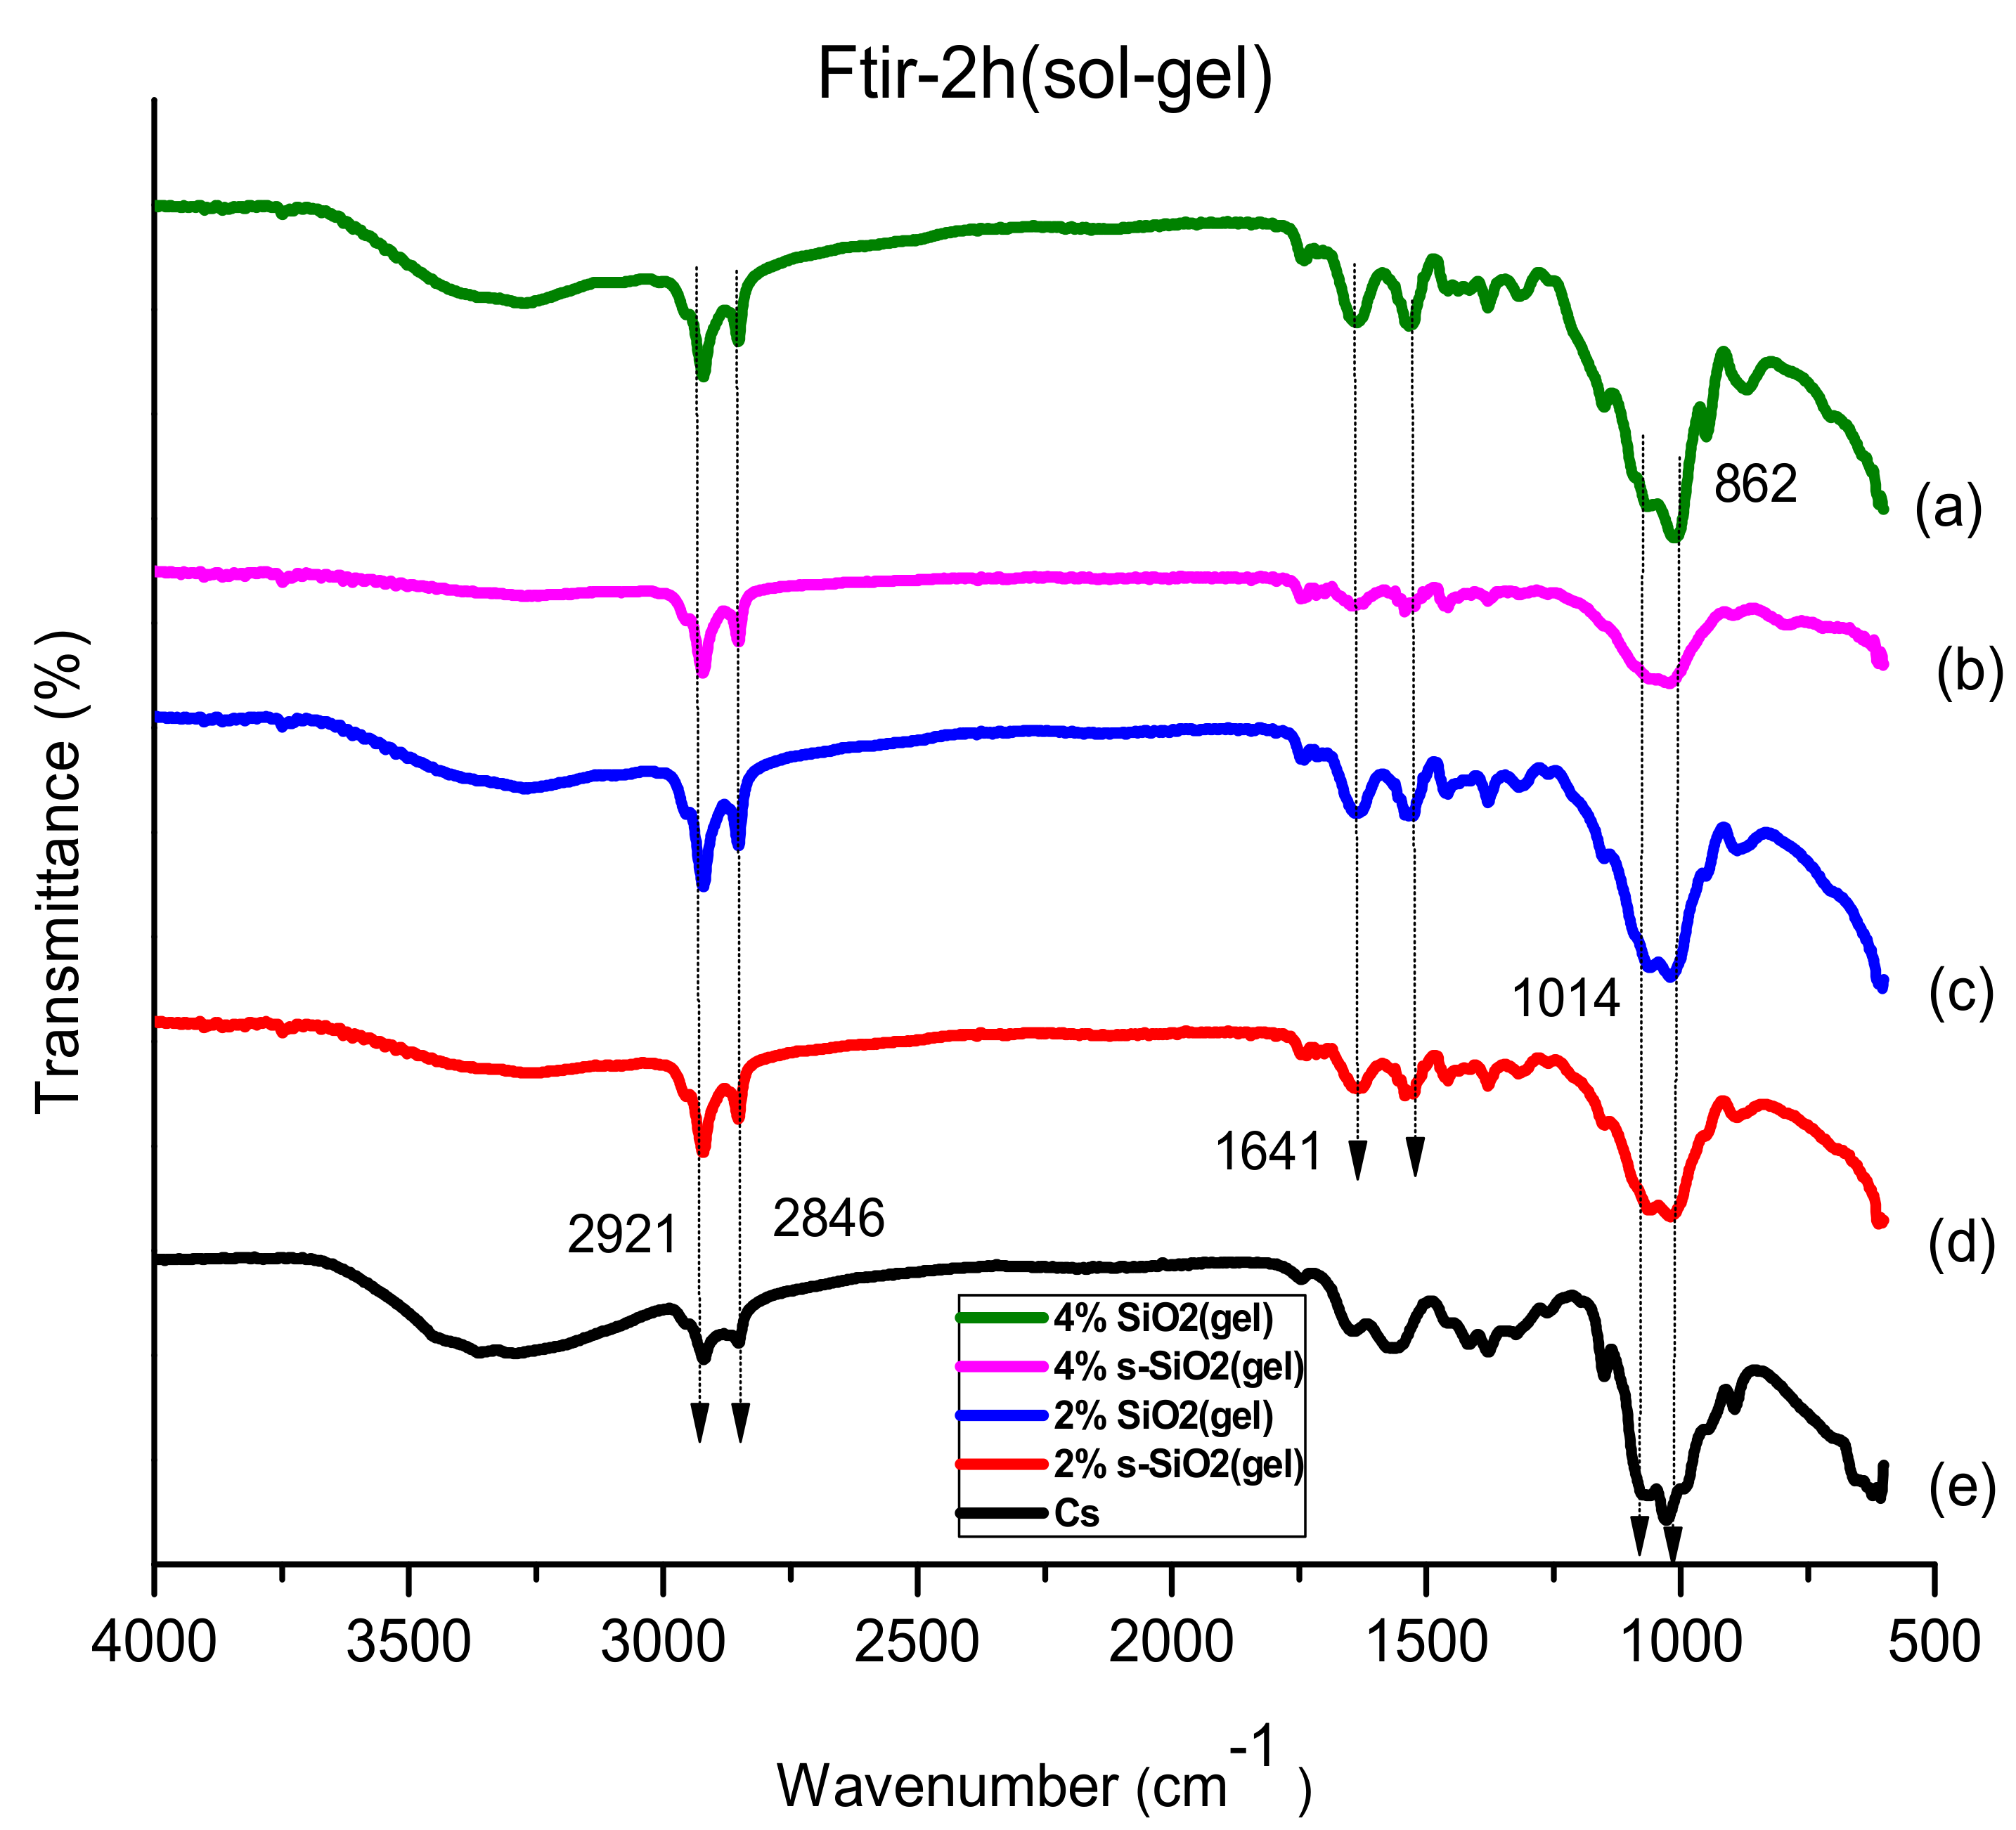
Figure 2.
FTIR of (a) 4% s-SiO2/Cs, (b) 4% SiO2/Cs, (c) 2% SiO2/Cs, (d) 2% s-SiO2/Cs, and (e) Cs–(Stober 2 h).
Figure 2.
FTIR of (a) 4% s-SiO2/Cs, (b) 4% SiO2/Cs, (c) 2% SiO2/Cs, (d) 2% s-SiO2/Cs, and (e) Cs–(Stober 2 h).

Figure 3.
XRD of (a) Cs, (b) 4% s-SiO2/Cs, (c) 4% SiO2/Cs, (d) 2% s-SiO2/Cs, and (e) 2% SiO2/Cs–Sol gel (2 h).
Figure 3.
XRD of (a) Cs, (b) 4% s-SiO2/Cs, (c) 4% SiO2/Cs, (d) 2% s-SiO2/Cs, and (e) 2% SiO2/Cs–Sol gel (2 h).

Figure 4.
XRD of (a) 2% SiO2/Cs, (b) 2% s-SiO2/Cs, (c) 4% SiO2/Cs, (d) 4% s-SiO2/Cs, and (e) Cs–(Stober 2 h).
Figure 4.
XRD of (a) 2% SiO2/Cs, (b) 2% s-SiO2/Cs, (c) 4% SiO2/Cs, (d) 4% s-SiO2/Cs, and (e) Cs–(Stober 2 h).
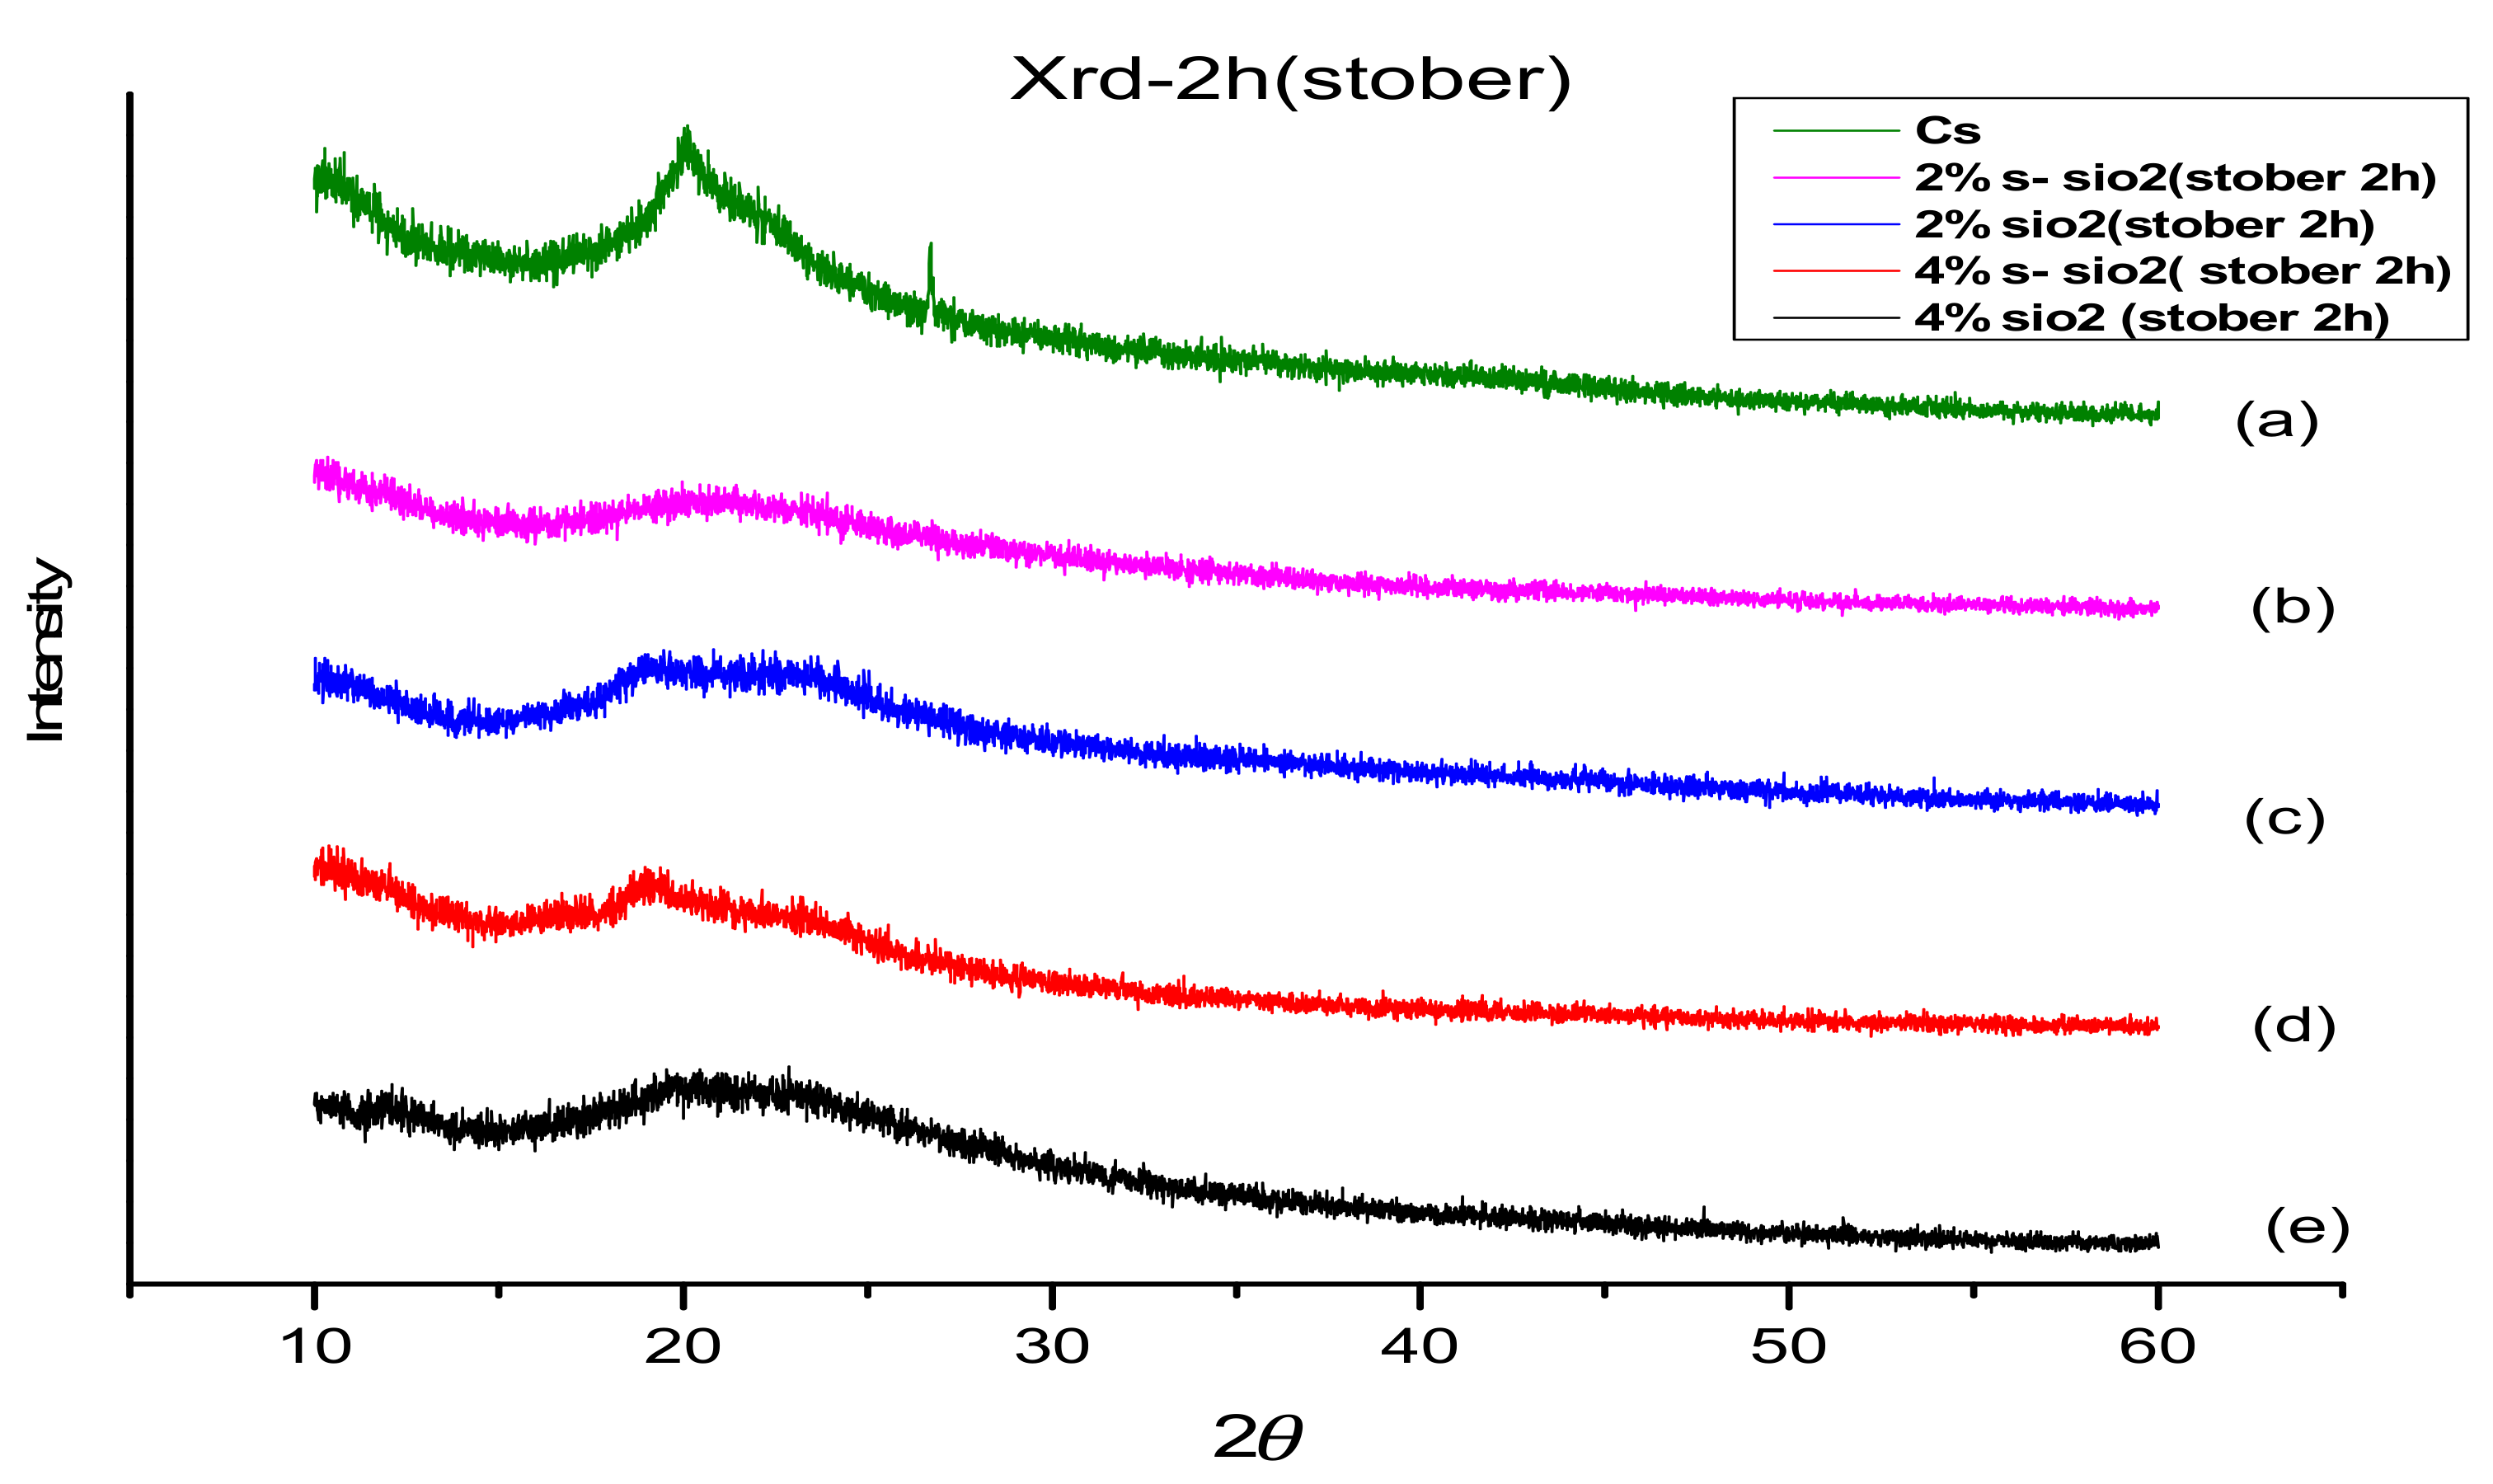
Figure 5.
SEM of (a) Cs, (b) 4% s-SiO2/Cs, (c) 4% SiO2/Cs, (d) 2% s-SiO2/Cs, and (e) 2% SiO2/Cs–Sol-gel (2 h).
Figure 5.
SEM of (a) Cs, (b) 4% s-SiO2/Cs, (c) 4% SiO2/Cs, (d) 2% s-SiO2/Cs, and (e) 2% SiO2/Cs–Sol-gel (2 h).
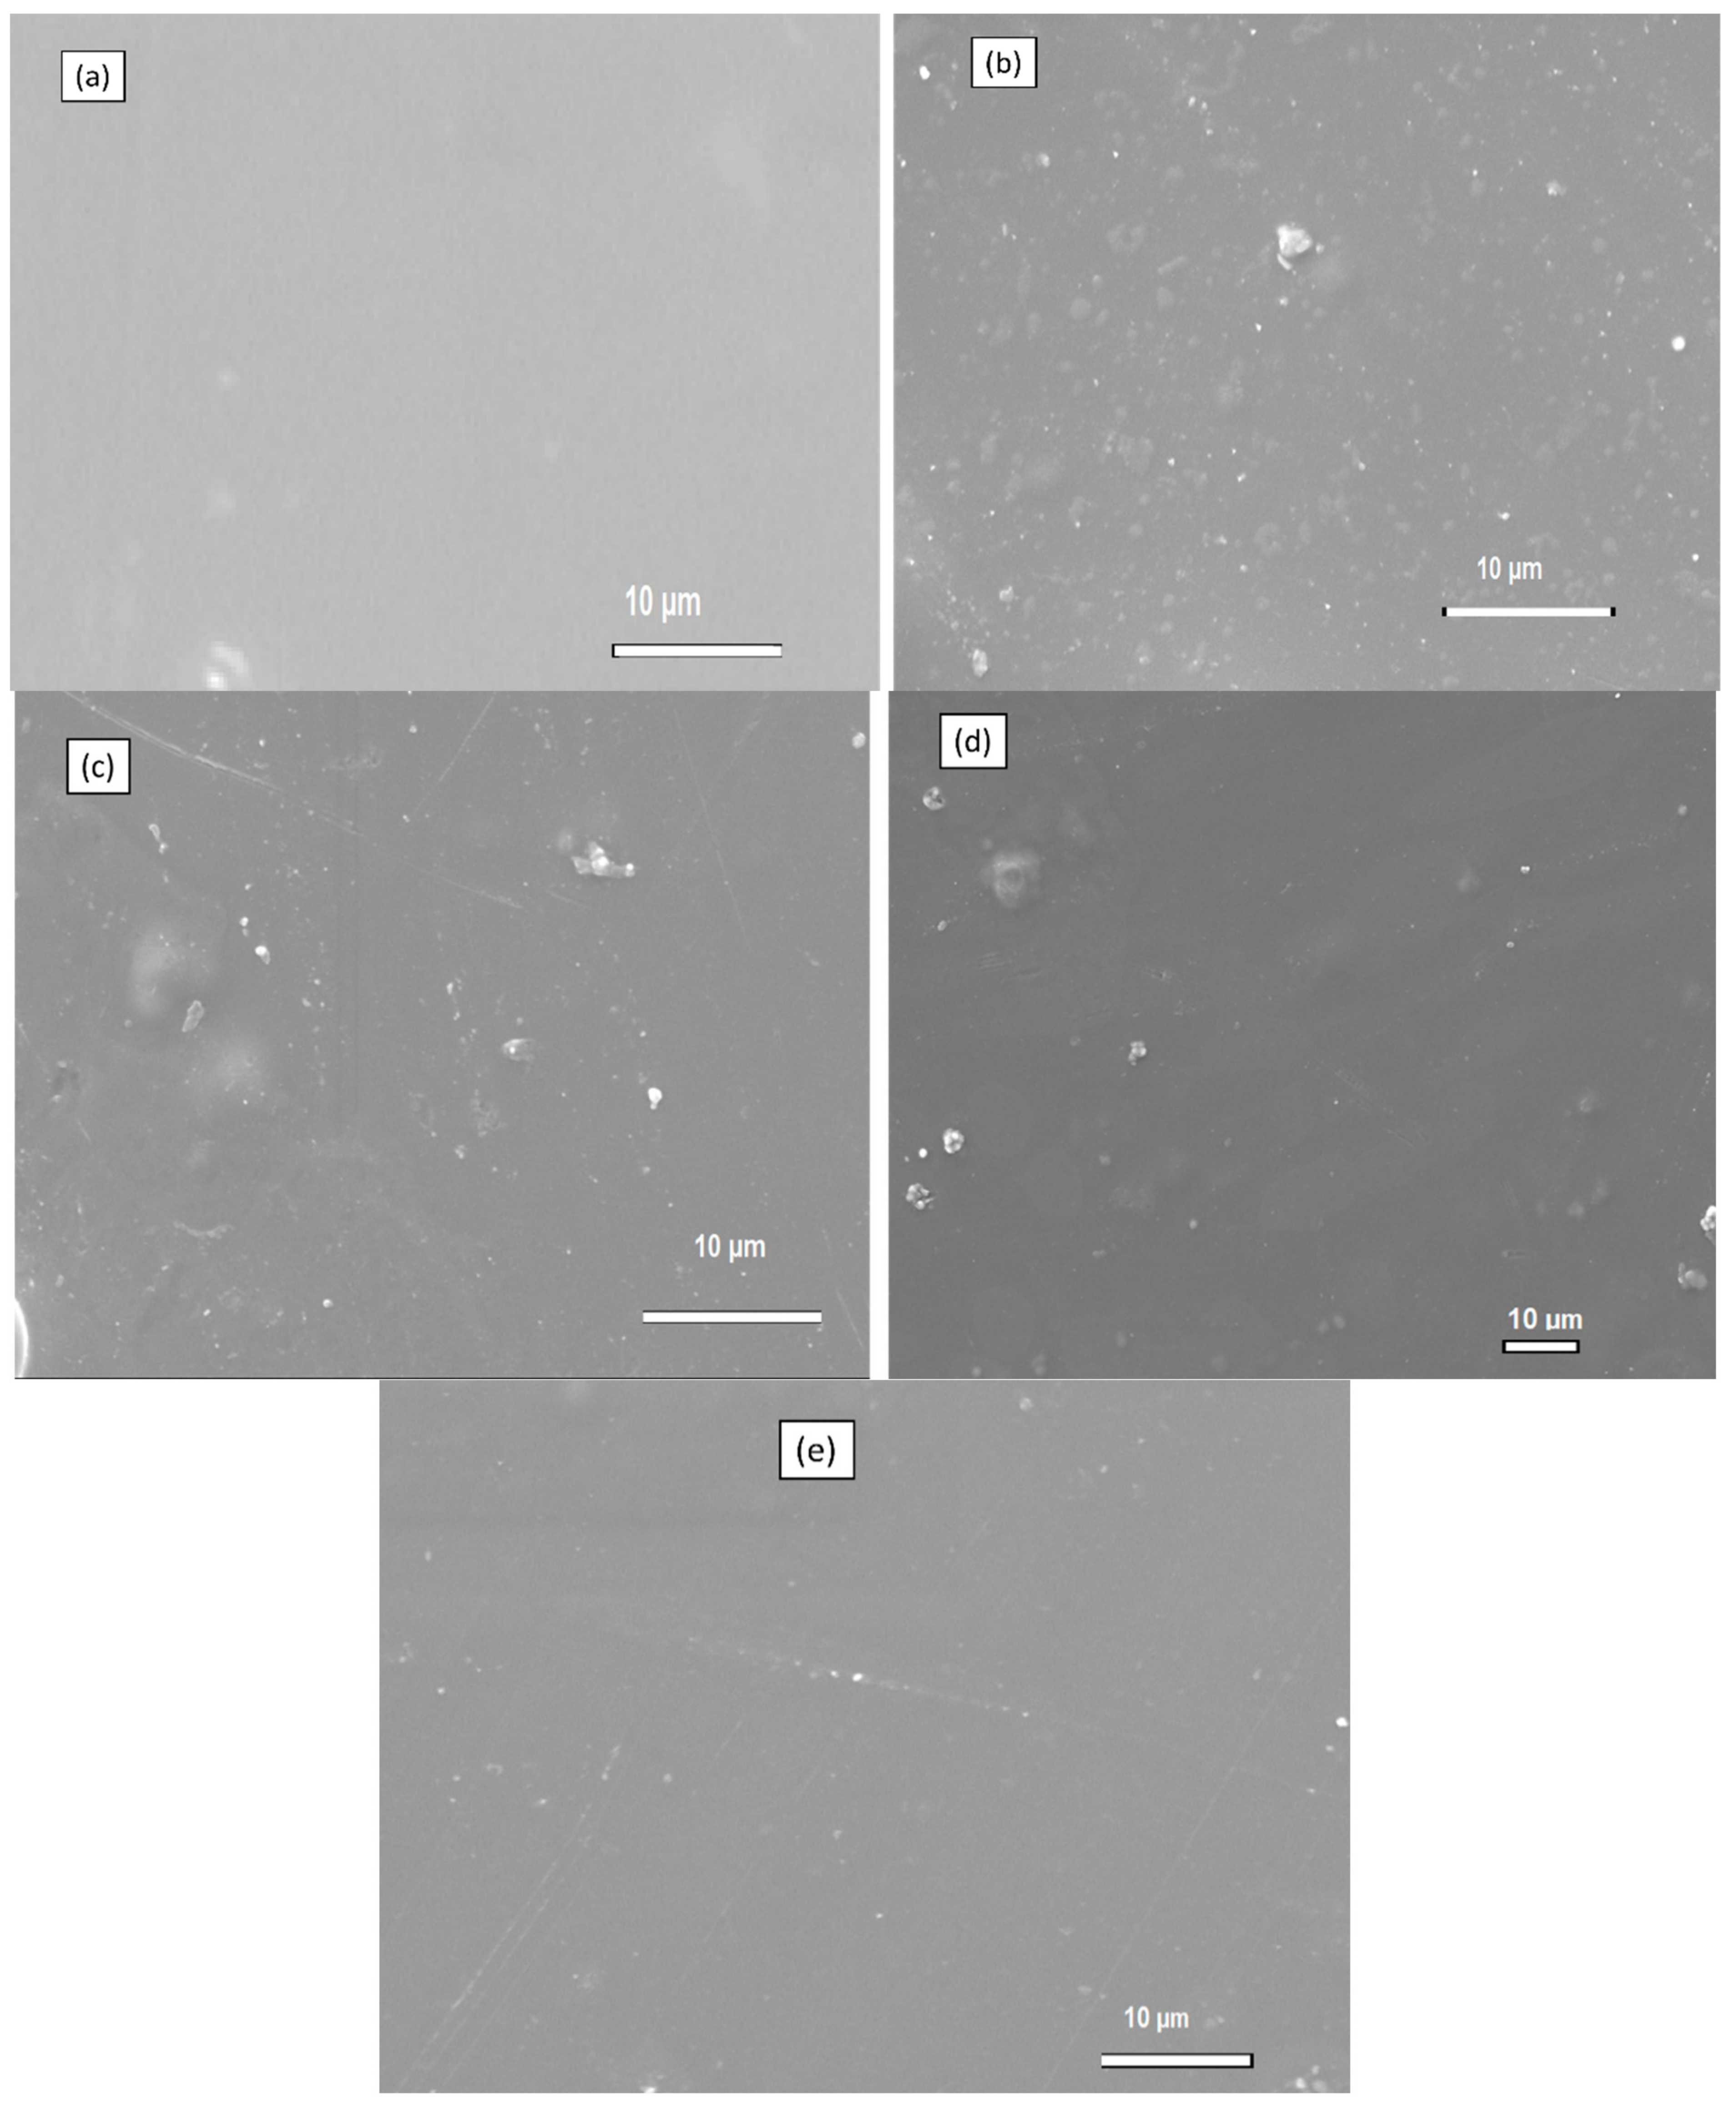
Figure 6.
SEM of (a) 2% s-SiO2/Cs, (b) 2% SiO2/Cs, (c) 4% s-SiO2/Cs, and (d) 4% SiO2/Cs-Stober (2h).
Figure 6.
SEM of (a) 2% s-SiO2/Cs, (b) 2% SiO2/Cs, (c) 4% s-SiO2/Cs, and (d) 4% SiO2/Cs-Stober (2h).

Figure 7.
Effect of silica content on water uptake of Cs, 2% s-SiO2/Cs, 2% SiO2/Cs, 4% s-SiO2/Cs, and 4% SiO2/Cs–Sol-gel (2 h) and Stober (2 h).
Figure 7.
Effect of silica content on water uptake of Cs, 2% s-SiO2/Cs, 2% SiO2/Cs, 4% s-SiO2/Cs, and 4% SiO2/Cs–Sol-gel (2 h) and Stober (2 h).
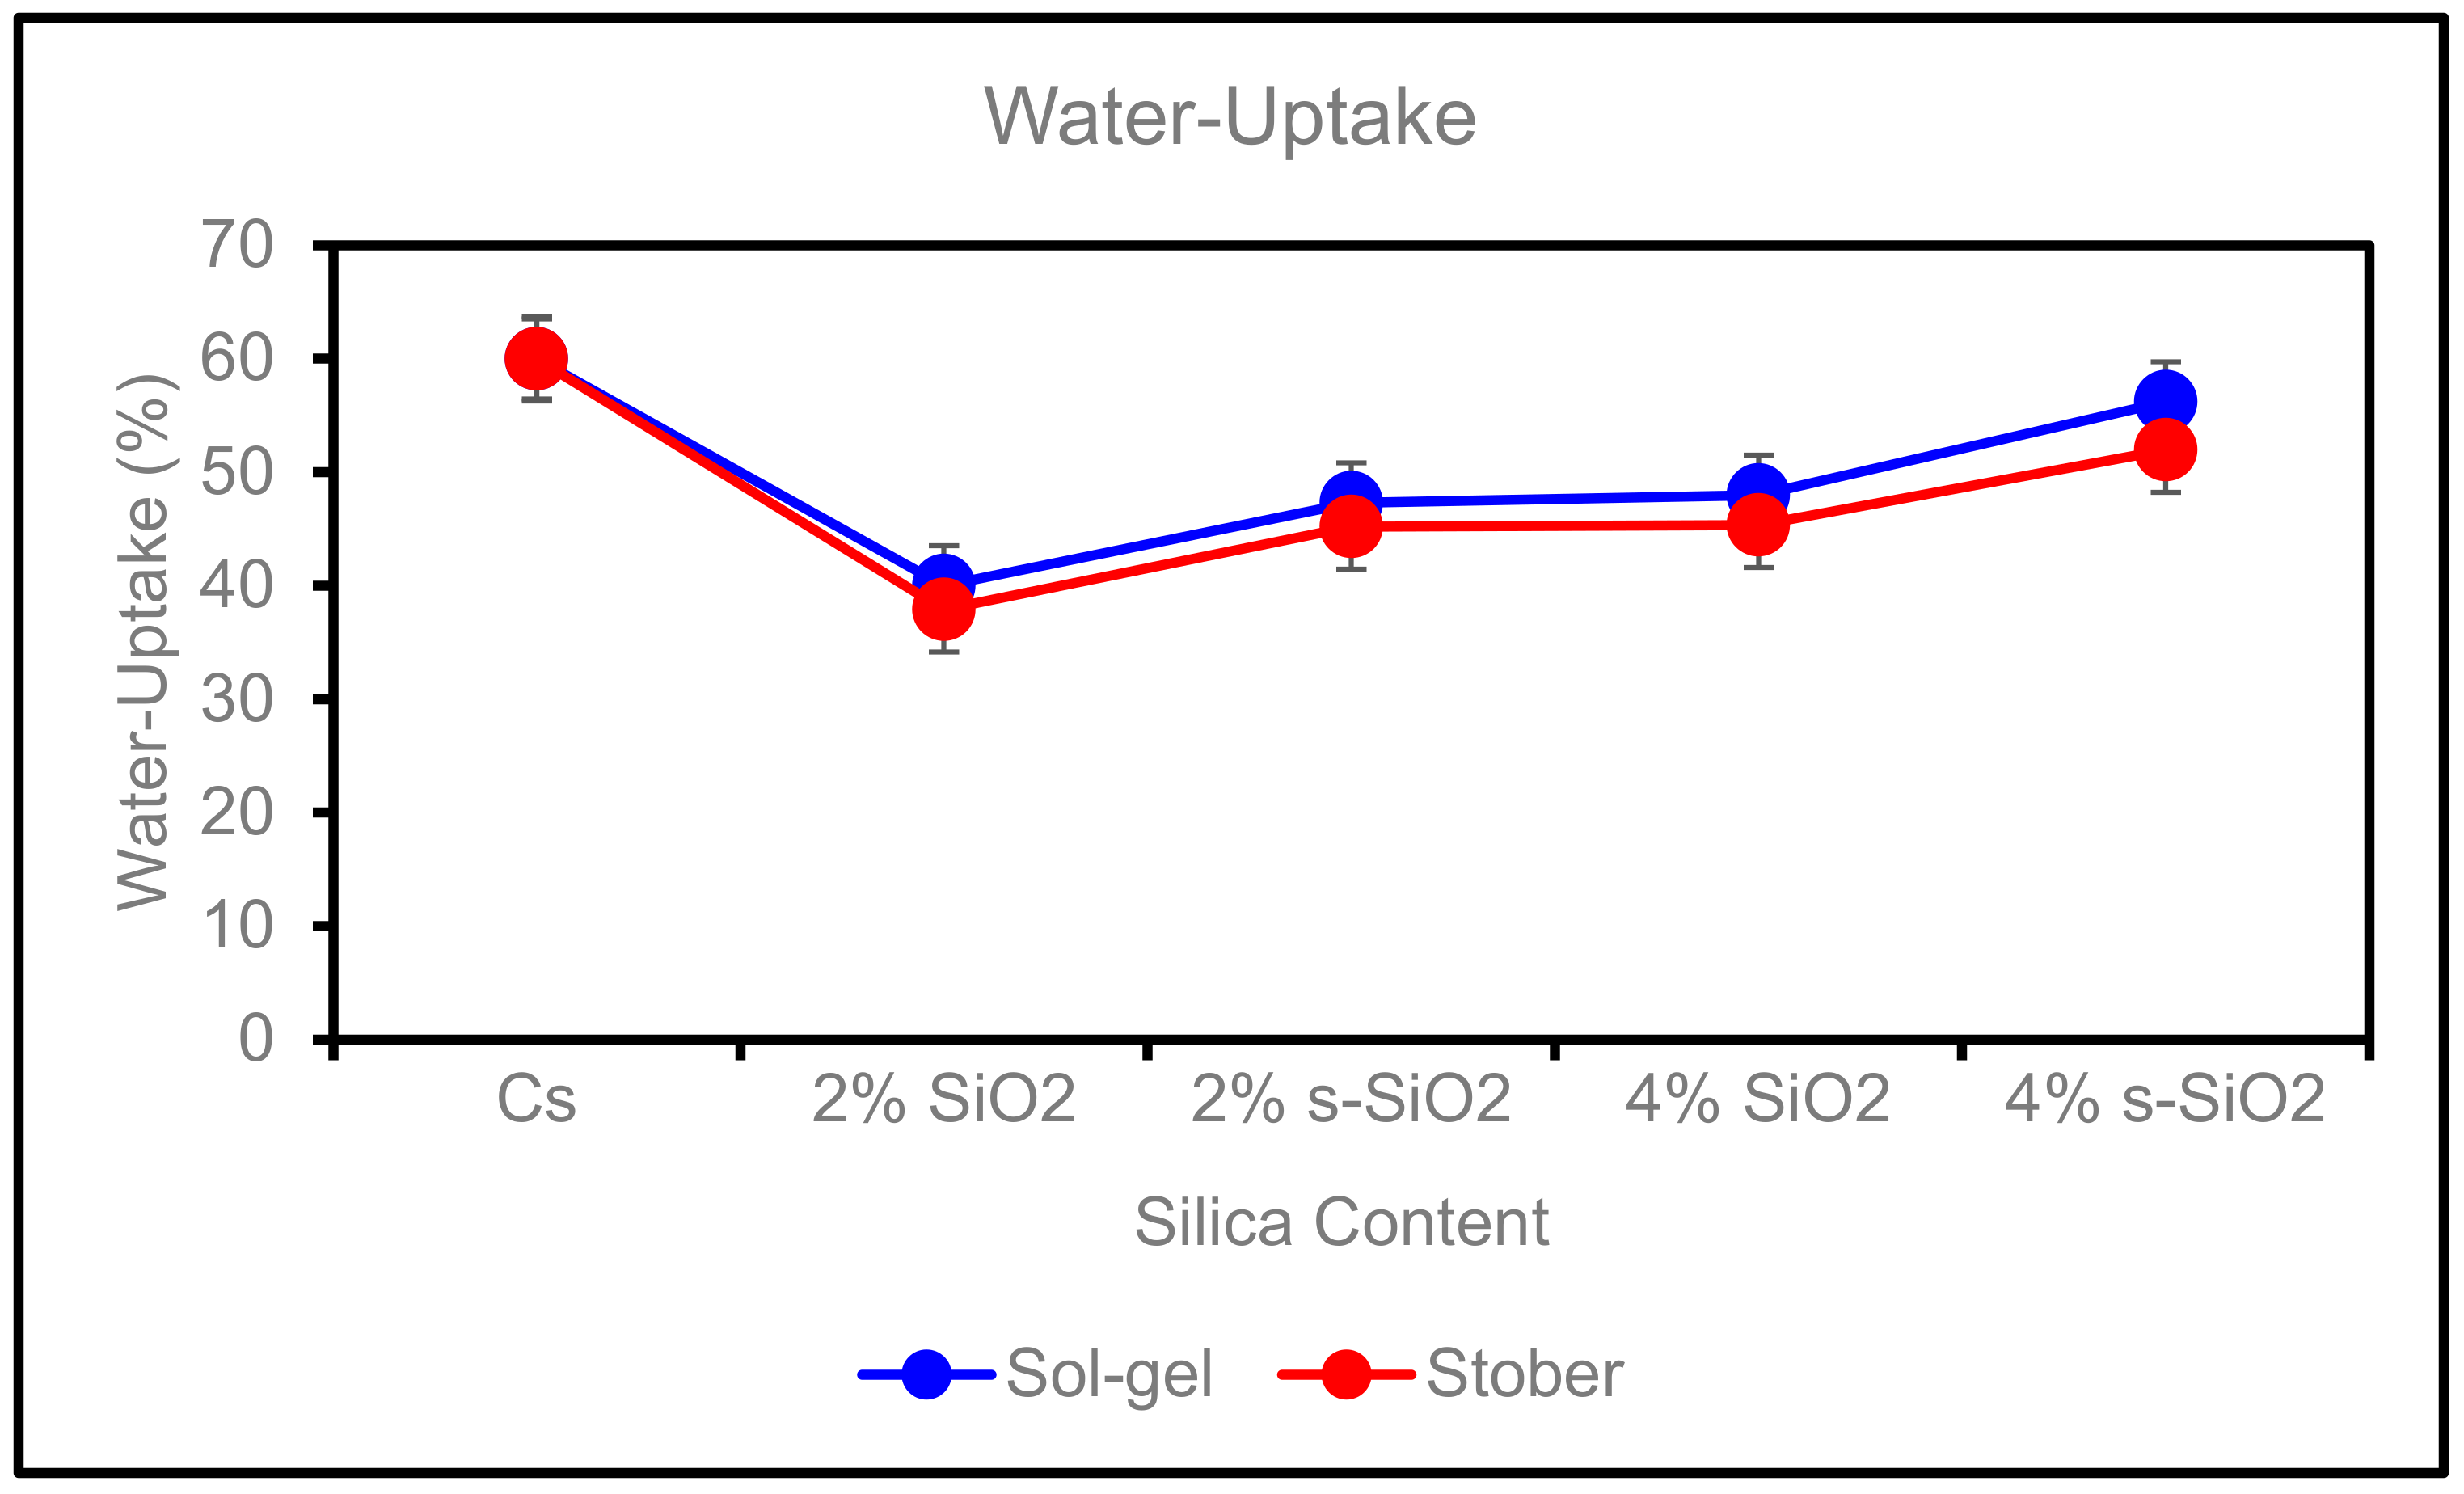
Figure 8.
Effect of temperature on water uptake of Cs, 2% s-SiO2/Cs, 2% SiO2/Cs, 4% s-SiO2/Cs, and 4% SiO2/Cs–Sol-gel (2 h).
Figure 8.
Effect of temperature on water uptake of Cs, 2% s-SiO2/Cs, 2% SiO2/Cs, 4% s-SiO2/Cs, and 4% SiO2/Cs–Sol-gel (2 h).
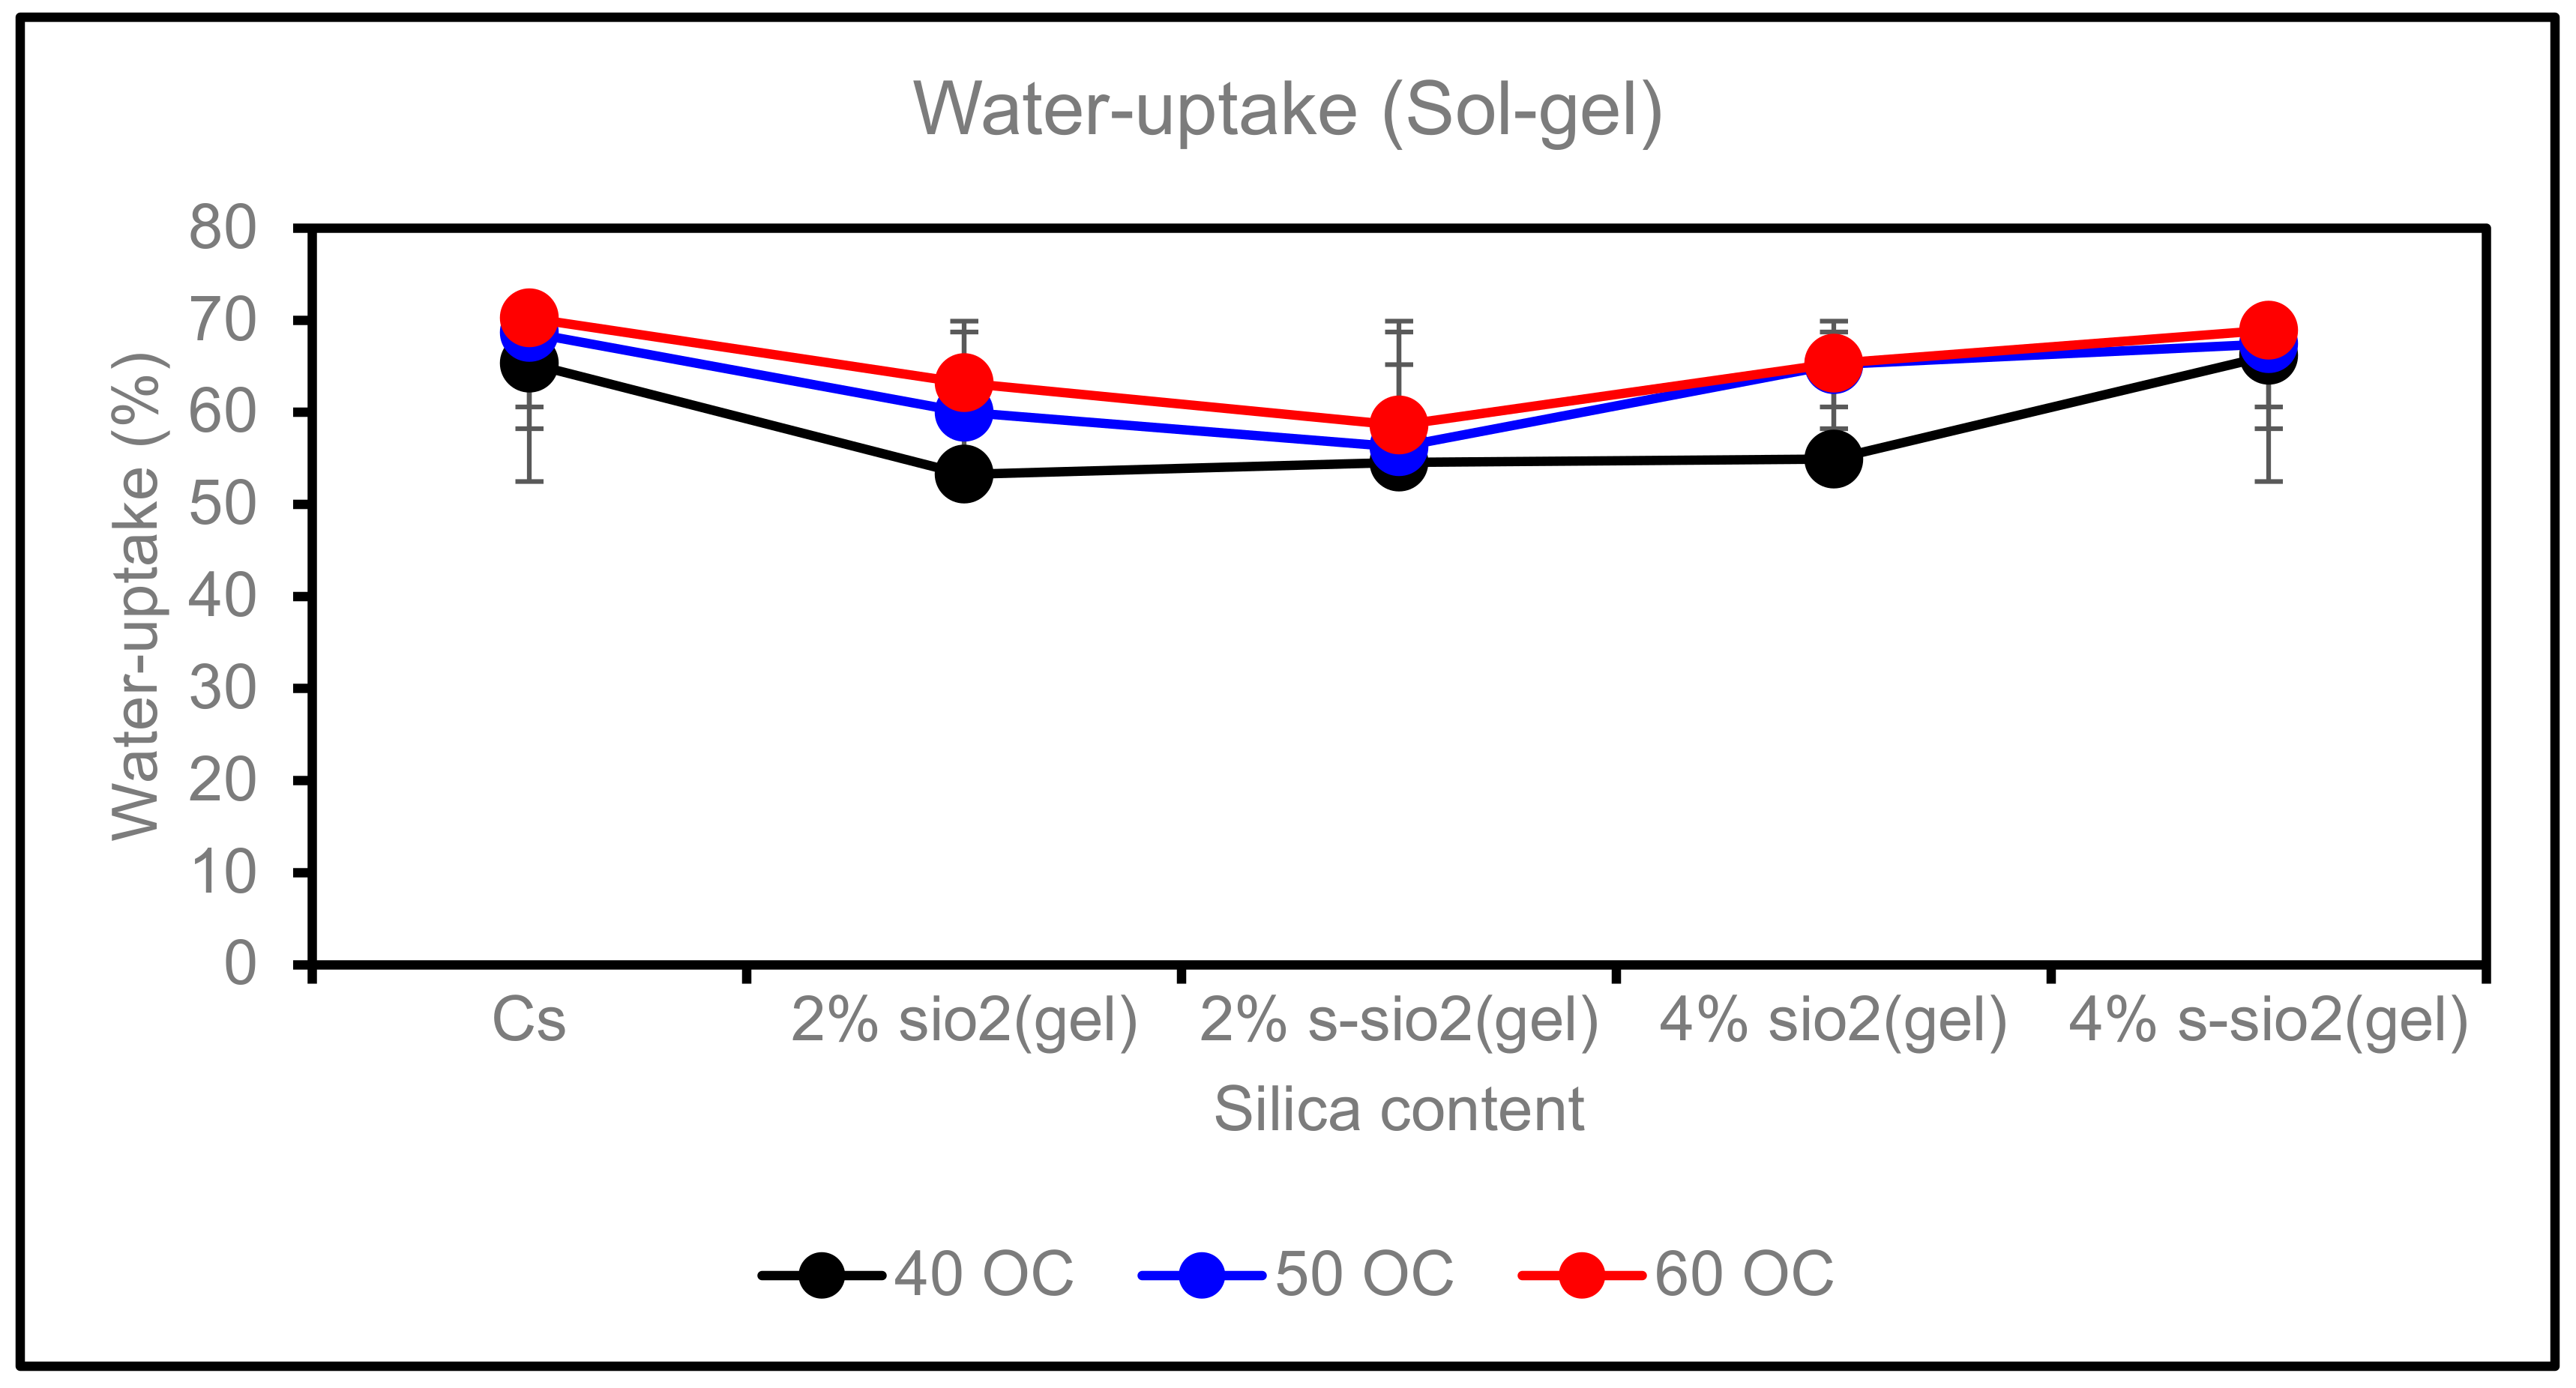
Figure 9.
Effect of temperature on water uptake of Cs, 2% s-SiO2/Cs, 2% SiO2/Cs, 4% s-SiO2/Cs, and 4% SiO2/Cs–Stober (2 h).
Figure 9.
Effect of temperature on water uptake of Cs, 2% s-SiO2/Cs, 2% SiO2/Cs, 4% s-SiO2/Cs, and 4% SiO2/Cs–Stober (2 h).
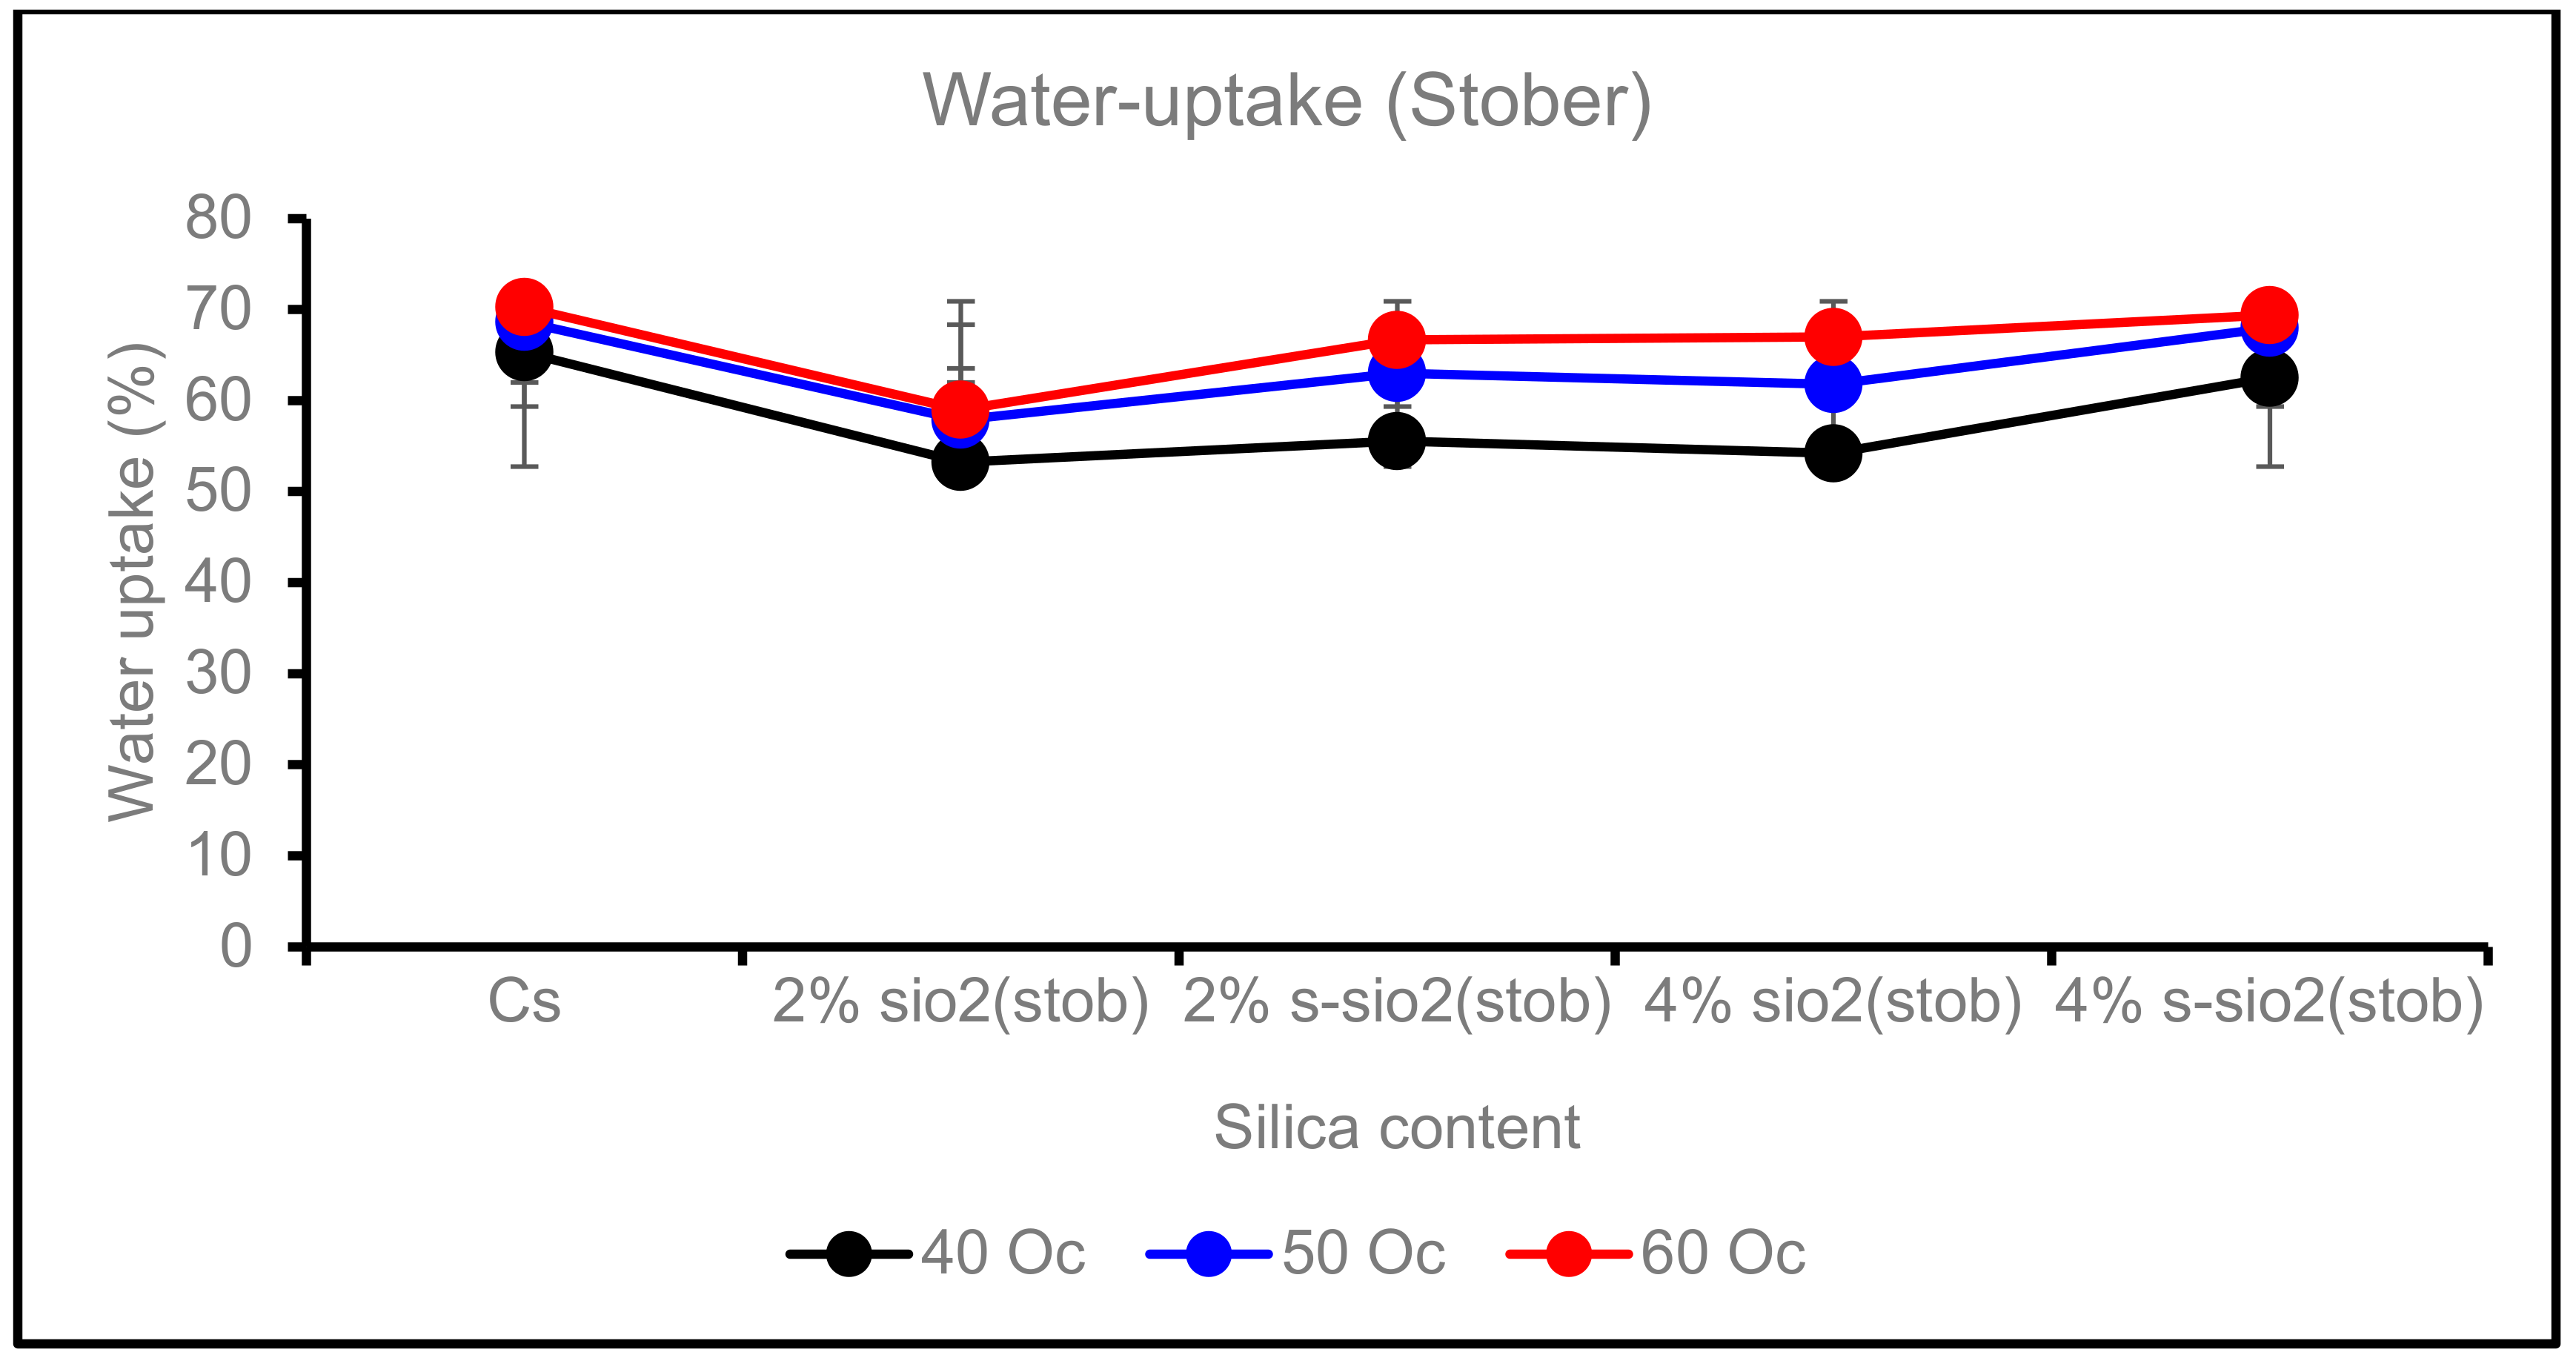
Figure 10.
Ion exchange capacity of Cs, 2% s-SiO2/Cs, 2% SiO2/Cs, 4% s-SiO2/Cs, 4% SiO2/Cs, and Sol-gel (2 h) and Stober (2 h).
Figure 10.
Ion exchange capacity of Cs, 2% s-SiO2/Cs, 2% SiO2/Cs, 4% s-SiO2/Cs, 4% SiO2/Cs, and Sol-gel (2 h) and Stober (2 h).
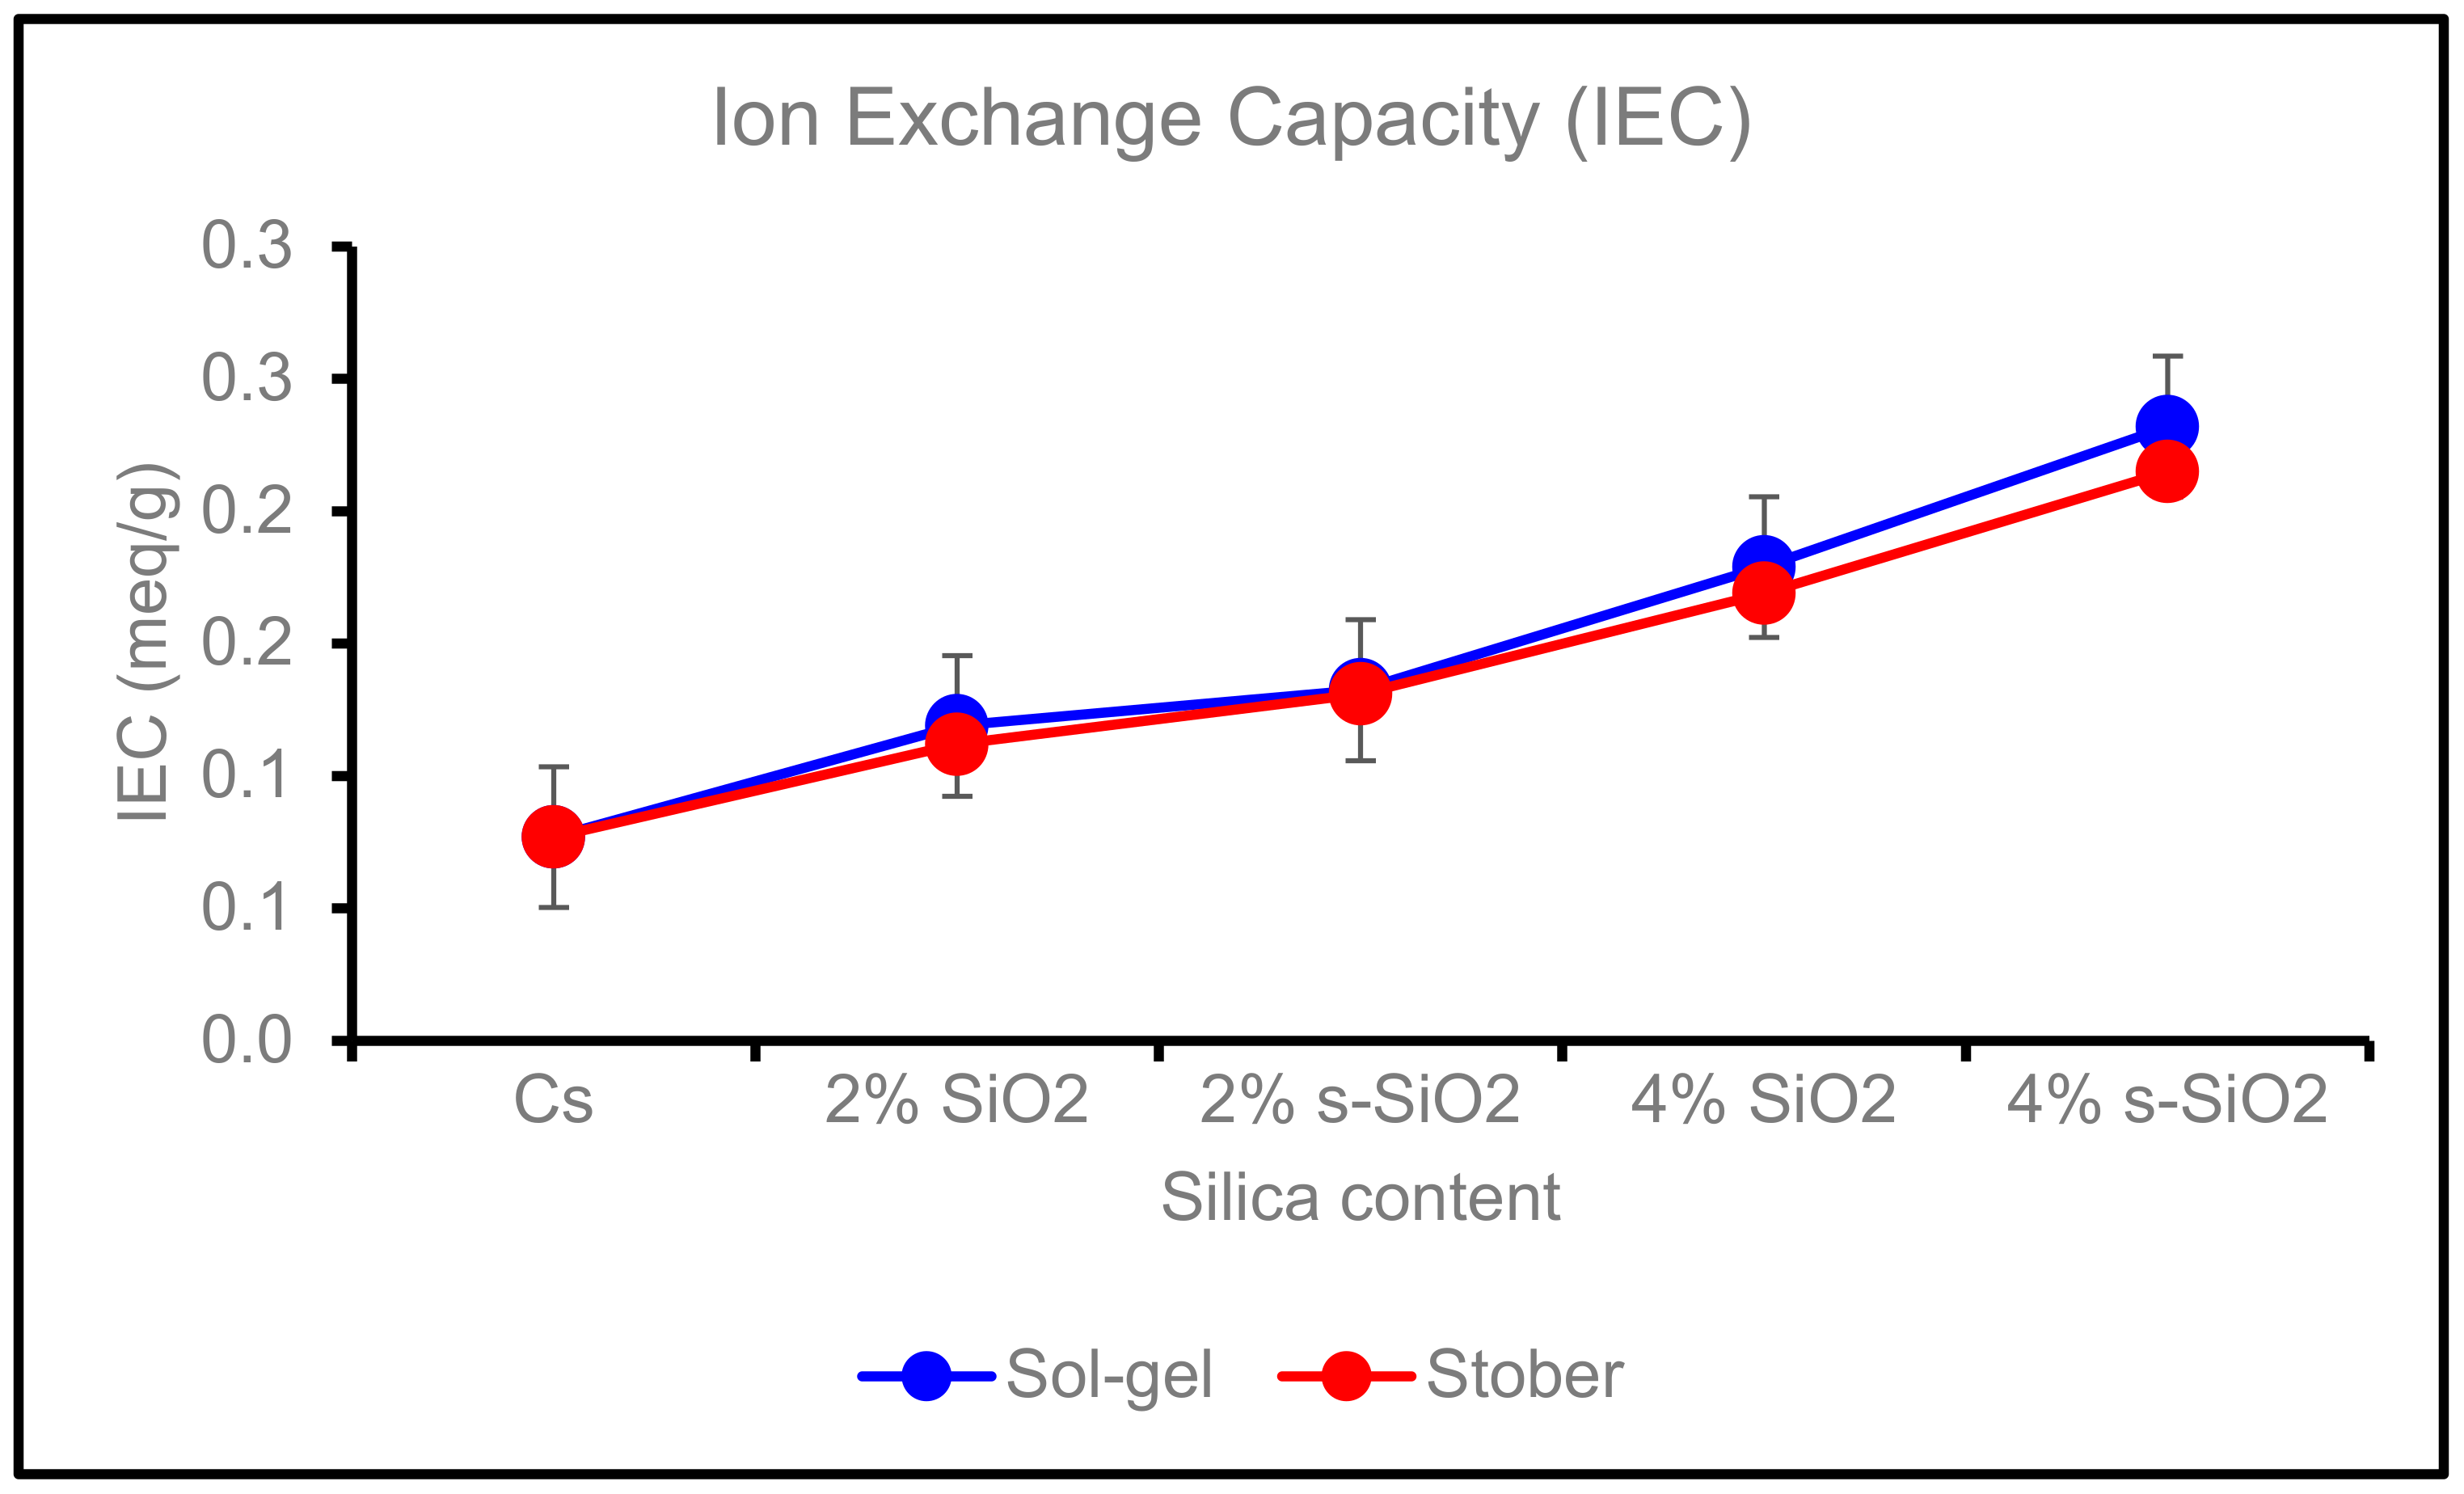
Figure 11.
Proton conductivity of Cs, 2% s-SiO2/Cs, 2% SiO2/Cs, 4% s-SiO2/Cs, and 4% SiO2/Cs–Sol-gel (2 h) and Stober (2 h).
Figure 11.
Proton conductivity of Cs, 2% s-SiO2/Cs, 2% SiO2/Cs, 4% s-SiO2/Cs, and 4% SiO2/Cs–Sol-gel (2 h) and Stober (2 h).
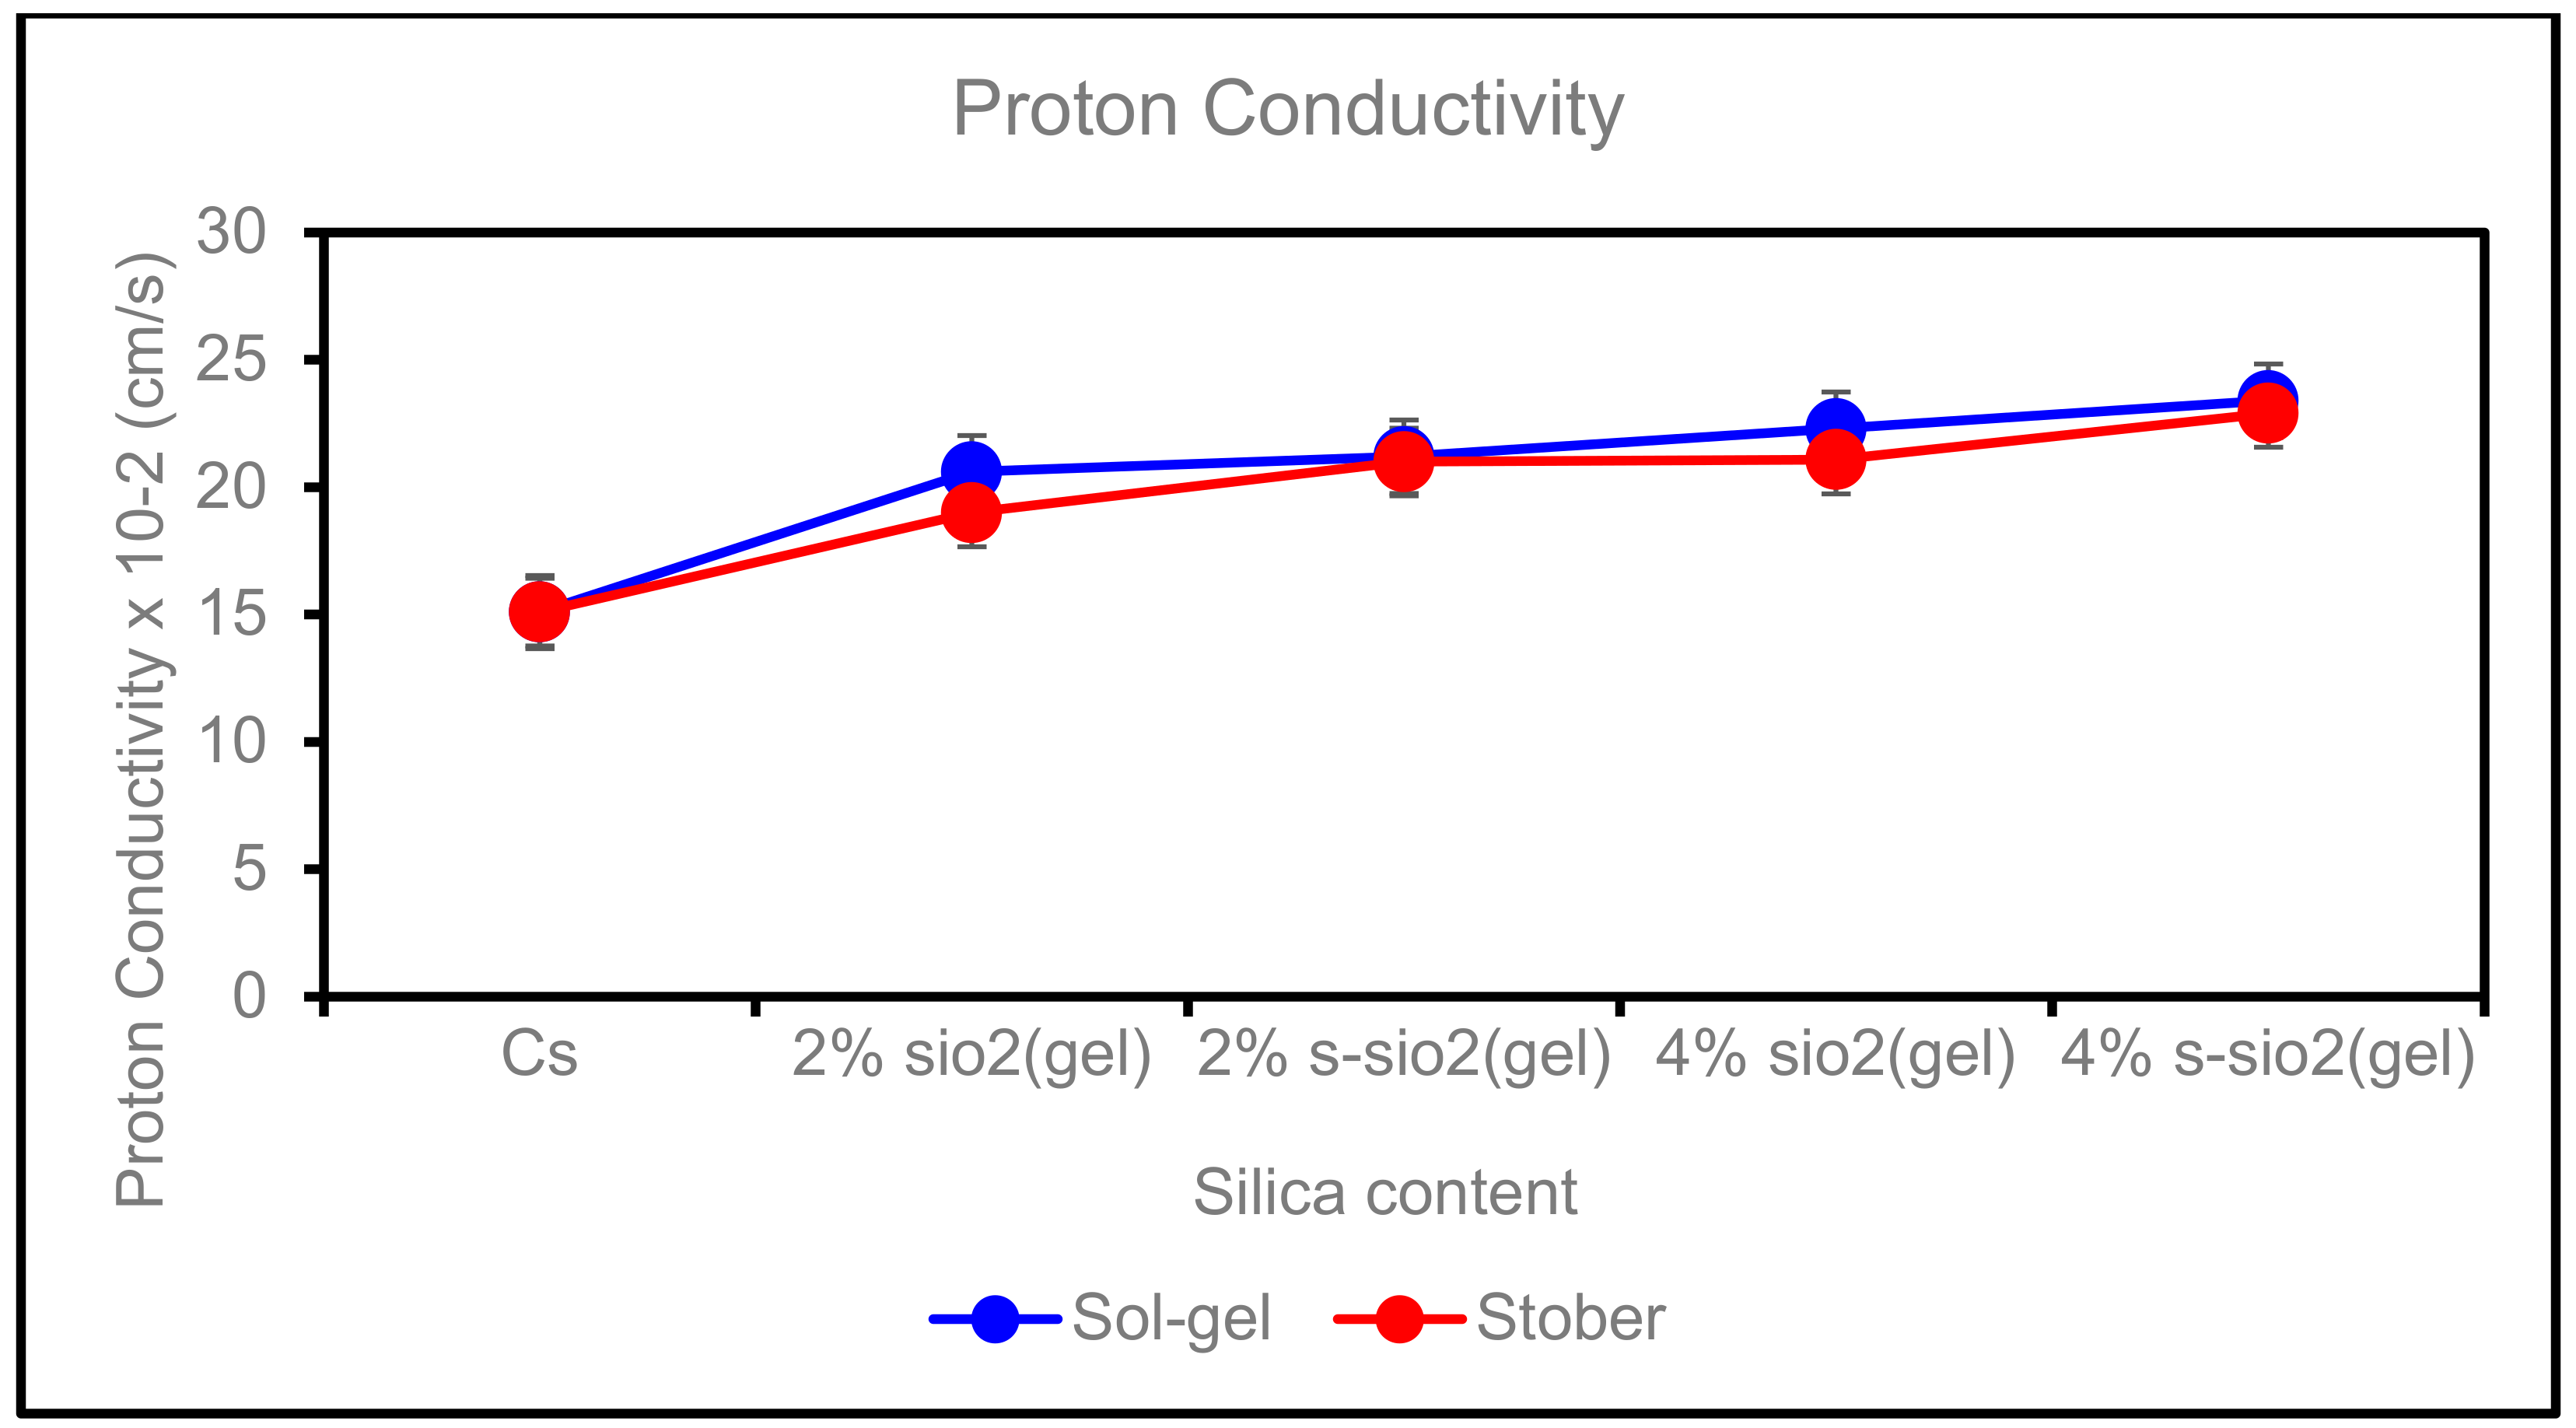
Figure 12.
Methanol permeability of Cs, 2% s-SiO2/Cs, 2% SiO2/Cs, 4% s-SiO2/Cs, and 4% SiO2/Cs–Sol-gel (2 h).
Figure 12.
Methanol permeability of Cs, 2% s-SiO2/Cs, 2% SiO2/Cs, 4% s-SiO2/Cs, and 4% SiO2/Cs–Sol-gel (2 h).
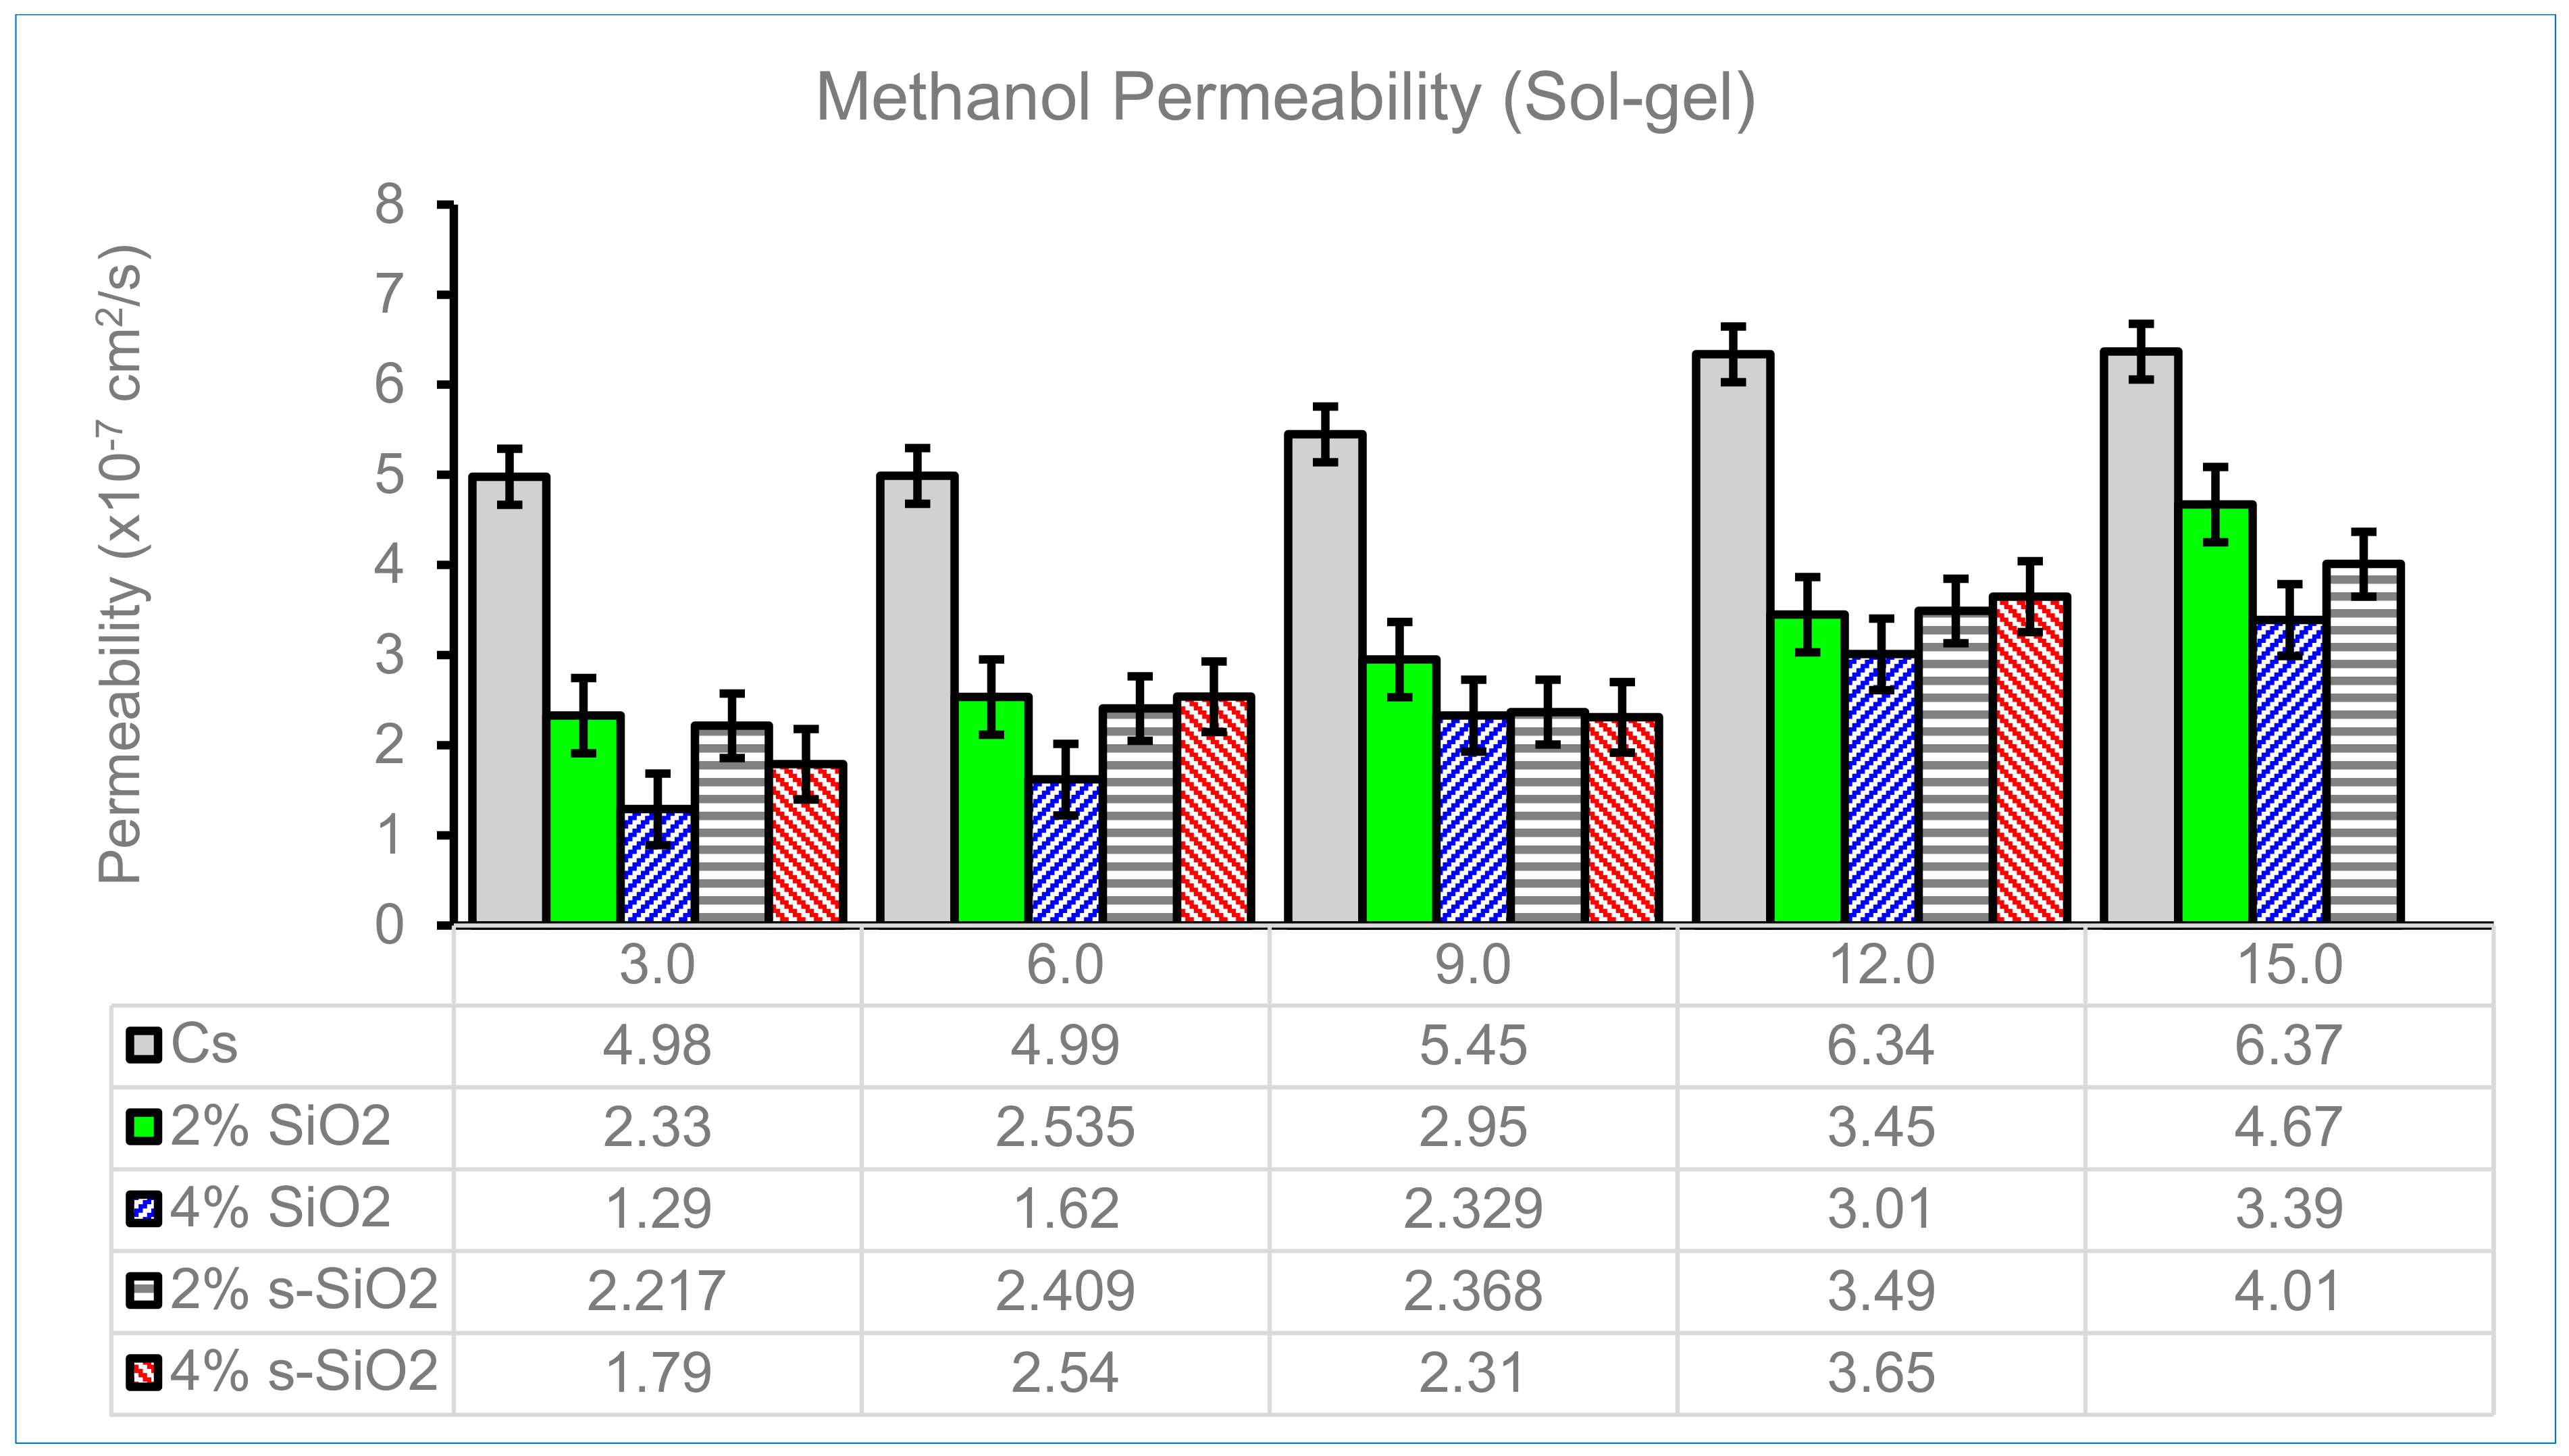
Figure 13.
Methanol permeability of Cs, 2% s-SiO2/Cs, 2% SiO2/Cs, 4% s-SiO2/Cs, and 4% SiO2/Cs–Stober (2 h).
Figure 13.
Methanol permeability of Cs, 2% s-SiO2/Cs, 2% SiO2/Cs, 4% s-SiO2/Cs, and 4% SiO2/Cs–Stober (2 h).
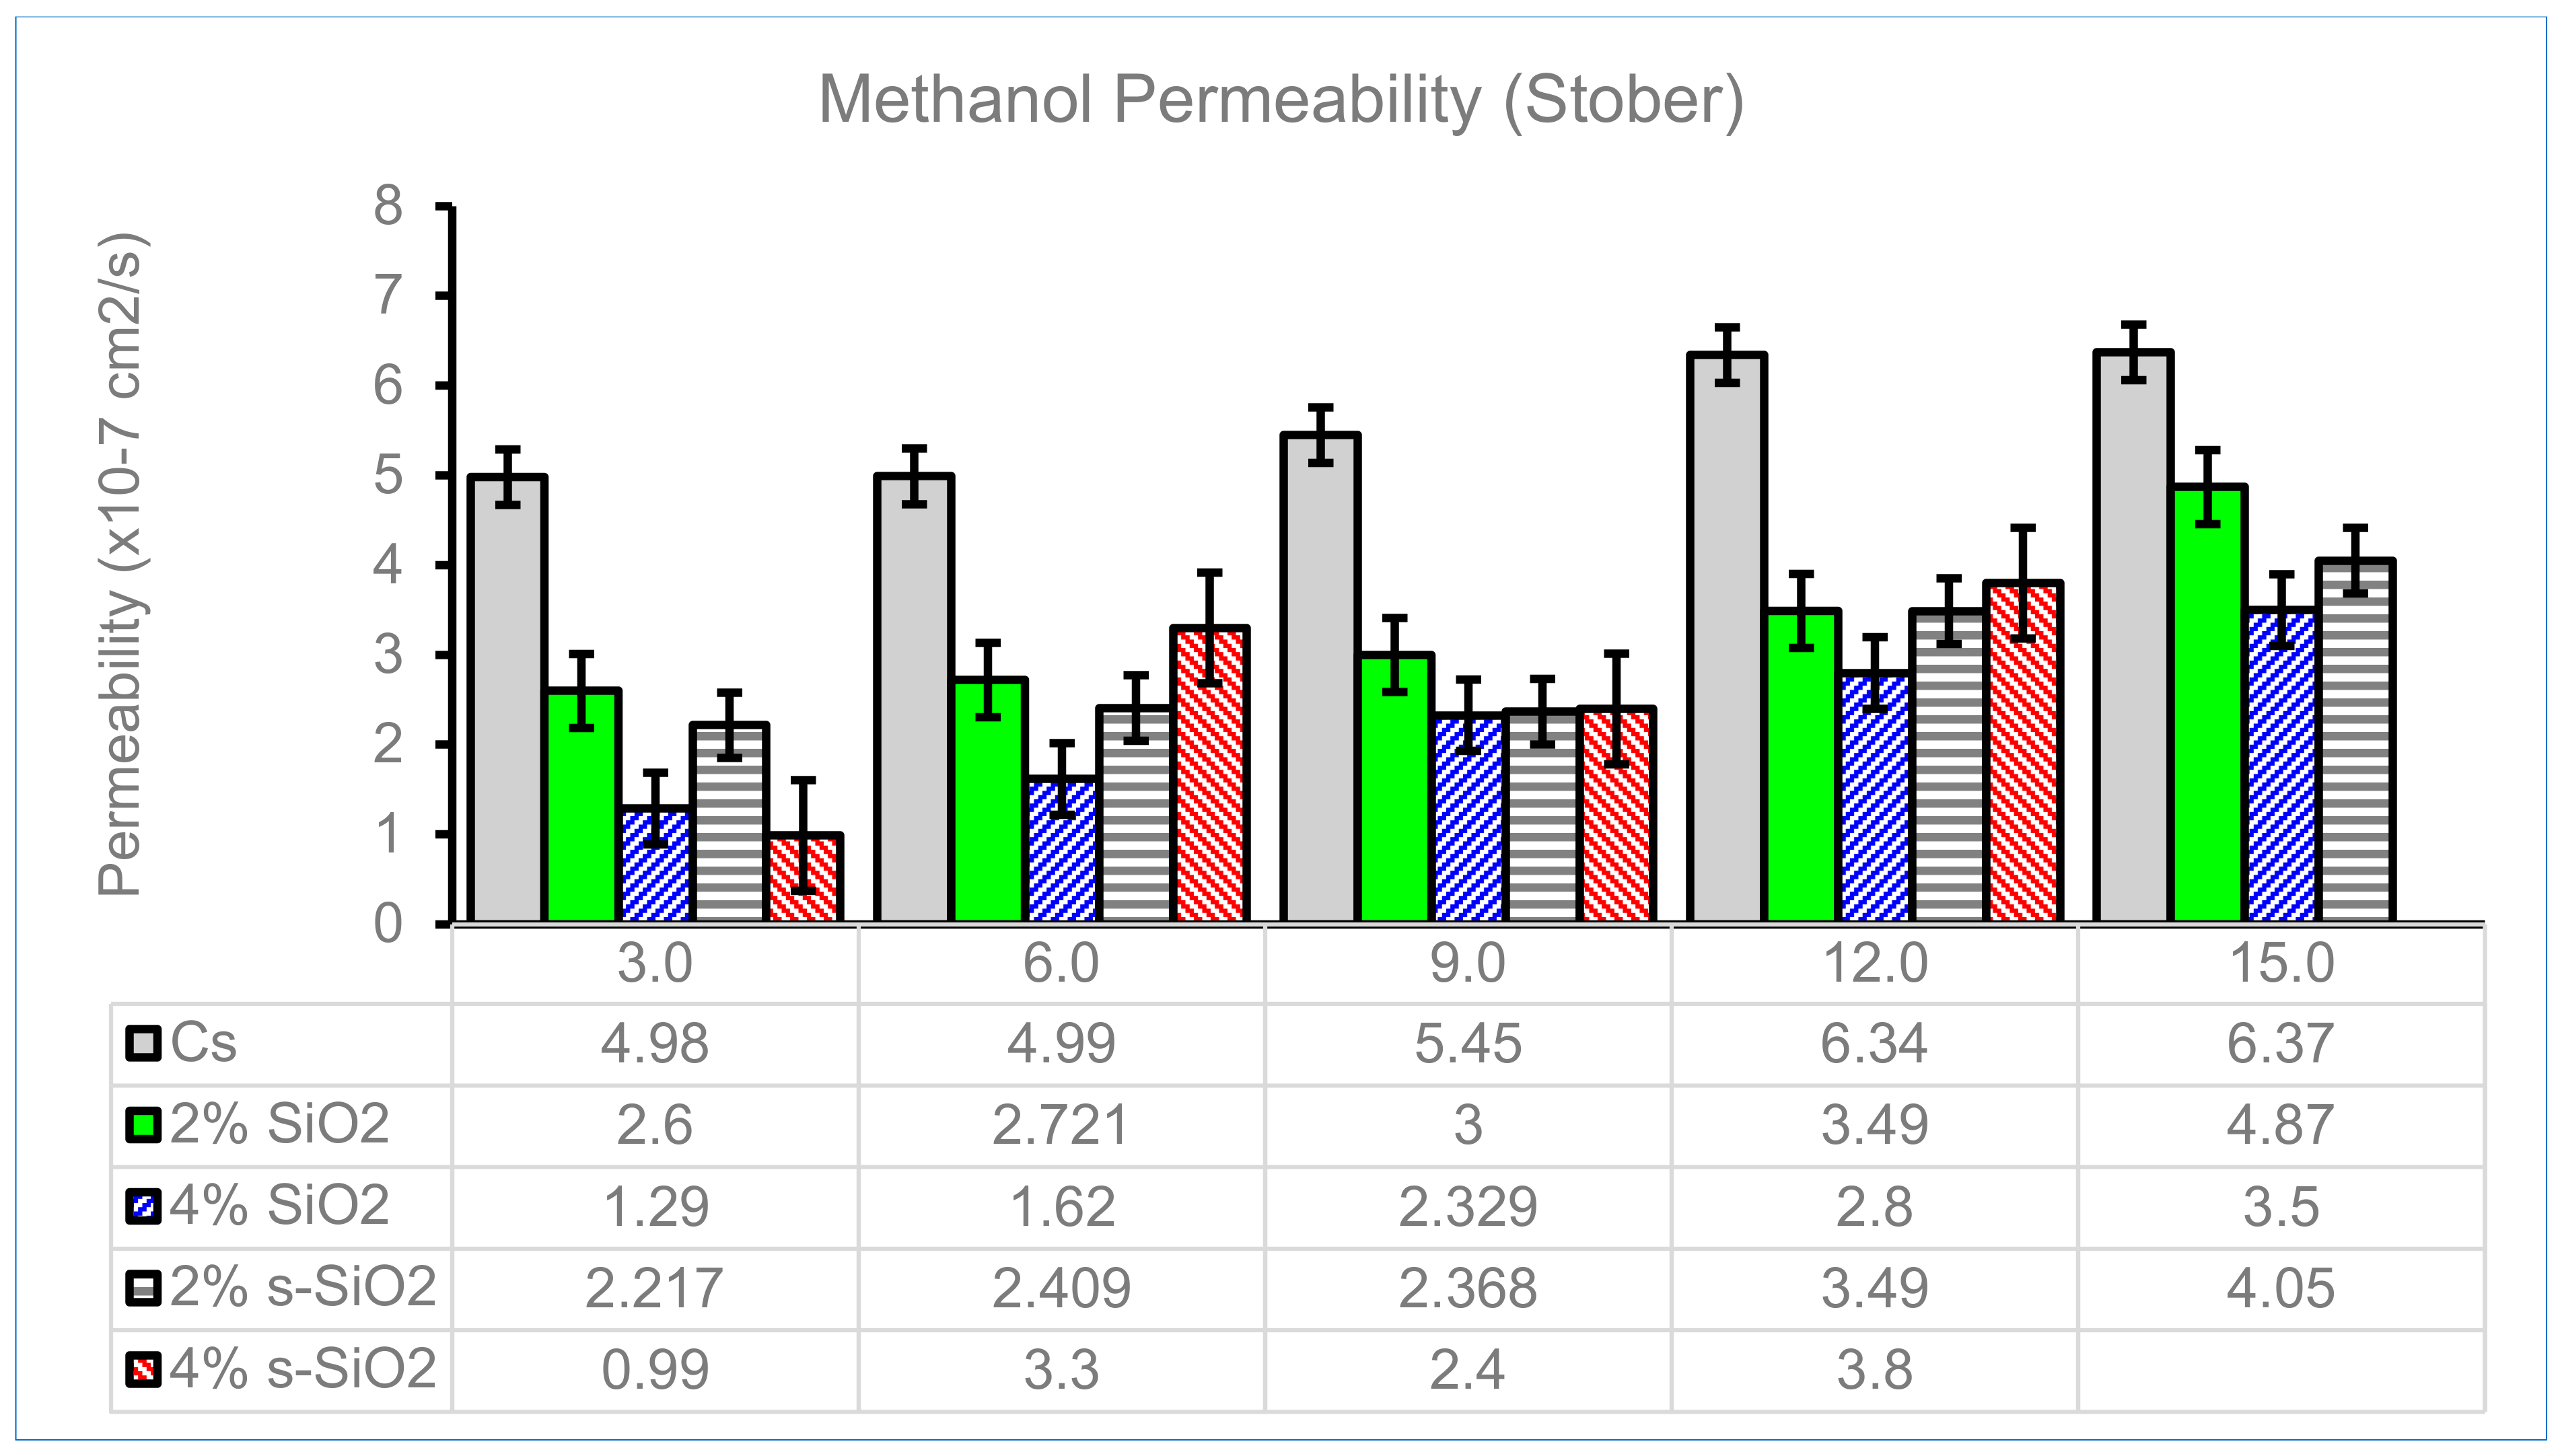
Figure 14.
Tensile strength of chitosan membranes.

Figure 15.
Oxidation stability of Cs, 2% SiO2, 2% s-SiO2, 4% SiO2, and 4% s-SiO2 at 80 °C.
Disclaimer/Publisher’s Note: The statements, opinions and data contained in all publications are solely those of the individual author(s) and contributor(s) and not of MDPI and/or the editor(s). MDPI and/or the editor(s) disclaim responsibility for any injury to people or property resulting from any ideas, methods, instructions or products referred to in the content. |
© 2023 by the authors. Licensee MDPI, Basel, Switzerland. This article is an open access article distributed under the terms and conditions of the Creative Commons Attribution (CC BY) license (https://creativecommons.org/licenses/by/4.0/).
Share and Cite
MDPI and ACS Style
Modau, L.; Sigwadi, R.; Mokrani, T.; Nemavhola, F. Chitosan Membranes for Direct Methanol Fuel Cell Applications. Membranes 2023, 13, 838. https://doi.org/10.3390/membranes13100838
AMA Style
Modau L, Sigwadi R, Mokrani T, Nemavhola F. Chitosan Membranes for Direct Methanol Fuel Cell Applications. Membranes. 2023; 13(10):838. https://doi.org/10.3390/membranes13100838
Chicago/Turabian StyleModau, Livhuwani, Rudzani Sigwadi, Touhami Mokrani, and Fulufhelo Nemavhola. 2023. "Chitosan Membranes for Direct Methanol Fuel Cell Applications" Membranes 13, no. 10: 838. https://doi.org/10.3390/membranes13100838
Note that from the first issue of 2016, this journal uses article numbers instead of page numbers. See further details here.