Article

Solution-Processed Silicon Doped Tin Oxide Thin Films and Thin-Film Transistors Based on Tetraethyl Orthosilicate

1
State Key Laboratory of Luminescent Materials and Devices, Institute of Polymer Optoelectronic Materials and Devices, South China University of Technology, Guangzhou 510640, China
2
Southwest Institute of Technology and Engineering, Chongqing 400039, China
3
Guangzhou Key Laboratory for Clean Energy and Materials, Huangpu Hydrogen Innovation Center, School of Chemistry and Chemical Engineering, Institute of Clean Energy and Materials, Guangzhou University, Guangzhou 510006, China
*
Authors to whom correspondence should be addressed.
Membranes 2022, 12(6), 590; https://doi.org/10.3390/membranes12060590
Submission received: 11 May 2022 / Revised: 30 May 2022 / Accepted: 30 May 2022 / Published: 1 June 2022
(This article belongs to the Special Issue Microfluidics and MEMS Technology for Membranes II)

Abstract

:
Recently, tin oxide (SnO2) has been the preferred thin film material for semiconductor devices such as thin-film transistors (TFTs) due to its low cost, non-toxicity, and superior electrical performance. However, the high oxygen vacancy (VO) concentration leads to poor performance of SnO2 thin films and devices. In this paper, with tetraethyl orthosilicate (TEOS) as the Si source, which can decompose to release heat and supply energy when annealing, Si doped SnO2 (STO) films and inverted staggered STO TFTs were successfully fabricated by a solution method. An XPS analysis showed that Si doping can effectively inhibit the formation of VO, thus reducing the carrier concentration and improving the quality of SnO2 films. In addition, the heat released from TEOS can modestly lower the preparation temperature of STO films. By optimizing the annealing temperature and Si doping content, 350 °C annealed STO TFTs with 5 at.% Si exhibited the best device performance: Ioff was as low as 10−10 A, Ion/Ioff reached a magnitude of 104, and Von was 1.51 V. Utilizing TEOS as an Si source has a certain reference significance for solution-processed metal oxide thin films in the future.

1. Introduction

In recent years, due to their high mobility, low temperature preparation, and compatibility with flexible processes, metal oxide semiconductor (MOS) materials represented by indium gallium zinc oxide (IGZO) have been extensively applied in flat panel displays such as AMLCD and AMOLED, driven by TFTs [1,2,3,4,5]. However, the scarce reserve of indium in the earth’s crust (0.25 ppm) leads to its high market price (~$750/kg) [6]. Furthermore, it is toxic, which makes it incompatible with the trend of the consumer electronics market toward low cost environmental benignity. The development of an alternative indium-free oxide semiconductor material system is imperative. Notably, the electronic structure of Sn4+ (4d105s2) is similar to that of In3+ (4d105s0) with the spherical symmetry s orbit, leading to the high mobility of SnO2 and In2O3 even in an amorphous state [7,8]. In addition, Sn is abundant (2.2 ppm) and relatively inexpensive (~$15/kg) [6]. SnO2 is also non-toxic, environmentally friendly, and chemically stable, making it the most promising candidate to replace In-based MOS materials in semiconductor devices such as TFTs.
SnO2-based TFTs have generally been fabricated by magnetron sputtering and other vacuum technologies [9,10,11,12], but those involve an expensive, complex process dependent on a vacuum environment. In contrast, the solution method has broad development prospects in modern electronic device processing [13,14,15], with the advantages of low cost and a simple process ofmanipulation by doping. As a result, solution-processed SnO2-TFTs have increasingly become a preferred method.
Oxygen vacancy (VO) plays a significant role in carrier concentration, and then affects the properties of the material [16,17]. In 2010, Tsay et al. [18] prepared crystalline SnO2 thin films at 500 °C by spin coating, with the O/Sn ratio of only 1.69 and a carrier concentration of 7.5 × 1018 cm−3 due to the existence of VO. An excess of carriers caused by a high concentration of VO in SnO2 leads to TFT performance deterioration, including a large off current (Ioff) and difficulty in turning off [19,20]. Many studies have been conducted to suppress the VO concentration by doping. In 2020, Zhang et al. [21] prepared Ga doped SnO2–TFT (GTO–TFT) at 450 °C by spin coating, and found that with the Ga content rising from 20% to 60%, the VO decreased from 30.24% to 17.18%, while the Ioff of TFT correspondingly decreased from 10−3 A to 10−11 A. In addition, other commonly used dopants such as Sb, Cr, Zr, Y [22,23,24,25,26] can also reduce the VO concentration, but low reserves and a certain toxicity limit their practical application.
However, Si is environmentally friendly, non-toxic, and resource-rich. Si4+ has the same valence state as Sn4+, and will not introduce new charges into SnO2. In addition, the binding energy of Si–O (799.6 kJ/mol) is higher than that of Sn–O (531.8 kJ/mol), and the Lewis acid strength of Si (8.096) is also significantly higher than that of Sn (1.617), which makes Si a superior oxygen binder to suppress the formation of VO [27,28,29]. Liu et al. [30] fabricated silicon doped SnO2–TFTs (STO–TFTs) by sputtering, controlling the VO concentration with Si, and the best device performance was obtained with 1 wt.% Si: the saturation mobility (μsat) was 6.38 cm2/(V·s), the on/off current ratio (Ion/Ioff) was 1.44 × 10⁷, and the subthreshold swing (SS) was 0.77 V/Dec. Therefore, incorporating Si has the potential to lower the carrier concentration of SnO2 films and improve the device’s performance. However, there are few studies of Si doping into SnO2 by the solution method, and most of them require a high processing temperature (>450 °C) [26,31].
Considering the above problems, this paper utilized tetraethyl orthosilicate (TEOS) and tin chloride dihydrate (SnCl2·2H2O) to prepare STO thin films, and the effects of Si doping content on the chemical composition, microstructure, and electrical properties of SnO2 were investigated. It was found that TEOS can not only act as an Si dopant to diminish the VO and carrier concentrations, but can also modestly reduce the preparation temperature of SnO2 thin films due to its decomposition and heat release when annealing. In a previous study, it was demonstrated that the AlOx: Nd film is a suitable dielectric in oxide TFTs due to its high dielectric constant and low leakage current density [32]. Based on this, bottom-gate and top-contact STO TFTs were successfully fabricated.

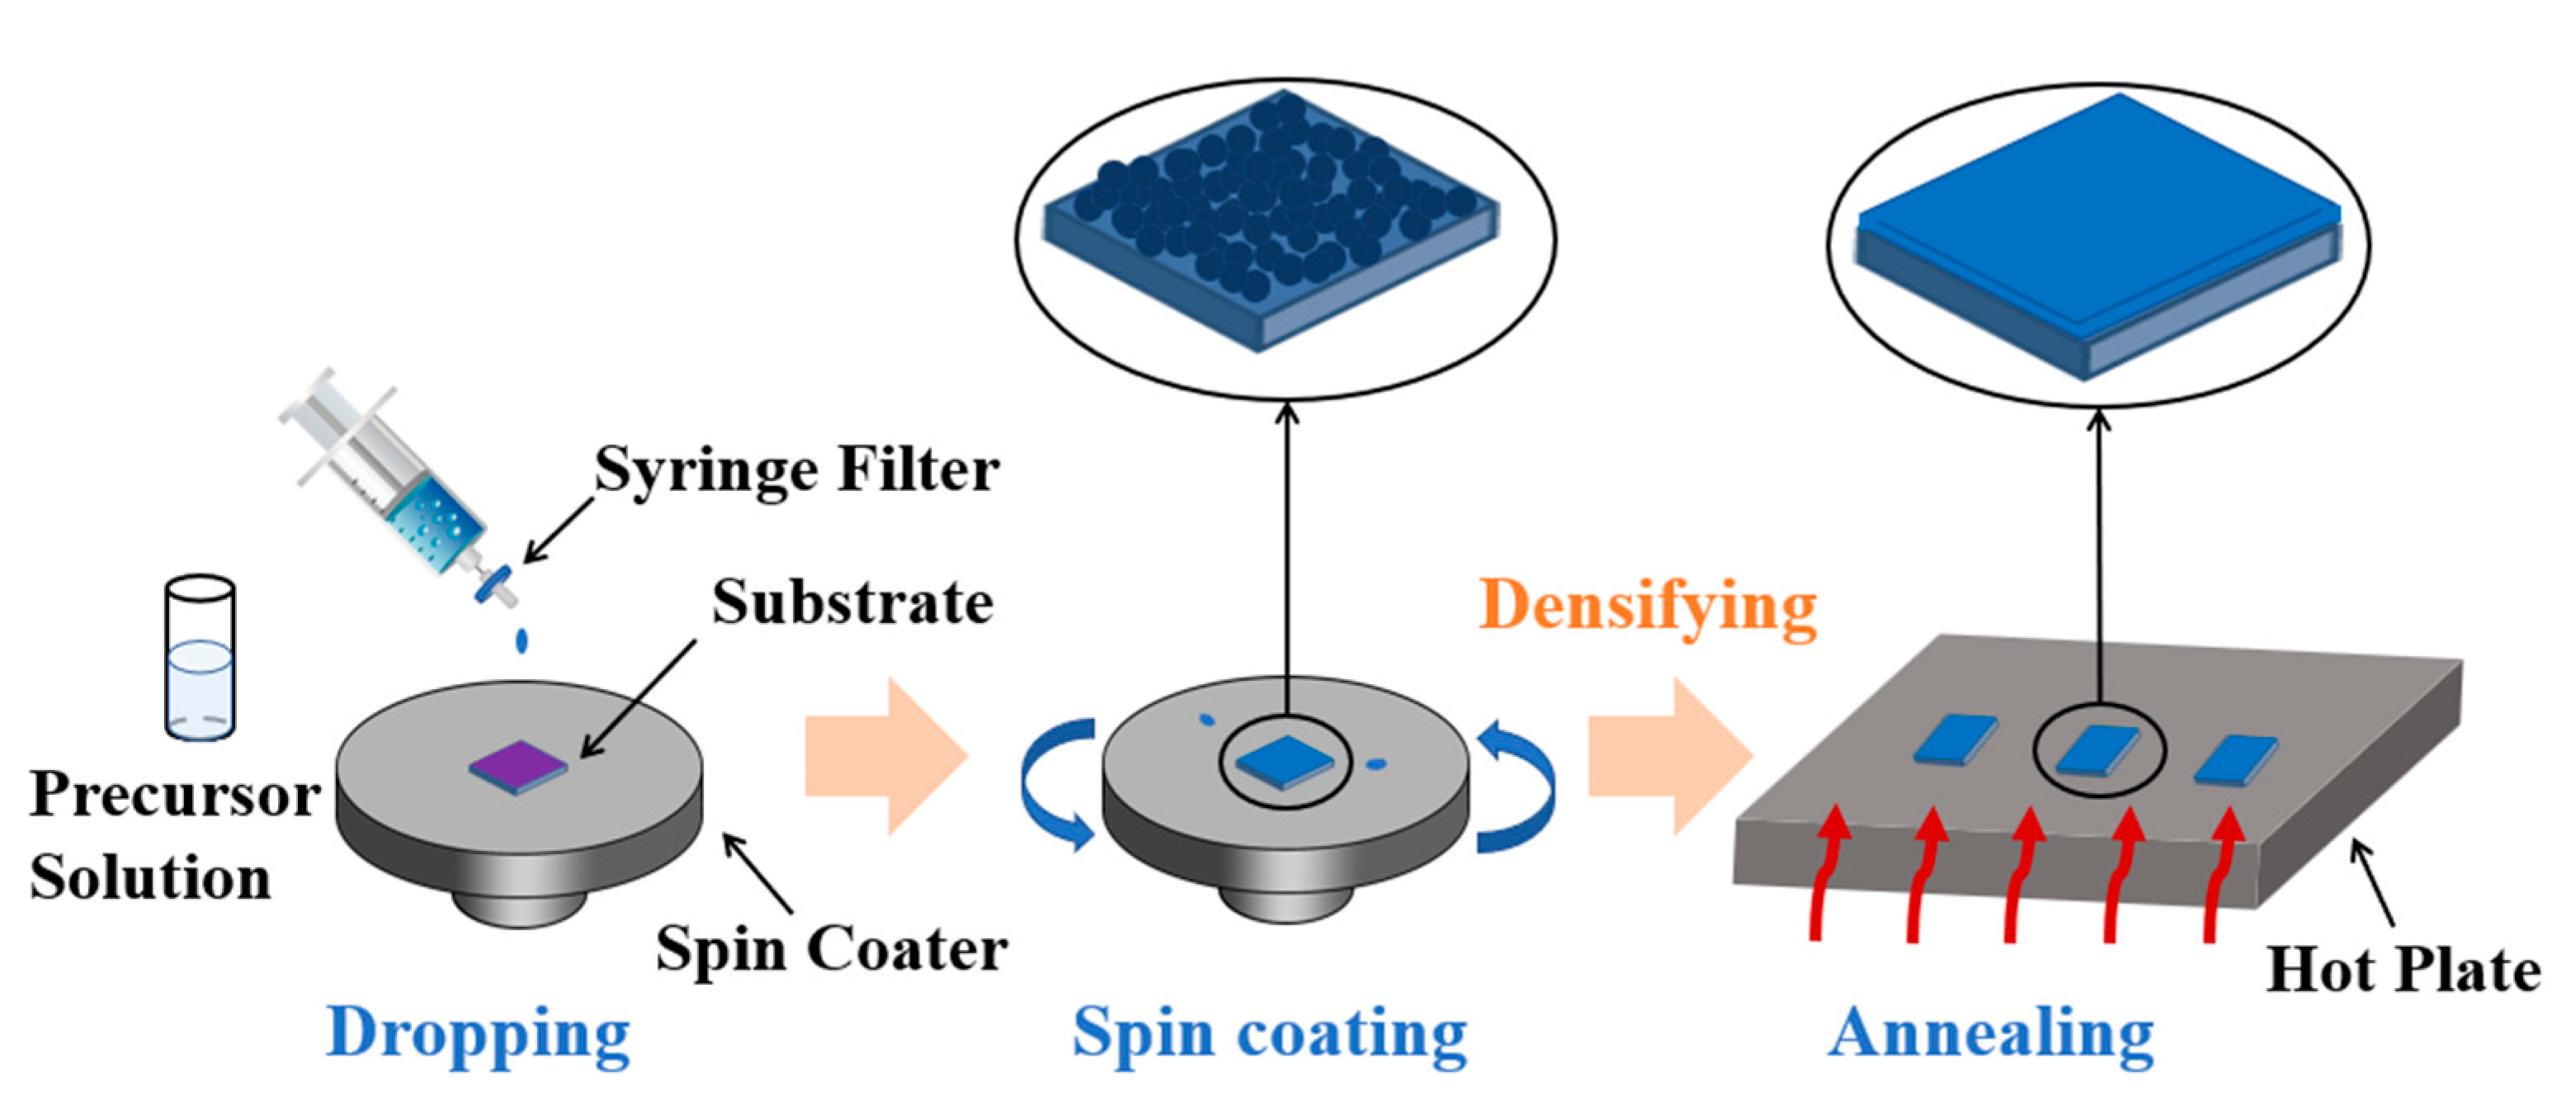
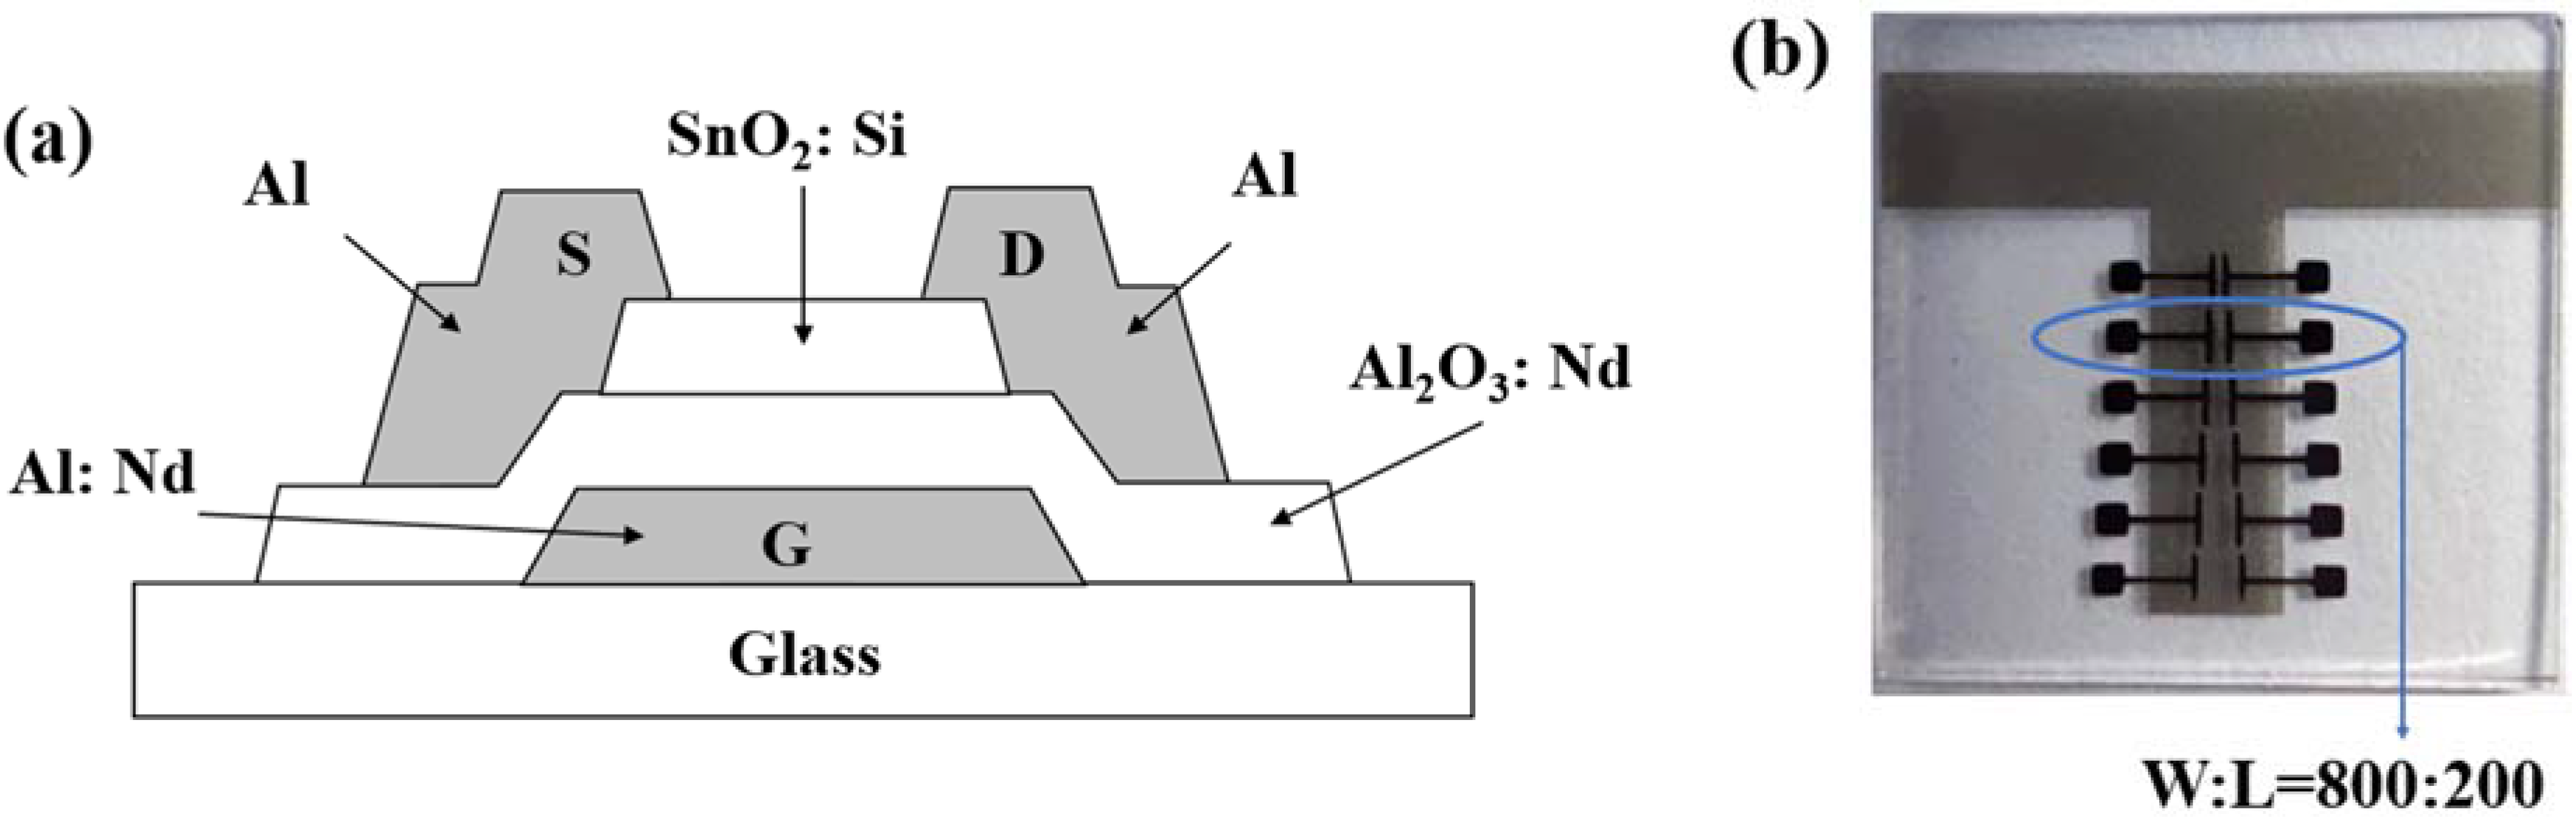
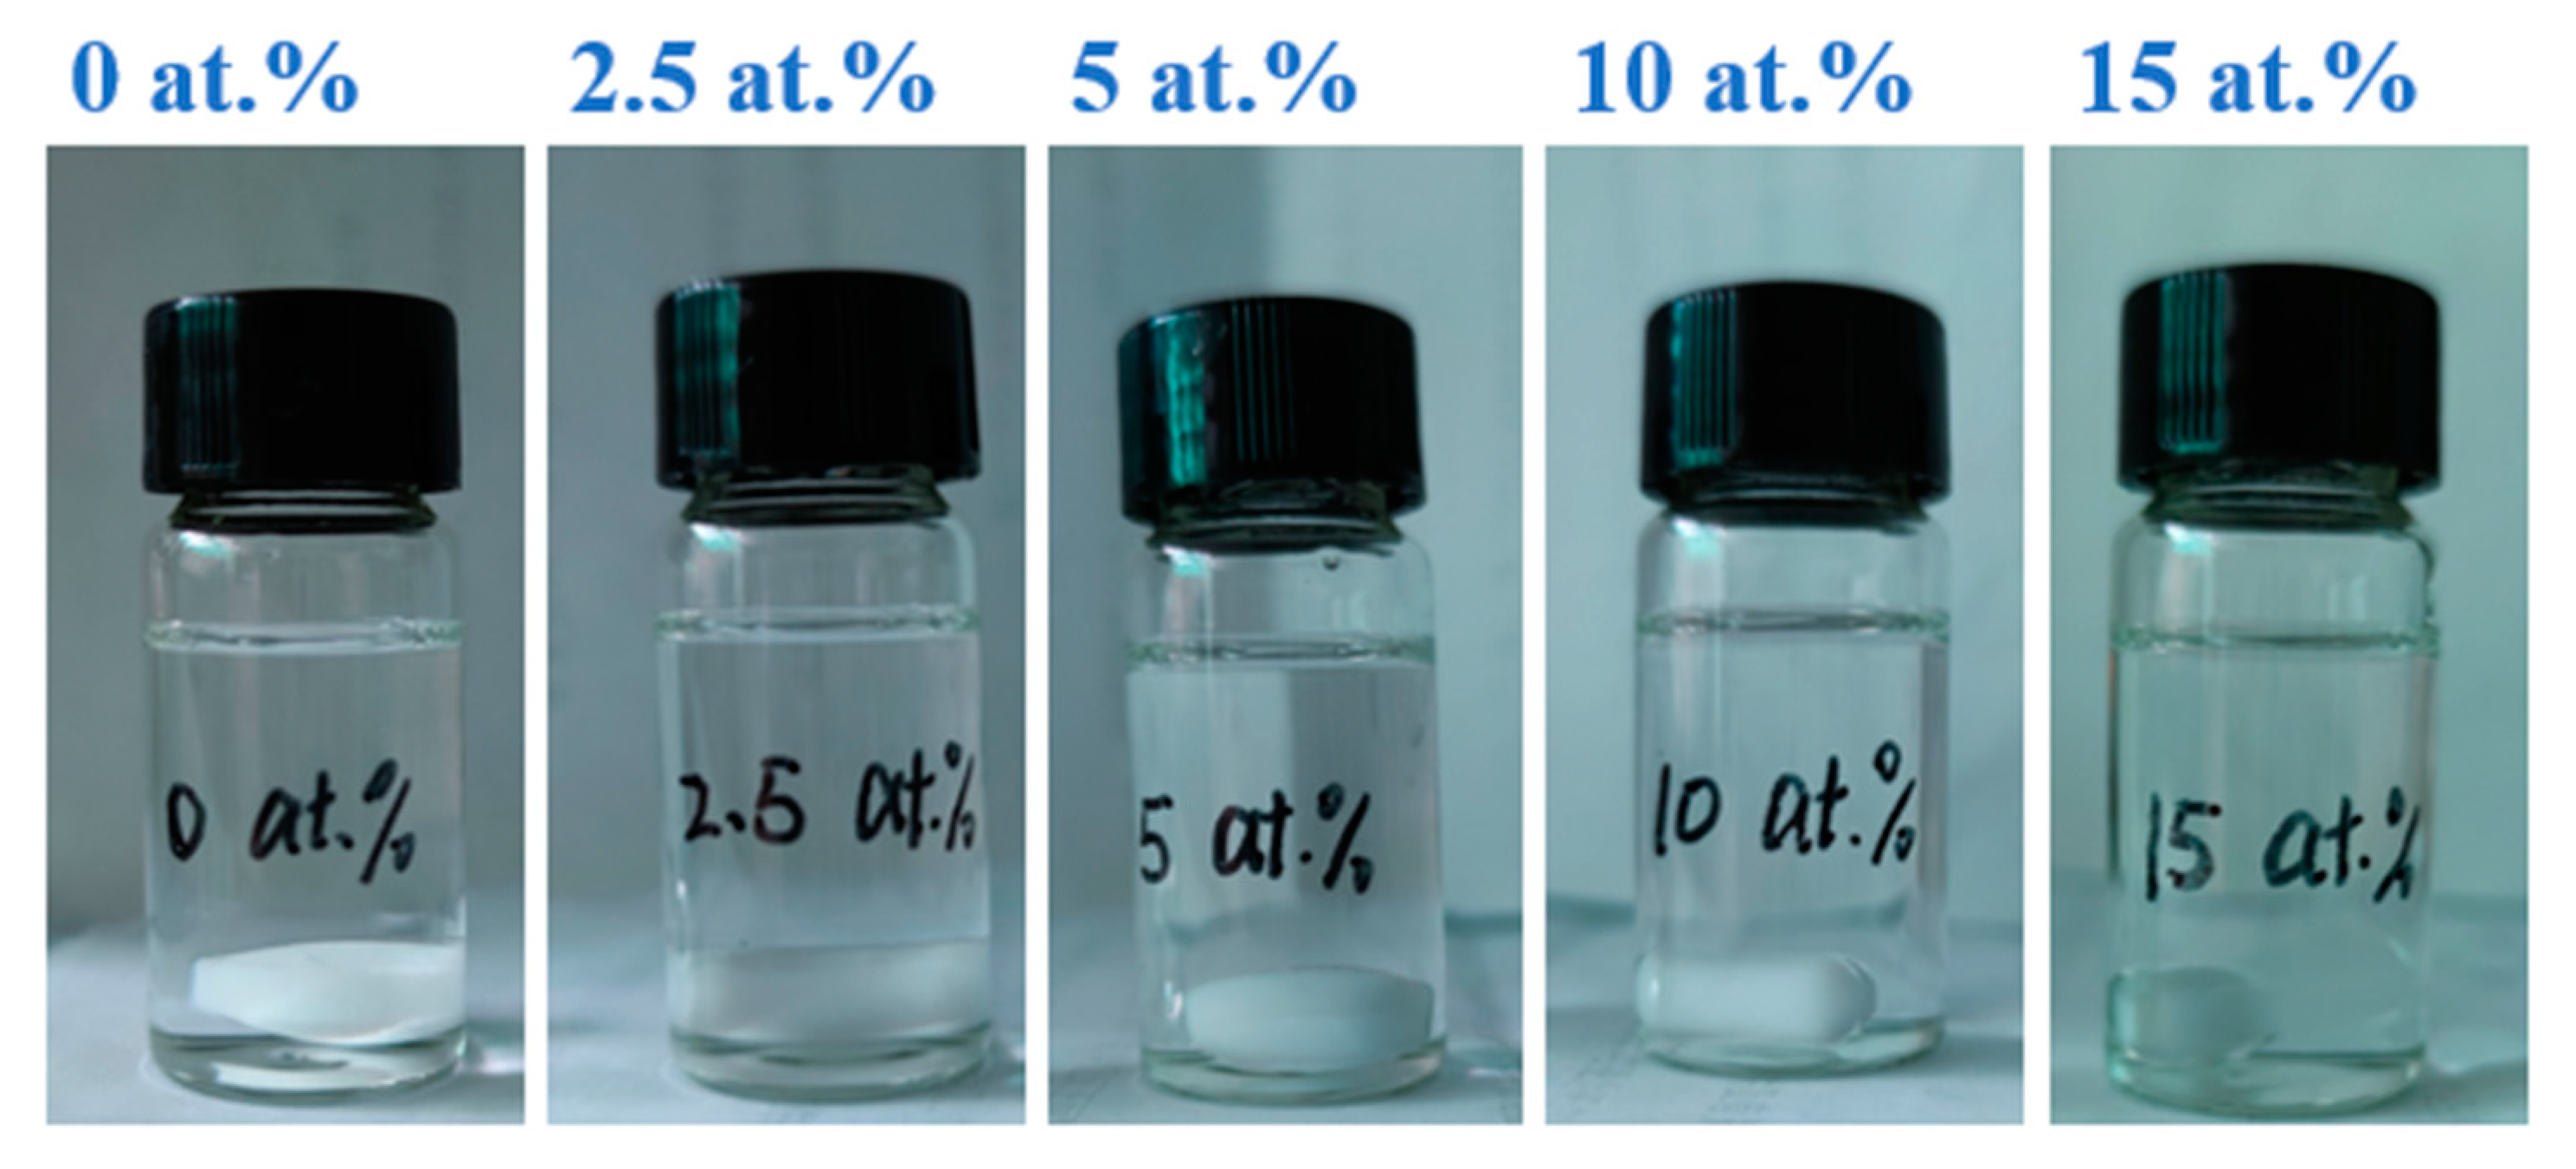
2. Materials and Methods
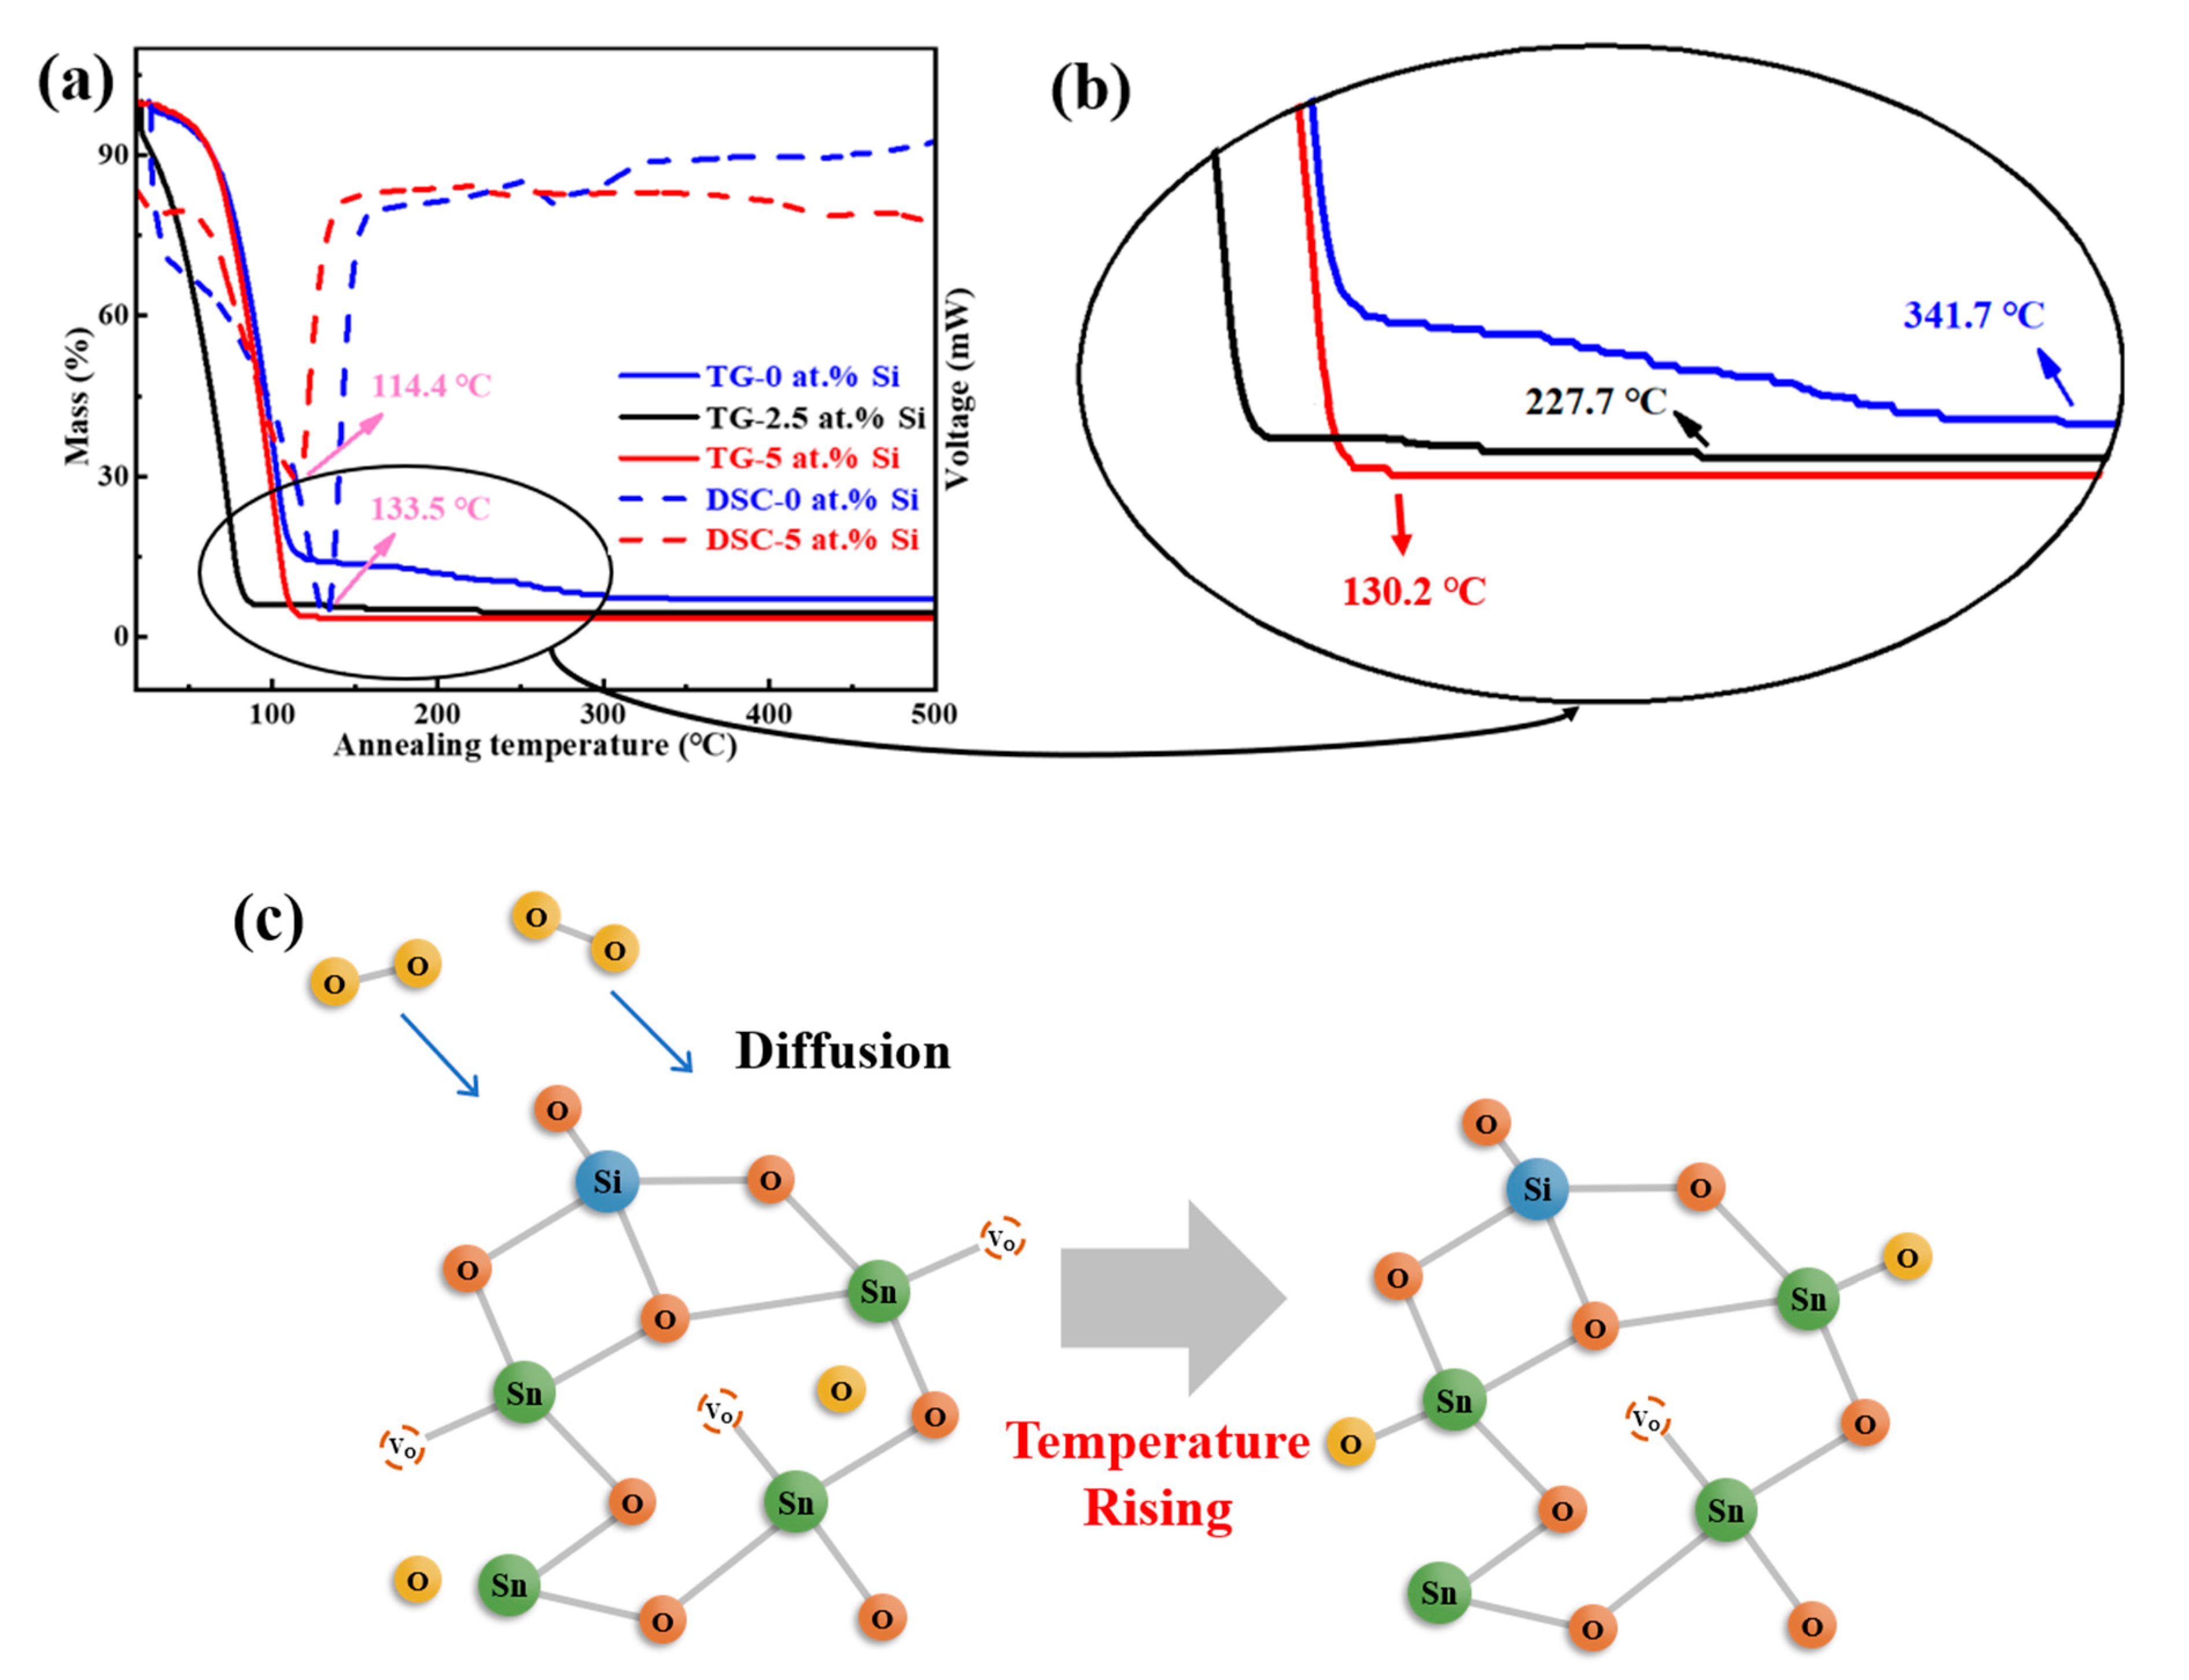
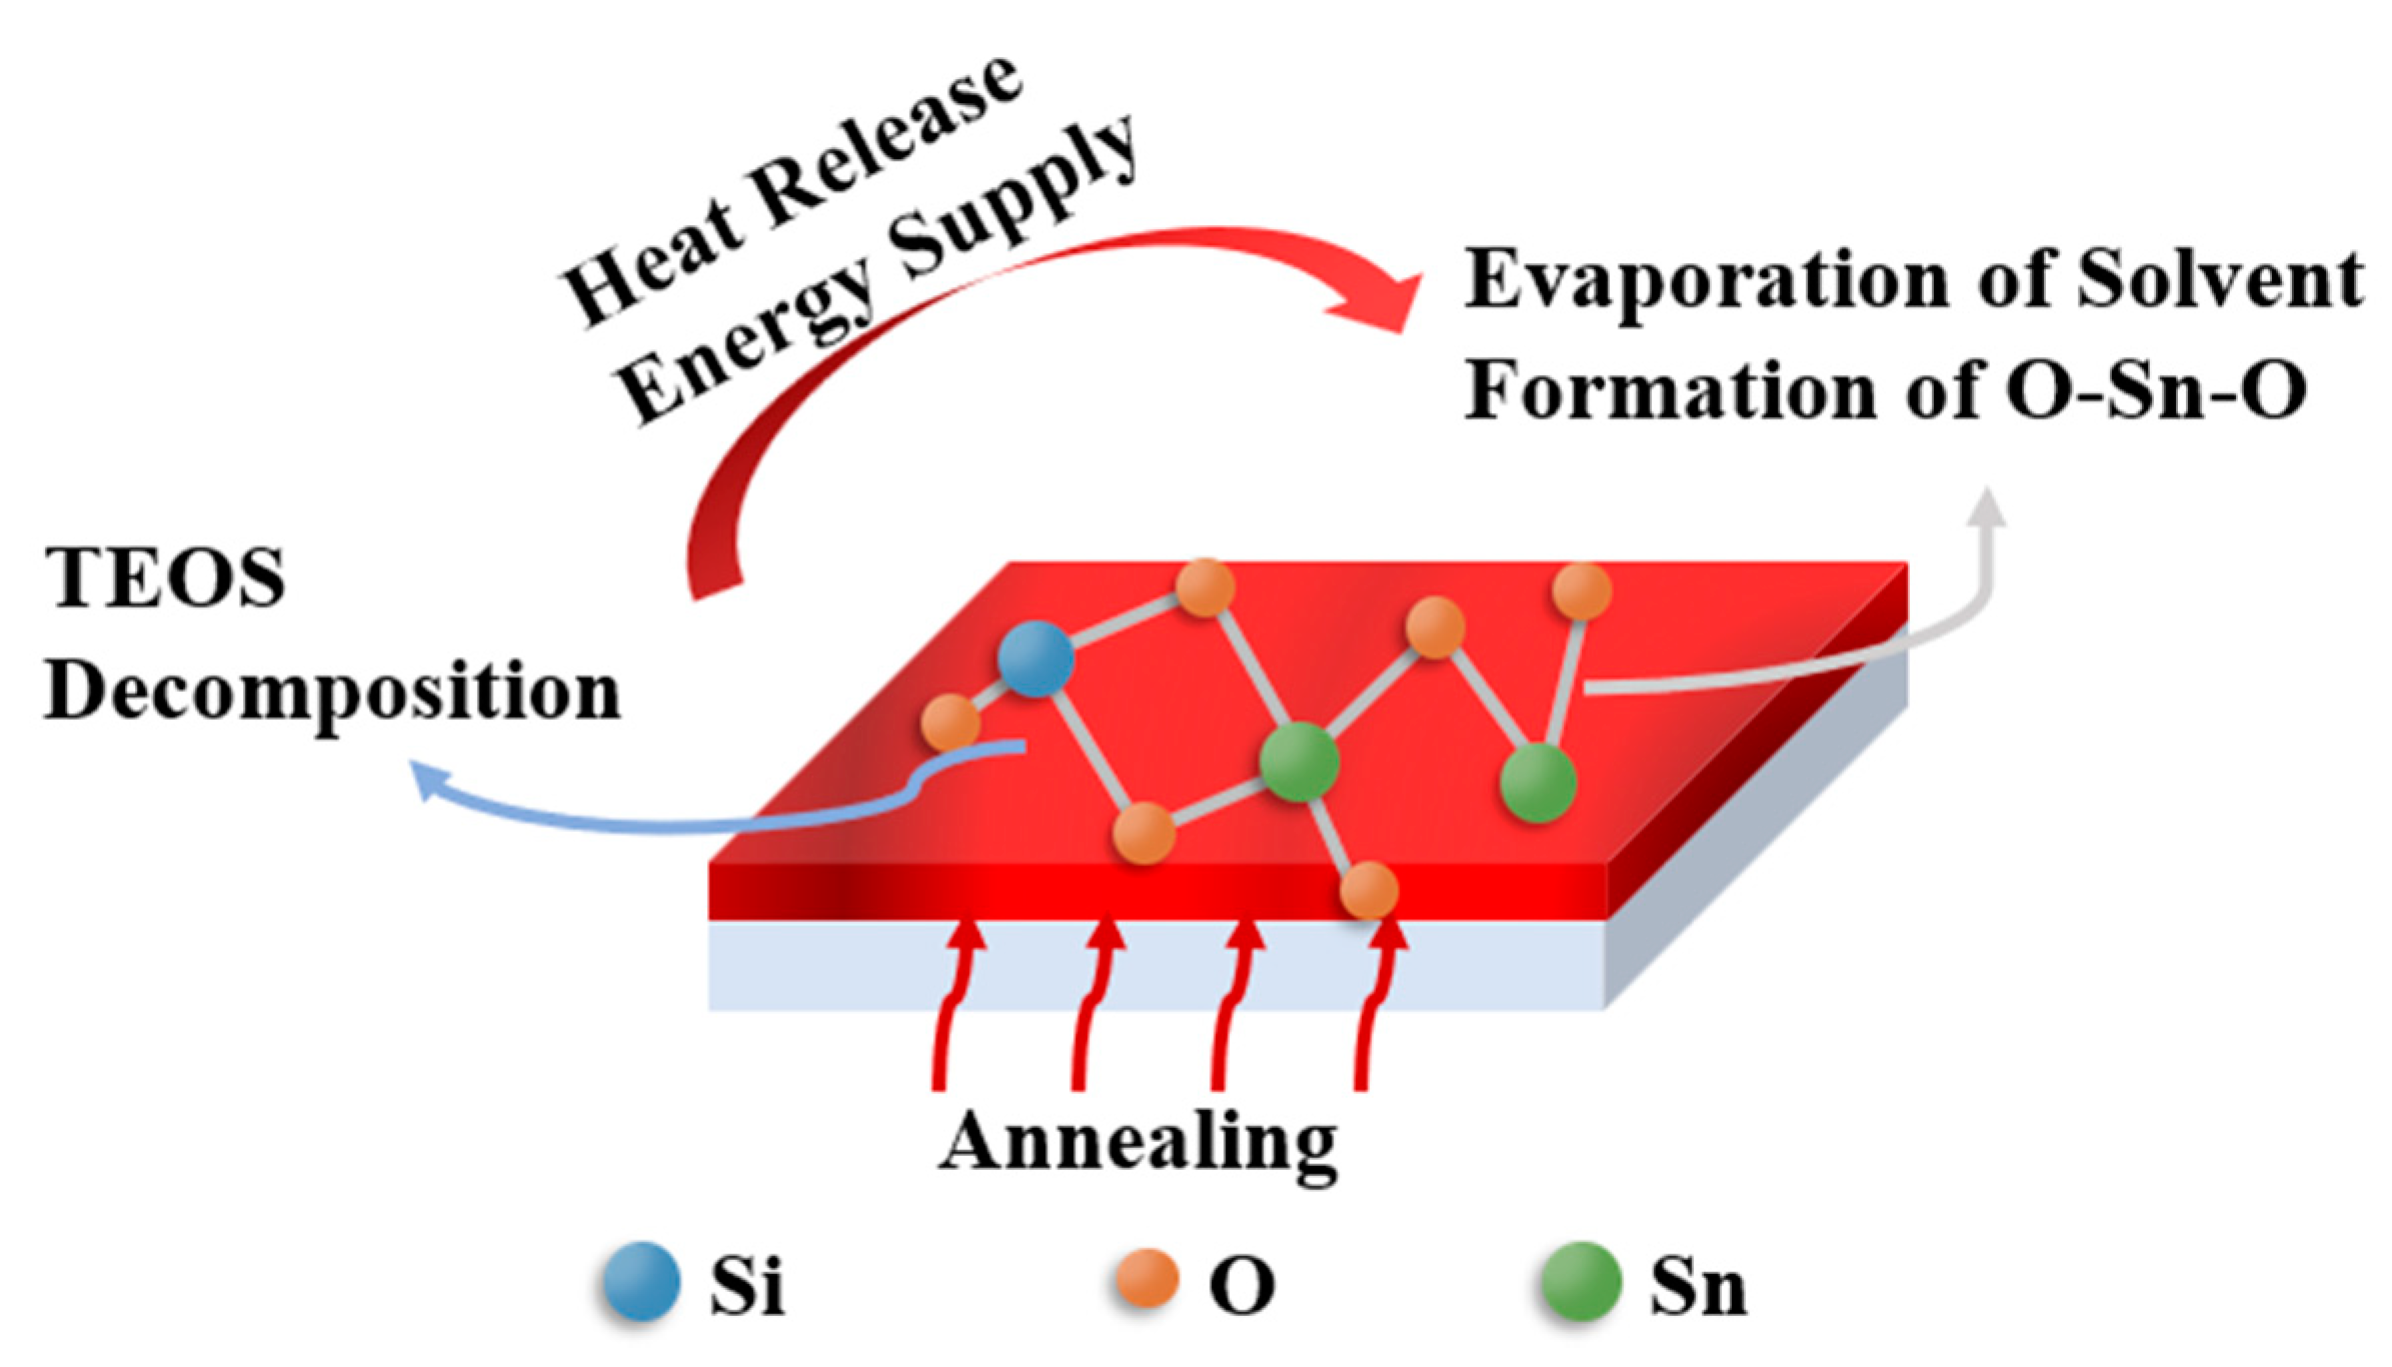
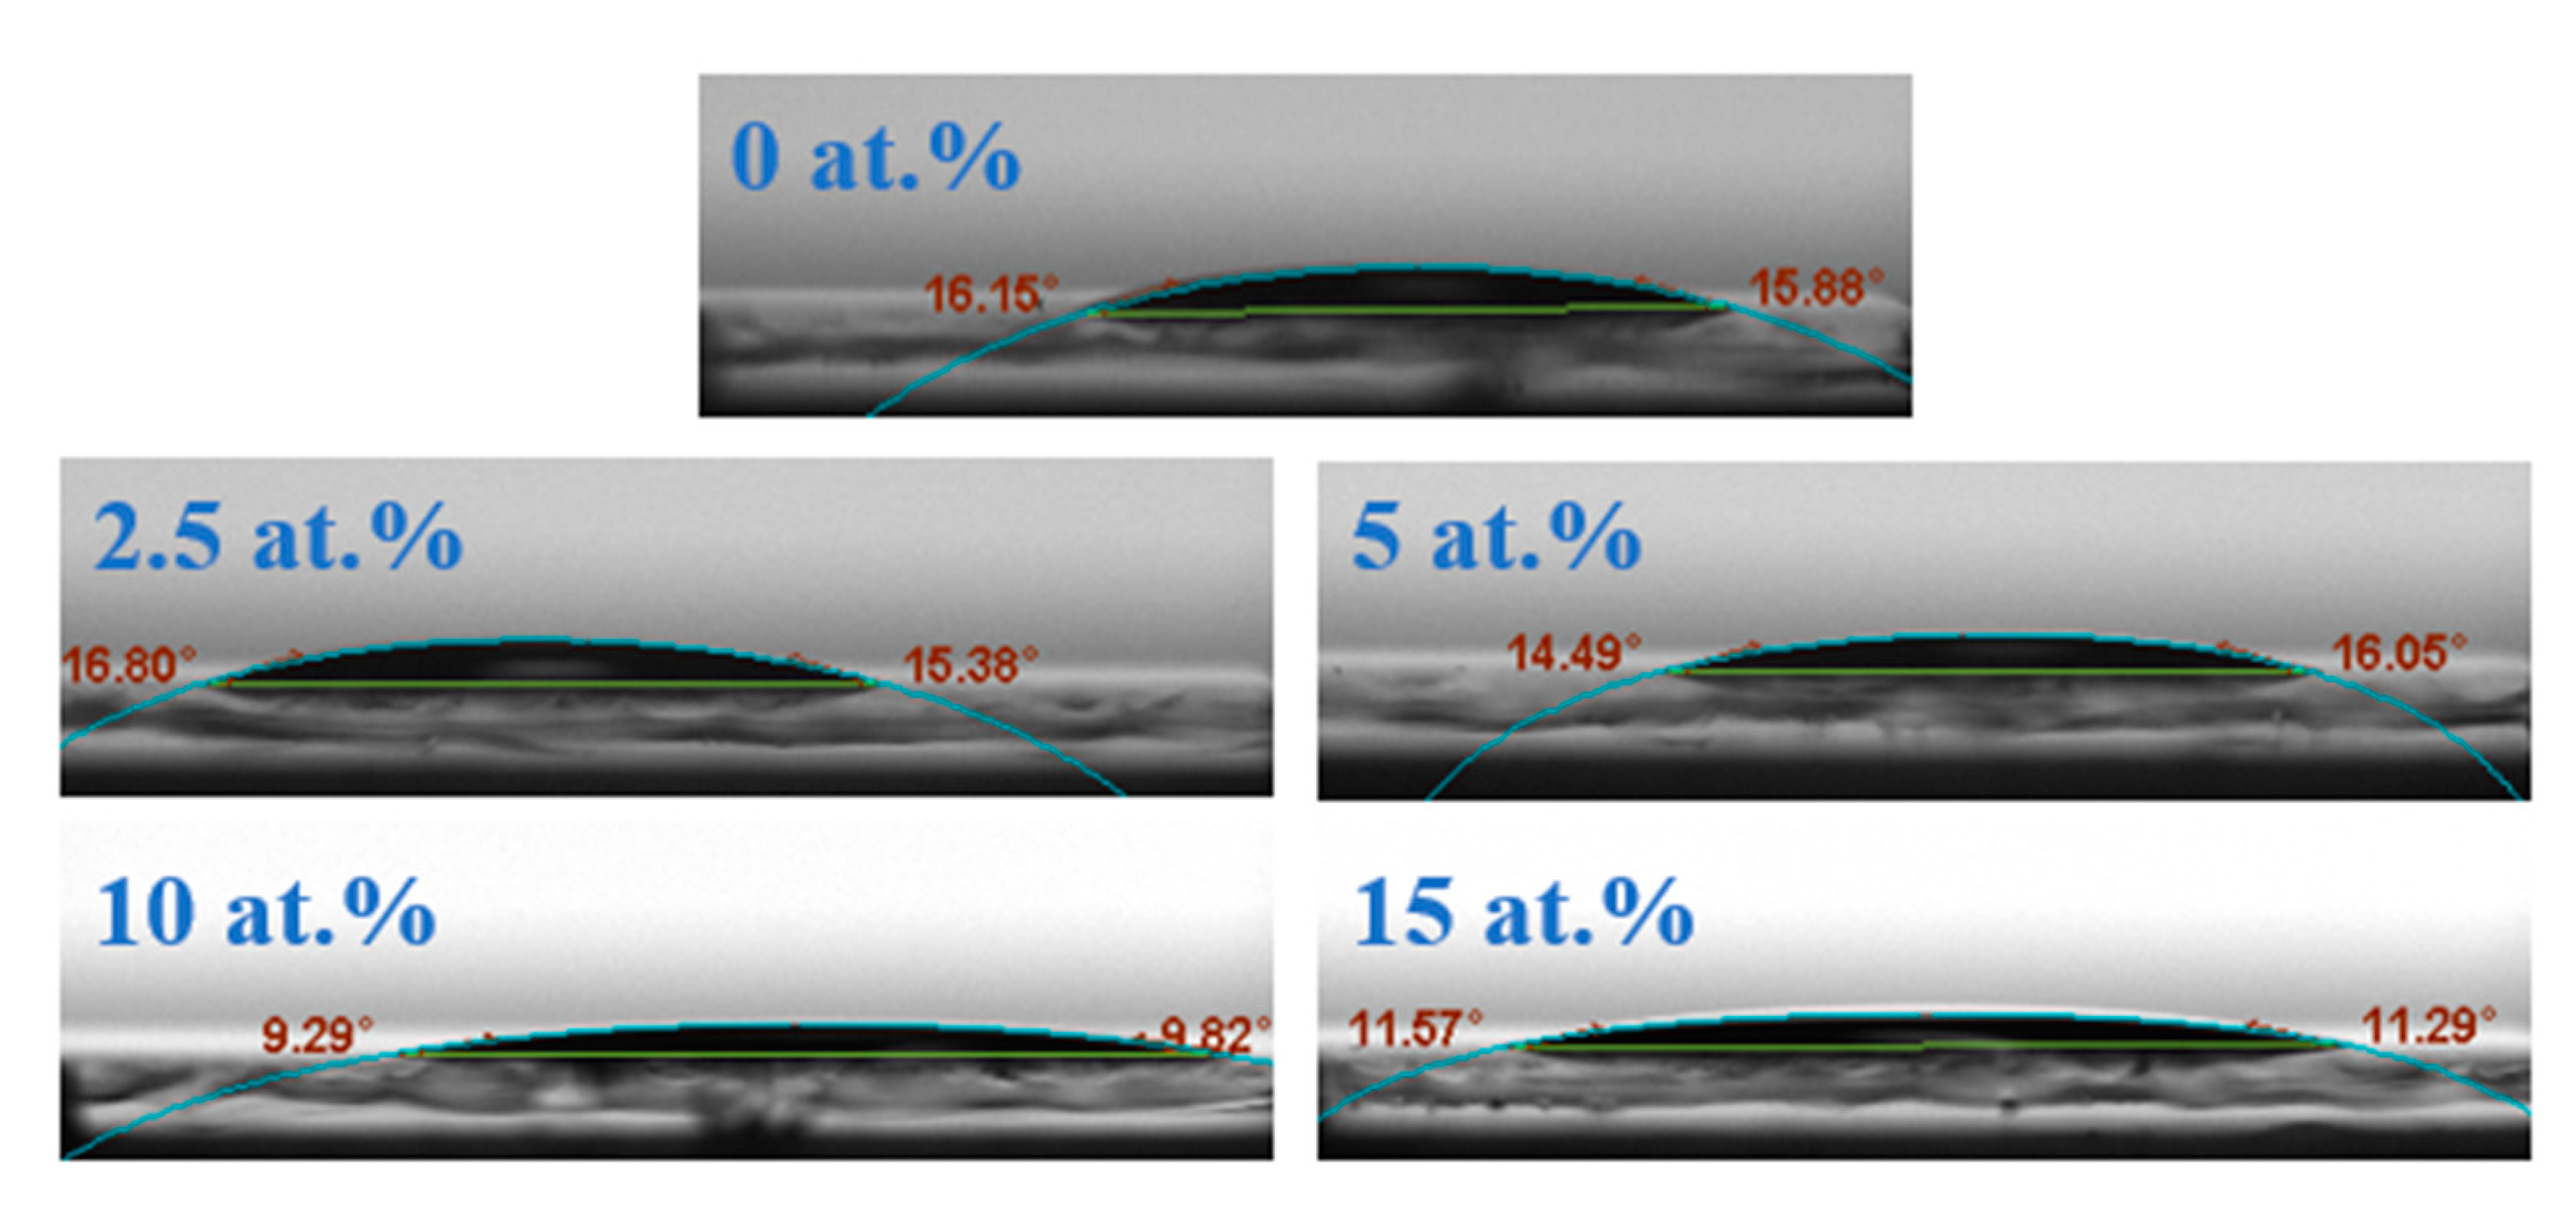
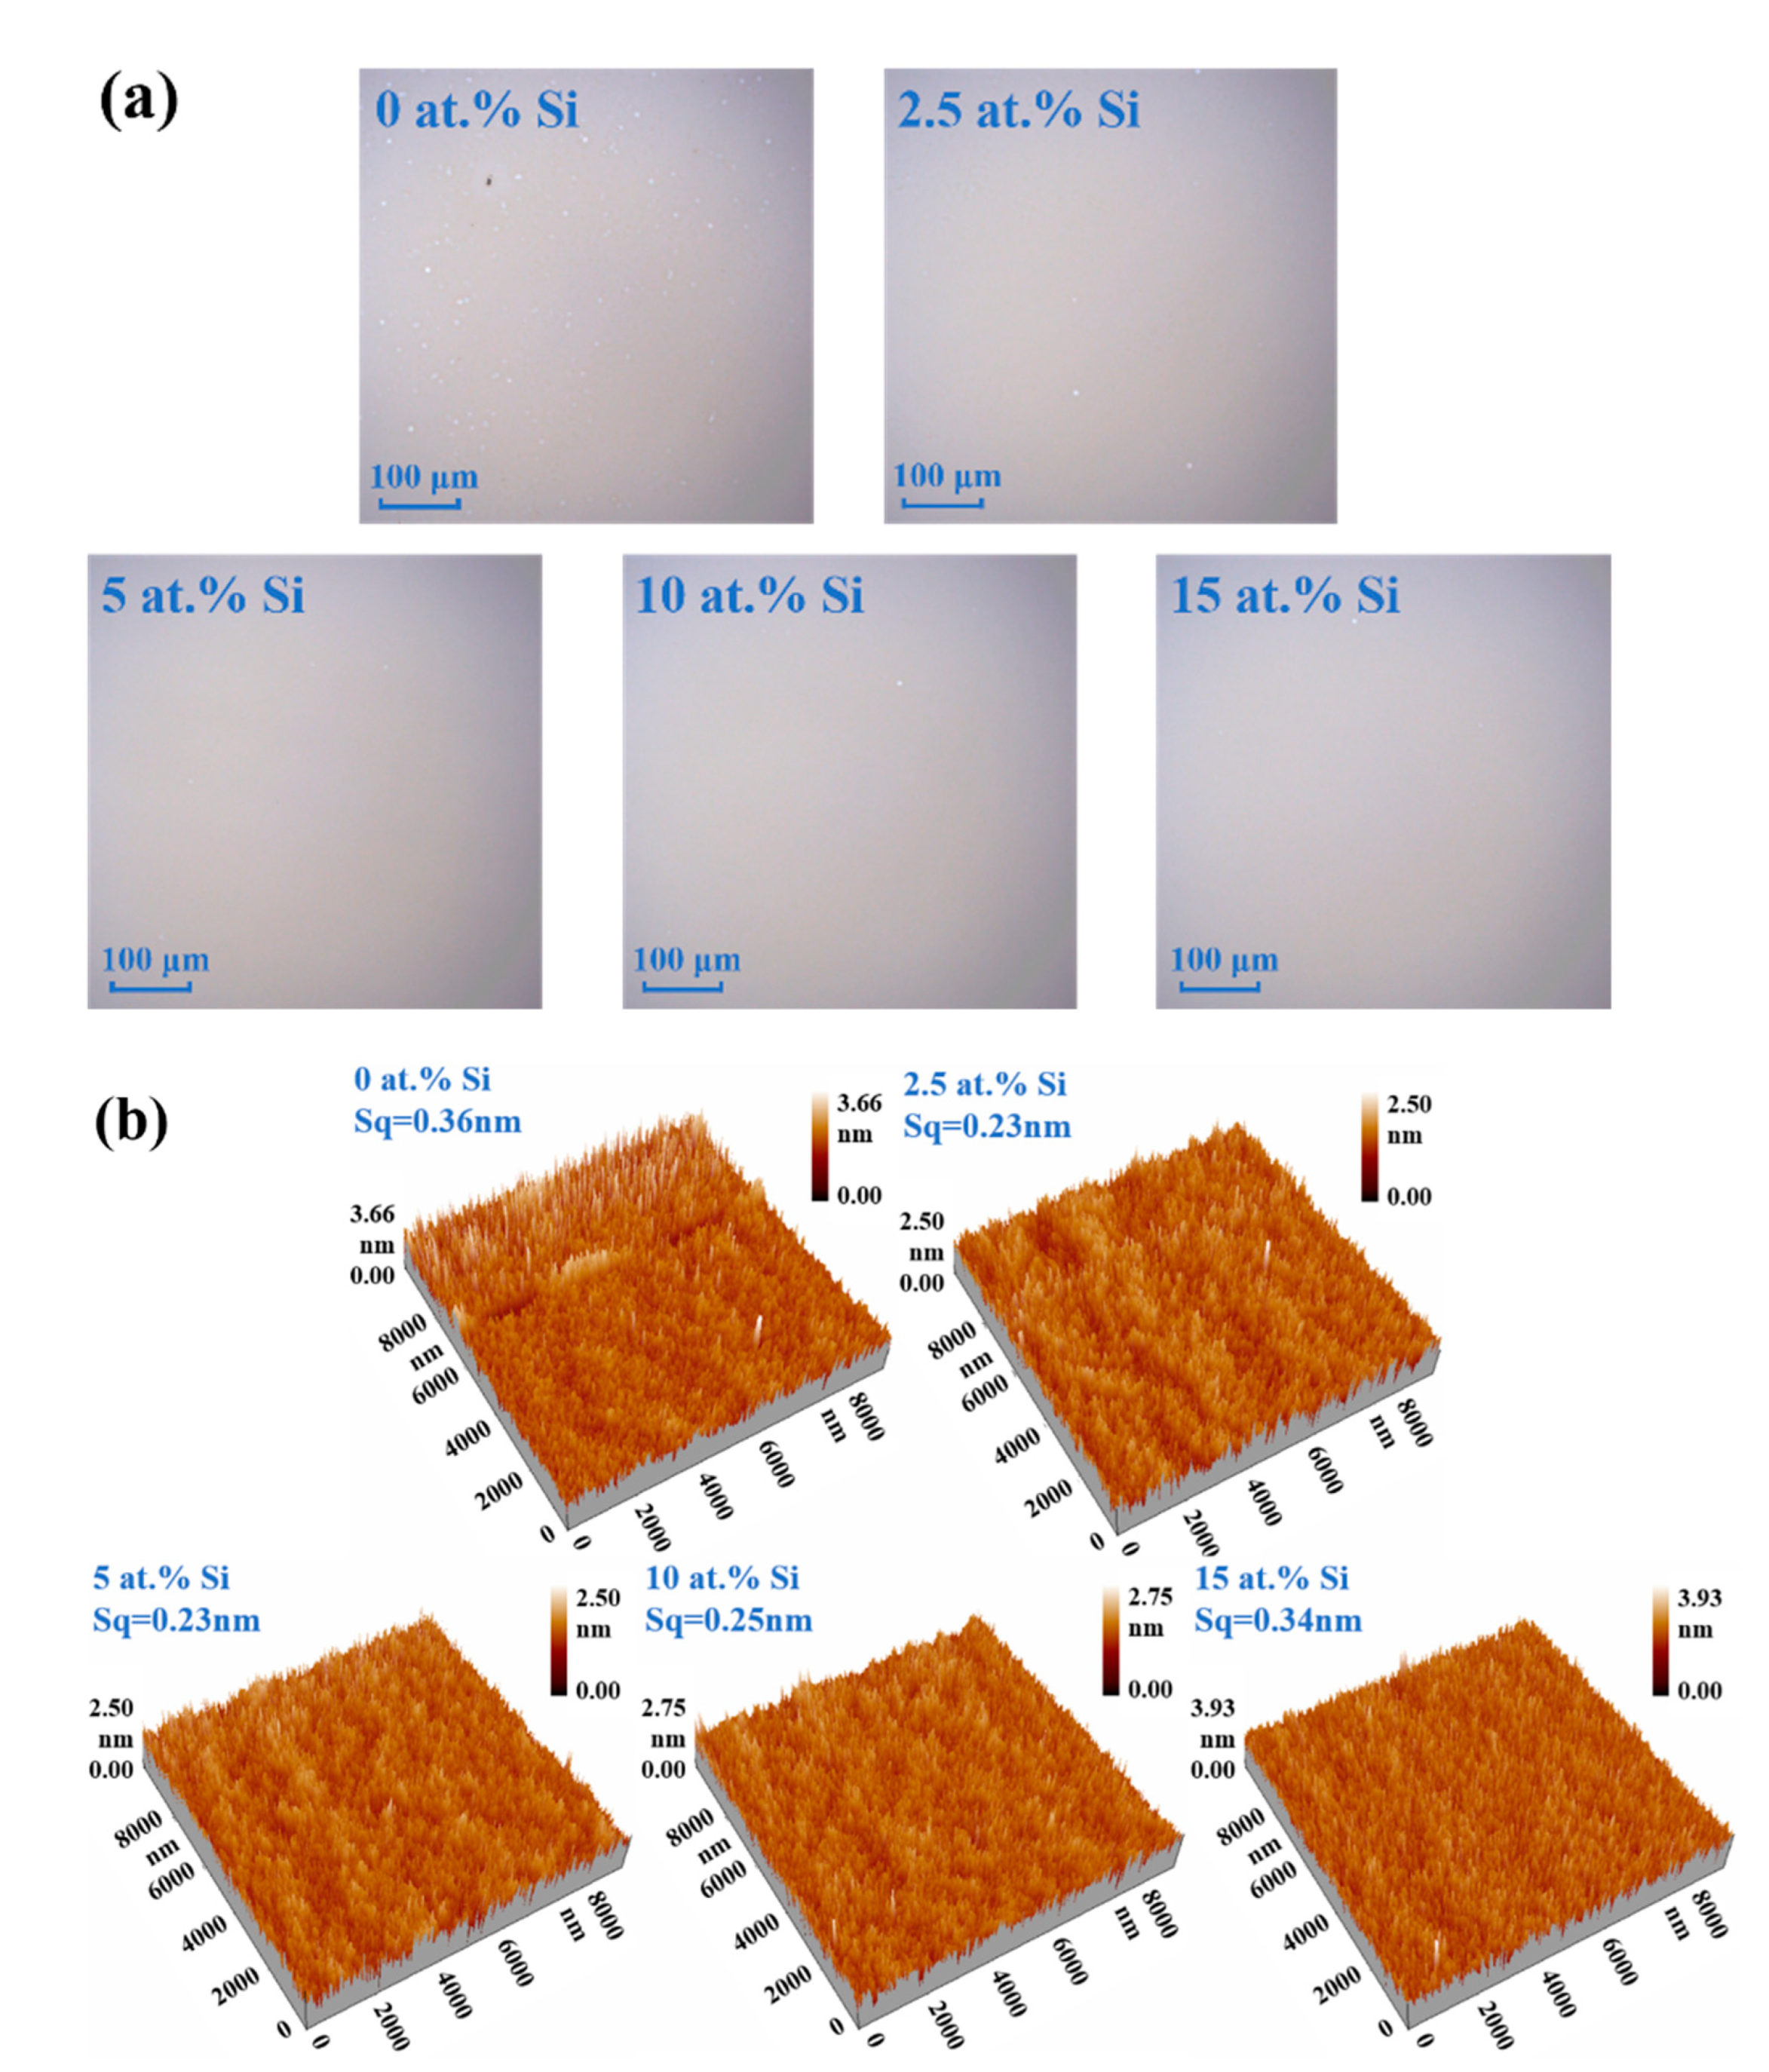
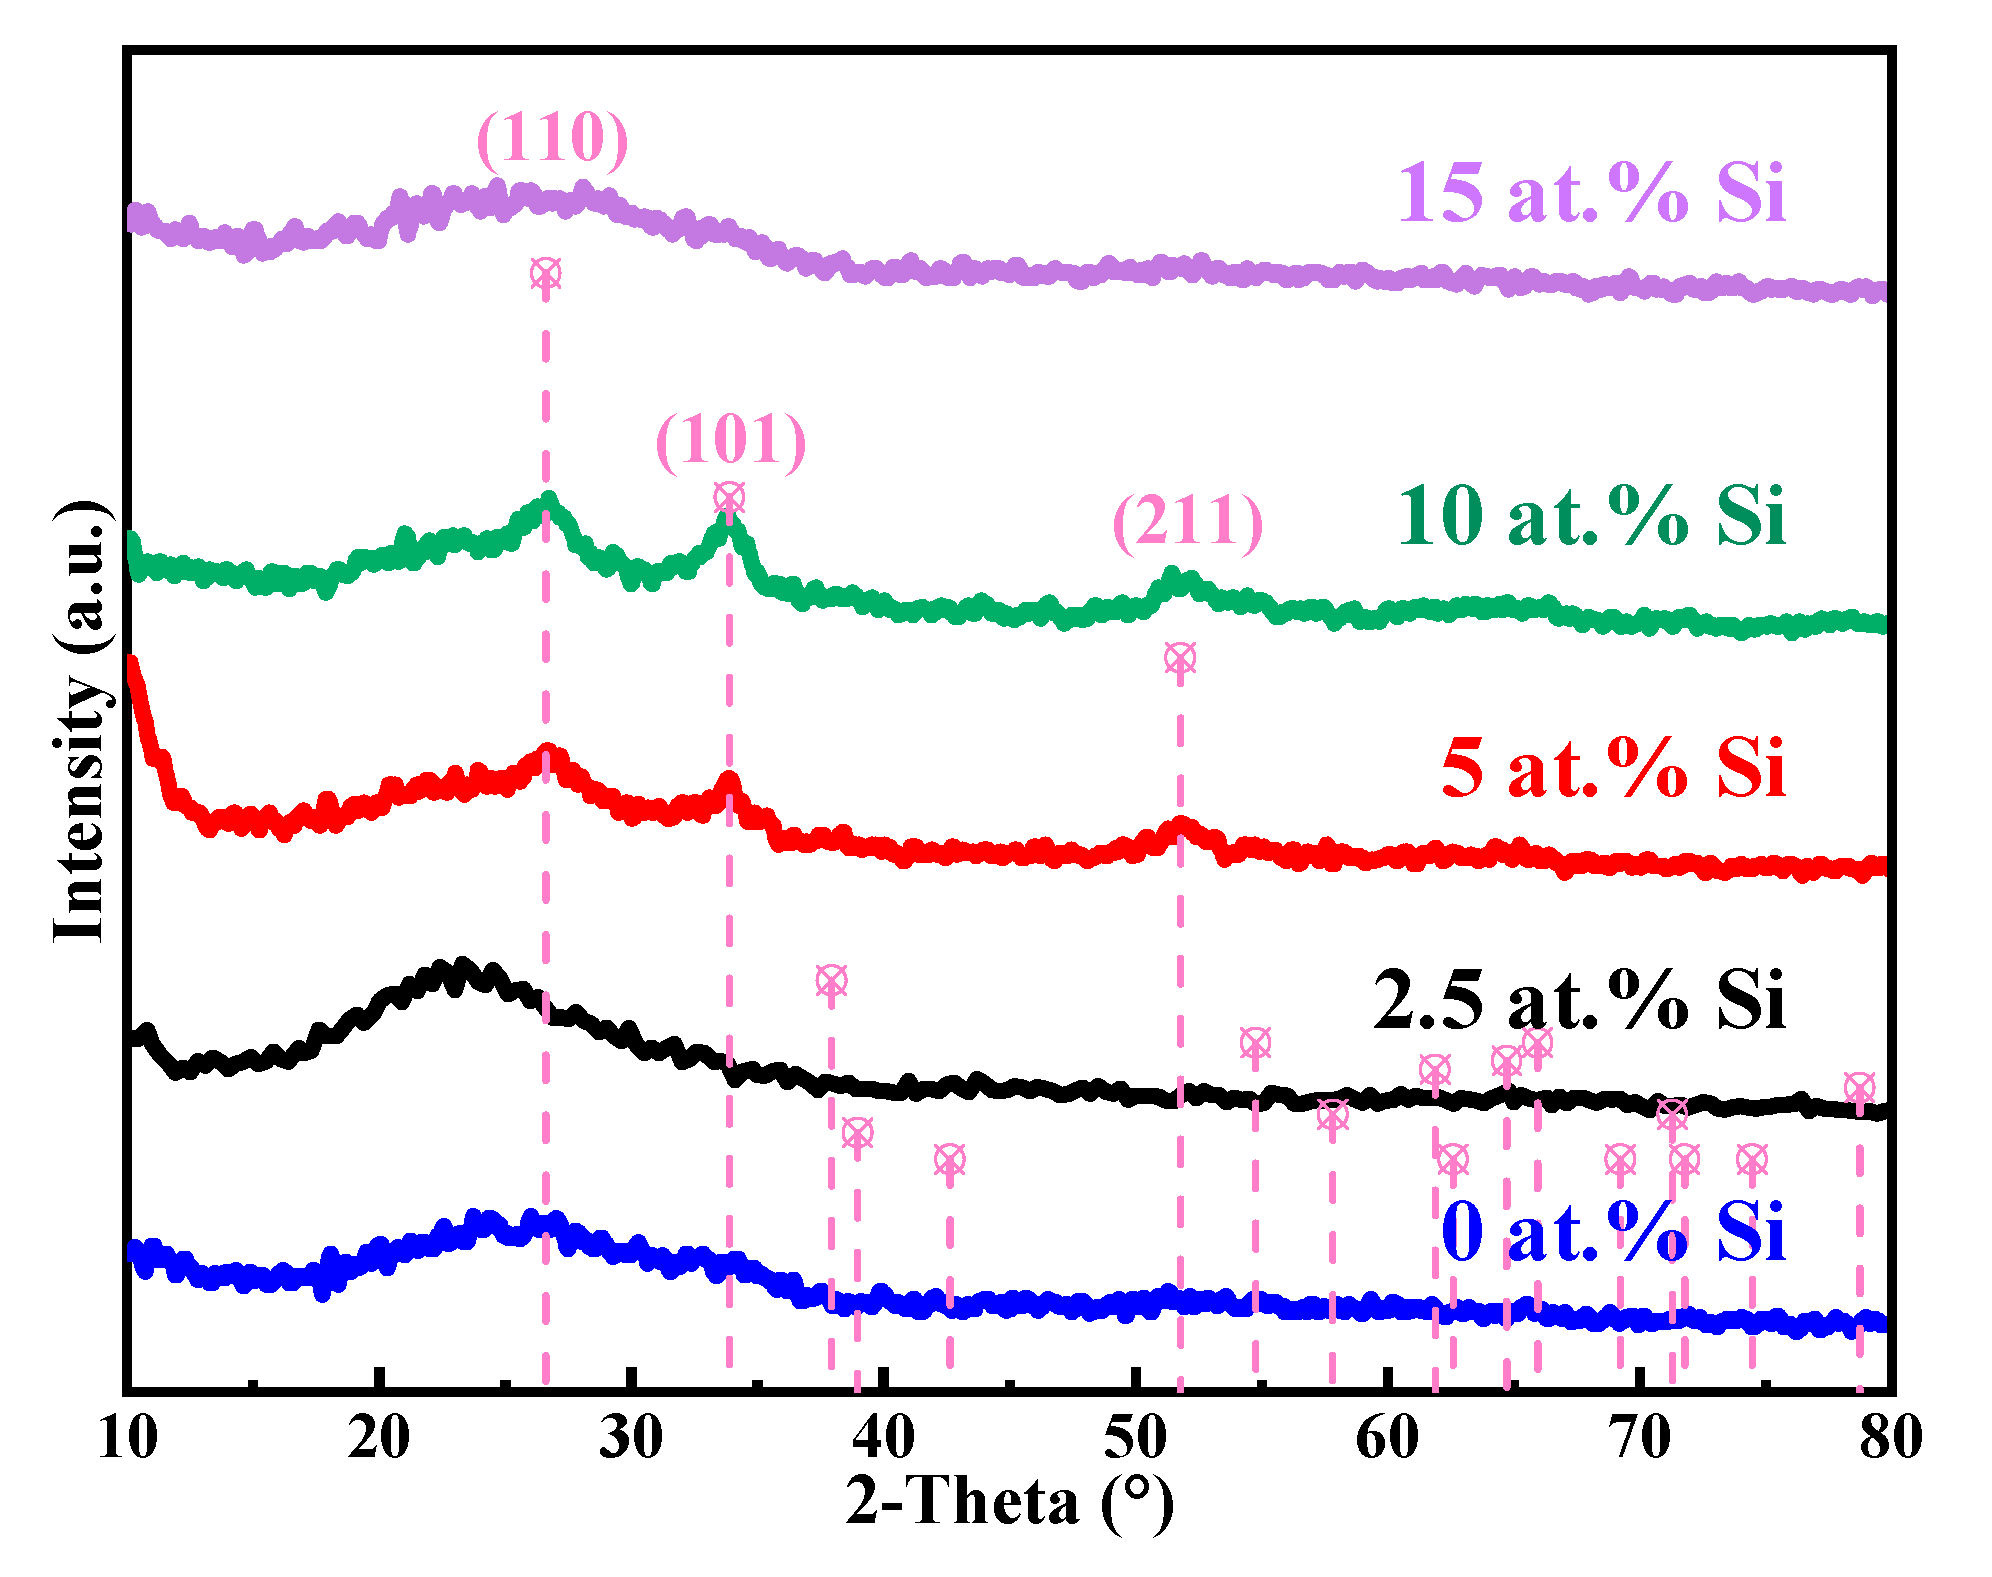
0.1 mol/L SnO2 precursor solutions were synthesized by dissolving SnCl2·2H2O in 2-methoxyethanol (2-ME), followed by stirring for 0.5 h to mix well. TEOS was added at an atomic ratio (Si/Sn at.%) of 2.5, 5, 10, and 15, respectively. Before spin coating, the precursor solutions were stirred for 12 h in the air. Figure 1 shows the preparation process of the STO films. The alkali free glass substrate was treated with oxygen plasma with a power of 60 W for 10 min. 40 μL solutions filtered through a 0.22 μm syringe filter were added dropwise to glass substrate, and then spun by a spin coater at 5000 rpm for 30 s to prepare SnO2 and STO wet films. The resulting films were transferred to a hot plate heated at 100 °C for 10 min to evaporate the organic solvent, followed by annealing at 300 °C for 1 h to obtain dense films.
The TFTs were fabricated with a bottom-gate and top-contact configuration, as shown in Figure 2. The preparation process for the active layer was essentially the same as that shown in Figure 1, except that the substrates were composed of Al: Nd/Al2O3: Nd (the thickness of Al: Nd gate electrode was 200 nm and Al2O3: Nd insulator was 300 nm with a capacitance per unit area of 38 nF/cm2), the Si doping concentrations were 0, 2.5, and 5 at.%, the spin speed was 8000 rpm, and the annealing temperatures were 300 °C and 350 °C. The S/D electrodes were deposited on the surface of the STO films by direct current (DC) sputtering of an Al target with a purity of 99.99%. The sputtering power was 100 W with a deposition pressure of 1 mTorr and a time of 1200 s. The patterning of electrodes was realized by masking the non-S/D electrode area, with a channel width of 800 μm and length of 200 μm (W:L=800:200).
The thermal characteristics of the precursors were measured with a thermogravimetric analyzer (TG) (DZ-TGA101, Nanjing Shelley biology, Nanjing, China) and a differential scanning calorimeter (DSC) (DZ-DSC300C, Nanjing Shelley biology, Nanjing, China) at a heating rate of 10°C/min from room temperature to 500 °C under ambient conditions. The contact angles of the solutions were tested by an optical contact angle meter (Biolin, Theta Lite 200, Gothenburg, Sweden). The surface morphology of STO films were observed with laser scanning confocal microscopy (LSCM) (OLS50-CB, Tokyo, Japan) and an atomic force microscope (AFM) (BY 3000, Being Nano-Instruments, Guangzhou, China). The microstructure of the STO thin films was characterized by an X-ray diffractometer (XRD) (PANalytical Empyrean, Almelo, The Netherlands). Microwave photoconductivity decay (μ-PCD) (KOBELCO, LTA-1620SP, Kobe, Japan) was performed to clarify the distribution of internal defects in the films. The electrical parameters of the STO films were obtained by Hall (ECOPIA, HMS 5300, Seoul, Korea) measurement. The chemical compositions were analyzed by X-ray photoelectron spectroscopy (XPS) (Thermo Fisher Scientific, Nexsa, MA, USA). A semiconductor parameter analyzer (Primarius FS-Pro, Shanghai, China) was employed to measure the electrical characteristics of the TFTs.

3. Results

Figure 3 shows the STO precursors with varying Si doping content after stirring for 12 h. The pure SnO2 precursor is colorless and transparent without precipitation, indicating that SnCl2·2H2O had been fully dissolved in 2-ME, which is conducive to improving the uniformity of the film. After adding TEOS, the precursor displays no obvious change, implying that TEOS has better solubility in the solvent, and Si is evenly dispersed in the precursor.
Figure 4a shows the DSC-TG curves of SnO2 precursors with 0, 2.5, and 5 at.% Si. For 0 at.% Si, the mass ratio declines rapidly from 99% to 14% during 20~147 °C, with a significant endothermic peak at 133.5 °C. The main process in this stage is the large evaporation of 2-ME (boiling point: 124.5 °C) and sol–gel reaction of Sn2+ [33]. The temperature continues to rise, but the mass decreases slowly, corresponding to the gradual removal of impurities and the conversion of SnO2. After 341.7 °C, no obvious weight loss was observed, suggesting that SnO2 has been completely transformed. Equations (1)–(3) show the reaction process [34,35]. The thermal behavior of an STO precursor with 5 at.% Si is similar to that of 0 at.% Si, but its endothermic peak of solvent evaporating shifts to 114.4 °C.
SnCl 2 · 2 H 2 O + 2 CH 3 OCH 2 CH 2 OH Sn ( OCH 2 CH 2 OCH 3 ) 2 + 2 H 2 O + 2 HCl
2 Sn ( OCH 2 CH 2 OCH 3 ) 2 + 6 H 2 O + O 2 2 Sn ( OH ) 4 + 4 CH 3 OCH 2 CH 2 OH
Sn ( OH ) 4 SnO 2 + 2 H 2 O
Figure 4b displays the local enlarged view of the TG curves for further comparison. It was found that TEOS can markedly reduce the conversion temperature of SnO2, which shifts toward a lower temperature with the increase of Si doping content. The complete conversion temperatures of SnO2 in different STO precursors are 341.7 °C (0 at.% Si), 227.7 °C (2.5 at.% Si), and 130.2 °C (5 at.% Si). After the complete transformation of SnO2, the continued rising temperature can promote the diffusion of O in air into the STO films, which partially compensates for the VO and reduces the carrier concentration, as shown in Figure 4c.
The above phenomena are ascribed to the decomposition and heat release of TEOS during high-temperature annealing, which provides more energy for film formation [36,37]. Absorbing the extra energy from TEOS prompts the endothermic peak of the evaporating solvent to shift toward a lower temperature, and promotes the formation of O-Sn-O, as shown in Figure 5, which can modestly reduce the preparation temperature of SnO2 films.
In order to study the wettability of STO precursors on the substrate surface, the contact angle of precursors on the alkali free glass was tested, with the results shown in Figure 6. It was found that the contact angle of a pure SnO2 precursor on glass substrate is relatively low (16.15°), indicating decent contact on the substrates. After adding Si, the contact angle of an STO solution on the substrate decreases, as low as 9.82° when doping 10 at.% Si. This demonstrates that Si doping can improve the wettability of SnO2 precursor solution on the substrate surface, which is conducive to improving the quality of films. Good wettability can reduce the interface defects between the film and the substrate surface, and ensure the successful progress of spin coating preparation and device manufacturing.
LSCM was employed to obtain the surface morphology of 300 °C annealed STO films, and the captured microphotographs are displayed in Figure 7a. It can be observed that all STO films are flat and uniform in large scale without physical defects such as holes and cracks, while white particles appear on the surface of pure SnO2 film, indicating that adding Si is beneficial for improving the film quality.
The surface roughness of thin films affects the interface contact and the device performance. Figure 7b shows the AFM 3D images of STO films with a scanning area of 10 × 10 μm2. The root mean square (Sq) of STO films is generally lower than that of pure SnO2 film, indicating that Si can reduce the surface roughness, which is consistent with the LSCM. The Sq of the STO film with 2.5 at.% Si is as low as 0.23 nm, and, with the rising Si content, the Sq slightly increases to 0.34 nm. Its smooth surface is conducive to decreasing the density of interface defects and subsequently improving the device performance.
Figure 8 shows the XRD patterns of STO films with different Si concentrations. It was found that the STO films with 0 at.% and 2.5 at.% Si are amorphous. When the Si concentration increases to 5 at.%, crystallization peaks occur at 26.63°, 33.83°, and 52.13°, respectively corresponding to the diffraction peaks of SnO2 on the (110), (101), and (211) crystal planes [22]. Furthermore, XRD patterns reveal no Si element-related diffraction peaks even with 10 at.% Si, implying that there is no obvious second phase in the films and SnO2 remains the main component. In addition, as Si increases from 5 at.% to 10 at.%, the diffraction peaks of SnO2 become sharper, representing enhanced crystallinity. This can be attributed to the increased exothermic heat and energy supply with the rising of TEOS content. However, for 15 at.% Si, the diffraction peaks disappear completely, which may be explained by a large amount of Si entering into the SnO2 crystal, destroying its normal lattice structure, and, thus, suppressing the crystallization of SnO2.
The internal defects of the film significantly affect the carrier concentration of the film and the performance of devices. Figure 9 shows the results of a μ-PCD test. The τ2 is correlated to the recombination rate of photogenerated carriers in the film. Shallow level defects can trap photogenerated carriers, thus reducing the recombination rate. The larger the mean peak and τ2, the higher the shallow level defect density rises [38,39,40]. Figure 9 shows that, compared with 0 at.% Si, the mean peak value of the STO film with 2.5 at.% Si declines markedly from 26.10 mV to 6.70 mV, and τ2 value decreases from 2.04 μs to 0.42 μs. This suggests that 2.5 at.% Si doping can effectively diminish the density of shallow level defects in SnO2 films, which is conducive to lowering the carrier concentration of the films. However, as Si content increases from 2.5 at.% to 15 at.%, the peak value and τ2 increase gradually, revealing that a high content of Si can increase the density of shallow level defects in SnO2. Singhal et al. [41] reported the same trend that doping Co increases defect content in TiO2. The variation of defects in the semiconductor material is ascribed to the shift of Fermi level when doping, which can result in spontaneous formation of the compensating charged defects [42].
Figure 10 displays the O 1s XPS spectra of STO thin films as a function of Si concentration. The O elements in SnO2 films mainly exist in the form of lattice oxygen (LO), adsorbed oxygen (AO), and VO. The high density of VO is the dominant factor for high carrier concentration of SnO2 films. The characteristic peaks of O can be deconvoluted into three peaks by their different binding energy (LO: ~530 eV, AO: ~532 eV, VO: ~531 eV [43]). The variation of LO/(LO + VO + AO) and VO/(LO + VO + AO) with the content of Si can be calculated by Gaussian fitting. In particular, the area under the VO peak is proportional to the concentration of oxygen vacancy, which acts as defects as well as electron donors [16,17,44]. Compared with 0 at.% Si, the VO ratio of STO film with 2.5 at.% Si decreases remarkably from 29.78% to 16.69%, as seen in Figure 10, indicating that Si can effectively suppress VO and reduce the carrier concentration. Meanwhile, the LO ratio increases substantially from 59.38% to 83.31%, implying that the addition of Si can induce the formation of O–Sn–O and preserve its structure [45]. However, as the Si concentration rises from 2.5 at.% to 15 at.%, the VO ratio in STO films slightly increases, but is still lower than 0 at.% Si. This may be due to a disordered structure whereby a large amount of Si is intercalated in the lattice [40], as indicated by the LO ratio (Figure 10f). Consequently, the density of VO can be regulated by varying the Si doping content, and the control of carrier concentration in the SnO2 film can be realized.
The electrical properties of the active layer are critical factors for TFT performance. Figure 11a shows the Hall test results of STO films with different Si concentrations. With the increase in Si content, sheet carrier concentration first decreases and then increases, which is in line with the variation trend of the peak value, τ2, and VO ratio with Si concentration. This indicates that the addition of Si affects the electrical properties of STO films by regulating internal defect density such as VO. Compared with 0 at.% Si, the sheet carrier concentration of the STO film with 5 at.% Si declines from 2.19 × 1014 cm−2 to 5.84 × 1013 cm−2, implying that Si doping can effectively diminish the carrier concentration of SnO2. In addition, it was observed that with the increased content of Si, although the sheet carrier concentration of STO films is lower than that of pure SnO2 film, the hall mobility of STO films gradually decreases, which can most likely be attributed to the scattering caused by the enhanced crystallization, as concluded in the XRD analysis.
In order to devise a suitable Si concentration range for the preparation of TFTs, I–V curves of STO films with 0, 2.5, and 5 at.% Si were investigated under the condition of a 5 V working voltage, as shown in Figure 11b. The response currents of STO films with 0, 2.5, and 5 at.% Si were 3.49 × 10⁻⁹ A, 3.76 × 10⁻¹⁰ A, and 2.34 × 10⁻⁹ A, respectively. This phenomenon shows that STO films with 2.5 at.% Si have the potential to reduce the Ioff of TFTs.
Based on previous analyses, it was found that STO films with 2.5 at.% Si showed better properties, such as the lowest VO ratio of 16.69% and a response current of 3.76 × 10⁻¹⁰ A at 5 V. Therefore, STO TFTs with 2.5 at.% Si were further fabricated with an annealing temperature of 300 °C and 350 °C. Their transfer characteristics were measured under the conditions of VGS = ±30 V and VDS = 20.1 V, as shown in Figure 12a. The following performance parameters of corresponding STO TFTs were extracted: on/off current ratio (Ioff/Ioff), off current (Ioff), the subthreshold swing (SS) of 300 °C annealed TFT of 3.46 × 10³, 7.74 × 10⁻⁹A, and 5.50 V/Dec, respectively; and that of 350 °C annealed TFT of 7.43 × 10³, 1.19 × 10⁻⁹ A, and 4.24 V/Dec, respectively. Compared with 300 °C annealing, the STO TFT fabricated at 350 °C has a higher Ioff/Ioff, a lower Ioff, and a smaller SS. The decrease of Ioff is probably a result of the increasing temperature that promotes the compensation of VO in the films, and then reduces carrier concentration, as analyzed in Figure 4c. Simultaneously, the rising temperature allows SnO2 to obtain enough energy for the internal structure to reorganize and diminish the defect density at the interface between the STO film and the Al2O3: Nd dielectric layer, leading to the reduction of the SS. However, the mobility (μsat) of 350 °C annealed STO TFT (0.32 cm2/(V·s)) is lower than that at 300 °C (0.81 cm2/(V·s)), which may be attributed to the enhanced crystallinity of STO films, and, thus, the μsat degrades with the increased scattering caused by the grain boundary [46].
Since the device prepared at 350 °C shows better performance, 350 °C annealed STO TFTs with 0, 2.5, and 5 at.% Si were further fabricated. The transfer characteristics obtained are shown in Figure 12b, and all devices exhibit good switching characteristics. Table 1 shows the extracted performance parameters of corresponding TFTs. As the Si content rises from 0 at.% to 5 at.%, it was found that (1) Ioff gradually declines while Ion/Ioff gradually increases, indicating that Si doping can effectively suppress the formation of VO, thus reducing the carrier concentration of the active layers of the STO TFT; (2) Voltage corresponding to the TFT switching from an off state to an on state (Von) gradually decreases, which is conducive to lowering power consumption in practical applications; and (3) the SS gradually reduces, probably due to the increased heat release caused by the rising concentration of TEOS, which is conducive to the reorganization of SnO2 and subsequent reduction in internal defect states. After optimization, the 350 °C annealed STO TFT with 5 at.% Si exhibits the best performance, with a μsat of 0.13 cm2/(V·s), Ioff of 2.01 × 10⁻¹⁰ A, Ion/Ioff of 1.04 × 10⁴, Von of 1.51 V, and SS of 3.48 V/Dec.

4. Conclusions

In this paper, STO TFTs were fabricated by spin coating with TEOS as an Si dopant, and the effects of Si doping concentrations on the properties of SnO2 were explored. During annealing, TEOS can decompose to release heat and supply energy for film formation, which is helpful to appropriately reduce the preparation temperature of the film and improve its quality. With the rising of Si content, the increased exothermic heat of TEOS led to the enhanced crystallization of the STO films, while excessive Si can destroy the lattice and degrade the crystallinity. In addition, Si doping can effectively suppress the VO concentration, and the VO ratio of 2.5 at.% Si doped STO film was as low as 16.69%. The variation trends of a shallow level defect density, VO ratio, and carrier concentration were concurrent with the change in Si concentration, which first decreased and then increased, indicating that Si doping regulates the electrical properties of the film by controlling defect states such as VO. Following optimization, it was confirmed that 350 °C annealed and 5 at.% Si doped STO TFT showed the best performance, as Ioff, Ion/Ioff, and Von were 2.01 × 10⁻¹⁰ A, 1.04 × 10⁴, and 1.51 V, respectively. These developments offer a foundation for further study of MOS-based films and devices prepared by the solution method.

Author Contributions

Conceptualization, Z.H. and X.Z.; methodology, Z.H.; software, Z.H.; validation, H.N., R.Y. and J.P.; formal analysis, Z.H.; investigation, X.Z. and Q.Y.; resources, J.P.; data curation, X.Z. and X.W.; writing—original draft preparation, Z.H.; writing—review and editing, X.Z., Q.Y. and H.N.; visualization, Z.H., R.W. and Y.G.; supervision, H.N. and D.L.; project administration, R.Y.; funding acquisition, H.N. All authors have read and agreed to the published version of the manuscript.

Funding

This work was supported by National Natural Science Foundation of China (Grant No.22090024 and 62174057), Southwest Institute of Technology and Engineering Cooperation Fund (HDHDW5902020402), Key-Area Research and Development Program of Guangdong Province (No.2020B010183002), Special Fund for Science and Technology Innovation Strategy of Guangdong Province in 2021 (“Big Special Project+Task List”) Project(No.210908174533730), Guangdong Major Project of Basic and Applied Basic Research (No.2019B030302007), National Natural Science Foundation of China (Grant No.62074059) and Ji Hua Laboratory scientific research project (X190221TF191).

Institutional Review Board Statement

Not Applicable.

Data Availability Statement

Data are contained within the article.

Conflicts of Interest

The authors declare no conflict of interest.

References

  1. Jeong, J.K. The status and perspectives of metal oxide thin- film transistors for active matrix flexible displays. Semicond. Sci. Technol. 2011, 26, 34008. [Google Scholar] [CrossRef]
  2. Ahn, B.D.; Jeon, H.; Sheng, J.; Park, J.; Park, J. A review on the recent developments of solution processes for oxide thin film transistors. Semicond. Sci. Technol. 2015, 30, 64001. [Google Scholar] [CrossRef]
  3. Fukuda, K.; Takeda, Y.; Mizukami, M.; Kumaki, D.; Tokito, S. Fully solution-processed flexible organic thin film transistor arrays with high mobility and exceptional uniformity. Sci. Rep. 2015, 4, 3947. [Google Scholar] [CrossRef] [PubMed]
  4. Wager, J.F. Oxide TFTs: A progress report. Frontline Technol. 2016, 32, 16–21. [Google Scholar] [CrossRef]
  5. Yu, X.; Marks, T.J.; Facchetti, A. Metal oxides for optoelectronic applications. Nat. Mater. 2016, 15, 383–396. [Google Scholar] [CrossRef] [PubMed]
  6. Jenifer, K.; Arulkumar, S.; Parthiban, S.; Kwon, J.Y. A review on the recent advancements in tin oxide-based thin-film transistors for large-area electronics. J. Electron. Mater. 2020, 49, 7098–7111. [Google Scholar] [CrossRef]
  7. Nomura, K.; Hiromichi, O.; Akihiro, T.; Toshio, K.; Hosono, M.H.H. Room-temperature fabrication of transparent flexible thin-film. Nature 2004, 432, 488–492. [Google Scholar] [CrossRef]
  8. Hosono, H. Ionic amorphous oxide semiconductors: Material design, carrier transport, and device application. J. Non-Cryst. Solids 2006, 352, 851–858. [Google Scholar] [CrossRef]
  9. Saji, K.J.; Mary, A.P.R. Tin oxide based p and n-type thin film transistors developed by RF sputtering. ECS J. Solid State Sci. Technol. 2015, 4, Q101–Q104. [Google Scholar] [CrossRef]
  10. Jadhav, H.S.S.; Suryawanshi, M.A. Pulsed laser deposition of tin oxide thin films for field emission studies. Appl. Surf. Sci. 2017, 419, 764–769. [Google Scholar] [CrossRef]
  11. Park, J.; Oh, K.T.; Kim, D.H.; Jeong, H.J.; Park, Y.C.; Kim, H.S.; Park, J.S. High-performance zinc tin oxide semiconductor grown by atmospheric-pressure mist-CVD and the associated thin-film transistor properties. ACS Appl. Mater. Interfaces 2017, 9, 20656–20663. [Google Scholar] [CrossRef] [PubMed]
  12. Yu, S.; Zheng, H.; Li, L.; Chen, S. Highly conducting and transparent antimony doped tin oxide thin films: The role of sputtering power density. Ceram. Int. 2017, 43, 5654–5660. [Google Scholar] [CrossRef]
  13. Kamiya, T.; Hosono, H. Material characteristics and applications of transparent amorphous oxide semiconductors. NPG Asia Mater. 2010, 2, 15–22. [Google Scholar] [CrossRef] [Green Version]
  14. Kuo, Y. Thin film transistor technology—Past, present, and future. Interface Mag. 2013, 22, 55–61. [Google Scholar] [CrossRef]
  15. Thomas, S.R.; Pattanasattayavong, P.; Anthopoulos, T.D. Solution-processable metal oxide semiconductors for thin-film transistor applications. Chem. Soc. Rev. 2013, 42, 6910. [Google Scholar] [CrossRef]
  16. Younis, A.; Chu, D.; Li, S. Voltage sweep modulated conductance quantization in oxide nanocomposites. J. Mater. Chem. C 2014, 2, 10291–10297. [Google Scholar] [CrossRef]
  17. Du, H.; Wang, Y.; Arandiyan, H.; Younis, A.; Scott, J.; Qu, B.; Wan, T.; Lin, X.; Chen, J.; Chu, D. Design and synthesis of CeO2 nanowire/MnO2 nanosheet heterogeneous structure for enhanced catalytic properties. Mater. Today Commun. 2017, 11, 103–111. [Google Scholar] [CrossRef]
  18. Tsay, C.; Liang, S. Fabrication of p-type conductivity in SnO2 thin films through Ga doping. J. Alloys Compd. 2015, 622, 644–650. [Google Scholar] [CrossRef]
  19. Liu, X.; Ning, H.; Chen, J.; Cai, W.; Hu, S.; Tao, R.; Zeng, Y.; Zheng, Z.; Yao, R.; Xu, M.; et al. High-performance back-channel-etched thin-film transistors with amorphous Si-incorporated SnO2 active layer. Appl. Phys. Lett. 2016, 108, 112106. [Google Scholar] [CrossRef]
  20. Jo, K.; Moon, S.; Cho, W. Fabrication of high-performance ultra-thin-body SnO2 thin-film transistors using microwave-irradiation post-deposition annealing. Appl. Phys. Lett. 2015, 106, 43501. [Google Scholar] [CrossRef]
  21. Zhang, L.; Zhu, D.; Han, S.; Lu, Y.; Fang, M.; Liu, W.; Cao, P.; Xu, W. Aqueous solution deposition of amorphous gallium tin oxide for thin-film transistors applications. Ceram. Int. 2020, 46, 19557–19563. [Google Scholar] [CrossRef]
  22. Cojocaru, B.; Avram, D.; Kessler, V.; Parvulescu, V.; Seisenbaeva, G.; Tiseanu, C. Nanoscale insights into doping behavior, particle size and surface effects in trivalent metal doped SnO2. Sci. Rep. 2017, 7, 9598. [Google Scholar] [CrossRef] [PubMed] [Green Version]
  23. Kiisk, V.; Kangur, T.; Paalo, M.; Tätte, T.; Lange, S.; Pikker, S.; Sildos, I. Structural and luminescence characteristics of SnO2: Eu and SnO2: Eu, Sb nanophosphors upon annealing at high temperatures. Mater. Chem. Phys. 2011, 130, 293–298. [Google Scholar] [CrossRef] [Green Version]
  24. García-Tecedor, M.; Maestre, D.; Cremades, A.; Piqueras, J. Influence of Cr doping on the morphology and luminescence of SnO2 nanostructures. J. Phys. Chem. C 2016, 120, 22028–22034. [Google Scholar] [CrossRef]
  25. Zhang, X.; Liu, X.; Ning, H.; Yuan, W.; Deng, Y.; Zhang, X.; Wang, S.; Wang, J.; Yao, R.; Peng, J. Characterization studies of the structure and properties of Zr-doped SnO2 thin films by spin-coating technique. Superlattices Microstruct. 2018, 123, 330–337. [Google Scholar] [CrossRef]
  26. Lee, C.; Lee, W.; Lee, H.; Ha, S.; Bae, J.; Kang, I.; Kang, H.; Kim, K.; Jang, J. Sol-gel processed yttrium-doped SnO2 thin film transistors. Electronics 2020, 9, 254. [Google Scholar] [CrossRef] [Green Version]
  27. Corsino, D.C.; Bermundo, J.P.S.; Kulchaisit, C.; Fujii, M.N.; Ishikawa, Y.; Ikenoue, H.; Uraoka, Y. High-performance fully solution-processed oxide thin-film transistors via photo-assisted role tuning of InZnO. ACS Appl. Electron. Mater. 2020, 2, 2398–2407. [Google Scholar] [CrossRef]
  28. Kang, I.; Park, C.H.; Chong, E.; Lee, S.Y. Role of Si as carrier suppressor in amorphous Zn-Sn-O. Curr. Appl. Phys. 2012, 12, S12–S16. [Google Scholar] [CrossRef]
  29. Tricoli, A.; Graf, M.; Pratsinis, S.E. Optimal doping for enhanced SnO2 sensitivity and thermal stability. Adv. Funct. Mater. 2008, 18, 1969–1976. [Google Scholar] [CrossRef]
  30. Liu, X.; Ning, H.; Zhang, X.; Deng, Y.; Guo, D.; Wang, Y.; Wang, X.; Yuan, W.; Yao, R.; Peng, J. Flexible thin-film transistors application of amorphous tin oxide-based semiconductors. J. Soc. Inf. Disp. 2019, 27, 769–775. [Google Scholar] [CrossRef]
  31. Fortunato, E.; Barquinha, P.; Martins, R. Oxide semiconductor thin-film transistors: A review of recent advances. Adv. Mater. 2012, 24, 2945–2986. [Google Scholar] [CrossRef] [PubMed]
  32. Xu, H.; Luo, D.; Li, M.; Xu, M.; Zou, J.; Tao, H.; Lan, L.; Wang, L.; Peng, J.; Cao, Y. A flexible AMOLED display on the PEN substrate driven by oxide thin-film transistors using anodized aluminium oxide as dielectric. J. Mater. Chem. C 2014, 2, 1255–1259. [Google Scholar] [CrossRef]
  33. Kim, G.H.; Shin, H.S.; Ahn, B.D.; Kim, K.H.; Park, W.J.; Kim, H.J. Formation mechanism of solution-processed nanocrystalline InGaZnO thin film as active channel layer in thin-Film transistor. J. Electrochem. Soc. 2009, 156, H7. [Google Scholar] [CrossRef]
  34. Van Der Vis, M.G.M.; Cordfunke, E.; Konings, R. The thermodynamic properties of tetraethoxysilane (TEOS) and an infrared study of its thermal decomposition. J. Phys. IV 1993, 3, C3–C75. [Google Scholar] [CrossRef]
  35. Nurkowski, D.; Buerger, P.; Akroyd, J.; Kraft, M. A detailed kinetic study of the thermal decomposition of tetraethoxysilane. Proc. Combust. Inst. 2015, 35, 2291–2298. [Google Scholar] [CrossRef]
  36. Liu, M.; Yu, L.; Zhang, Y.; Zhang, S.; Yang, Y.; Liu, R. Preparation and characterization of superparamagnetic α-Fe2O3/Fe3O4 @ SiO2 nanocomposites via a citric-TEOS-ethanol solution combustion process. Mater. Res. Express 2021, 8, 15013. [Google Scholar] [CrossRef]
  37. Serwickab, H.M. Laponite-derived porous clay heterostructures Synthesis and physicochemical characterization. Microporous Mesoporous Mater. 2010, 127, 228–236. [Google Scholar]
  38. Yasuno, S.; Kugimiya, T.; Morita, S.; Miki, A.; Ojima, F.; Sumie, S. Correlation of photoconductivity response of amorphous In-Ga-Zn-O films with transistor performance using microwave photoconductivity decay method. Appl. Phys. Lett. 2011, 98, 102107. [Google Scholar] [CrossRef]
  39. Goto, H.; Tao, H.; Morita, S.; Takanashi, Y.; Hino, A.; Kishi, T.; Ochi, M.; Hayashi, K.; Kugimiya, T. In-line process monitoring for amorphous oxide semiconductor TFT fabrication using microwave-detected photoconductivity decay technique. IEICE Trans. Electron. 2014, 97, 1055–1062. [Google Scholar] [CrossRef] [Green Version]
  40. Dong, C.; Qu, Z.; Jiang, X.; Ren, Y. Tuning oxygen vacancy concentration of MnO2 through metal doping for improved toluene oxidation. J. Hazard. Mater. 2020, 391, 122181. [Google Scholar] [CrossRef]
  41. Singhal, R.K.; Samariya, A.; Kumar, S.; Xing, Y.T.; Jain, D.C.; Dolia, S.N.; Deshpande, U.P.; Shripathi, T.; Saitovitch, E.B. Study of defect-induced ferromagnetism in hydrogenated anatase TiO2: Co. J. Appl. Phys. 2010, 107, 113916. [Google Scholar] [CrossRef]
  42. Yan, Y.; Wei, S. Doping asymmetry in wide-bandgap semiconductors: Origins and solutions. Phys. Status Solidi B 2008, 245, 641–652. [Google Scholar] [CrossRef]
  43. Dutta, D.; Bahadur, D. Influence of confinement regimes on magnetic property of pristine SnO2 quantum dots. J. Mater. Chem. 2012, 22, 24545. [Google Scholar] [CrossRef]
  44. Wang, Z.; Zheng, J.; Li, M.; Wu, Q.; Huang, B.; Chen, C.; Wu, J.; Liu, C. Solution-based SnGaO thin-film transistors for Zn- and In-free oxide electronic devices. Appl. Phys. Lett. 2018, 113, 122101. [Google Scholar] [CrossRef]
  45. Gunawan, C.; Lord, M.S.; Lovell, E.; Wong, R.J.; Jung, M.S.; Oscar, D.; Mann, R.; Amal, R. Oxygen-vacancy engineering of cerium-oxide nanoparticles for antioxidant activity. ACS Omega 2019, 4, 9473–9479. [Google Scholar] [CrossRef] [PubMed]
  46. Gupta, N.; Tyagi, B.P. On-current modeling of polycrystalline silicon thin-film transistors. Phys. Scr. 2005, 72, 339. [Google Scholar] [CrossRef]
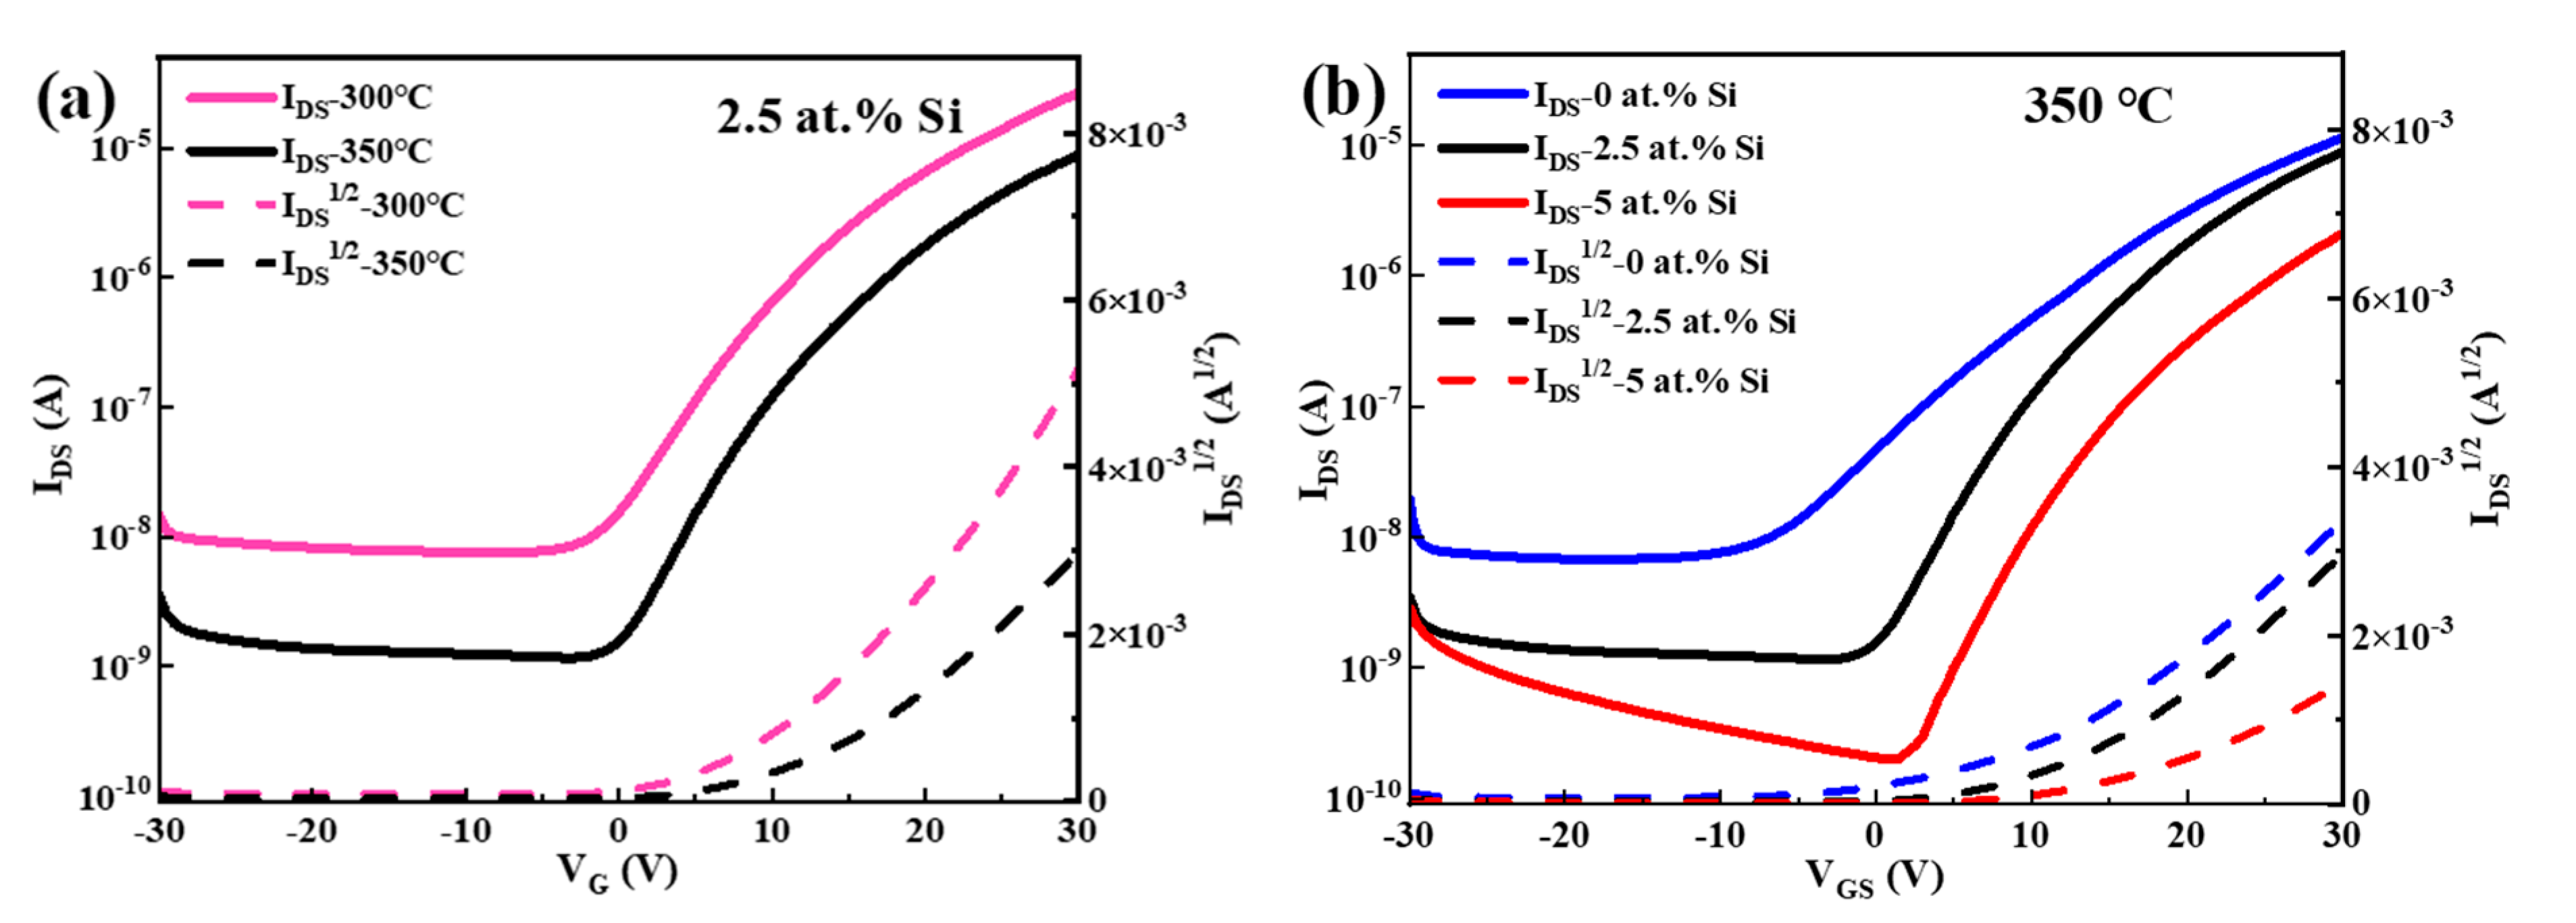
Figure 1. Sketch map of STO thin film process.
Membranes 12 00590 g001
Figure 2. (a) Sketch map of STO TFT and (b) photo of STO TFT.
Membranes 12 00590 g002
Figure 3. STO precursors with different Si concentrations.
Membranes 12 00590 g003
Figure 4. (a) DSC-TG curves of STO solutions with different Si concentrations and (b) local enlarged view of the TG. (c) Sketch map of the relationship among temperature, O and VO in STO solidification process.
Membranes 12 00590 g004
Figure 5. Sketch map of TEOS decomposition and SnOx synthesis.
Membranes 12 00590 g005
Figure 6. The contact angle of STO precursors on glass substrate.
Membranes 12 00590 g006
Figure 7. (a) LCSM images and (b) AFM 3D images (10 × 10 μm2) of STO thin films with different Si concentrations (300 °C).
Membranes 12 00590 g007
Figure 8. XRD patterns of STO films with different Si concentrations.
Membranes 12 00590 g008
Figure 9. Mean peak and τ2 value of STO films as a function of Si concentration.
Membranes 12 00590 g009
Figure 10. (ae) XPS spectra for O 1s peaks of STO films with different Si concentrations. (f) Variation of LO/(LO + VO + AO) and VO/(LO + VO + AO) with Si concentration.
Membranes 12 00590 g010
Figure 11. (a) Sheet carrier concentration and hall mobility of STO films with different Si concentrations. (b) Current-voltage response curves of STO films with different Si concentrations.
Membranes 12 00590 g011
Figure 12. (a) Transfer characteristics of the STO TFTs with 2.5 at.% Si prepared at 300 °C and 350 °C. (b) Transfer characteristics of the STO TFTs with different Si concentrations annealed at 350 °C.
Membranes 12 00590 g012
Table 1. Extracted performance parameters of 350 °C annealed STO TFTs.
Si
(at.%)
Ion
(A)
Ioff
(A)
Ion/IoffVon
(V)
μ
(cm2/(V·s))
SS
(V/Dec)
0.01.04 × 10−56.76 × 10−91.54 × 103−17.220.058.73
2.58.84 × 10−61.19 × 10−97.43 × 103−2.000.324.24
5.02.10 × 10−62.01 × 10−101.04 × 1041.510.133.48
Publisher’s Note: MDPI stays neutral with regard to jurisdictional claims in published maps and institutional affiliations.

