
Nonstoichiometry, Defect Chemistry and Oxygen Transport in Fe-Doped Layered Double Perovskite Cobaltite PrBaCo2−xFexO6−δ (x = 0–0.6) Membrane Materials

 ,
,  ,
,  , and
, and
Abstract
:1. Introduction
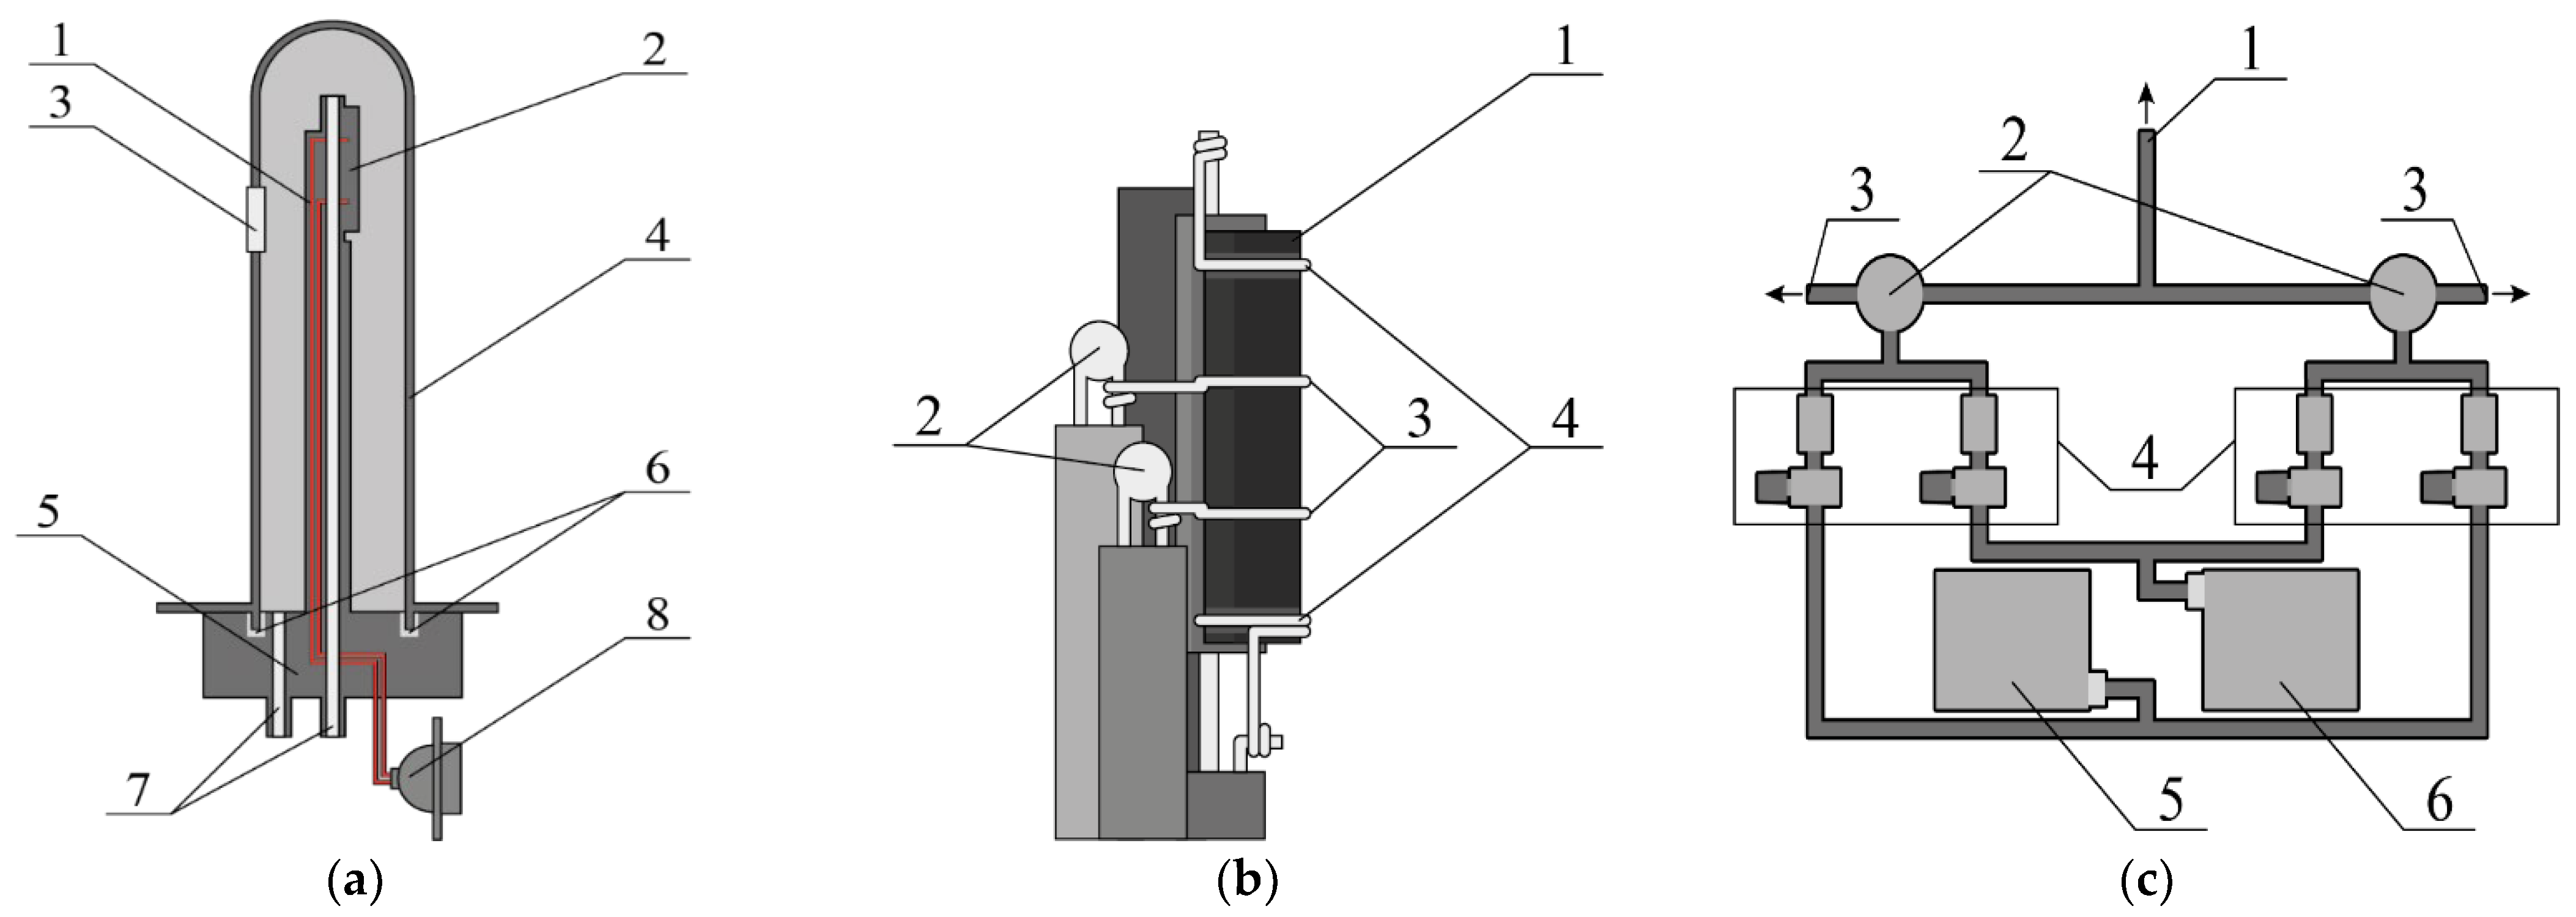
2. Experimental
3. Results and Discussion
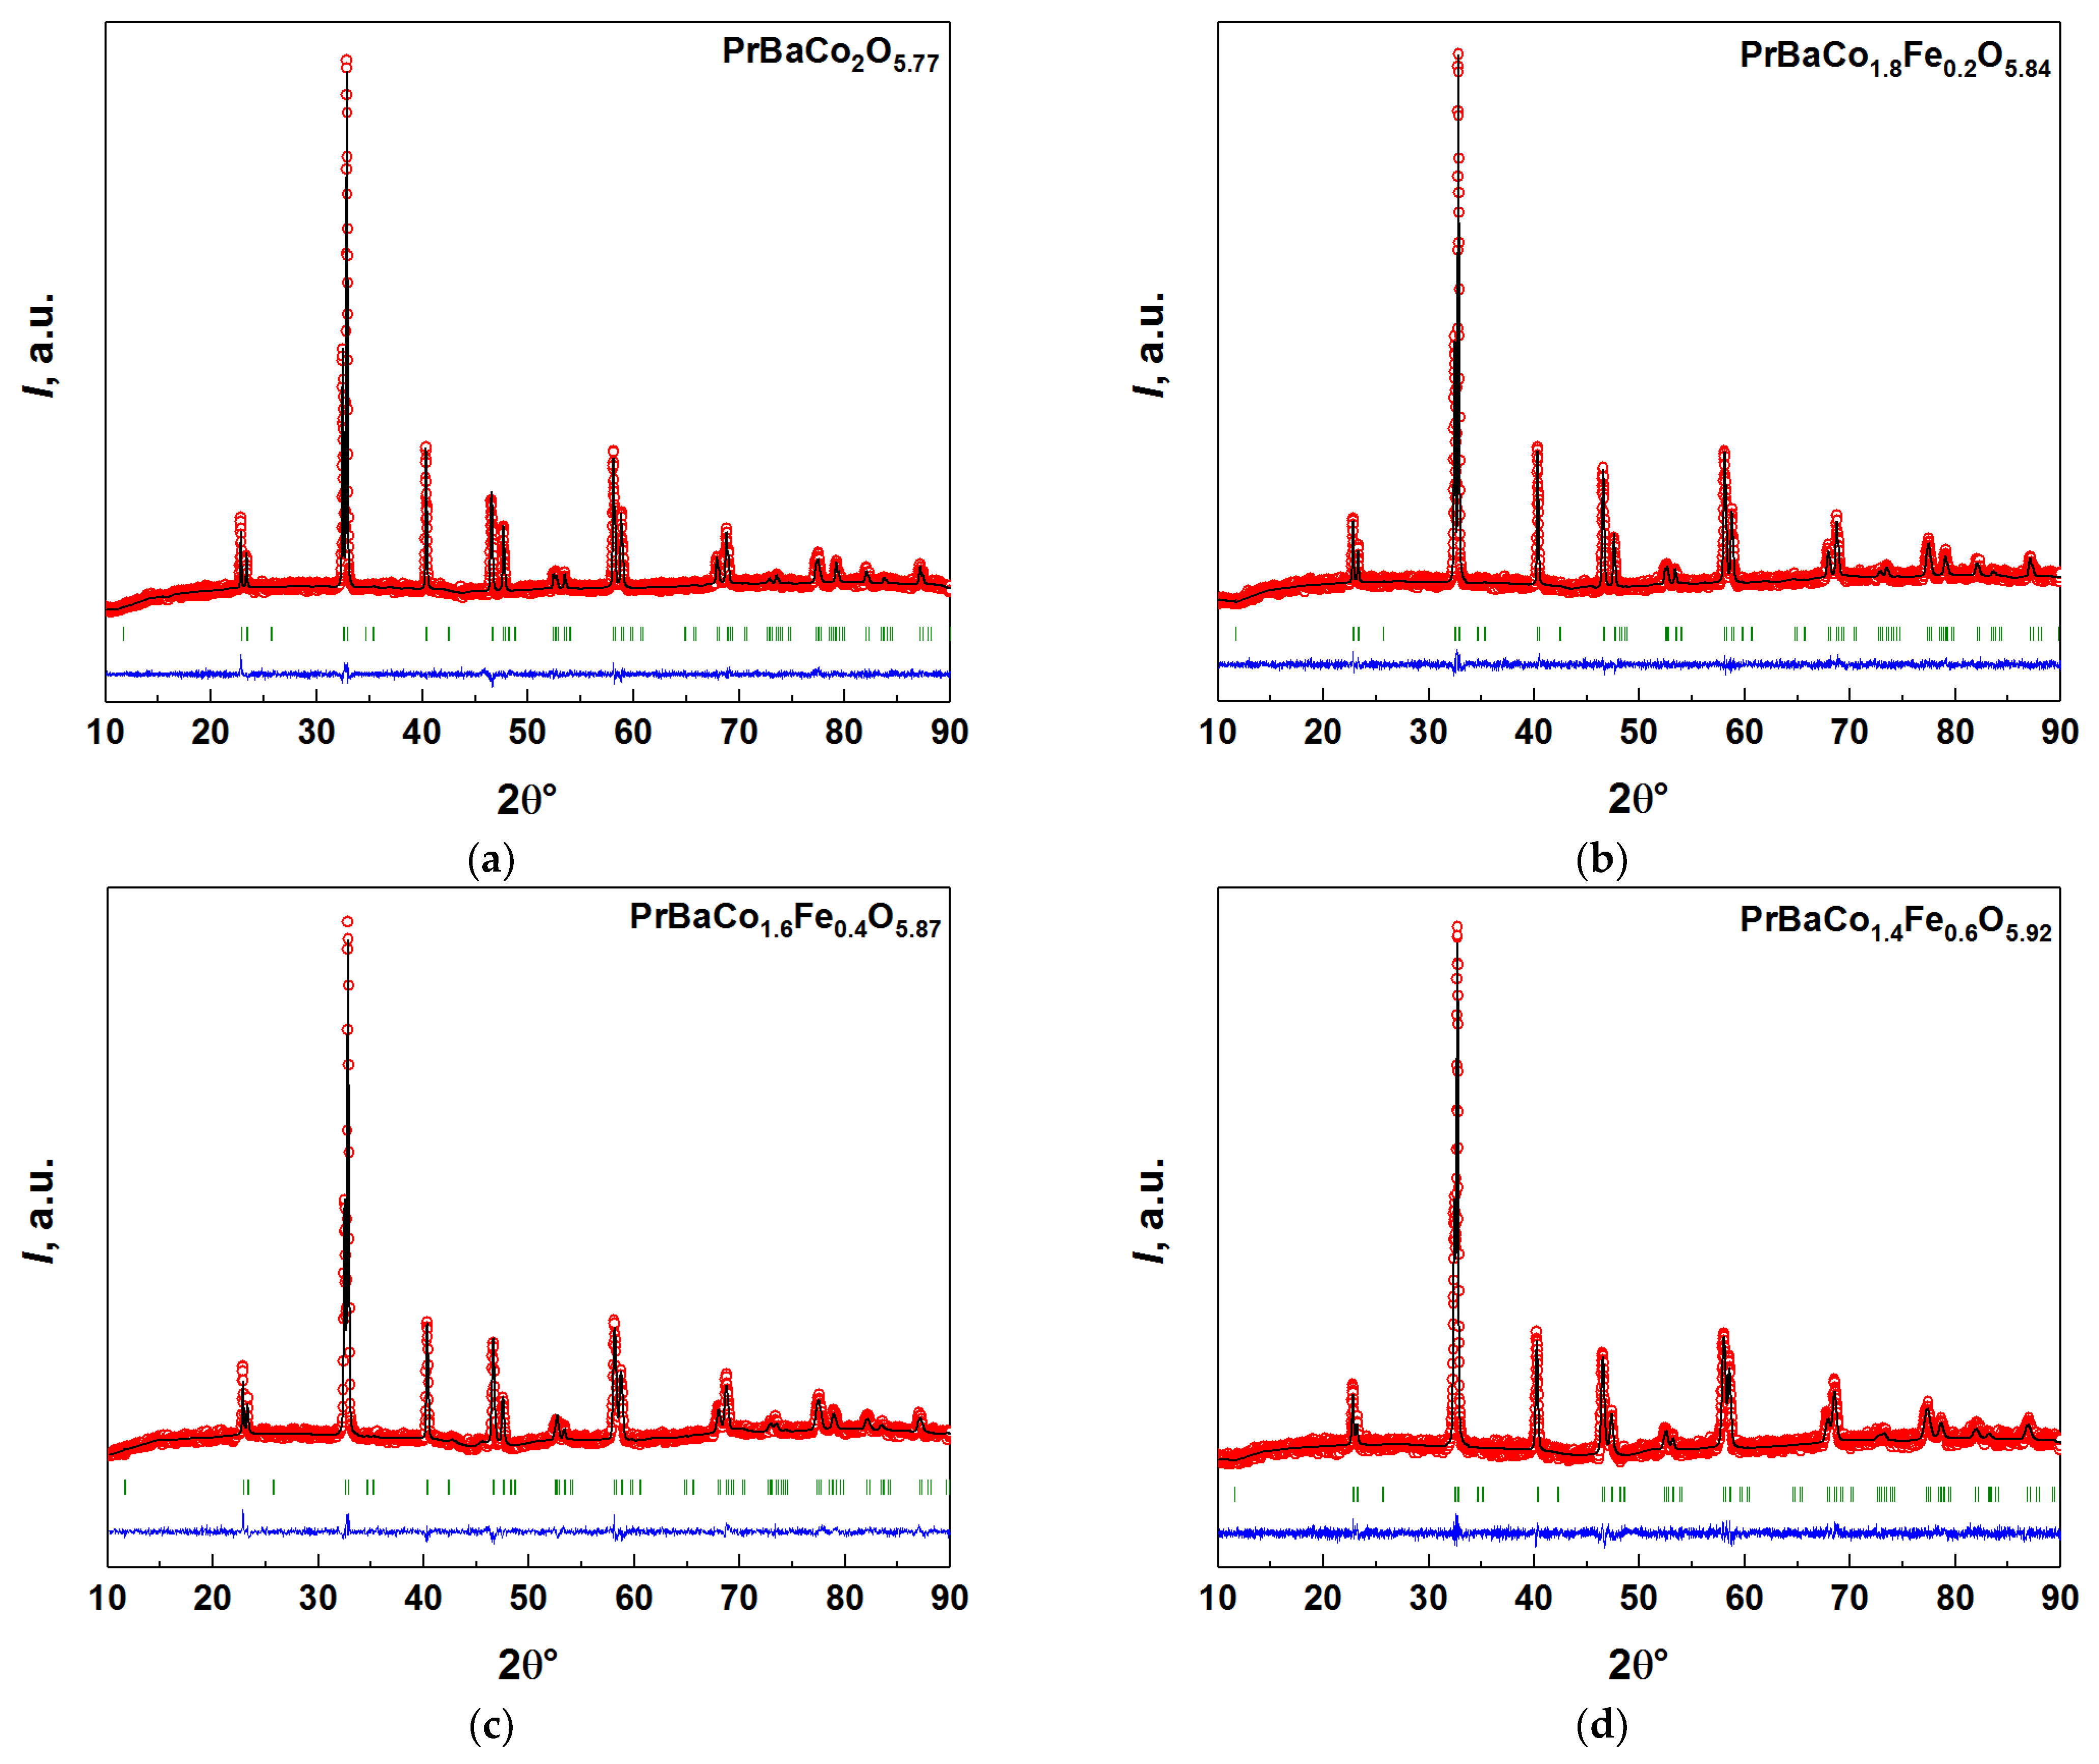
3.1. Phase Composition and Crystal Structure of the Double Perovskites PBCF
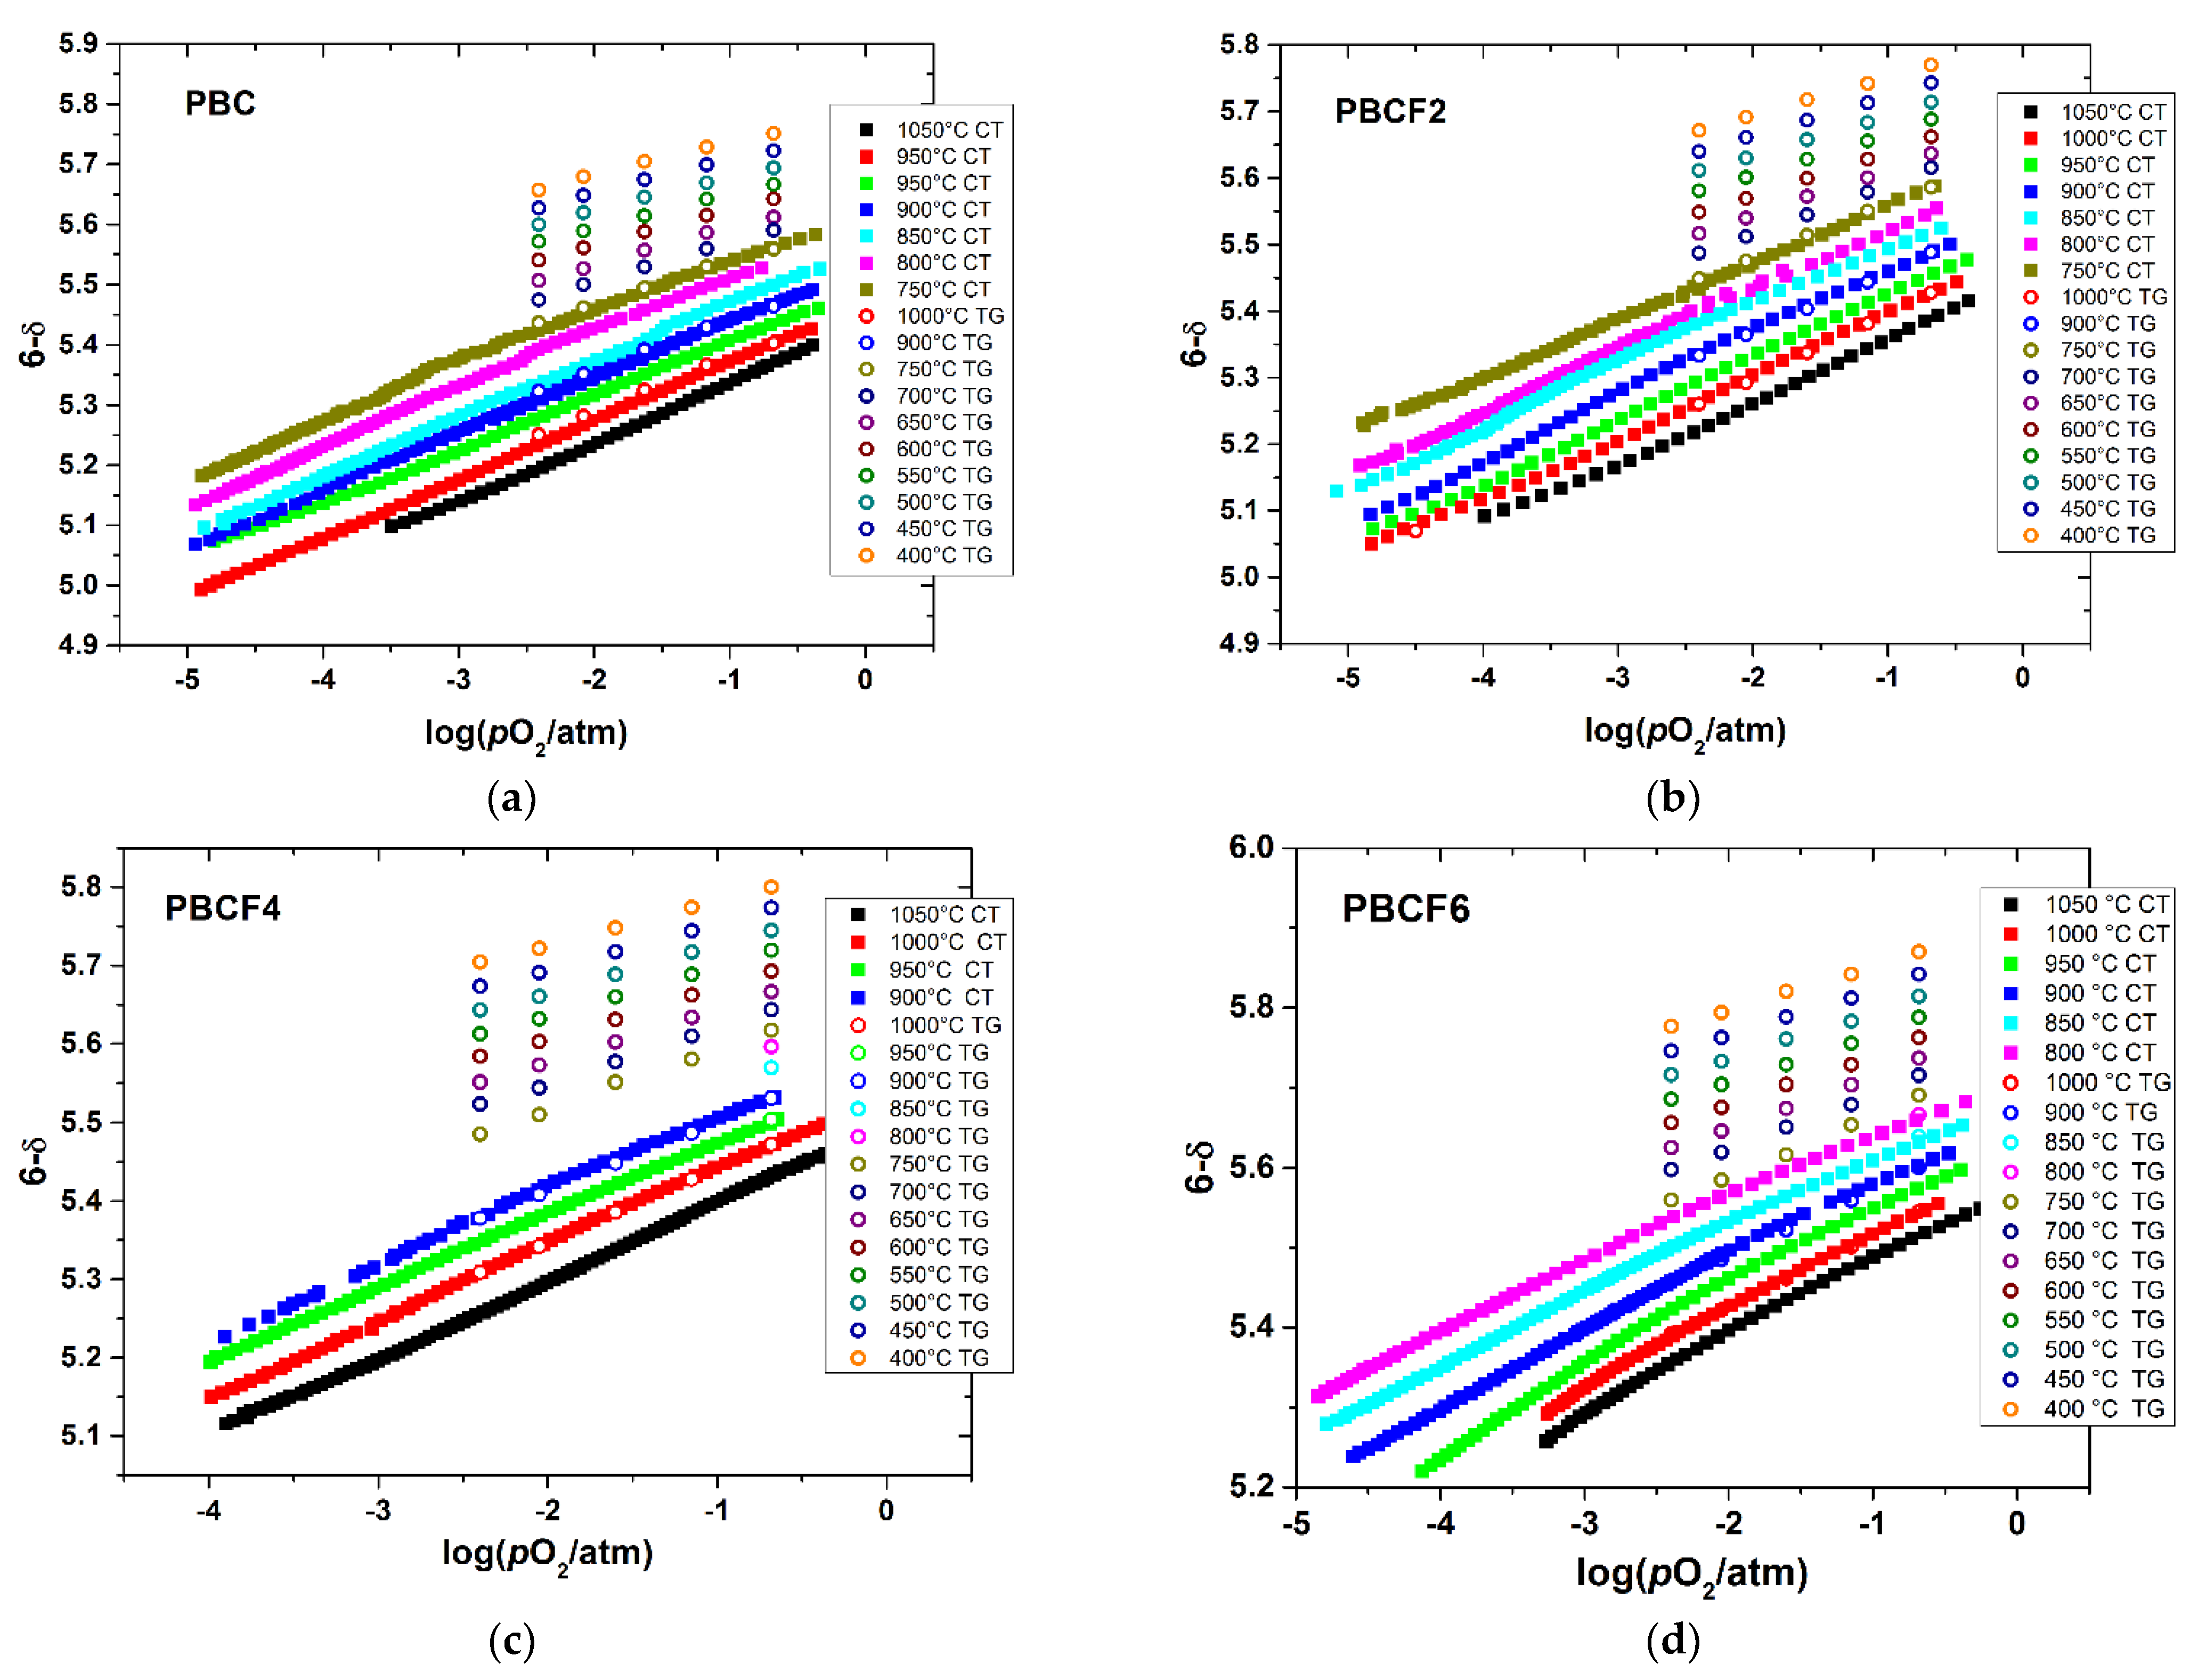
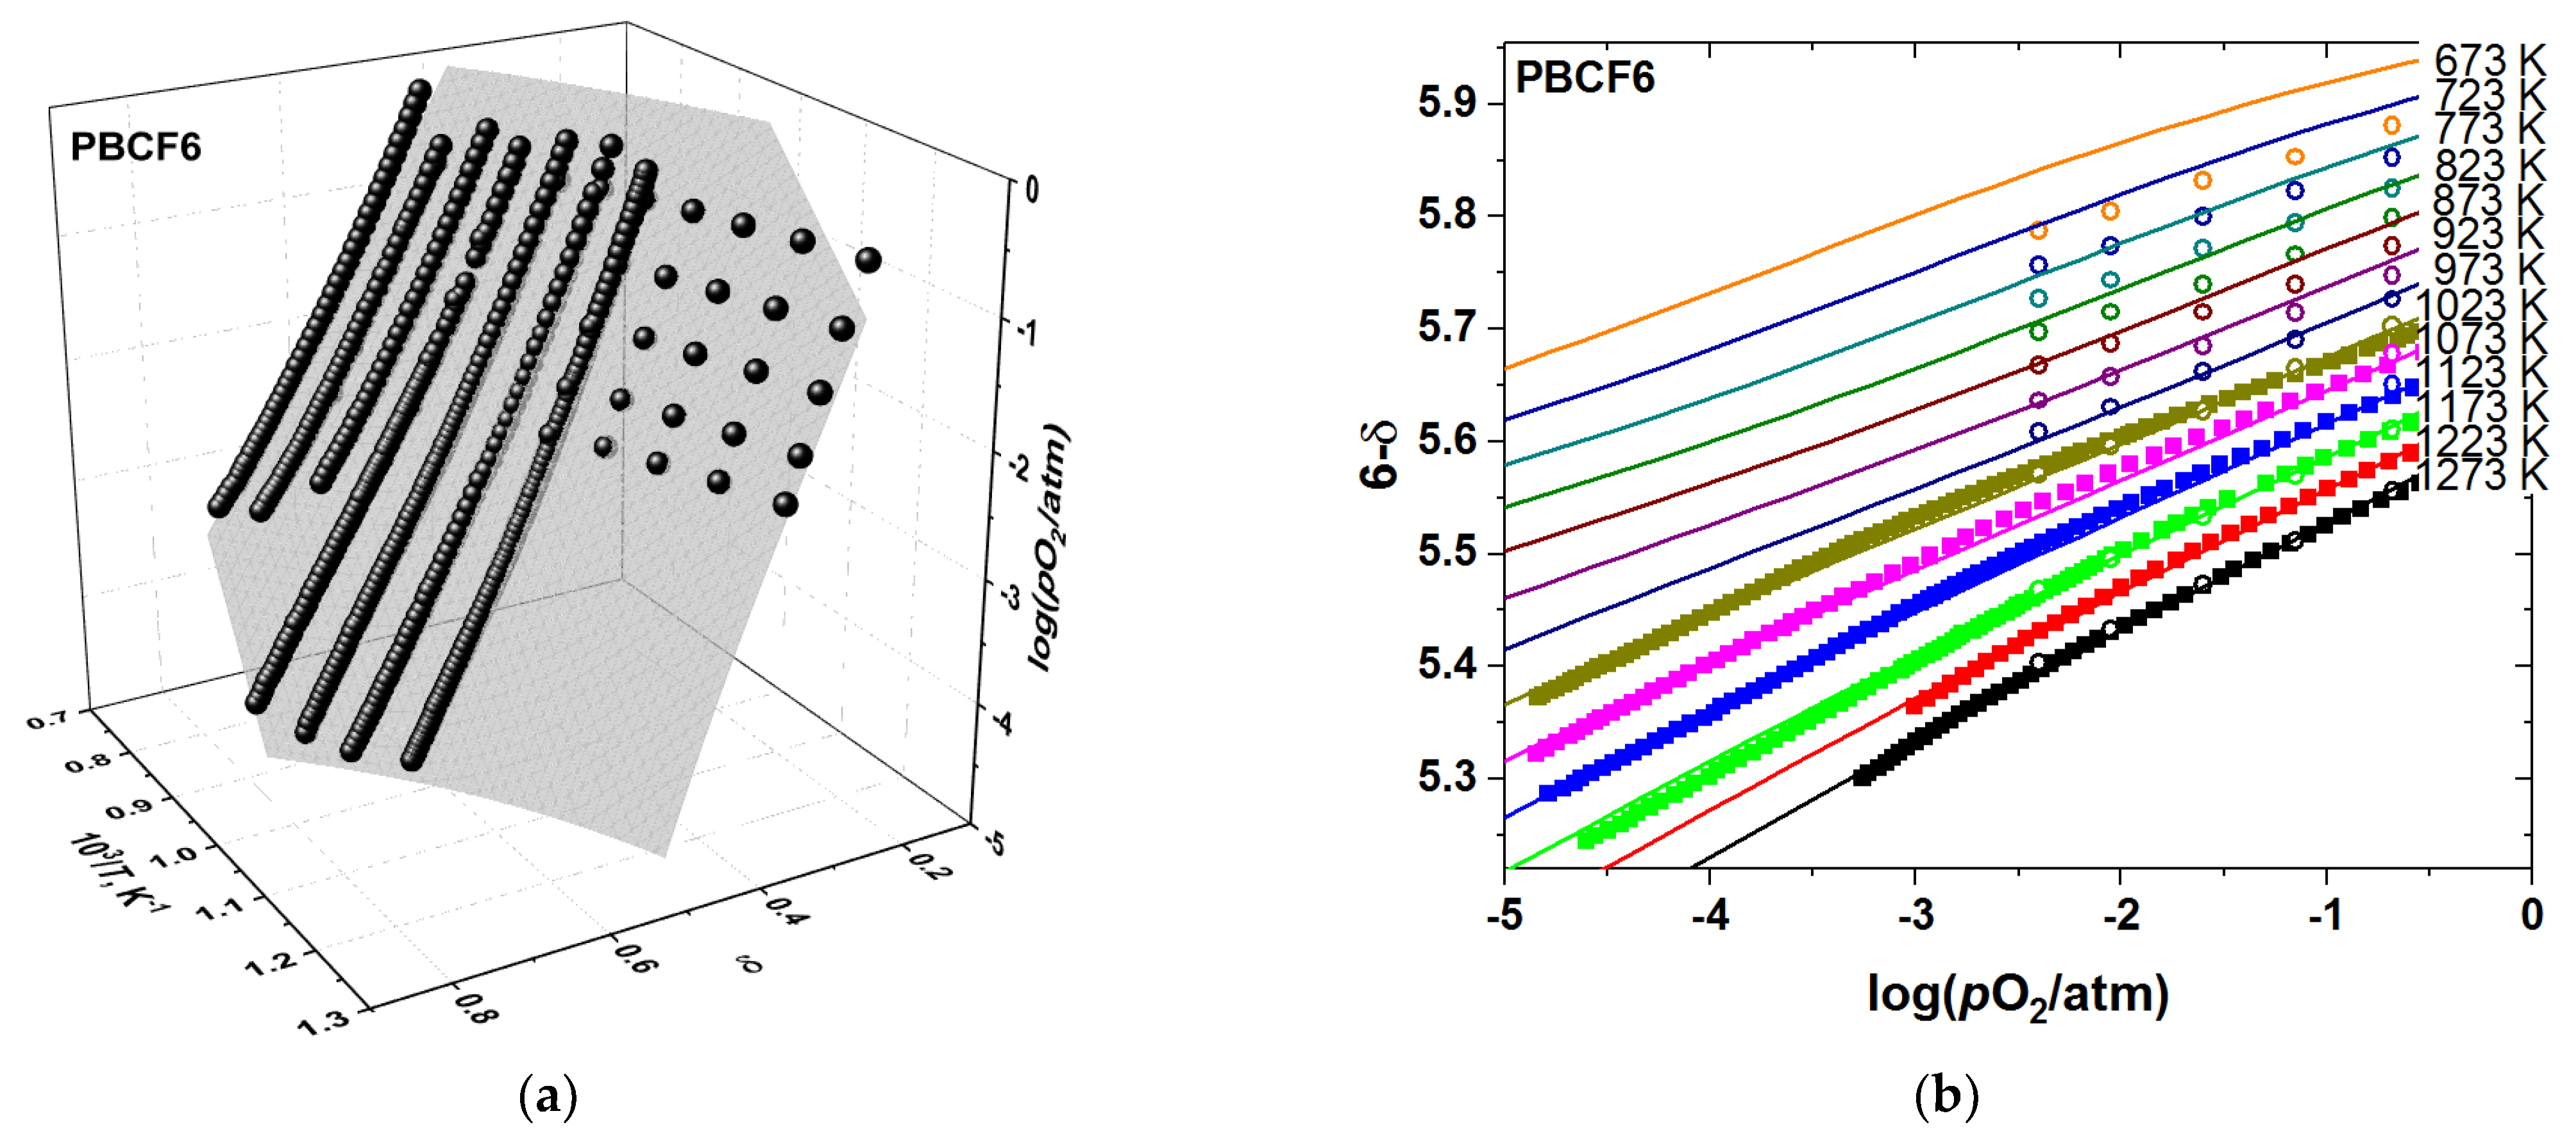
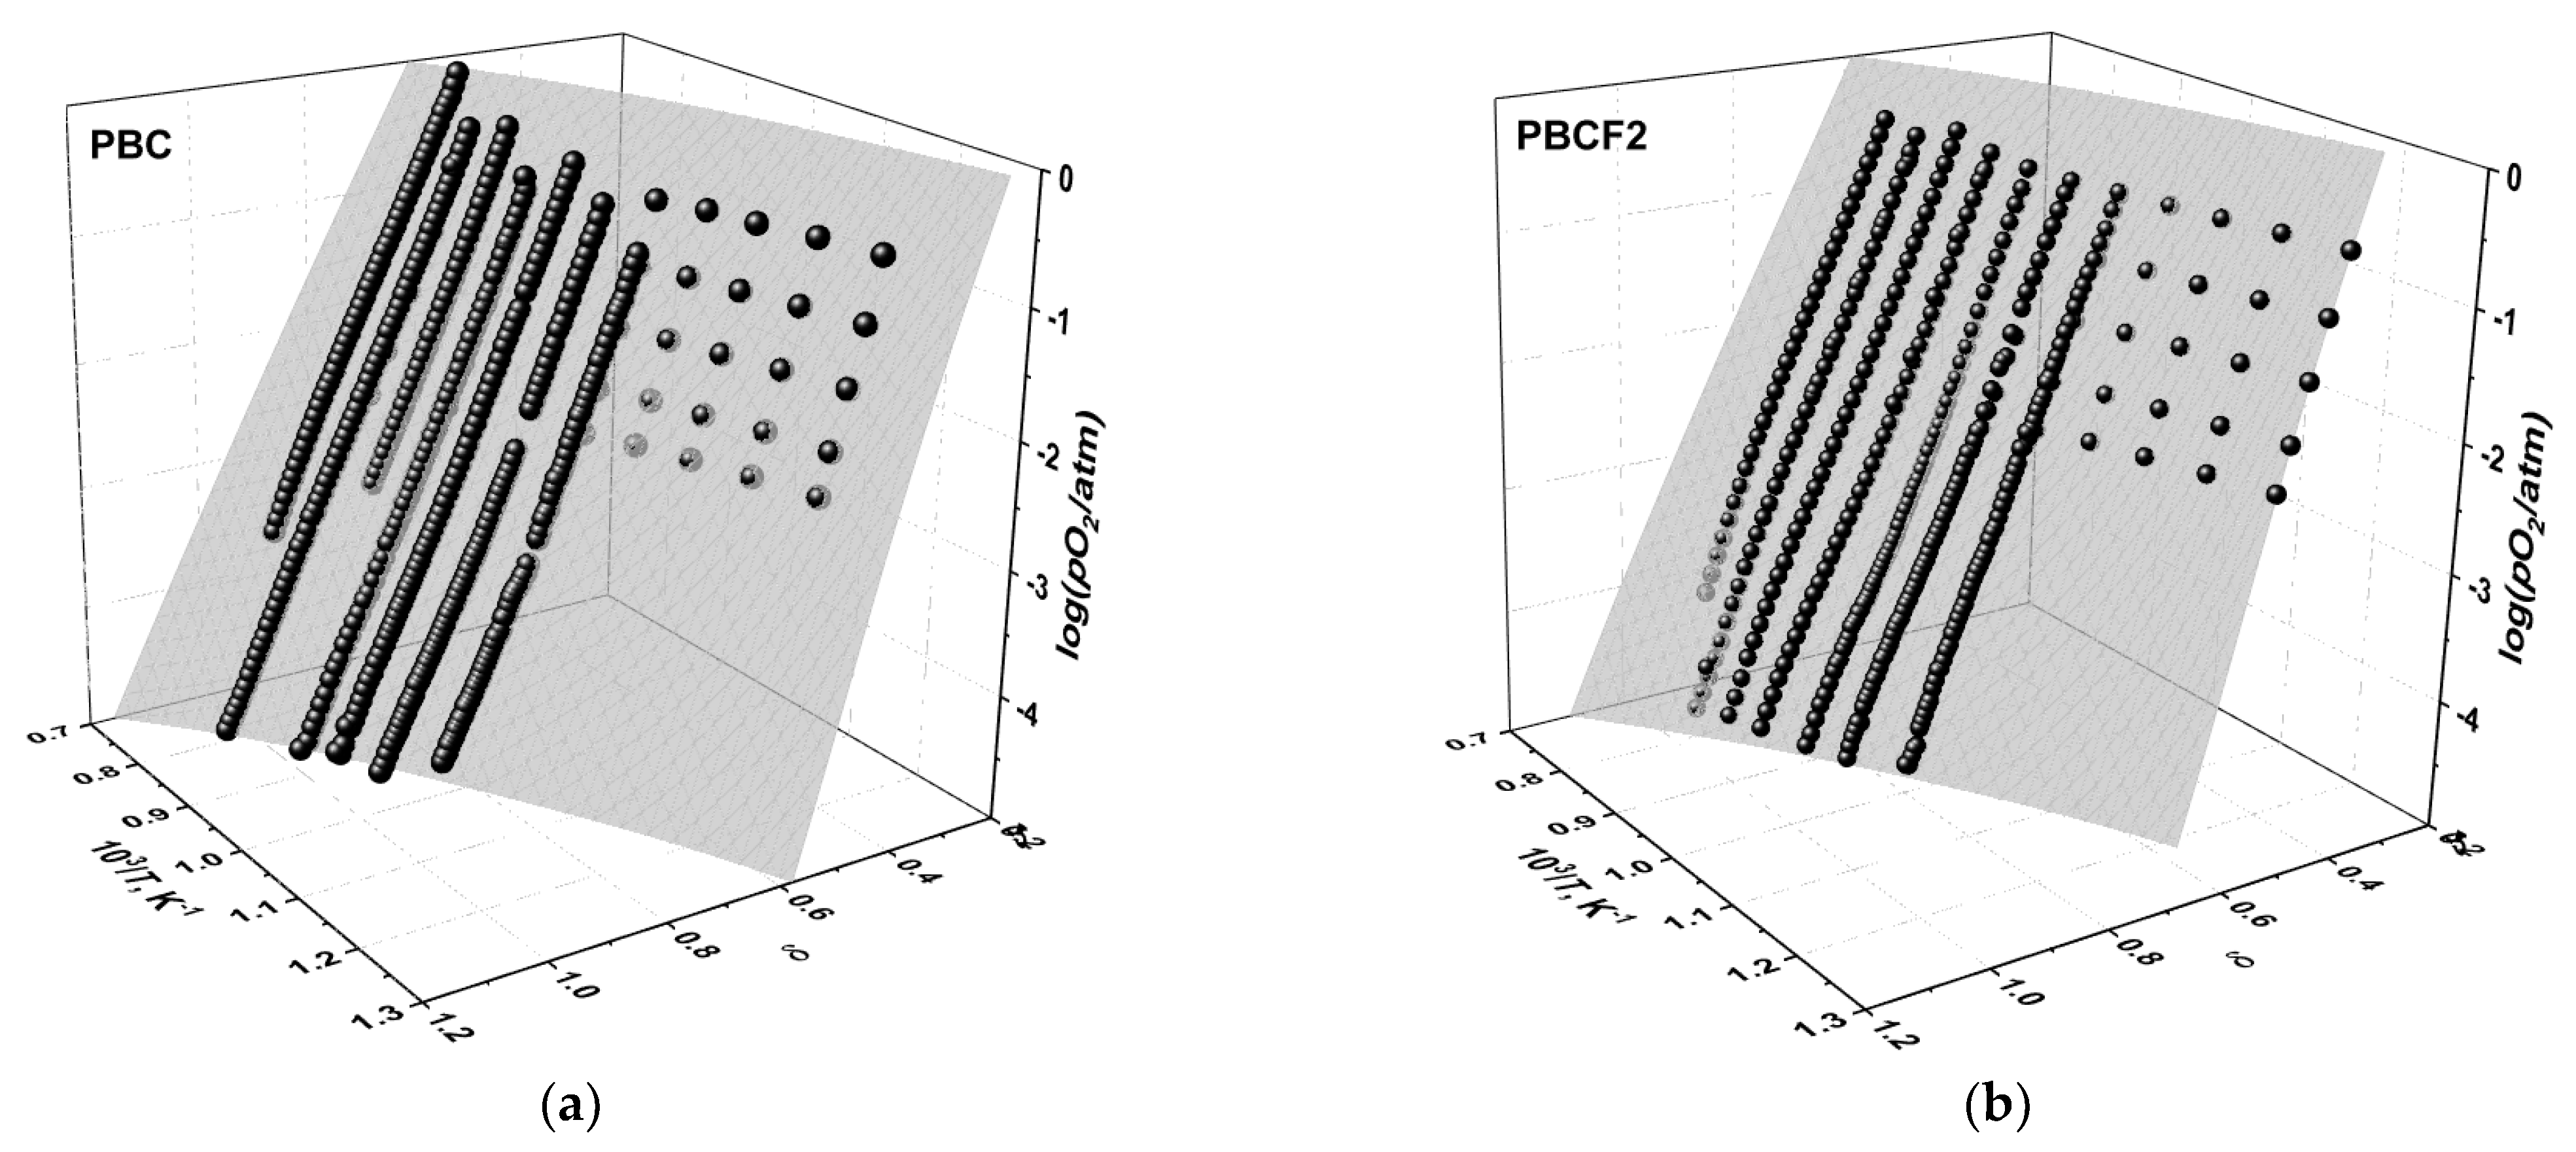
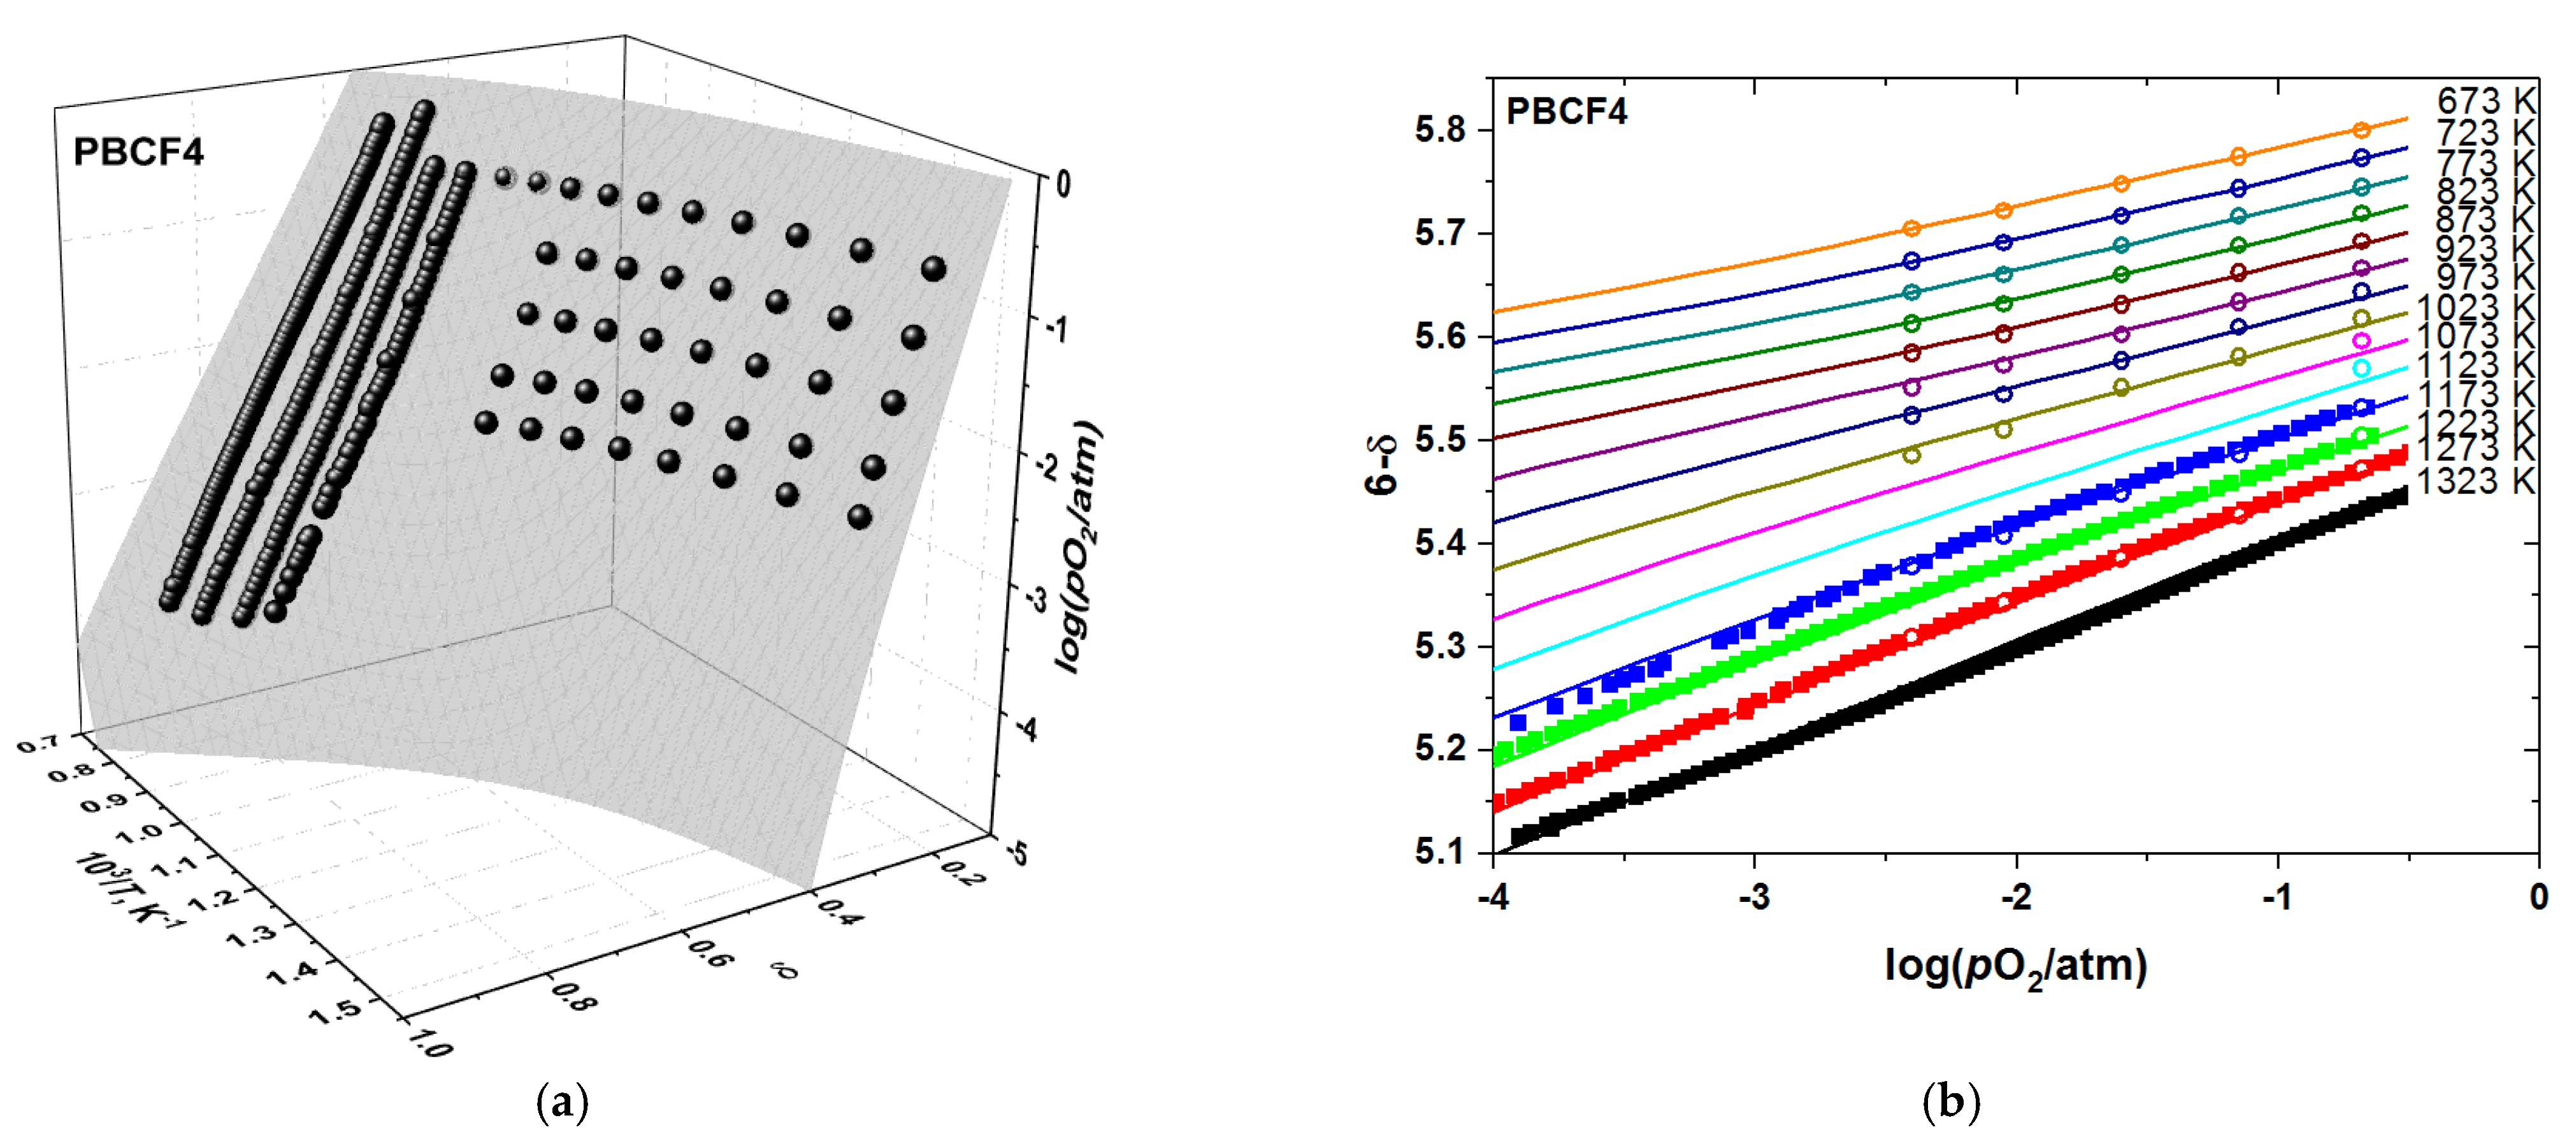
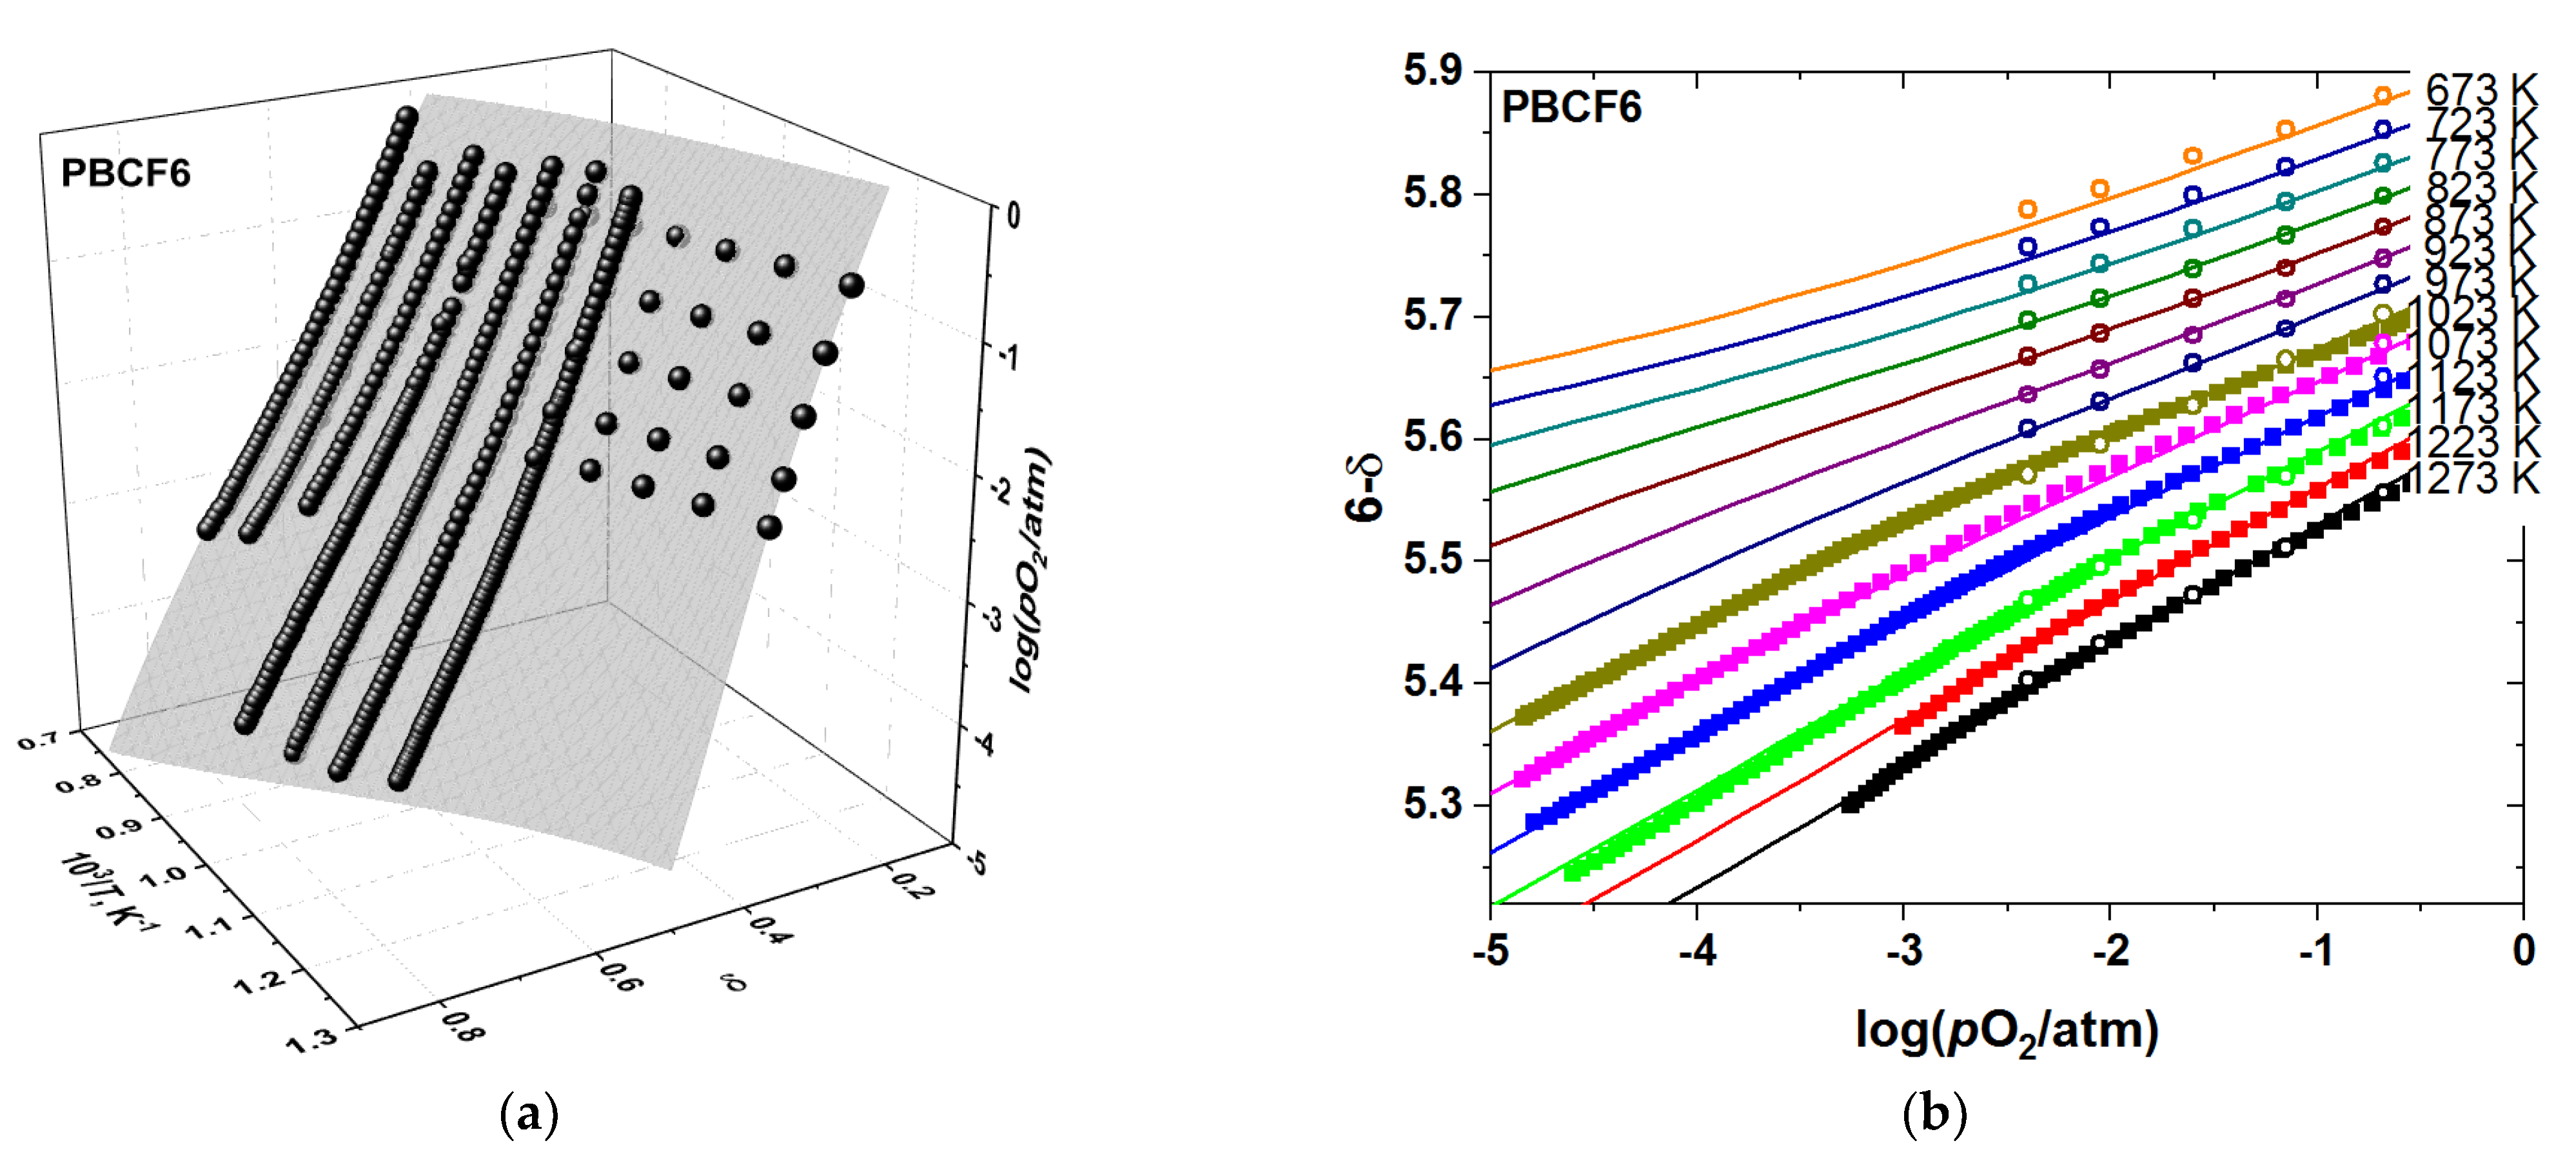
3.2. Oxygen Content in PBCF and Their Defect Chemistry
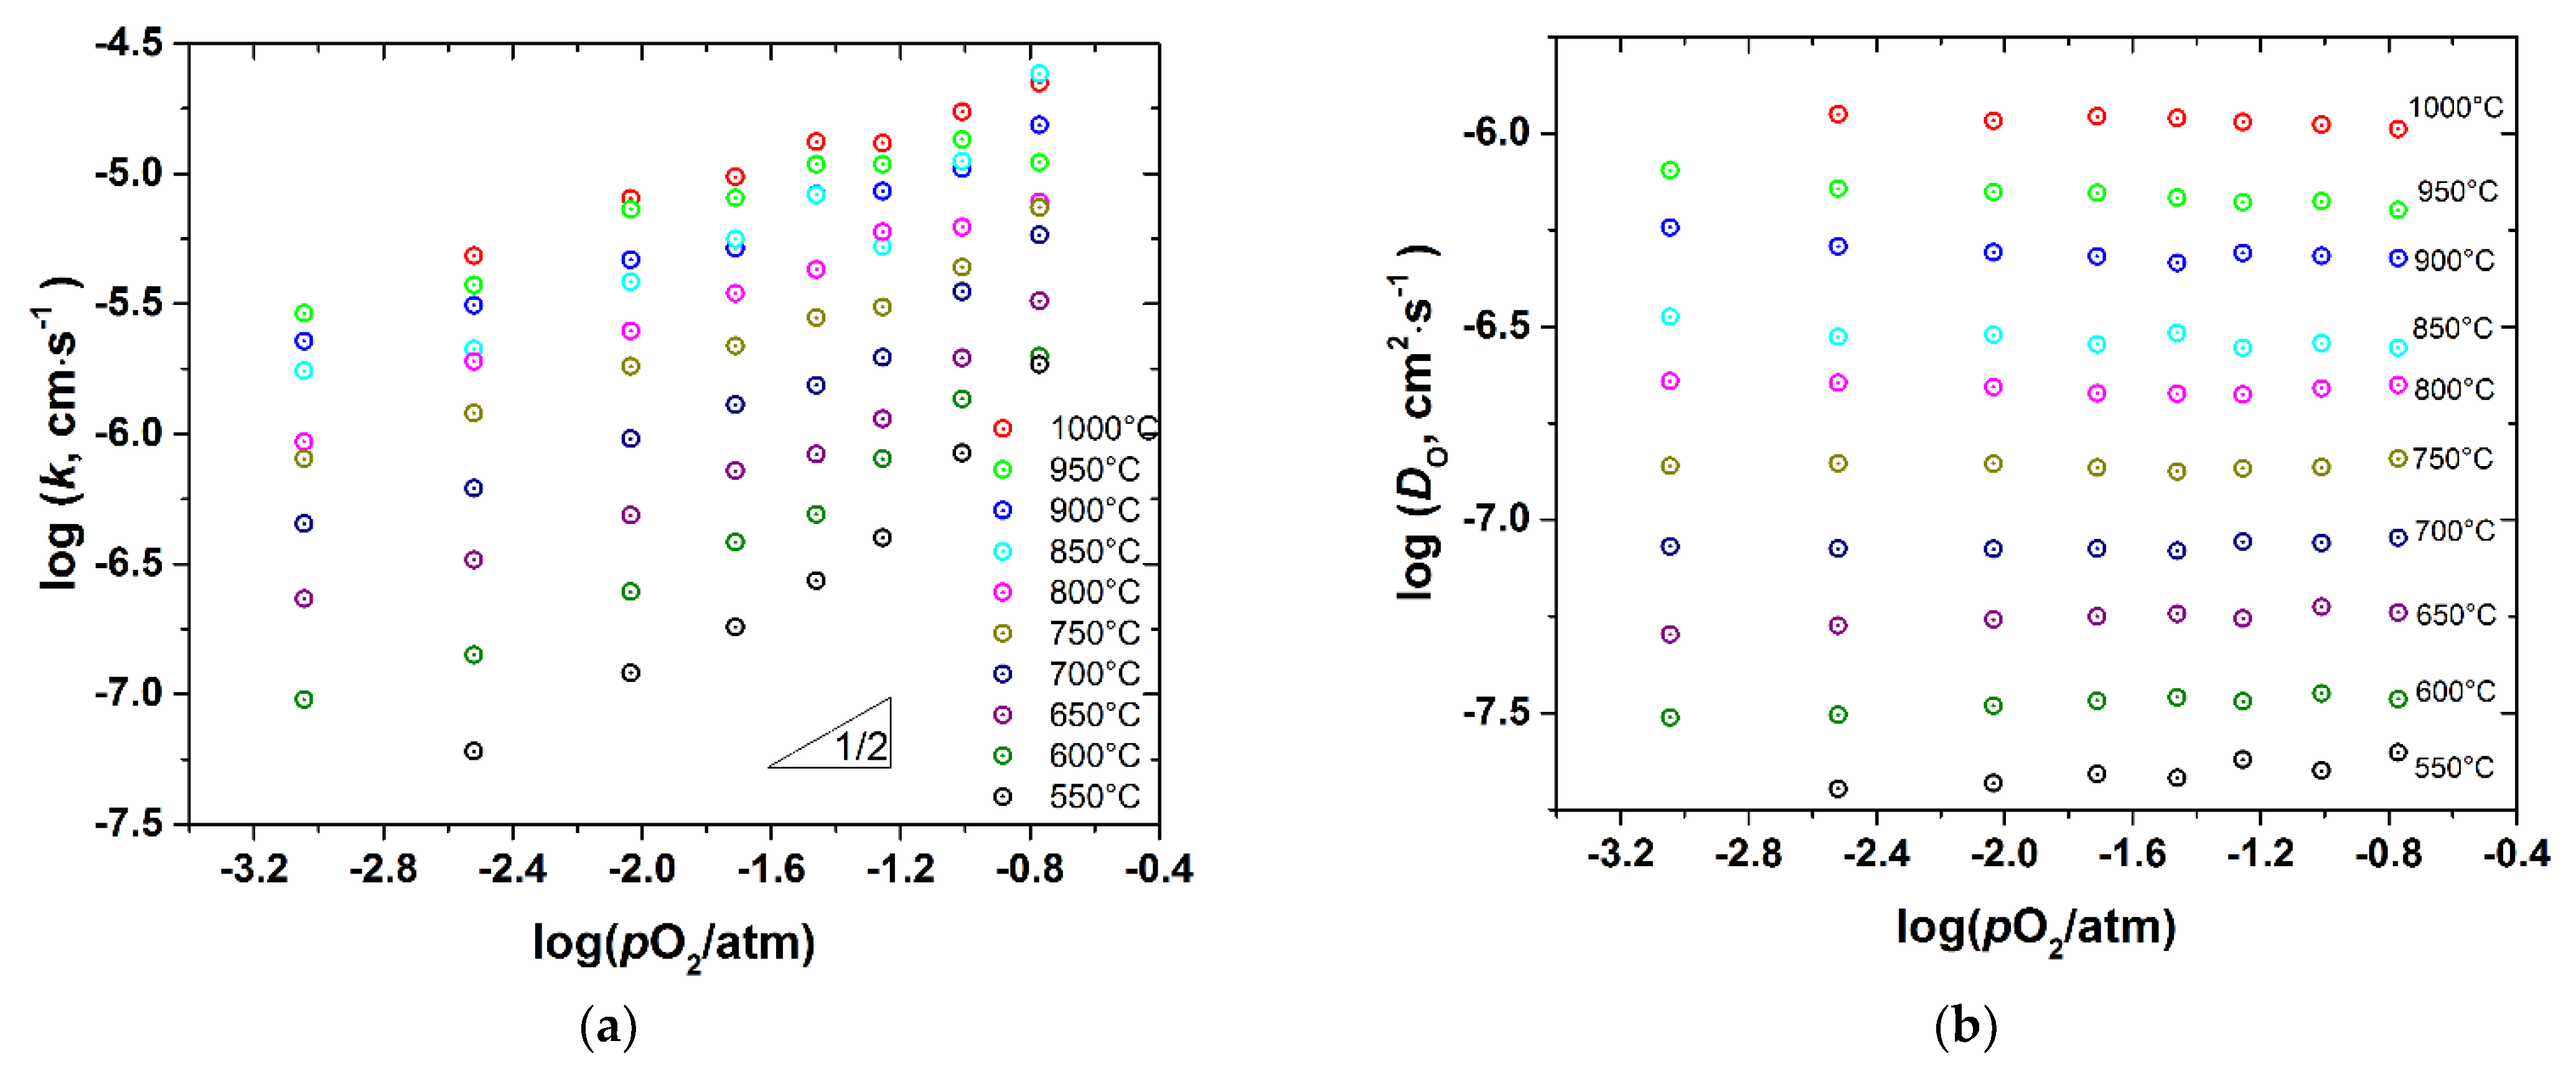
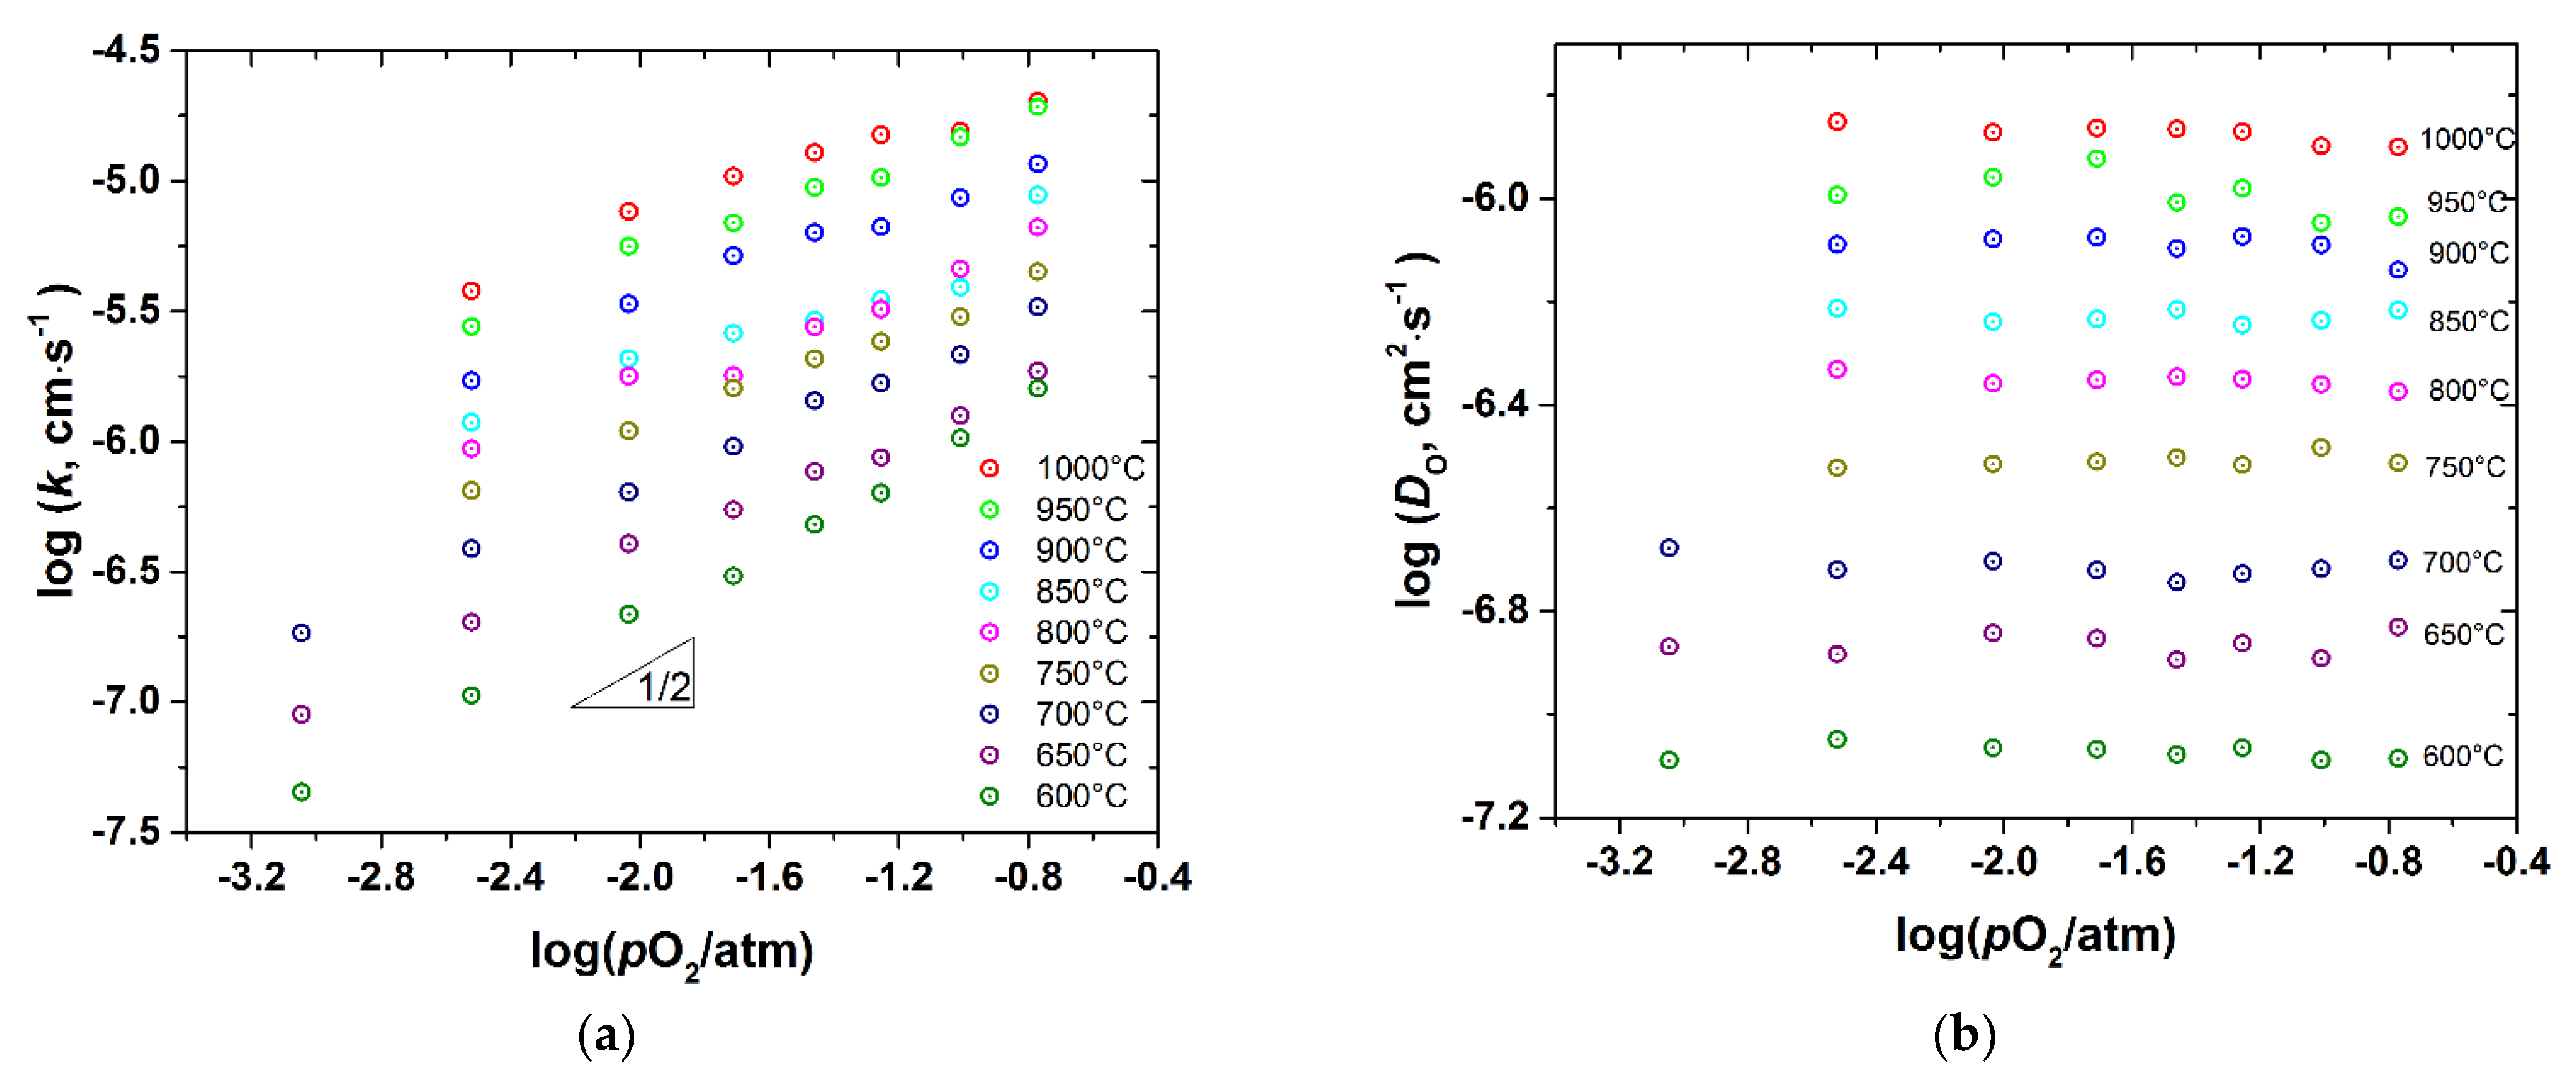
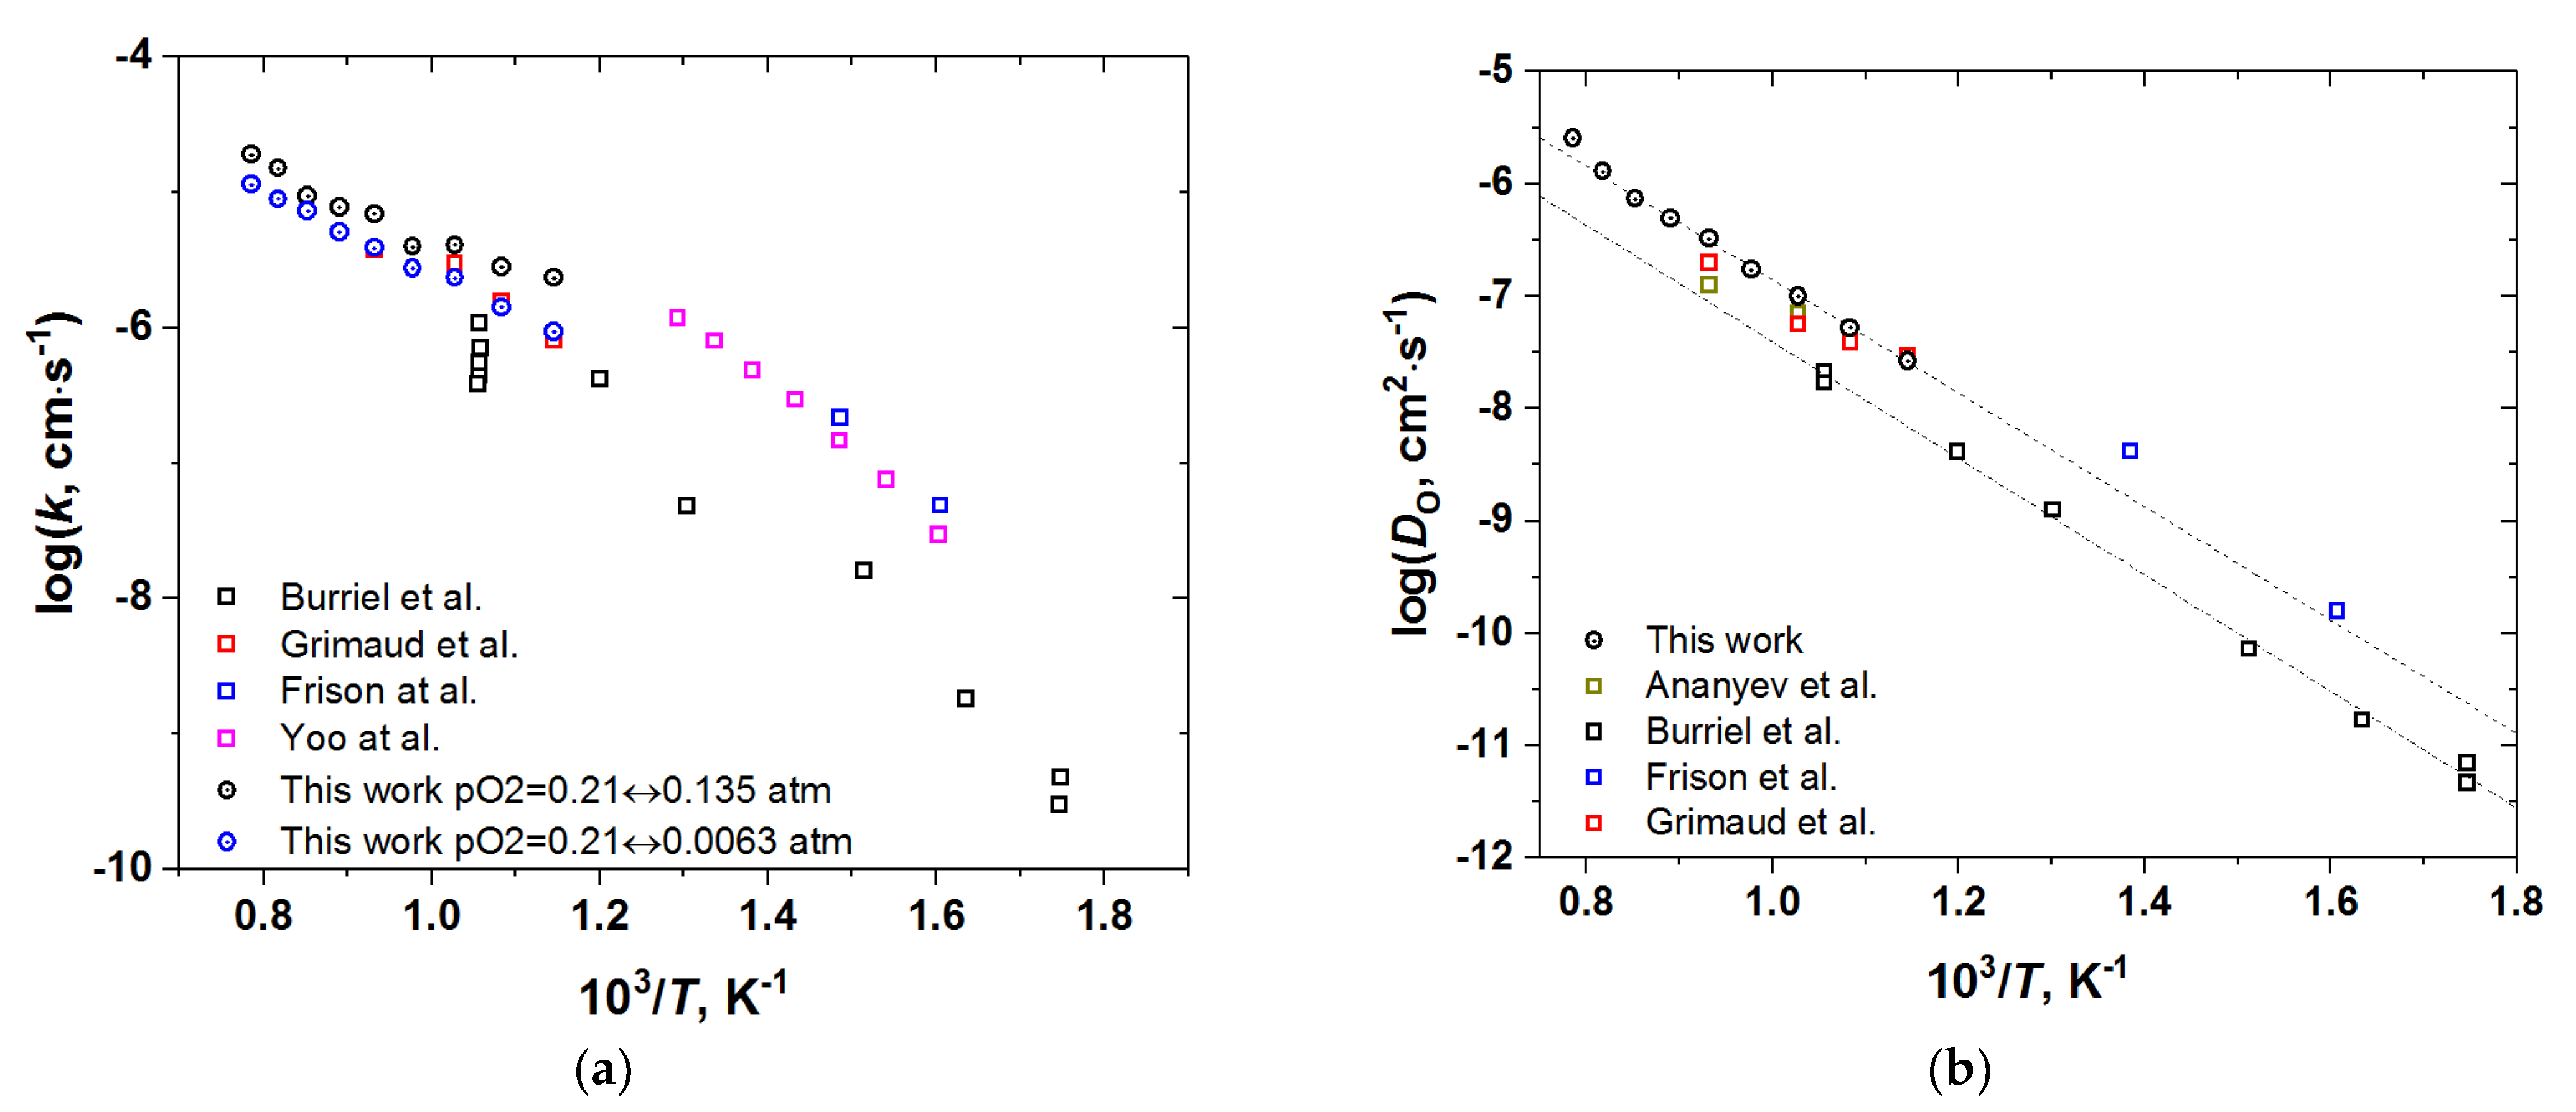
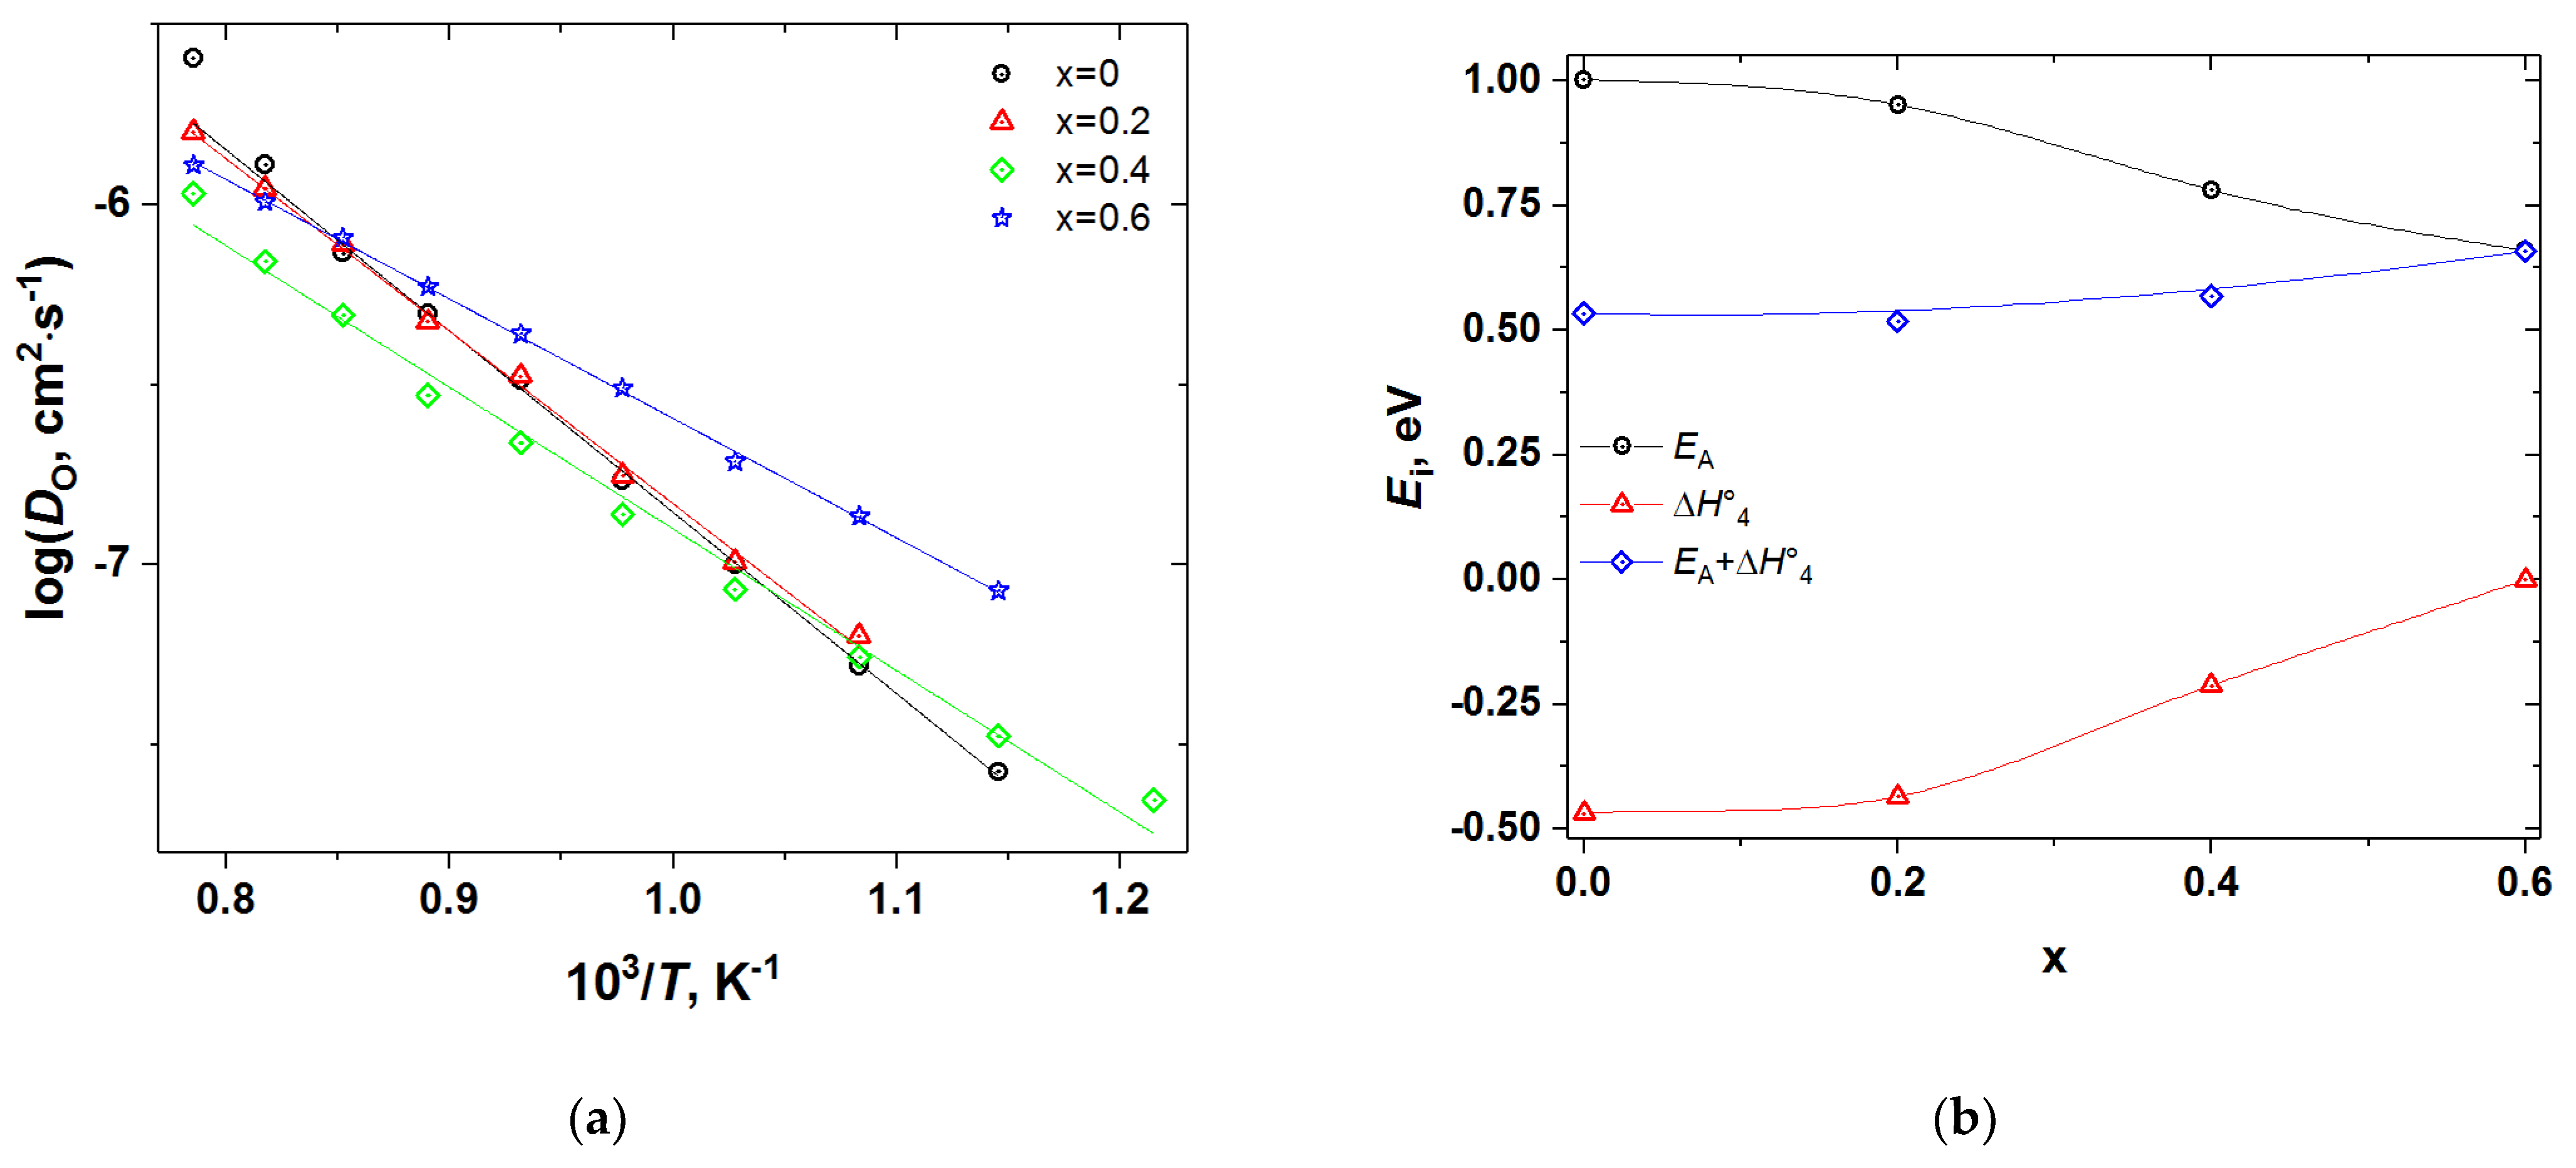
3.3. Oxygen Diffusion and Surface Exchange
4. Conclusions
Supplementary Materials
Author Contributions
Funding
Institutional Review Board Statement
Informed Consent Statement
Data Availability Statement
Conflicts of Interest
References
- Taskin, A.A.; Lavrov, A.N.; Ando, Y. Fast oxygen diffusion in A-site ordered perovskites. Prog. Solid State Chem. 2007, 35, 481–490. [Google Scholar] [CrossRef]
- Zhang, K.; Ge, L.; Ran, R.; Shao, Z.; Liu, S. Synthesis, characterization and evaluation of cation-ordered LnBaCo2O5+δ as materials of oxygen permeation membranes and cathodes of SOFCs. Acta Mater. 2008, 56, 4876–4889. [Google Scholar] [CrossRef]
- Kim, J.P.; Pyo, D.W.; Magnone, E.; Park, J.H. Preparation and Oxygen Permeability of ReBaCo2O5+δ (Re = Pr, Nd, Y) Ceramic Membranes. Adv. Mater. Res. 2012, 560–561, 959–964. [Google Scholar] [CrossRef]
- Yoo, C.-Y.; Joo, J.H.; Lee, H.J.; Yu, J.H. The effects of Fe-substitution on the crystal structure and oxygen permeability of PrBaCo2O5+δ. Mater. Lett. 2013, 108, 65–68. [Google Scholar] [CrossRef]
- Kim, G.; Wang, S.; Jacobson, A.J.; Reimus, L.; Brodersen, P.; Mims, C.A. Rapid oxygen ion diffusion and surface exchange kinetics in PrBaCo2O5+x with a perovskite related structure and ordered A cations. J. Mater. Chem. 2007, 17, 2500–2505. [Google Scholar] [CrossRef]
- Burriel, M.; Peña-Martínez, J.; Chater, R.J.; Fearn, S.; Berenov, A.V.; Skinner, S.J.; Kilner, J.A. Anisotropic oxygen ion diffusion in layered PrBaCo2O5+δ. Chem. Mater. 2012, 24, 613–621. [Google Scholar] [CrossRef]
- Grimaud, A.; Bassat, J.M.; Mauvy, F.; Pollet, M.; Wattiaux, A.; Marrony, M.; Grenier, J.C. Oxygen reduction reaction of PrBaCo2−xFexO5+δ compounds as H+-SOFC cathodes: Correlation with physical properties. J. Mater. Chem. A 2014, 2, 3594–3604. [Google Scholar] [CrossRef]
- Frison, R.; Portier, S.; Martin, M.; Conder, K. Study of oxygen tracer diffusion in PrBaCo2O5.74 by SIMS. Nucl. Instrum. Methods Phys. Res. Sect. B Beam Interact. Mater. At. 2012, 273, 142–145. [Google Scholar] [CrossRef]
- Yoo, C.-Y.; Boukamp, B.A.; Bouwmeester, H.J.M. Oxygen surface exchange kinetics on PrBaCo2O5+δ. Solid State Ion. 2014, 262, 668–671. [Google Scholar] [CrossRef]
- Ananyev, M.V.; Eremin, V.A.; Tsvetkov, D.S.; Porotnikova, N.M.; Farlenkov, A.S.; Zuev, A.Y.; Fetisov, A.V.; Kurumchin, E.K. Oxygen isotope exchange and diffusion in LnBaCo2O6−δ (Ln=Pr, Sm, Gd) with double perovskite structure. Solid State Ion. 2017, 304, 96–106. [Google Scholar] [CrossRef]
- Tsvetkov, D.S.; Ananjev, M.V.; Eremin, V.A.; Zuev, A.Y.; Kurumchin, E.K. Oxygen nonstoichiometry, defect structure and oxygen diffusion in the double perovskite GdBaCo2O6−δ. Dalton Trans. 2014, 43, 15937–15943. [Google Scholar] [CrossRef] [Green Version]
- Tarancón, A.; Skinner, S.J.; Chater, R.J.; Hernández-Ramírez, F.; Kilner, J.A. Layered perovskites as promising cathodes for intermediate temperature solid oxide fuel cells. J. Mater. Chem. 2007, 17, 3175–3181. [Google Scholar] [CrossRef]
- Choi, M.B.; Jeon, S.Y.; Lee, J.S.; Hwang, H.J.; Song, S.J. Chemical diffusivity and ionic conductivity of GdBaCo2O5+δ. J. Power Sources 2010, 195, 1059–1064. [Google Scholar] [CrossRef]
- Hermet, J.; Geneste, G.; Dezanneau, G. Molecular dynamics simulations of oxygen diffusion in GdBaCo2O5.5. Appl. Phys. Lett. 2010, 97, 174102. [Google Scholar] [CrossRef] [Green Version]
- Cox-Galhotra, R.A.; Huq, A.; Hodges, J.P.; Yu, C.; Wang, X.; Gong, W.; Jacobson, A.J.; McIntosh, S. An in-situ neutron diffraction study of the crystal structure of PrBaCo2O5+δ at high temperature and controlled oxygen partial pressure. Solid State Ion. 2013, 249–250, 34–40. [Google Scholar] [CrossRef]
- Seymour, I.D.; Tarancón, A.; Chroneos, A.; Parfitt, D.; Kilner, J.A.; Grimes, R.W. Anisotropic oxygen diffusion in PrBaCo2O5.5 double perovskites. Solid State Ion. 2012, 216, 41–43. [Google Scholar] [CrossRef]
- Kim, I.; Choi, M. First-Principles Study of Anisotropic Oxygen Diffusion in PrBaCo2O5.5. ACS Omega 2019, 4, 10960–10964. [Google Scholar] [CrossRef] [Green Version]
- Parfitt, D.; Chroneos, A.; Tarancón, A.; Kilner, J.A. Oxygen ion diffusion in cation ordered/disordered GdBaCo2O5+δ. J. Mater. Chem. 2011, 21, 2183–2186. [Google Scholar] [CrossRef]
- Hu, Y.; Hernandez, O.; Broux, T.; Bahout, M.; Hermet, J.; Ottochian, A.; Ritter, C.; Geneste, G.; Dezanneau, G. Oxygen diffusion mechanism in the mixed ion-electron conductor NdBaCo2O5+x. J. Mater. Chem. 2012, 22, 18744–18747. [Google Scholar] [CrossRef]
- Chen, C.; Chen, D.; Ciucci, F. A molecular dynamics study of oxygen ion diffusion in A-site ordered perovskite PrBaCo2O5.5: Data mining the oxygen trajectories. PCCP 2015, 17, 7831–7837. [Google Scholar] [CrossRef]
- Akande, S.O.; Boulfrad, S.; Schwingenschlögl, U. Intrinsic defect processes and O migration in PrBa(Co/Fe)2O5.5. J. Mater. Chem. A 2016, 4, 3560–3564. [Google Scholar] [CrossRef]
- Chen, Y.-C.; Yashima, M.; Peña-Martínez, J.; Kilner, J.A. Experimental Visualization of the Diffusional Pathway of Oxide Ions in a Layered Perovskite-type Cobaltite PrBaCo2O5+δ. Chem. Mater. 2013, 25, 2638–2641. [Google Scholar] [CrossRef]
- Tsvetkov, D.S.; Ivanov, I.L.; Zuev, A.Y. Oxygen nonstoichiometry, crystal and defect structure of the double perovskite GdBaCo1.8Fe0.2O6−δ. Solid State Ion. 2012, 218, 13–17. [Google Scholar] [CrossRef]
- Politov, B.V.; Suntsov, A.Y.; Leonidov, I.A.; Patrakeev, M.V.; Kozhevnikov, V.L. High-temperature defect thermodynamics of nickel substituted double-perovskite cobaltite PrBaCo2−xNixO6−δ (x = 0.2). J. Al. Compd. 2017, 727, 778–784. [Google Scholar] [CrossRef]
- Suntsov, A.Y.; Leonidov, I.A.; Patrakeev, M.V.; Kozhevnikov, V.L. Defect formation in double perovskites PrBaCo2−xCuxO5+δ at elevated temperatures. Solid State Ion. 2015, 274, 17–23. [Google Scholar] [CrossRef]
- Marshenya, S.N.; Politov, B.V.; Suntsov, A.Y.; Leonidov, I.A.; Petrova, S.A.; Patrakeev, M.V.; Kozhevnikov, V.L. Improved structural stability, electron transport and defect formation in PrBaCo2–xAlxO6–δ. J. Al. Compd. 2018, 767, 1041–1047. [Google Scholar] [CrossRef]
- Antipinskaya, E.A.; Marshenya, S.N.; Politov, B.V.; Suntsov, A.Y. The interplay of oxygen non-stoichiometry and defects in Ga-doped layered cobaltites. Solid State Ion. 2019, 339, 115002. [Google Scholar] [CrossRef]
- Vøllestad, E.; Schrade, M.; Segalini, J.; Strandbakke, R.; Norby, T. Relating defect chemistry and electronic transport in the double perovskite Ba1−xGd0.8La0.2+xCo2O6−δ (BGLC). J. Mater. Chem. A 2017, 5, 15743–15751. [Google Scholar] [CrossRef] [Green Version]
- Tai, L.W.; Nasrallah, M.M.; Anderson, H.U.; Sparlin, D.M.; Sehlin, S.R. Structure and electrical properties of La1−xSrxCo1−yFeyO3. Part 1. The system La0.8Sr0.2Co1−yFeyO3. Solid State Ion. 1995, 76, 259–271. [Google Scholar] [CrossRef]
- Klyndyuk, A.I.; Chizhova, E.A.; Kharytonau, D.S.; Medvedev, D.A. Layered Oxygen-Deficient Double Perovskites as Promising Cathode Materials for Solid Oxide Fuel Cells. Materials 2022, 15, 141. [Google Scholar] [CrossRef]
- Tsvetkov, D.S.; Ivanov, I.L.; Urusov, I.V.; Zuev, A.Y. Thermodynamics of formation of double perovskites GdBaCo2−xMxO6−δ (M = Fe, Mn; x = 0, 0.2). Thermochim. Acta 2011, 519, 12–15. [Google Scholar] [CrossRef]
- Tsvetkov, D.S.; Ivanov, I.L.; Malyshkin, D.A.; Sednev, A.L.; Sereda, V.V.; Zuev, A.Y. Double perovskites REBaCo2−xMxO6−δ (RE = La, Pr, Nd, Eu, Gd, Y.; M = Fe, Mn) as energy-related materials: An overview. Pure Appl. Chem. 2019, 91, 923–940. [Google Scholar] [CrossRef]
- Kim, B.-J.; Fabbri, E.; Castelli, I.E.; Borlaf, M.; Graule, T.; Nachtegaal, M.; Schmidt, T.J. Fe-Doping in Double Perovskite PrBaCo2(1−x)Fe2xO6−δ: Insights into Structural and Electronic Effects to Enhance Oxygen Evolution Catalyst Stability. Catalysts 2019, 9, 263. [Google Scholar] [CrossRef] [Green Version]
- Cherepanov, V.A.; Aksenova, T.V.; Gavrilova, L.Y.; Mikhaleva, K.N. Structure, nonstoichiometry and thermal expansion of the NdBa(Co,Fe)2O5+δ layered perovskite. Solid State Ion. 2011, 188, 53–57. [Google Scholar] [CrossRef]
- Den Otter, M.W.; van der Haar, L.M.; Bouwmeester, H.J.M. Numerical evaluation of eigenvalues of the sheet diffusion problem in the surface/diffusion mixed regime. Solid State Ion. 2000, 134, 259–264. [Google Scholar] [CrossRef]
- Niedrig, C.; Wagner, S.F.; Menesklou, W.; Baumann, S.; Ivers-Tiffée, E. Oxygen equilibration kinetics of mixed-conducting perovskites BSCF, LSCF, and PSCF at 900 °C determined by electrical conductivity relaxation. Solid State Ion. 2015, 283, 30–37. [Google Scholar] [CrossRef]
- Van der Haar, L.M.; den Otter, M.W.; Morskate, M.; Bouwmeester, H.J.M.; Verweij, H. Chemical Diffusion and Oxygen Surface Transfer of La1−xSrxCoO3−δ Studied with Electrical Conductivity Relaxation. J. Electrochem. Soc. 2002, 149, J41. [Google Scholar] [CrossRef]
- Zuev, A.Y.; Tsvetkov, D.S. Conventional methods for measurements of chemo-mechanical coupling. In Electro-Chemo-Mechanics of Solids; Bishop, S.R., Perry, N., Marrocchelli, D., Sheldon, B., Eds.; Springer International Publishing: Berlin/Heidelberg, Germany, 2017; pp. 5–35. [Google Scholar]
- Tsvetkov, D.S.; Ivanov, I.L.; Malyshkin, D.A.; Zuev, A.Y. Oxygen content, crystal structure and chemical expansion of PrBaCo2−xFexO6−δ double perovskites. Dalton Trans. 2014, 43, 11862–11866. [Google Scholar] [CrossRef]
- Zou, J.; Park, J.; Kwak, B.; Yoon, H.; Chung, J. Effect of Fe doping on PrBaCo2O5+δ as cathode for intermediate-temperature solid oxide fuel cells. Solid State Ion. 2012, 206, 112–119. [Google Scholar] [CrossRef]
- Sereda, V.V.; Malyshkin, D.A.; Ivanov, I.L.; Tsvetkov, D.S.; Zuev, A.Y.; Maignan, A. Redox Thermochemistry, Thermodynamics, and Solar Energy Conversion and Storage Capability of Some Double Perovskite Cobaltites. Inorg. Chem. 2021, 60, 18141–18153. [Google Scholar] [CrossRef]
- Mizusaki, J.; Yoshihiro, M.; Yamauchi, S.; Fueki, K. Nonstoichiometry and defect structure of the perovskite-type oxides La1−xSrxFeO3−δ. J. Solid State Chem. 1985, 58, 257–266. [Google Scholar] [CrossRef]
- Leonidov, I.A.; Markov, A.A.; Zavyalov, M.A.; Merkulov, O.V.; Shalaeva, E.V.; Nikitin, S.S.; Tsipis, E.V.; Patrakeev, M.V. Structural Features and Defect Equilibrium in Cubic PrBa1-xSrxFe2O6−δ. Materials 2022, 15, 4390. [Google Scholar] [CrossRef] [PubMed]
- Kopcewicz, M.; Khalyavin, D.D.; Troyanchuk, I.O.; Szymczak, H.; Szymczak, R.; Logvinovich, D.J.; Naumovich, E.N. Effect of iron doping on the properties of TbBaCo2O5.5 layered perovskite. J. Appl. Phys. 2003, 93, 479–486. [Google Scholar] [CrossRef]
- Kopcewicz, M.; Khalyavin, D.D.; Troyanchuk, I.O.; Sazonov, A.P.; Kasper, N.V.; Pushkarev, N.V.; Szymczak, H.; Szymczak, R. Instability of oxygen vacancy ordering at the metal–insulator transition in the iron-doped TbBaCo2O5.5 layered perovskite. J. Phys. Condens. Matter 2002, 14, 9007. [Google Scholar] [CrossRef]
- Arnold, M.; Xu, Q.; Tichelaar, F.D.; Feldhoff, A. Local Charge Disproportion in a High-Performance Perovskite. Chem. Mater. 2009, 21, 635–640. [Google Scholar] [CrossRef]
- Malyshkin, D.A.; Novikov, A.Y.; Sereda, V.V.; Ivanov, I.L.; Tsvetkov, D.S.; Zuev, A.Y. In Situ and ex Situ Study of Cubic La0.5Ba0.5CoO3−δ to Double Perovskite LaBaCo2O6−δ Transition and Formation of Domain Textured Phases with Fast Oxygen Exchange Capability. Inorg. Chem. 2018, 57, 12409–12416. [Google Scholar] [CrossRef]
- Hoedl, M.F.; Gryaznov, D.; Merkle, R.; Kotomin, E.A.; Maier, J. Interdependence of Oxygenation and Hydration in Mixed-Conducting (Ba,Sr)FeO3−δ Perovskites Studied by Density Functional Theory. J. Phys. Chem. C 2020, 124, 11780–11789. [Google Scholar] [CrossRef]
- Zohourian, R.; Merkle, R.; Maier, J. Bulk Defect Chemistry of PCFC Cathode Materials: Discussion of Defect Interactions. ECS Trans. 2017, 77, 133. [Google Scholar] [CrossRef]
- Kharton, V.V.; Patrakeev, M.V.; Tsipis, E.V.; Avdeev, M.; Naumovich, E.N.; Anikina, P.V.; Waerenborgh, J.C. Oxygen nonstoichiometry, chemical expansion, mixed conductivity, and anodic behavior of Mo-substituted Sr3Fe2O7-δ. Solid State Ion. 2010, 181, 1052–1063. [Google Scholar] [CrossRef]
- Karen, P. Synthesis and equilibrium oxygen nonstoichiometry of PrBaFe2O5+w. J. Solid State Chem. 2021, 299, 122147. [Google Scholar] [CrossRef]


| No. | Reaction | Sample * | |||||||
|---|---|---|---|---|---|---|---|---|---|
| PBC | PBCF2 | PBCF4 | PBCF6 | ||||||
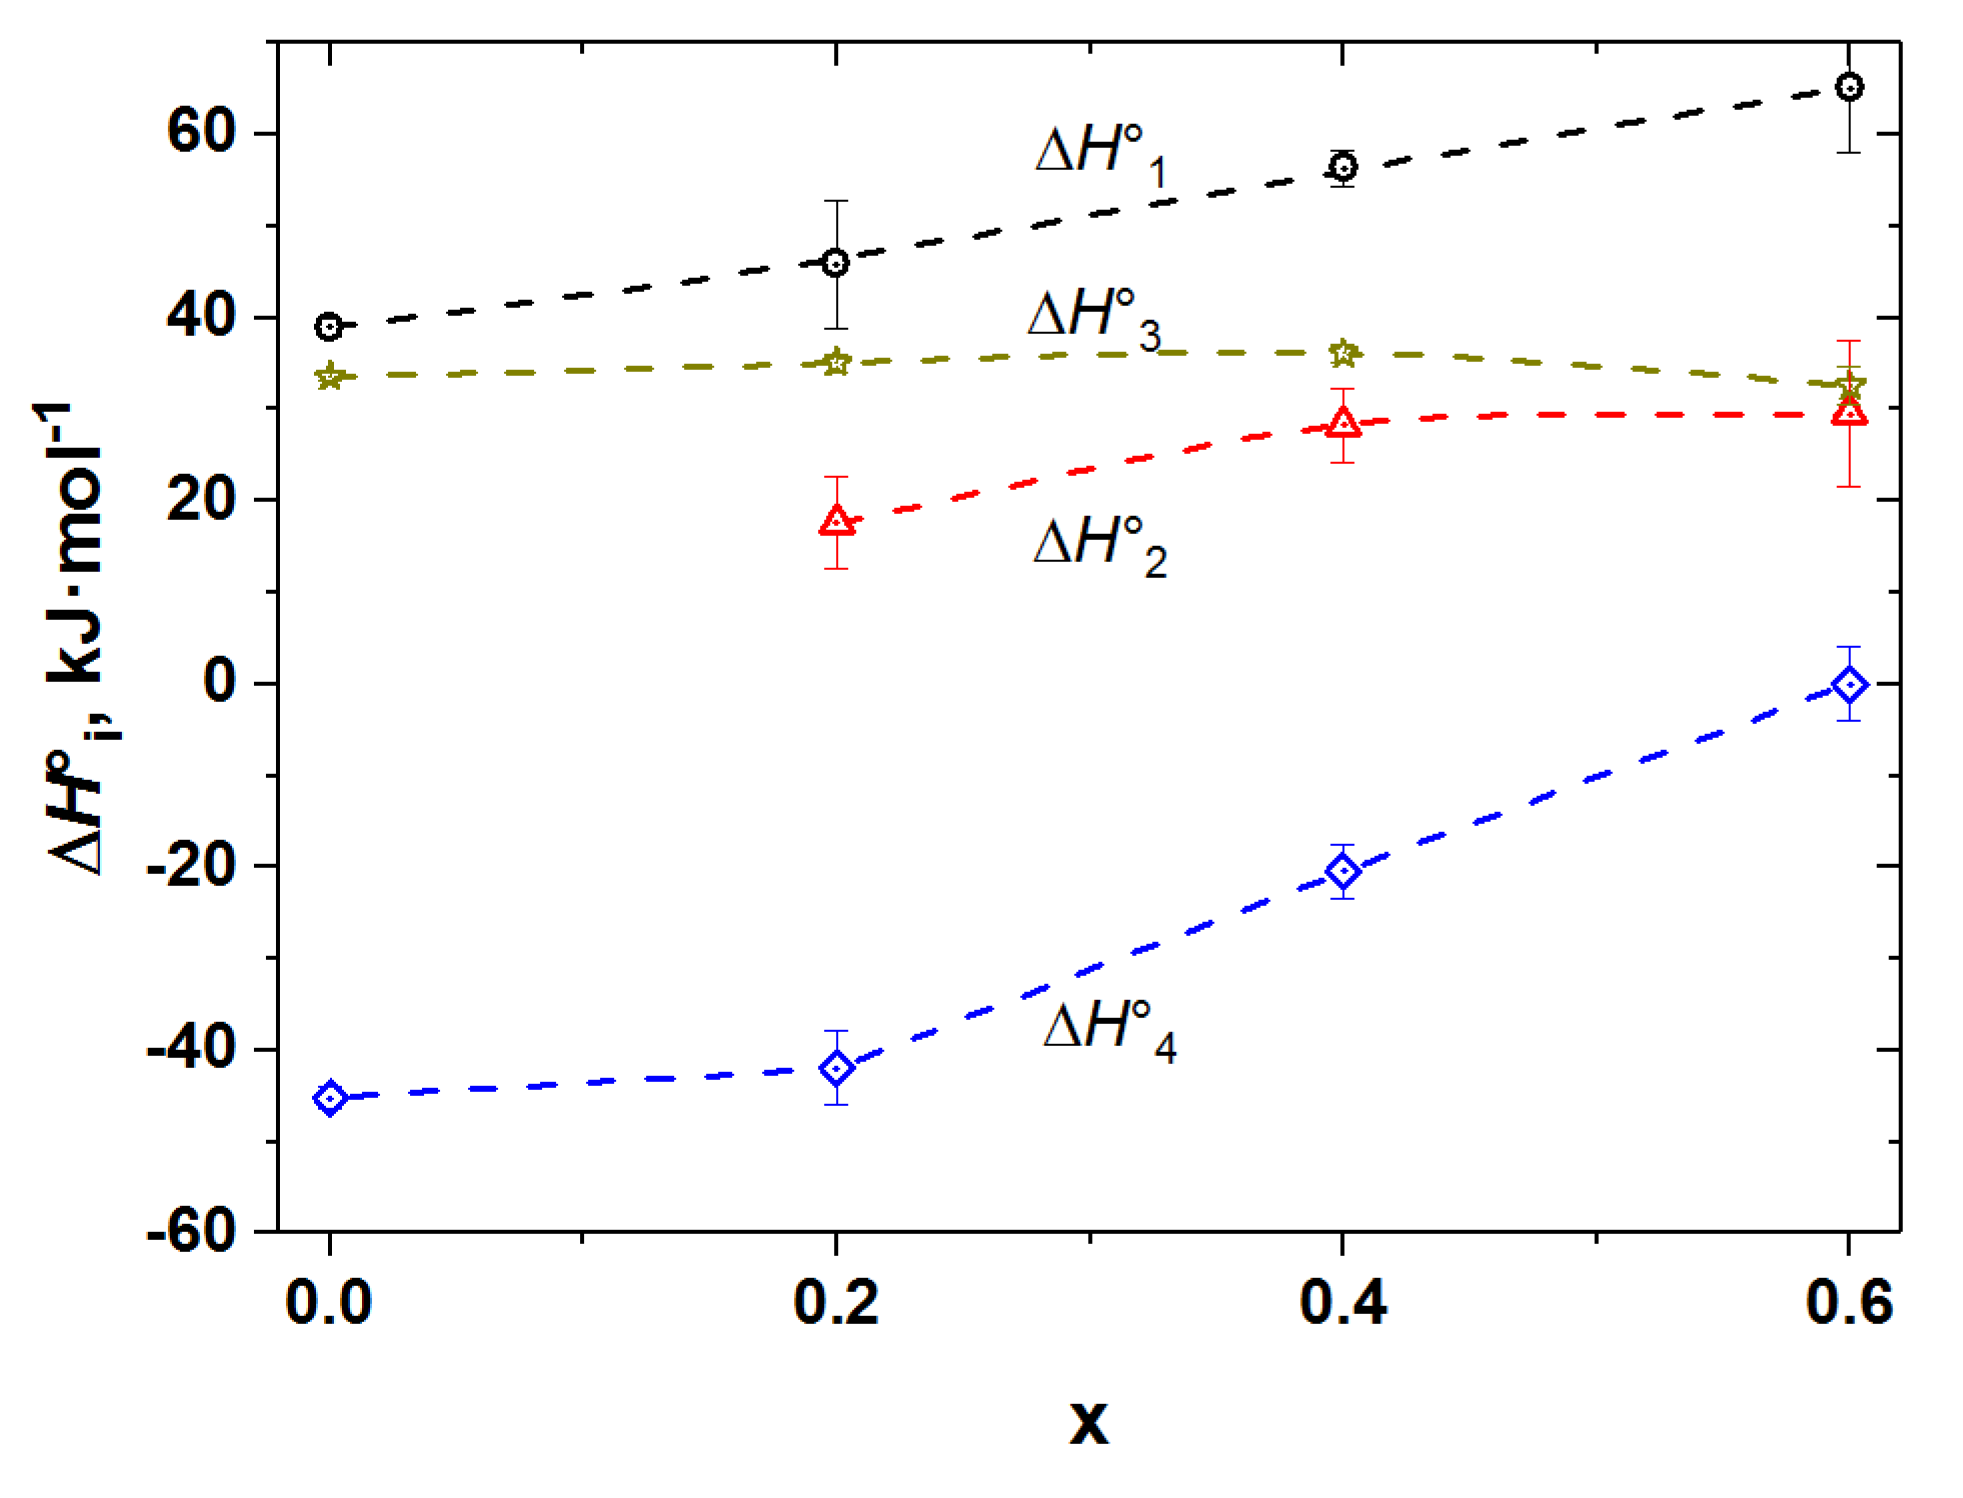
| 1. | 39 ±1 | 45 ±1 | 50 ±2 | 53 ±3 | 51 ±1 | 48 ±1 | 61 ±5 | 36 ±6 | |
| 2. | −45 ±1 | 0 | −42 ±4 | 0 | −18 ±5 | 0 | 0 | 0 | |
| 3. | 33.6 ±0.4 | 0 | 36 ±1 | 0 | 37 ±1 | 0 | 34 ±3 | 0 | |
| R2 | 0.995 | 0.995 | 0.985 | 0.975 | |||||
| No. | Reaction | Sample * | |||||||
|---|---|---|---|---|---|---|---|---|---|
| PBC | PBCF2 | PBCF4 | PBCF6 | ||||||
| 1. | 39 ±1 | 45 ±1 | 46 ±7 | 52 ±3 | 56 ±2 | 53 ±1 | 65 ±7 | 45 ±2 | |
| 2. | - | - | 18 ±5 | 0 ** | 28 ±4 | 0 ** | 30 ±8 | 0 ** | |
| 3. | 33.6 ±0.4 | 0 ** | 35 ±1 | 0 ** | 36 ±1 | 0 ** | 33 ±2 | 0 ** | |
| 4. | −45 ±1 | 0 ** | −42 ±4 | 0 ** | −20 ±3 | 0 ** | 0 | 0 ** | |
| 5. | |||||||||
| 6. | *** | - | - | 28 ±10 | 52 ±3 | 28 ±6 | 53 ±1 | 35 ±11 | 45 ±2 |
| α **** | 0 | 0.01 | 0.04 | 0.09 | |||||
| R2 | 0.995 | 0.996 | 0.996 | 0.995 | |||||
Publisher’s Note: MDPI stays neutral with regard to jurisdictional claims in published maps and institutional affiliations. |
© 2022 by the authors. Licensee MDPI, Basel, Switzerland. This article is an open access article distributed under the terms and conditions of the Creative Commons Attribution (CC BY) license (https://creativecommons.org/licenses/by/4.0/).
Share and Cite
Ivanov, I.L.; Zakiryanov, P.O.; Sereda, V.V.; Mazurin, M.O.; Malyshkin, D.A.; Zuev, A.Y.; Tsvetkov, D.S. Nonstoichiometry, Defect Chemistry and Oxygen Transport in Fe-Doped Layered Double Perovskite Cobaltite PrBaCo2−xFexO6−δ (x = 0–0.6) Membrane Materials. Membranes 2022, 12, 1200. https://doi.org/10.3390/membranes12121200
Ivanov IL, Zakiryanov PO, Sereda VV, Mazurin MO, Malyshkin DA, Zuev AY, Tsvetkov DS. Nonstoichiometry, Defect Chemistry and Oxygen Transport in Fe-Doped Layered Double Perovskite Cobaltite PrBaCo2−xFexO6−δ (x = 0–0.6) Membrane Materials. Membranes. 2022; 12(12):1200. https://doi.org/10.3390/membranes12121200
Chicago/Turabian StyleIvanov, Ivan L., Petr O. Zakiryanov, Vladimir V. Sereda, Maxim O. Mazurin, Dmitry A. Malyshkin, Andrey Yu. Zuev, and Dmitry S. Tsvetkov. 2022. "Nonstoichiometry, Defect Chemistry and Oxygen Transport in Fe-Doped Layered Double Perovskite Cobaltite PrBaCo2−xFexO6−δ (x = 0–0.6) Membrane Materials" Membranes 12, no. 12: 1200. https://doi.org/10.3390/membranes12121200