Review

Economics and Energy Consumption of Brackish Water Reverse Osmosis Desalination: Innovations and Impacts of Feedwater Quality

by
Jeffrey L. Pearson
1,
Peter R. Michael
2,
Noreddine Ghaffour
3 and
Thomas M. Missimer
1,*
1
Emergent Technologies Institute, U.A. Whitaker College of Engineering, Florida Gulf Coast University, 16301 Innovation Lane, Fort Myers, FL 33913, USA
2
Electrical Engineering Department, University of South Florida, 4202 East Fowler Avenue, Tampa, FL 33620, USA
3
Water Desalination and Reuse Center (WDRC), Biological and Environmental Science and Engineering Division (BESE), King Abdullah University of Science and Technology (KAUST), Thuwal 23955-6900, Saudi Arabia
*
Author to whom correspondence should be addressed.
Membranes 2021, 11(8), 616; https://doi.org/10.3390/membranes11080616
Submission received: 15 July 2021 / Revised: 6 August 2021 / Accepted: 10 August 2021 / Published: 12 August 2021

Abstract

:
Brackish water desalination, using the reverse osmosis (BWRO) process, has become common in global regions, where vast reserves of brackish groundwater are found (e.g., the United States, North Africa). A literature survey and detailed analyses of several BWRO facilities in Florida have revealed some interesting and valuable information on the costs and energy use. Depending on the capacity, water quality, and additional scope items, the capital cost (CAPEX) ranges from USD 500 to USD 2947/m3 of the capacity (USD 690–USD 4067/m3 corrected for inflation to 2020). The highest number was associated with the City of Cape Coral North Plant, Florida, which had an expanded project scope. The general range of the operating cost (OPEX) is USD 0.39 to USD 0.66/m3 (cannot be corrected for inflation), for a range of capacities from 10,000 to 70,000 m3/d. The feed-water quality, in the range of 2000 to 6000 mg/L of the total dissolved solids, does not significantly impact the OPEX. There is a significant scaling trend, with OPEX cost reducing as plant capacity increases, but there is considerable scatter based on the pre- and post-treatment complexity. Many BWRO facilities operate with long-term increases in the salinity of the feedwater (groundwater), caused by pumping-induced vertical and horizontal migration of the higher salinity water. Any cost and energy increase that is caused by the higher feed water salinity, can be significantly mitigated by using energy recovery, which is not commonly used in BWRO operations. OPEX in BWRO systems is likely to remain relatively constant, based on the limitation on the plant capacity, caused by the brackish water availability at a given site. Seawater reverse osmosis facilities, with a very large capacity, have a lower OPEX compared to the upper range of BWRO, because of capacity scaling, special electrical energy deals, and process design certainty.

1. Introduction

Many regions of the world have limited freshwater supplies to meet the combined demands of human consumption, agriculture, and industry [1]. Limitations on the development and use of fresh groundwater resources have led to assessments on the use potential of saline groundwater. Saline groundwater occurs in abundance in many global locations [2]. Brackish water, with total dissolved solids (TDS) less than about 8000 mg/L, is used as a water supply source in many regions, such as North Africa, central Saudi Arabia, Jordan, and others, in combination with desalination using the brackish water reverse osmosis process [3,4].
In the United States, there are extensive saline groundwater sources that contain total dissolved solid (TDS) concentrations between 1000 and 10,000 mg/L [5,6,7,8,9,10,11,12,13]. The volume of brackish groundwater that is available for use is quite large and geographically extensive. Saline (brackish) water use by county, in the United States in 2010, is shown in Figure 1. Brackish groundwater is used for irrigation in some regions, when the TDS is under 1500 mg/L, and the vegetation is tolerant to that salinity and the resulting soil salt buildup [14,15,16].
Brackish groundwater is also a source of feedwater for many brackish water reverse osmosis (BWRO) desalination plants that produce potable water [8,12,17,18]. In 2010, nearly 250 municipal membrane treatment facilities operated in the United States, and this grew to 406 in 2018 [18,19] (Figure 2). Of this number, 295 are BWRO facilities with capacities over 95 m3/d [16].
The largest concentration of BWRO desalination plants in the United States occurs in Florida [20,21]. Other states, such as Texas, are planning to add many additional BWRO facilities to those that are currently operating [22]. In Southern Florida, in 2019, 40 BWRO and 3 seawater reverse osmosis desalination plants operated, with a total capacity of 1.09 million m3/d [21] (Figure 3).
Because of the global growth rate in the use of brackish water desalination, there is great interest in the capital and operating costs of these facilities, but few data compilations have been published using actual data. One of the purposes of this research is to provide factual data associated with specific facilities and the methods of operation that contribute to the OPEX costs. The costs associated with a total of seven BWRO desalination water treatment facilities, based on cost per cubic meter (m³) in the Southwest Florida region of the United States of America, have been compiled, to allow detailed examination. In Southwest Florida, fresh source water supplies are becoming increasingly hard to develop because of the explosive population growth, impacts on the environment, pumping-induced saltwater intrusion, competition with the use of public or private wells, limited surface-water resources, and climate change issues. The combined results of these factors reduce the available freshwater resources for use and increase the demand for potable water.
Figure 1. Total saline groundwater use in the United States by county in 2014 [23].
Membranes 11 00616 g001
Figure 2. Number of desalination plants operating in the United States in 2010 [19].
Membranes 11 00616 g002
Figure 3. Locations and capacities of operating BWRO desalination plants in Southern Florida [21].
Membranes 11 00616 g003
In addition to assessing the capital (CAPEX) and operating costs (OPEX) for the Southwest Florida facilities, an evaluation of BWRO costs was made, by comparing these detailed costs with the global data, to construct some basic graphs. These graphs can estimate the unit costs for various capacity plants and the impact of groundwater TDS on these costs. Where possible, the electrical cost was factored into the analysis. Most cost data for BWRO facilities have been estimated, rather than developed from the compilation of actual plant data. The inflation associated with the CAPEX and OPEX of the facilities, has been provided for the US facilities.
Most CAPEX and OPEX cost information on BWRO facilities operating costs is currently estimated using curves, models, or a set of assumptions [24,25,26,27,28,29,30,31,32,33,34,35,36,37,38,39,40,41]. It is a goal of this research to obtain real cost information for the existing BWRO plans, for comparison to the past estimates. Little consideration has been given to innovations in real plant operations, which reduce electrical usage and the overall cost of treatment. Some examples of innovative cost control measures include the blending of raw water with treated water, to raise the pH and to reduce the cost to the consumer; the use of energy recovery devices in BWRO; the blending of the raw water with some limited freshwater, to reduce the salinity of the feedwater (where available); and the implementation of specialized maintenance techniques that extend the lifetime of the membranes, from 5 up to 15 years (e.g., City of Cape Coral).

2. Methods

2.1. Collection and Analysis of Cost Data

Capital and operating costs were obtained from the oldest, continuously operating BWRO desalination system in the United States, located in the City of Cape Coral, Florida. There are two operating plants in the City with capacities of 68,182 and 45,455 m3/d [42]. Data from 5 additional BWRO desalination facilities in Southwest Florida were obtained and compared to the City of Cape Coral facilities. The plants evaluated included the following: the City of Cape Coral Southwest and North BWRO Plants, the City of Fort Myers BWRO Plant, the Lee County Green Meadows and North BWRO Plants, the Pinewoods BWRO Plant, and the Island Water Association BWRO Plant (Figure 3 for locations).
Very detailed data were obtained from the City of Cape Coral plants, which is rare because many utilities, public and private, are reluctant to share financial data. Cost data on the other utilities were less detailed because of the confidential nature of specific data. The monthly operating reports (MORs) for 2017, 2018, and 2019 for each of the seven RO plants were tabulated into Excel spreadsheets based on the information from the Lee County Health Department (Lee County, FL, USA).
Based on the costs for each of the facilities examined through this research, the level of confidence in the cost data should be reasonably accurate depending on various contracts for chemicals, labor rates, electricity costs, security, etc. Replacement of membranes was not considered in the OPEX analysis for the cost of water per USD/m³ since it could be regarded as either an OPEX or CAPEX item, depending on the timing of membrane replacement within the context of plant expansion. It should also be noted that the Lee County Pinewoods BWRO Plant uses a combination with nanofiltration (NF) and the Green Meadows RO Plant uses a combination of ion exchange (IEX) and BWRO technology that treats both fresh and brackish blended water. Therefore, the Lee County costs per m³ of treated water for these two facilities may artificially appear less than others that use strictly BWRO technology plants. The reason for the combination of technologies was due to the desire by Lee County to continue using fresh groundwater that was already permitted for their NF and IEX plants, along with more recently developed saline groundwater resources that require BWRO treatment. This combined use led to a lower overall cost of potable water to the consumers.

2.2. Literature Search on BWRO Costs

BWRO costs were obtained from the literature [43,44], where comparative and useful information could be found. At facilities that contain some unusual components, the impacts of these components are noted in the text. No zero liquid discharge (ZLD) plant costs are not included in this paper, but the technology is discussed.

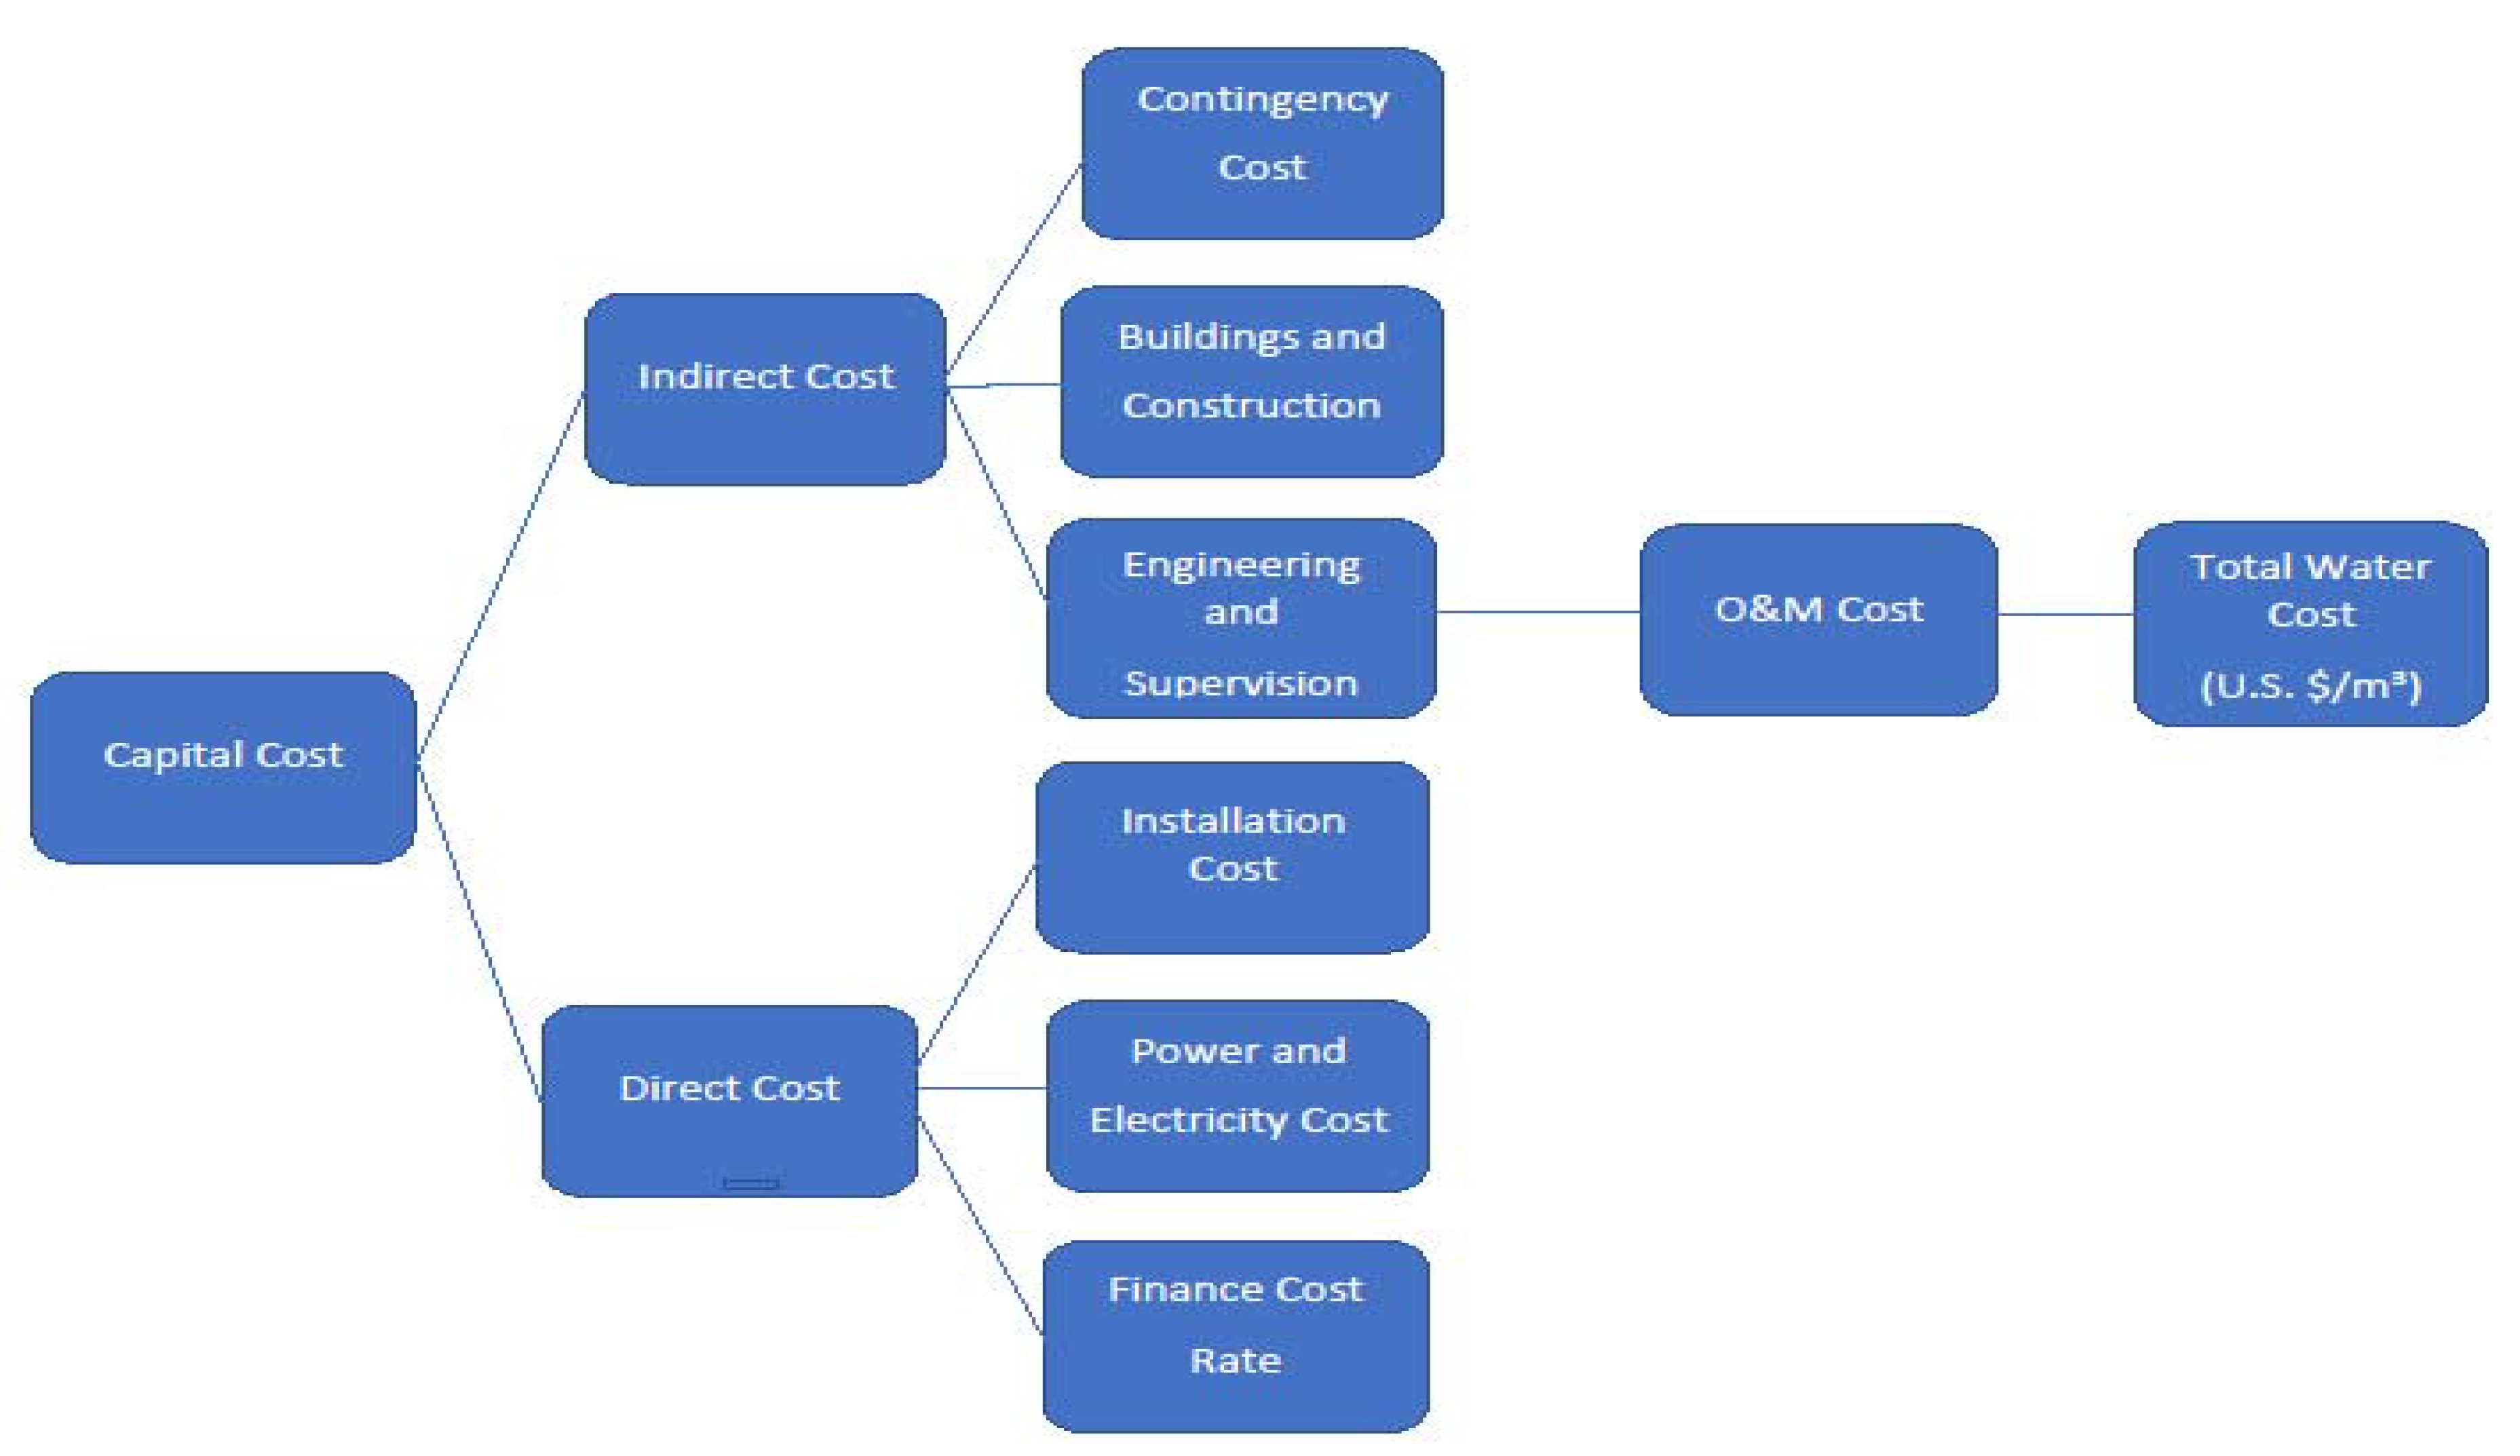
2.3. BWRO Treatment Plant Cost Estimation Methodology

Costs can be classified as CAPEX or investment costs and OPEX, covering operation and maintenance [45]. BWRO plant CAPEX costs typically include land acquisition, all equipment, installation services, design costs, such as civil engineering, mechanical and electrical (M&E) engineering [45]. For most BWRO systems, the O. & M. costs (OPEX) are predominantly controlled by the energy (electricity) and chemical usage in BWRO pretreatment and post-treatment [46], critical component replacement (the BWRO membranes and pumps), water supply, and concentrate disposal charges, and other items, such as labor and servicing [45]. CAPEX and OPEX can be combined to produce the net present value (NPV), which accounts for the cost of financing by assuming that investment of the capital sum elsewhere will produce an annual return quantified by the discount rate [45]. A flow diagram for cost determination is shown in Figure 4.

3. Background

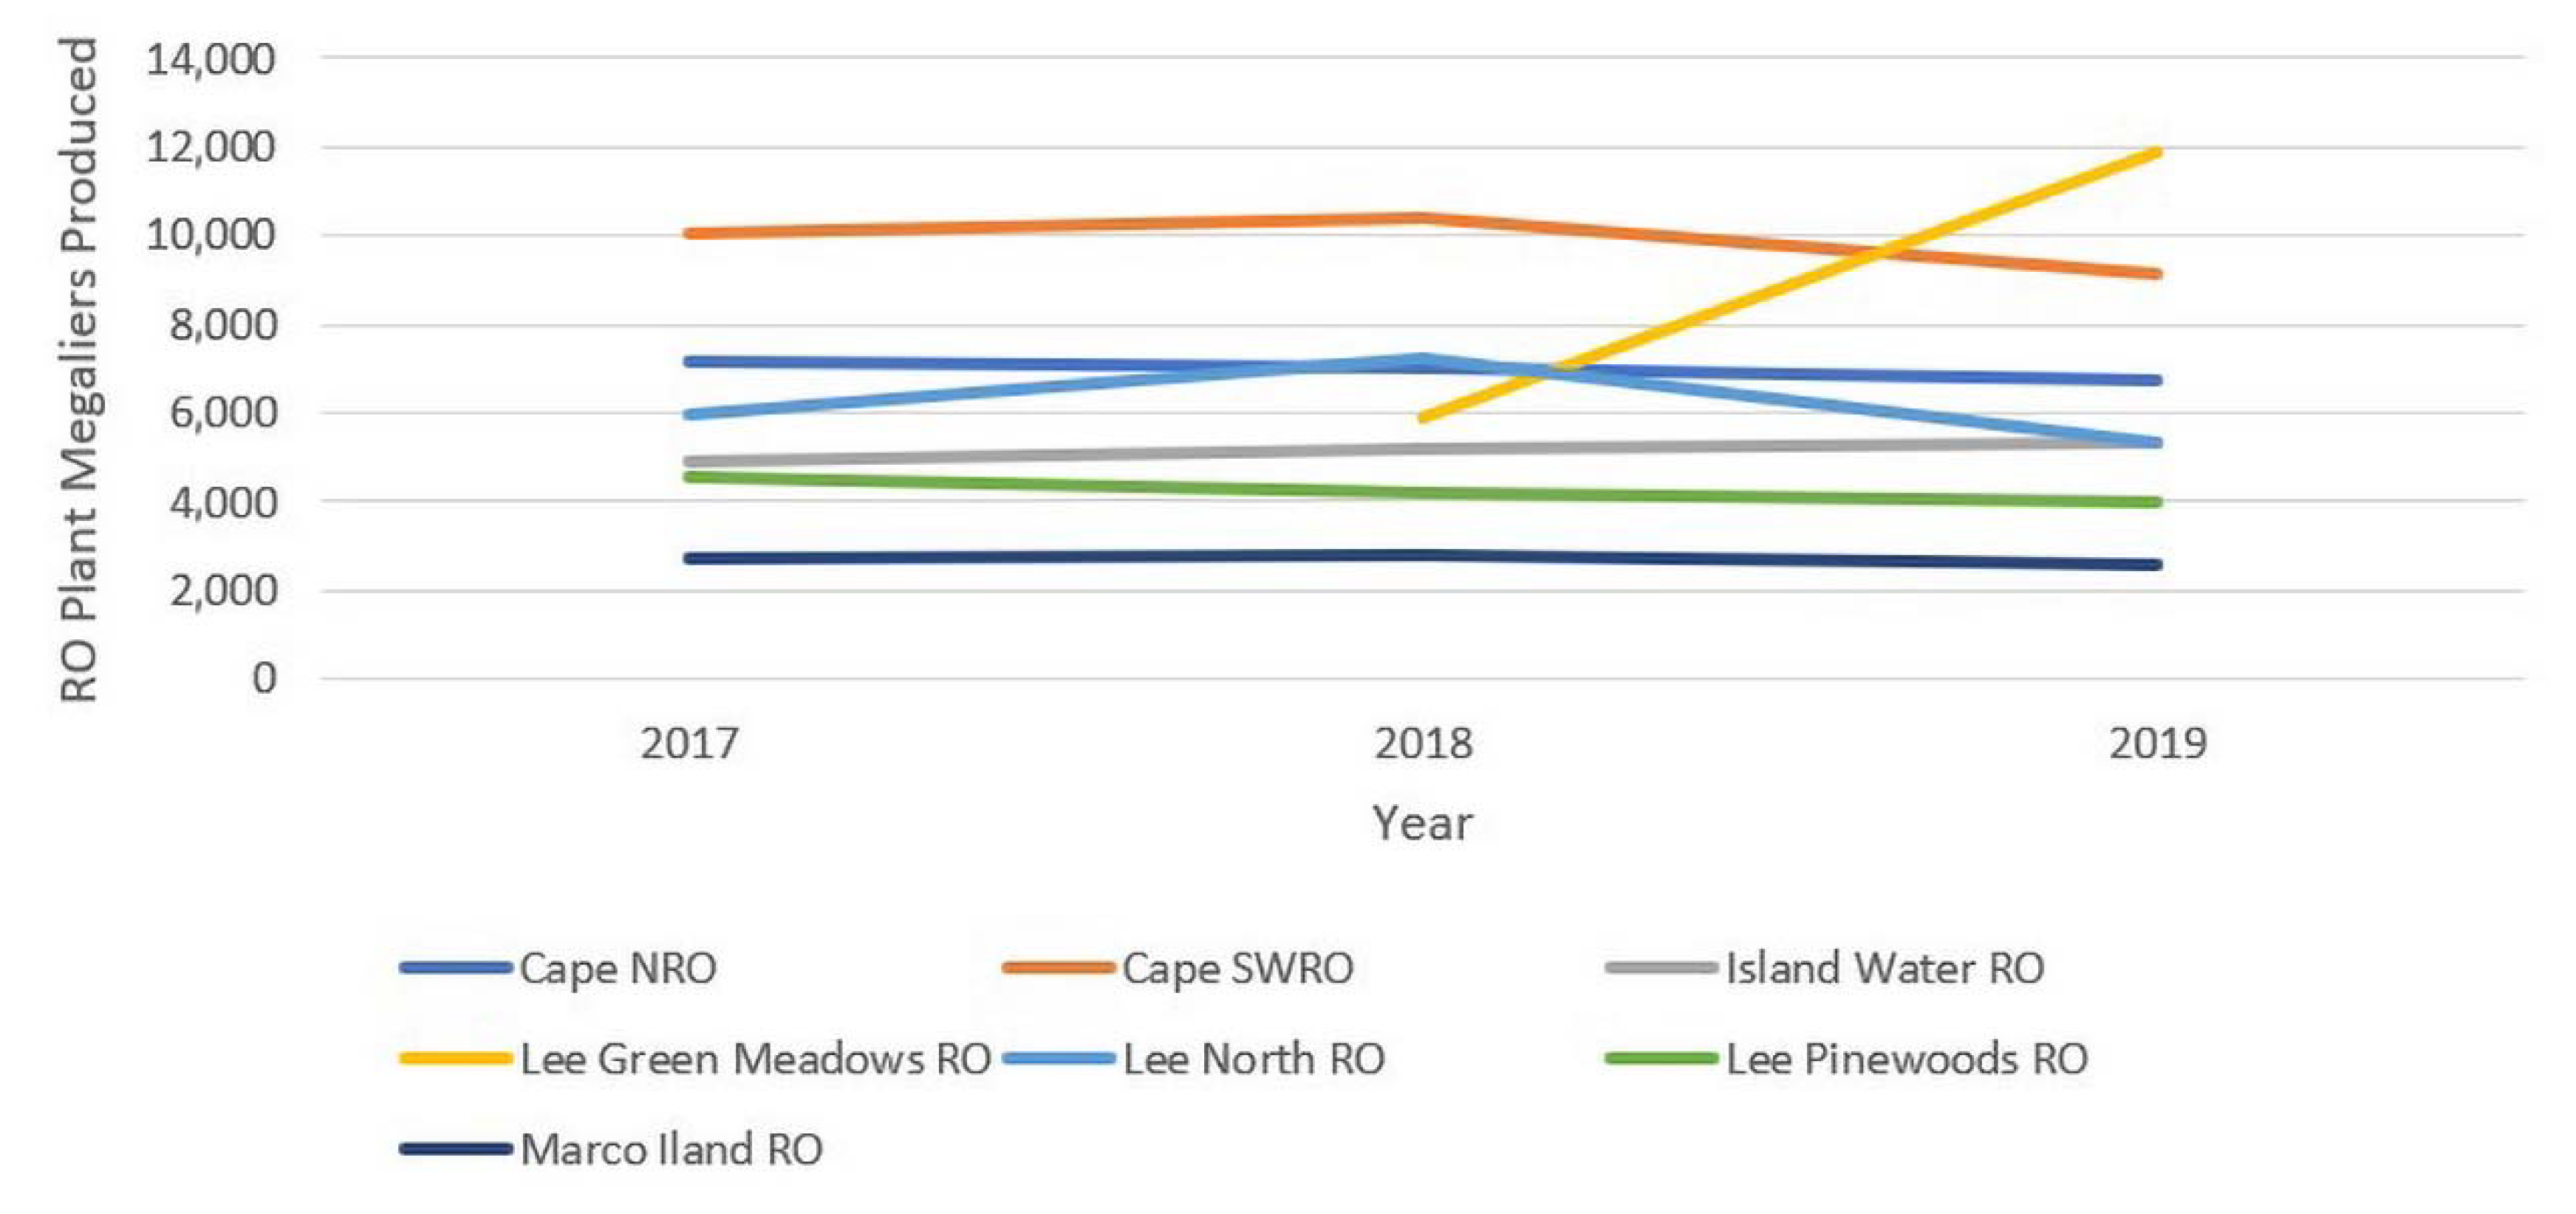
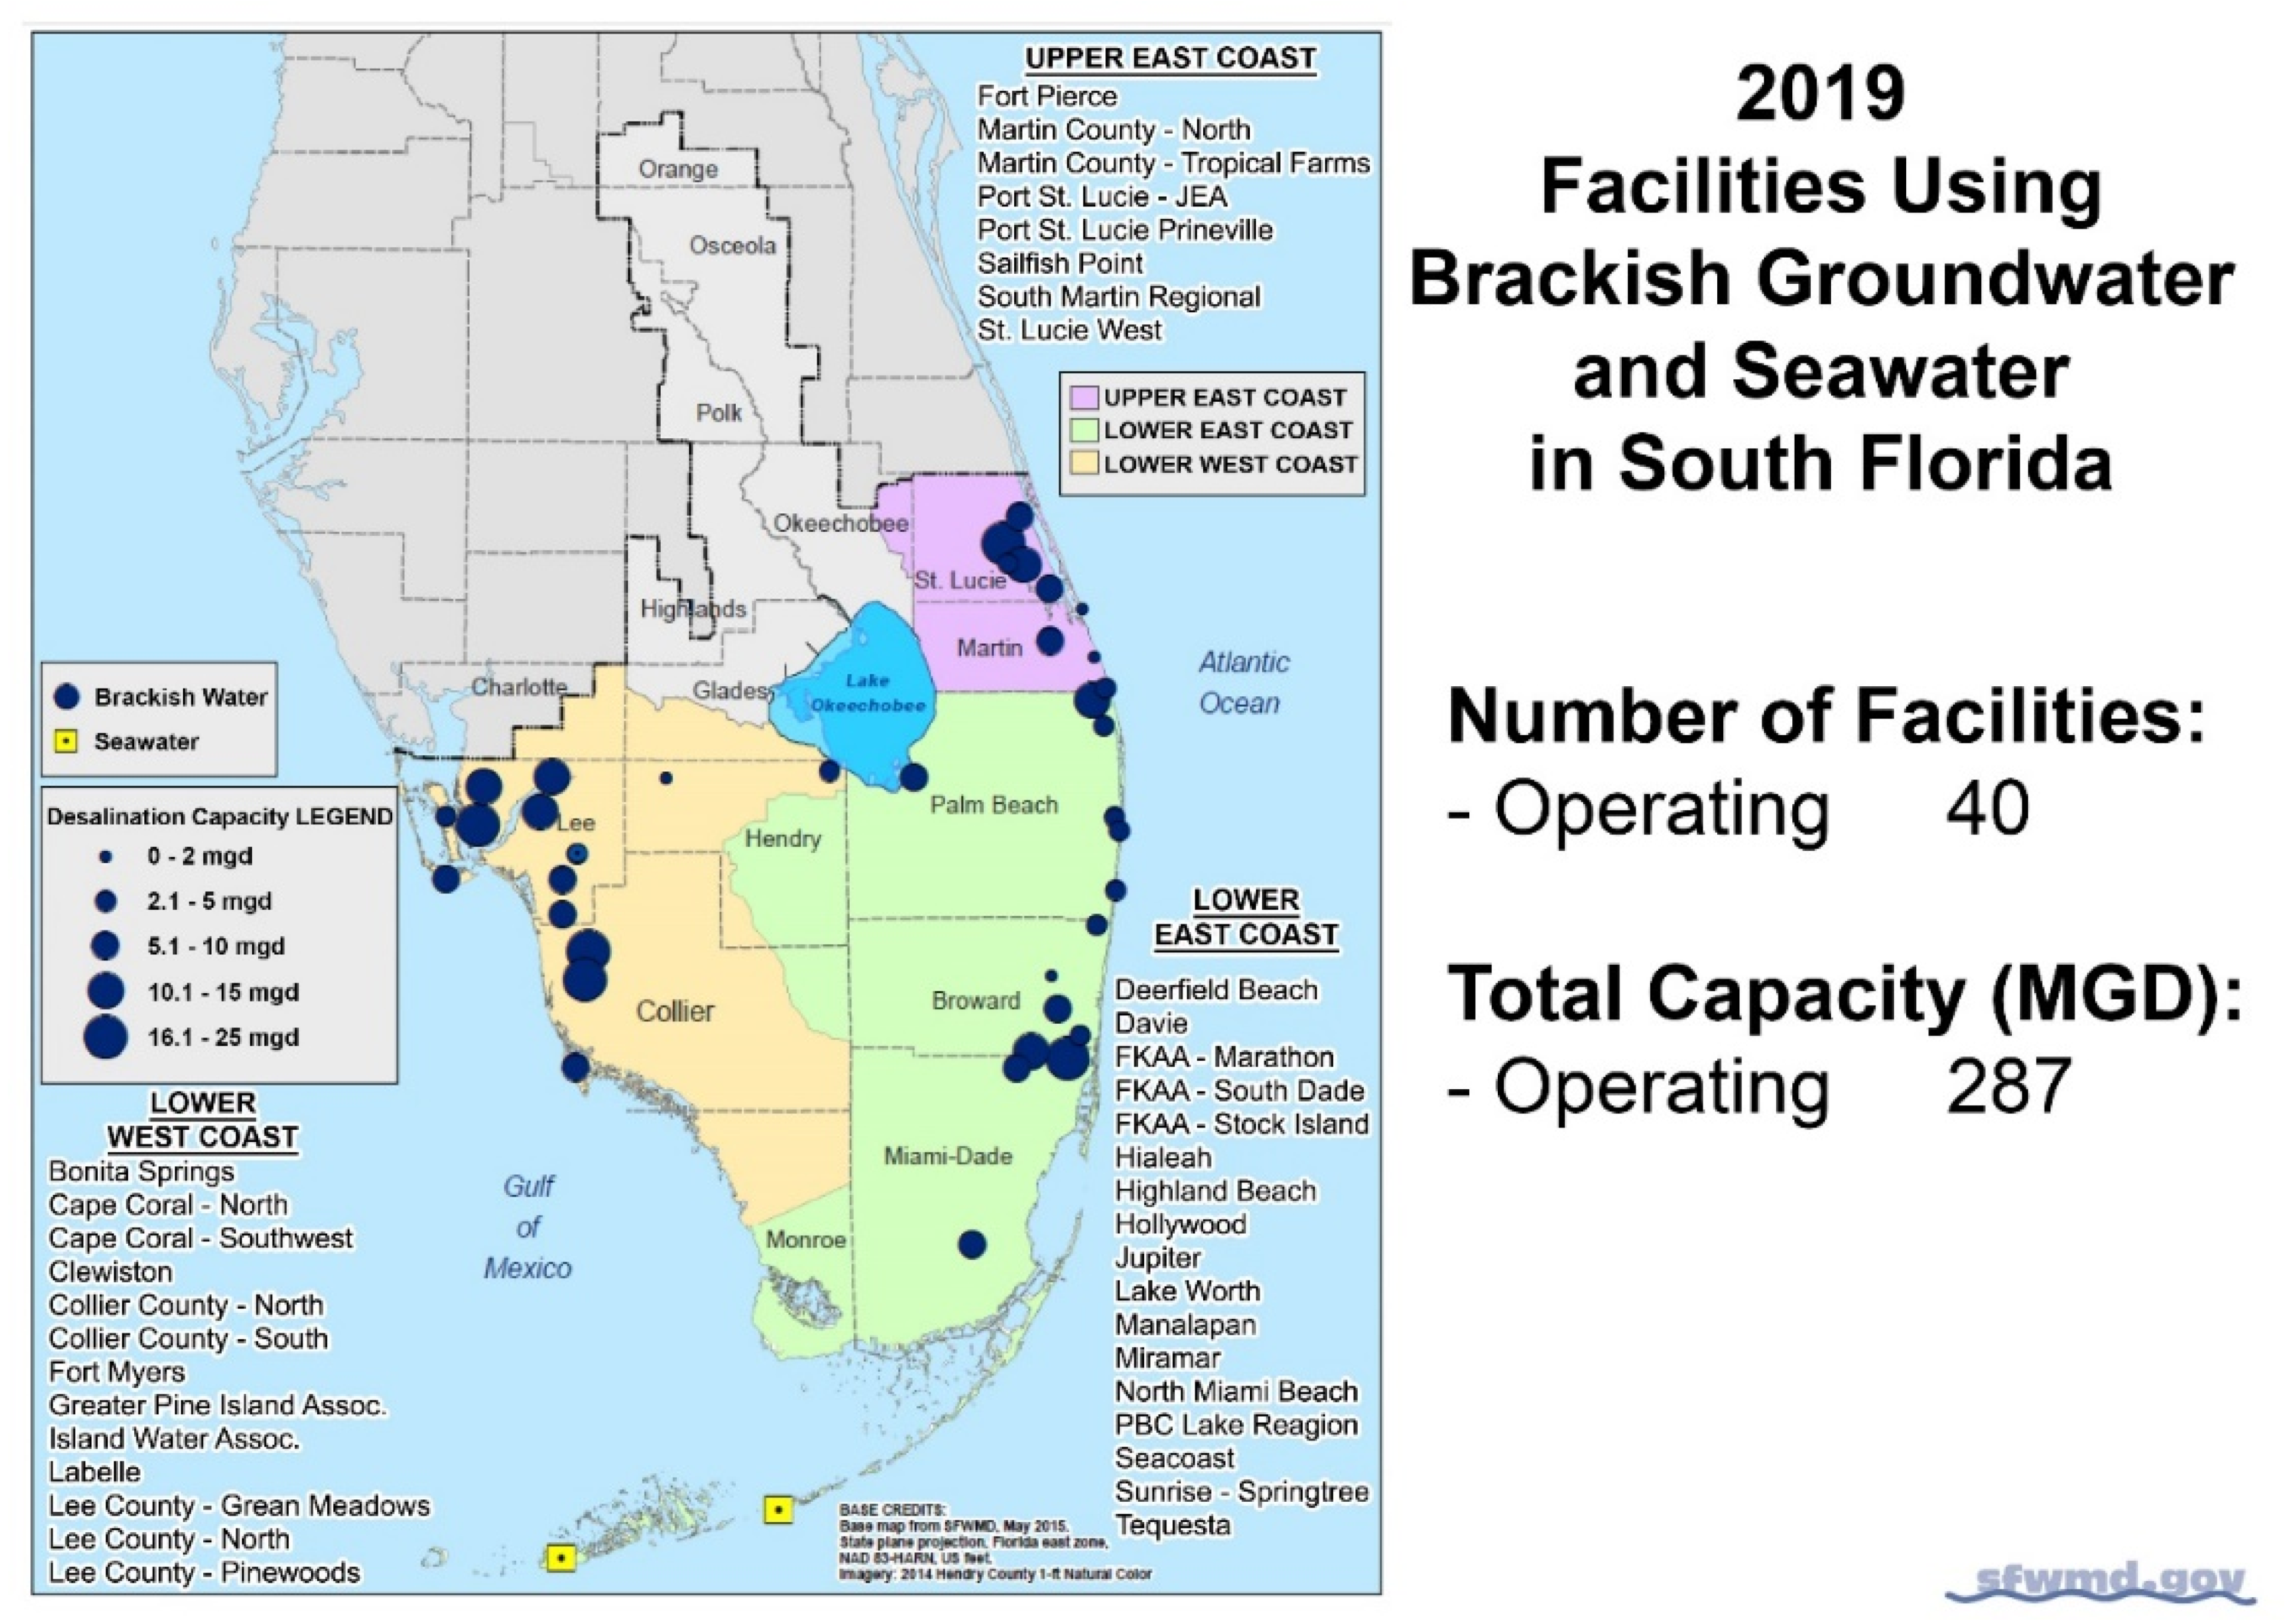
3.1. Description of Facilities in Southwest Florida

3.1.1. City of Cape Coral Southwest BWRO Plant

The city currently operates and maintains two reverse osmosis (RO) water production facilities, 55 raw water production wells, a raw water transmission system, two water storage and re-pump stations, and a potable water transmission and distribution system. The Southwest Water Treatment Plant (WTP) is the oldest, continuously operated brackish low-pressure BWRO potable water production facility globally. The Southwest WTP has two separate BWRO WTPs in one facility that operate independently. Plant 1 has a design capacity of 22,710 m³/day. Plant 2 is the larger unit, with a design capacity of 45,799 m³/day. Together, the plants combine for a total design capacity of 68,509 m³/day. Both of the plants utilize the same process, which consists of chemical pretreatment, micron (cartridge) filtration, reverse osmosis, degasification, pH adjustment, and chlorination. The concentrate (brine) from both the plants is disposed of via deep-well injection into the boulder zone, located approximately 914.6 m below the land surface (BLS).

3.1.2. City of Cape Coral North BWRO Plant

The North BWRO WTP was placed into service on 8 March 2010, and has a permitted production capacity of 45,420 m³/day, which can be achieved by using approximately 54,882 m³/day of raw water, while producing approximately 9462 m³/day of concentrate that requires disposal (approximate 83% recovery). The firm capacity of the North WTP (with one unit out of service) is 34,065 m³/day. The North WTP utilizes the BWRO process.
The BWRO membrane elements are low-pressure, high-rejection thin-film composite membranes. Pretreatment of the raw water from the wellfield is through a combination of sulfuric acid, polyacrylic acid, and filtration. This form of pretreatment has been used very successful at the Southwest WTP, to meet water quality performance standards at a reasonable treatment cost and extends the life of the membrane elements. Following pretreatment, the water travels under pressure to each of the four treatment trains. Each treatment train has a production capacity of 9462 m³/day. A 298,280 watt (≈400 hp) pump then conveys the water into the first stage of the treatment train, to begin the RO process, which has two stages. The product water from the two-stage RO process is combined and blended with raw water, to meet the target water-quality parameters.
Disposal of the concentrate (brine) is through a single on-site deep injection well (IW). The use of blended product water is cost-effective, as it reduces the amount of post-treatment chemicals that are needed for controlling the hardness and alkalinity. The blended water is then post-treated for the removal of gases (H2S). After traveling through the degasification process, the blended water enters a 643.45 m³ capacity clearwell. In the clearwell, sodium hydroxide is added to raise the pH to stabilize the water, and sodium hypochlorite is added for disinfection. The water is pumped to the 45,420 m³ pre-stressed concrete ground storage tank, using one of the two 75,600 watt (≈100 hp) transfer pumps. Both the City BWRO Plants are supplied with brackish raw water from the Lower Hawthorn Aquifer, located in the upper part of the Floridan Aquifer System. There is a total of 55 raw water production wells.

3.1.3. Island Water Association BWRO Plant

The Island Water Association, Inc. (IWA), one of the oldest BWRO systems in the world, began its operation in 1982. It is a member-owned corporation that supplies water to a franchise area covering the City of Sanibel (Sanibel Island) and Captiva Island, Florida. The BWRO plant has an installed capacity of 22,331 m3/d, including a blend of raw water. It can produce a maximum of 26,477 m3/d [47]. The design of the plant includes thin-film composite membranes in a two-stage configuration. It can treat a TDS concentration of up to 3500 mg/L. The average current TDS concentration of the feed water is 2800 mg/L [47].

3.1.4. Lee County Green Meadows BWRO Plant

The Green Meadows water treatment complex contains both freshwater treatment and a BWRO facility. It is located in east-central Lee County, Florida. The facility serves approximately 20,000 homes and businesses in Lee County, as one of the key water supply facilities. Originally built in 1977, the wellfield consisted of a 34,091 m3/d capacity lime softening treatment plant, and 27 water tables and Sandstone aquifer production wells (freshwater) running along an 8 km unpaved access road before the expansion. The upgrades turned the 40-year-old WTP into a state-of-the-art facility, converting the treatment process to combined ion exchange and BWRO, and increasing the finished water production capacity to 53,030 m3/d. The wellfield expansion added eight upper Floridan Aquifer System production wells (brackish water) and a deep-well concentrate disposal system, consisting of an 876 m deep injection well and a 549 m deep dual zone monitoring well. The Lee County Green Meadows BWRO Plant was placed into operation in May 2018. The plant has a permitted capacity of 60,560 m³/day. The plant utilizes a combination of ion exchange to treat the freshwater and BWRO to treat the brackish raw water [48].

3.1.5. Lee County North BWRO Plant

The Lee County North BWRO Plant has a permitted capacity of 43,906 m³/day [49]. The plant was constructed in 2006 and treats brackish groundwater from wells that are drilled into the Lower Hawthorn Aquifer, which is the uppermost aquifer in the Florida Aquifer System [50]. The plant disposes of RO concentrate via a deep injection well.

3.1.6. Lee County Pinewoods NF/BWRO Plant

The Lee County Green Pinewoods BWRO Plant was originally placed into service in 1990, as a nanofiltration (NF) plant. Lee County Utilities took over plant operation of the 8705 m³/day capacity facility in 2003. Raw water is obtained from wells that are drilled into the water table and Sandstone aquifers (freshwater). The plant was upgraded in 2005–2006, by adding an 11,355 m³/day BWRO plant, with wells drilled into the Lower Hawthorn Aquifer. The facility has a current permitted capacity of 20,060.5 m³/day. A combination of nanofiltration (NF) and RO, to treat the raw water from the freshwater and brackish water wells, is used, respectively [51].

3.1.7. The City of Marco Island South BWRO Treatment Plant

The City of Marco Island operates a BWRO plant with a capacity of 22,710 m³/day. Feedwater is pumped from a series of 18 upper Florida Aquifer System wells that provide between 30,280 and 31,037 m³/day of brackish water [52]. The feedwater is rough-filtered to remove any potential particulate material. The feedwater is pretreated with a scale inhibitor to prevent scaling, and sulfuric acid to reduce the pH. The raw water then travels through six cartridge filters to remove very fine particulate materials, and is then pumped at high pressure and sent into the six dual-stage BWRO membrane trains. The reject water is pumped to the Marco Island Wastewater Plant for injection into a deep disposal well (976 m). The permeate from the membranes is treated with sodium hypochlorite and ammonia, to form chloramines, and then mixed with air in one of the two degasifiers that are used to remove hydrogen sulfide. The water is conveyed into the storage tanks, and the stripped gases from the degasifiers go into an air scrubber to remove the hydrogen sulfide from the air, before it is dispersed into the atmosphere.

4. Results

4.1. City of Cape Coral North Plant Capital Cost Analysis

It is quite challenging to assess the comparisons of CAPEX for BWRO facilities, because of the differences in the overall project objectives, the design feedwater quality, and the project delivery (e.g., design-bid build, build-own-operate-transfer). CAPEX is highly location-specific, based on multiple project objectives that may include distribution system improvements, varying capacities of surface storage, provisions of the plant footprint to accommodate expansion, the method of concentrate disposal, and differences in post treatment.
The City of Cape Coral North Plant is a prime example of the complexity of a large-scale BWRO project. This dataset is unusual in that it is detailed and can be used to obtain a variety of different and useful pieces of information. The base capacity for the plant was 45,420 m³/day. When the entire facility cost of USD 138.5 million is divided by the capacity, the resulting cost per installed m3 is USD 2947, which must be considered a very high number. Therefore, it is essential to assess the details of the project, as shown in Table 1.
The high CAPEX per m³ is a result of the desire to size the building to accommodate additional treatment trains and raw water wells, to treat a maximum plant capacity of 113,550 m³/day of water. In addition, the pipelines from the plant were designed to accommodate the buildout capacity. Therefore, the CAPEX cost per m³ of water would be considerably lower than the USD 2947/m3. Also, the land area acquired was larger than that required for the initial plant capacity, and it has some other planned uses. If the total project cost was divided by the ultimate plant capacity, the unit cost would be USD 1215/m3. However, the equipment cost for the increased capacity would also have to be added back. Therefore, the actual unit cost would be about USD 1800/m3. A key issue is the high cost of the land purchased for the utility “campus”, which will include other infrastructure, not only the BWRO facility.
Capital costs are not commonly reported, but in the cases where reports have been made, they are inconsistent, incomplete, and contain minimal details. The delineation between civil and material costs can differ between reports, as can the identification of critical component replacement items. The membrane costs for replacement are also inconsistently reported, because they can be related to both CAPEX and OPEX. For example, some facilities purchase a certain number of replacement parts as part of the CAPEX. Additional spare components can include high-pressure pumps, values, and others that have a long back-order time. Some plants that expect significant increases in feedwater salinity may also over-size the horsepower of the high-pressure pumps, to accommodate the future salinity changes (de-staged pumps).
If only the initial capacity of the City of Cape Coral North Plant and those associated constructed costs are considered, the estimated cost per installed m3 would likely range from USD 700 to USD 1000. The land cost is particularly high at this location, because the site acquired contained platted building lots in the middle of a residential area. The engineering and design for the BWRO plant were incorporated within a large-scale utilities program management scheme, with an engineering firm taking the role of the program manager. The CAPEX for the other six plants could not be obtained in sufficient detail to be reported.

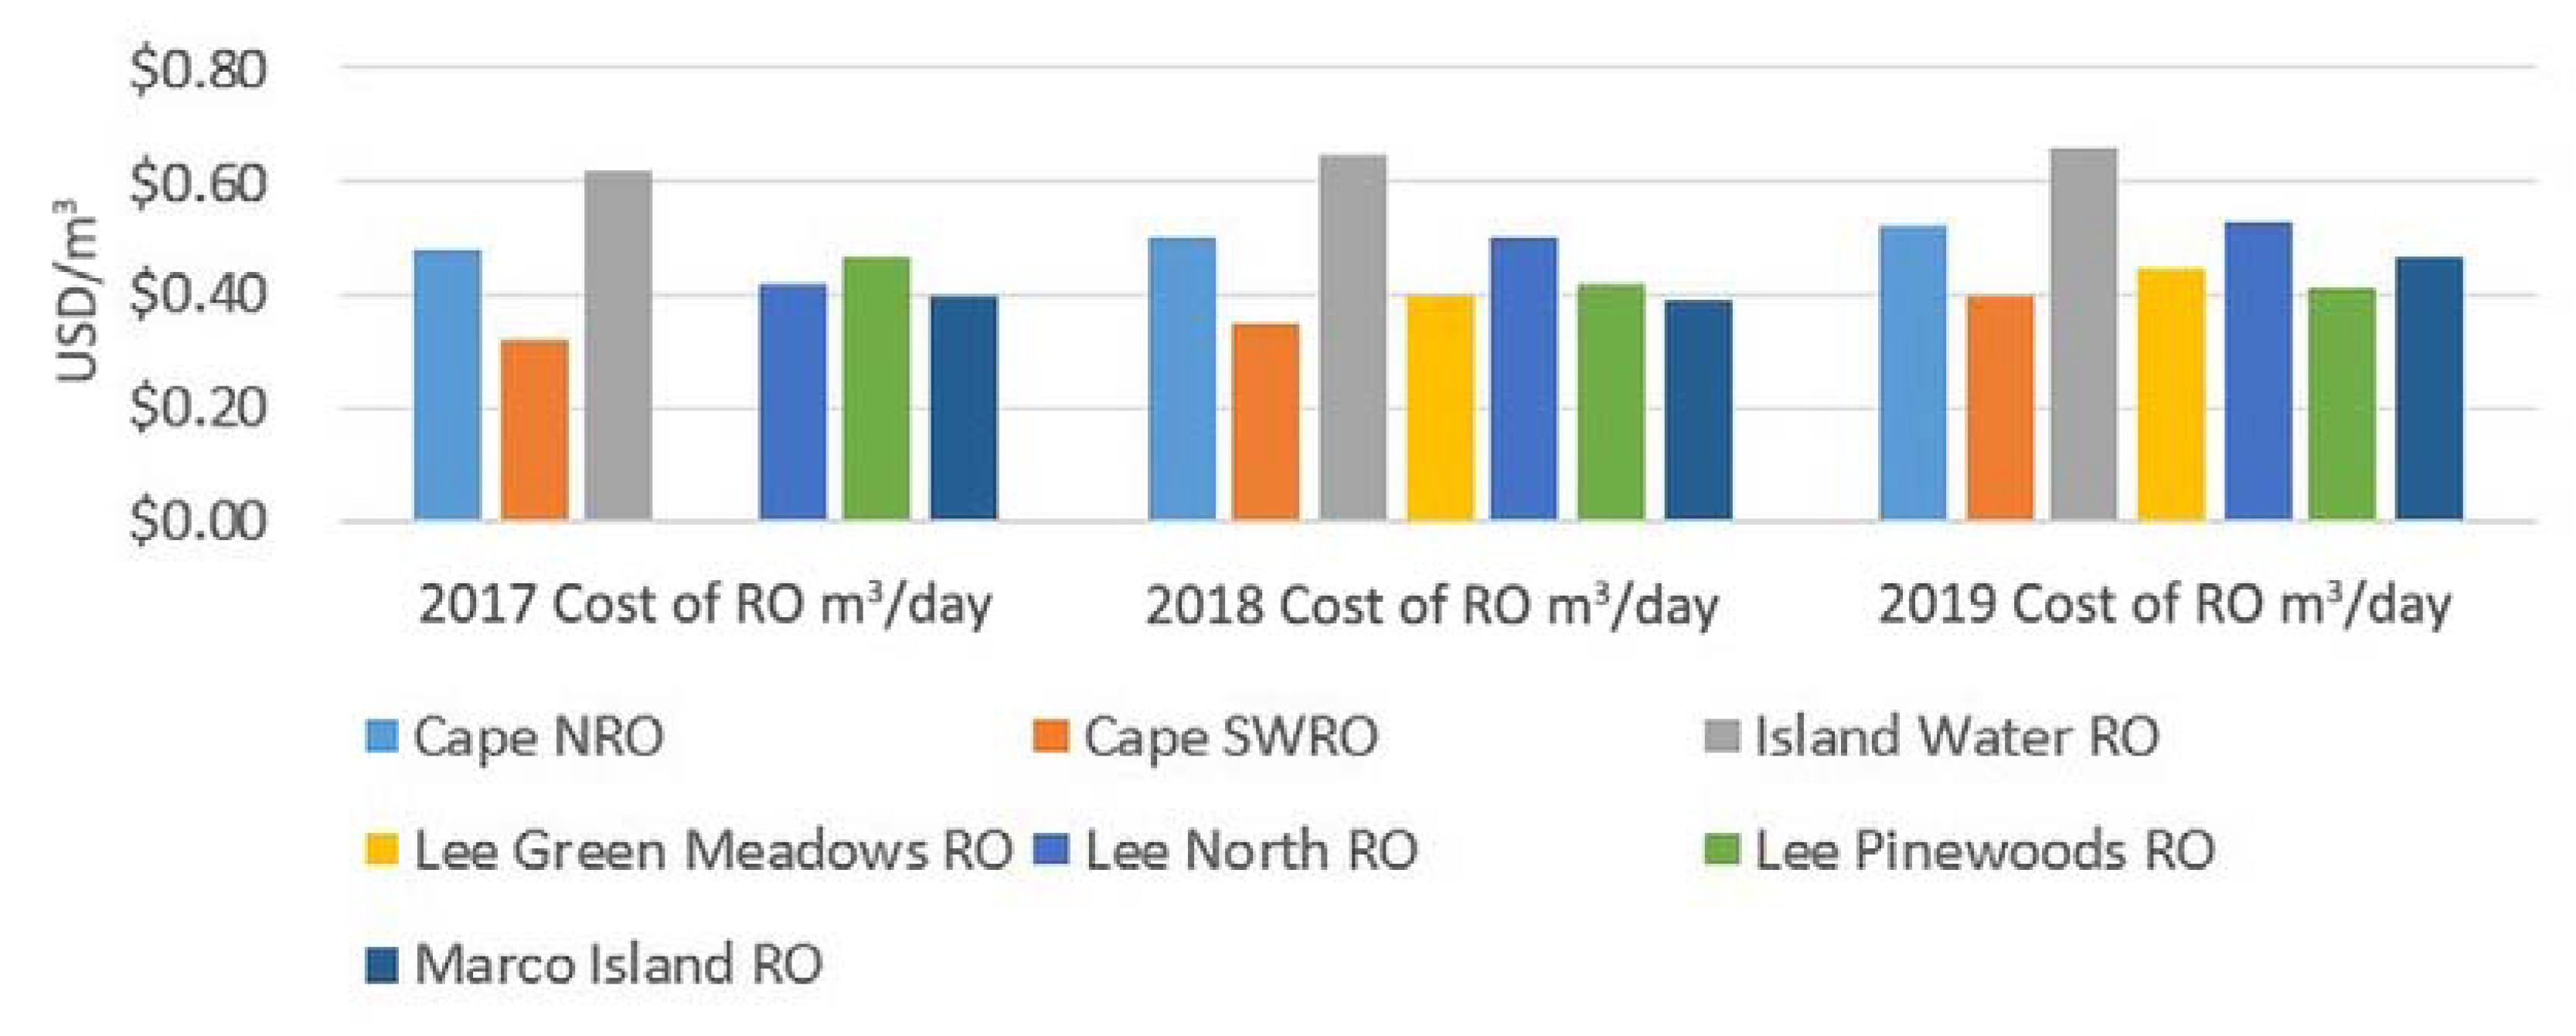
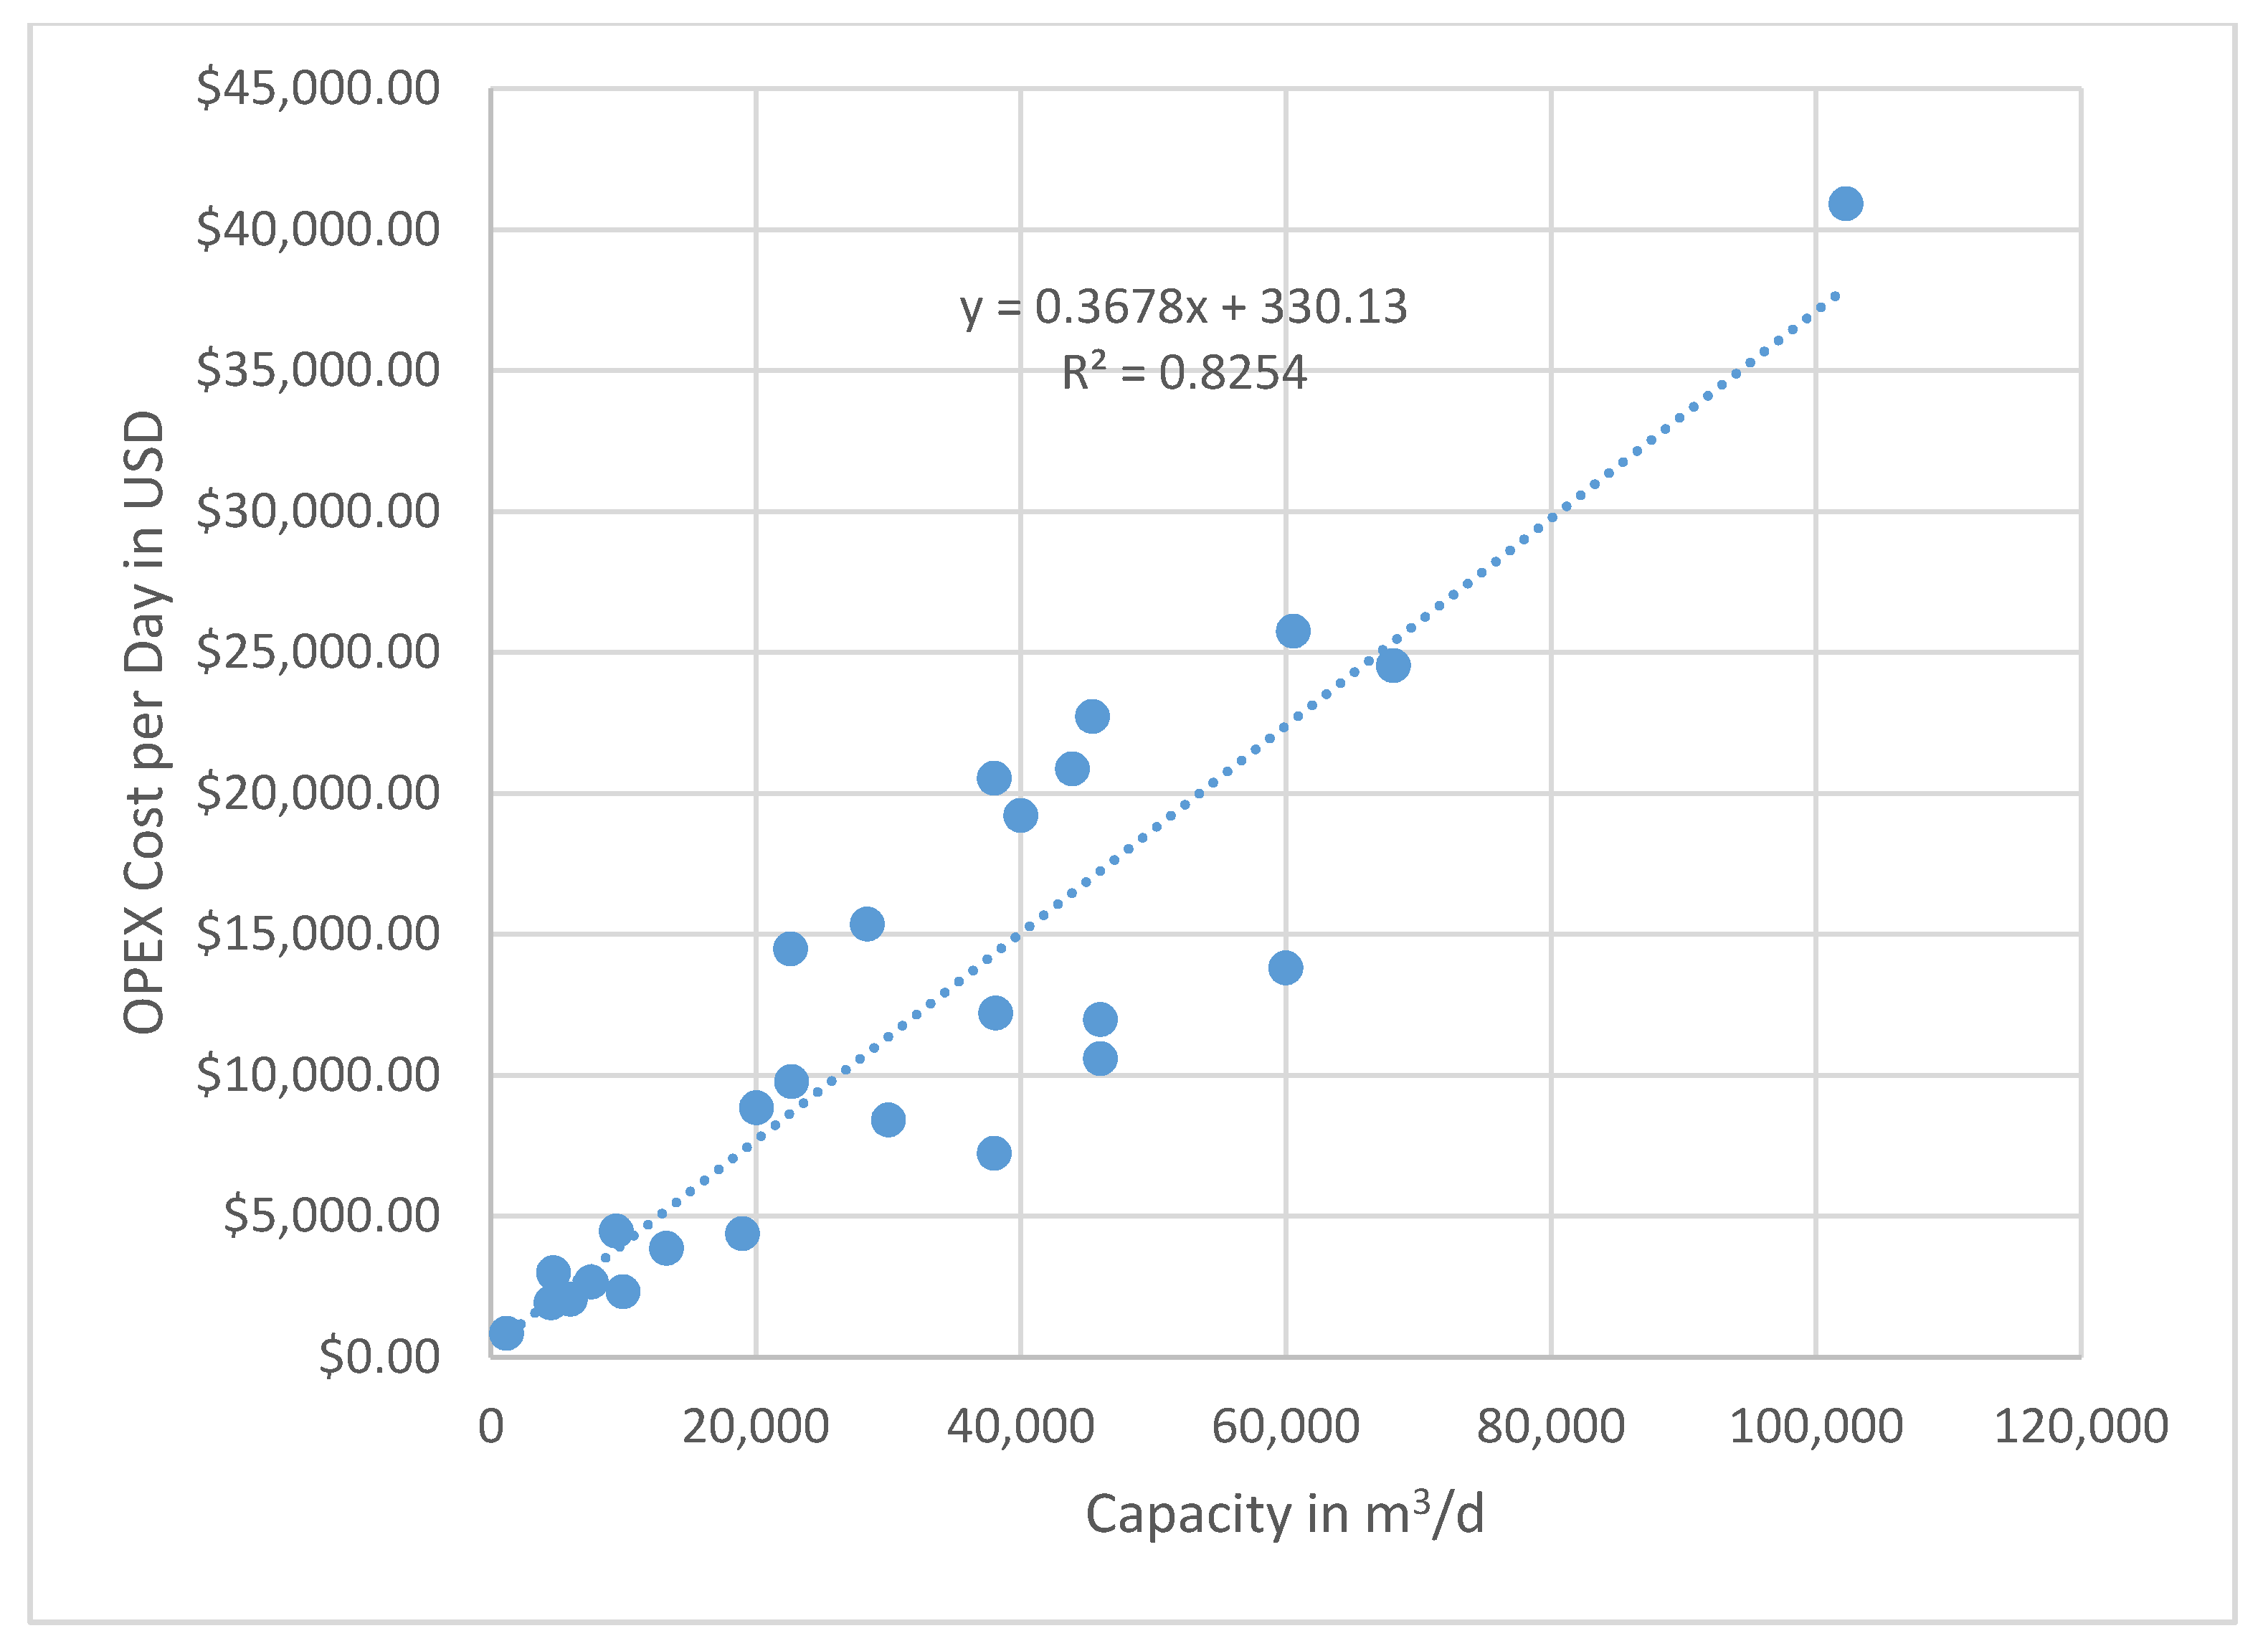
4.2. Cost of Water for Southwest Florida BWRO and Hybrid Facilities (OPEX)

The estimated OPEX costs for seven BWRO facilities (including hybrid systems) were evaluated over 3 years, from 2017 to 2019. The produced water volume from these facilities is summarized in Figure 5, and the estimated OPEX cost/m3 is given in Figure 6.
Some significant facts can be obtained from the data. OPEX, from year to year, is not constant, and there is a general upward trend in the studied facilities. The average increase in OPEX cost, between 2017 and 2019 (3 years), is 4.87%, with the range in plant changes from 2 to 6.9%. The total consumer price index rise over the 3-year timeframe was only 6.3%, so the operational cost change was lower than this number. There is some scale to the costs of the pure BWRO systems, with the Island Water Association having a higher cost. Marco Island is another low-capacity plant, but may have reduced cost due to a blend of freshwater taken from a lake source. The Cape Coral plants, the Lee County North plant, and the Island Water Association plants have purity in BWRO operation, without any hybrid treatment schemes. The average TDS of the feedwater at these facilities does not seem to be a significant OPEX factor (Table 2).
The OPEX cost of brackish water RO drinking water in Southwest Florida ranges between USD 0.36/m³ and USD 0.66/m³, as reflected in Table 1 and Table 2. A comparison between the pure BWRO plants only includes the two City of Cape Coral plants, the Island Water Association plant, and the Macro Island plant. However, the range in OPEX numbers does not change.

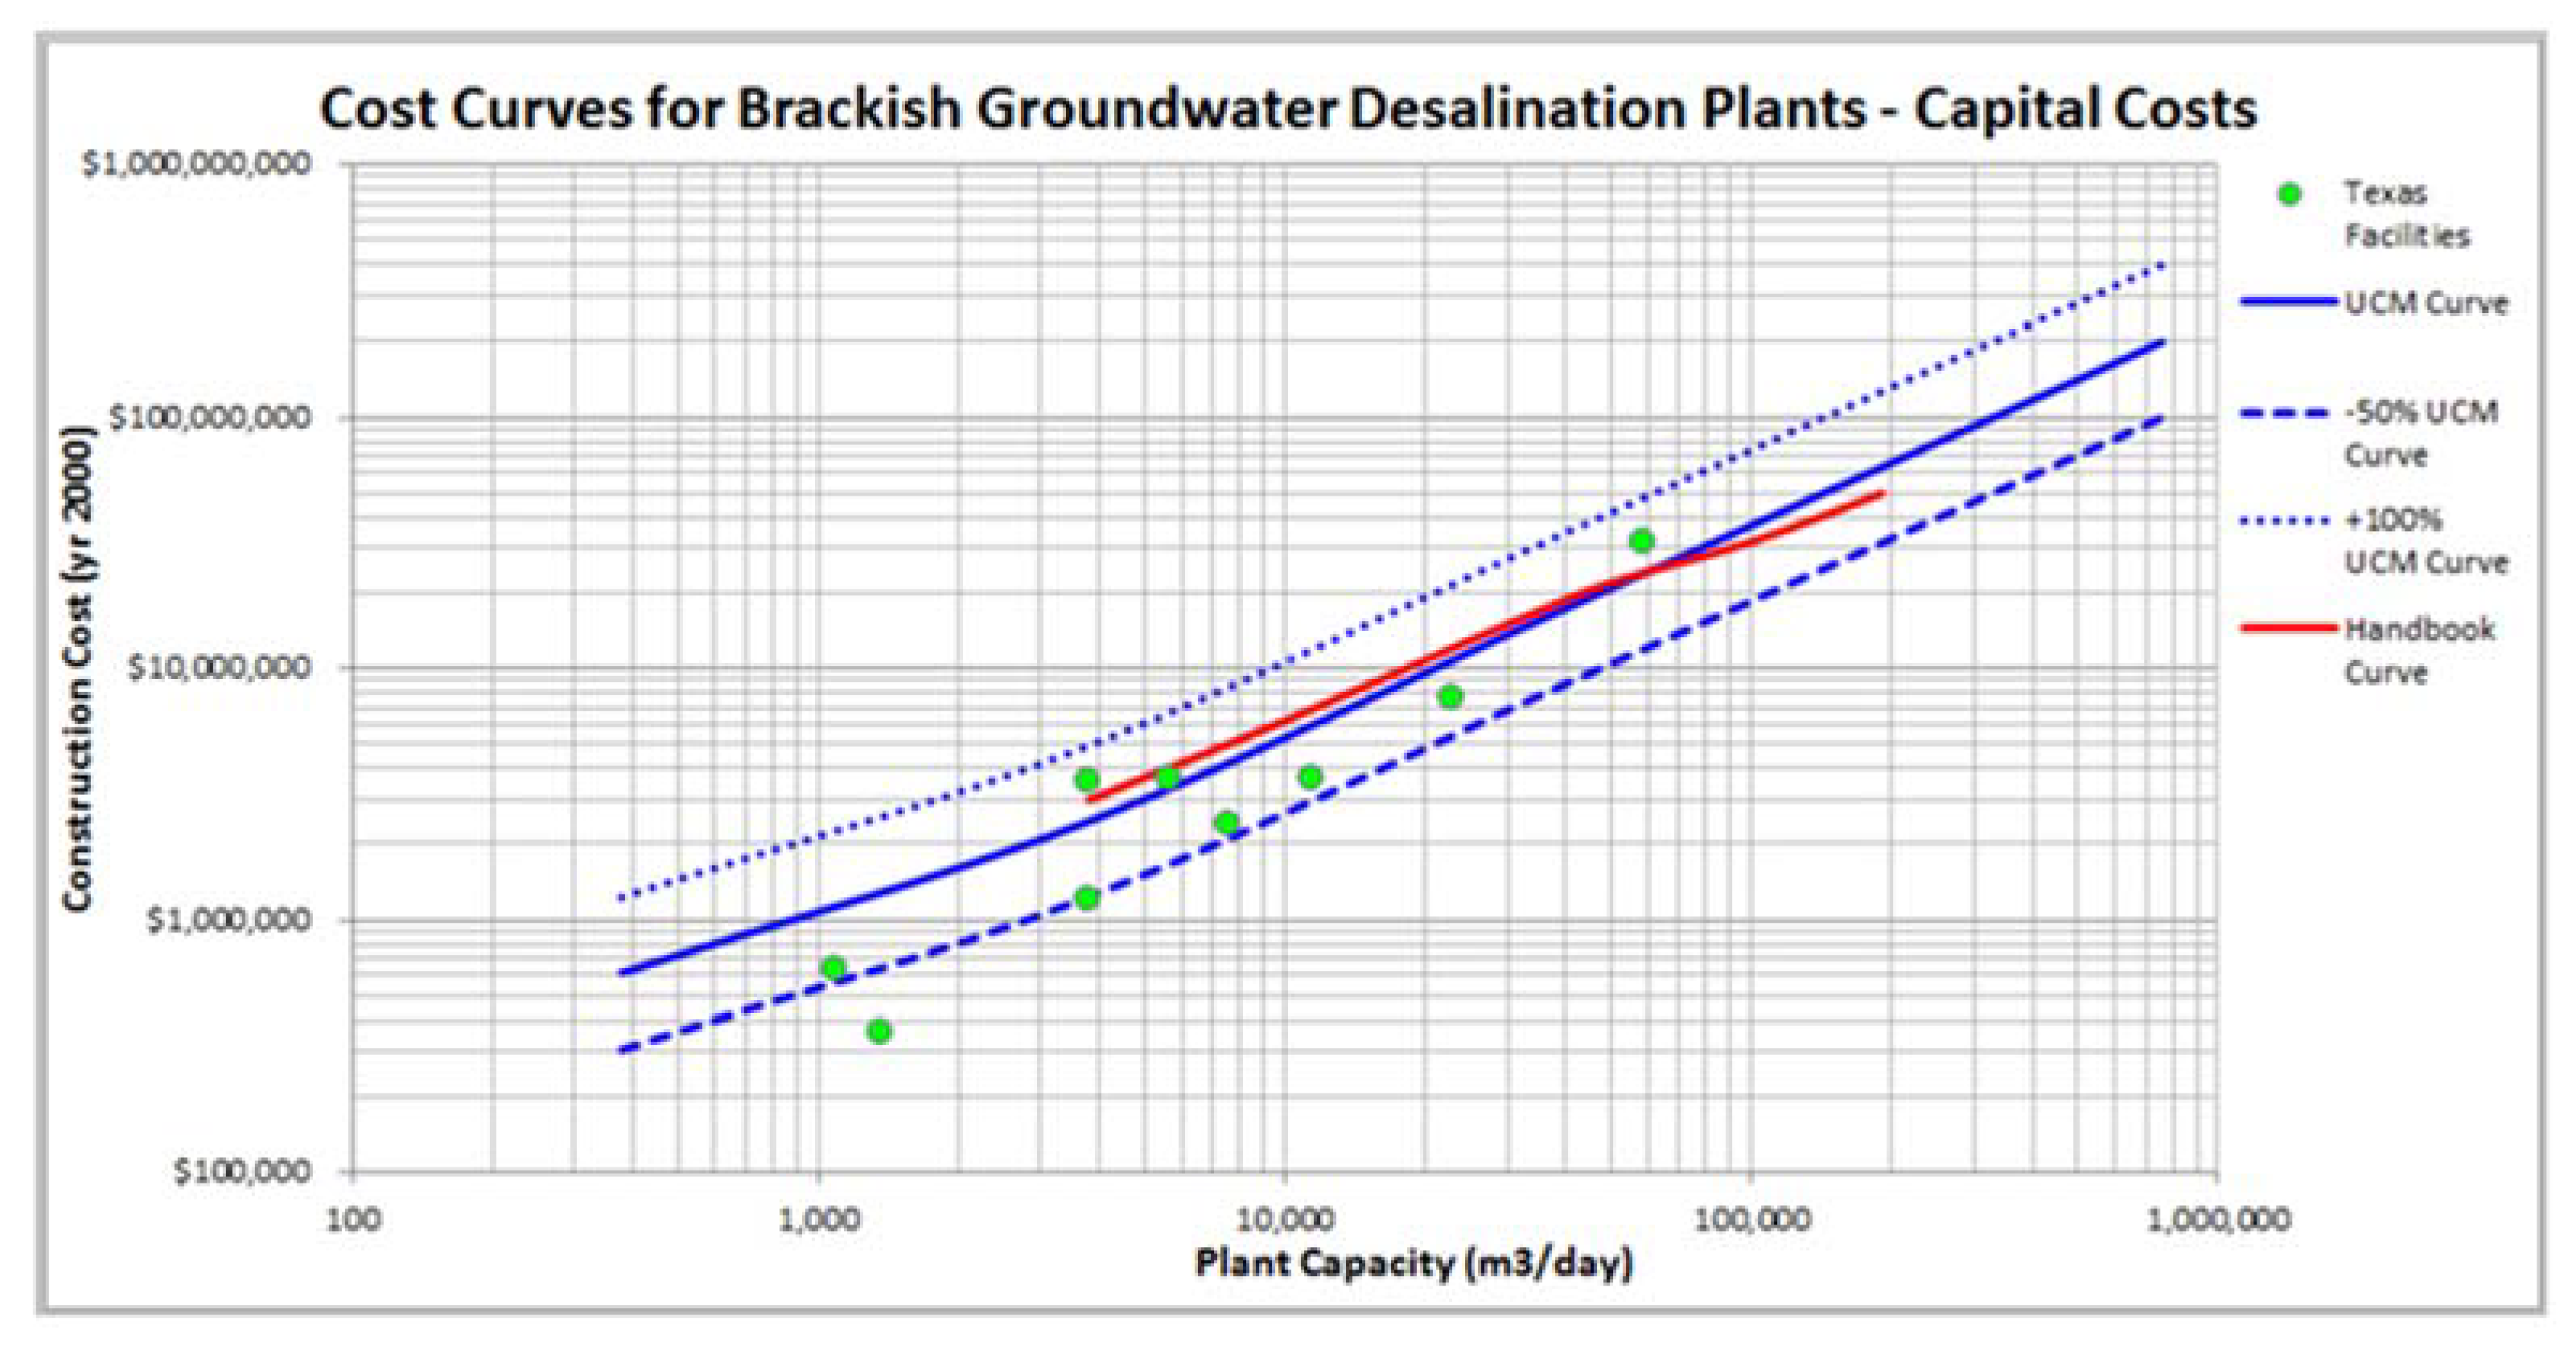
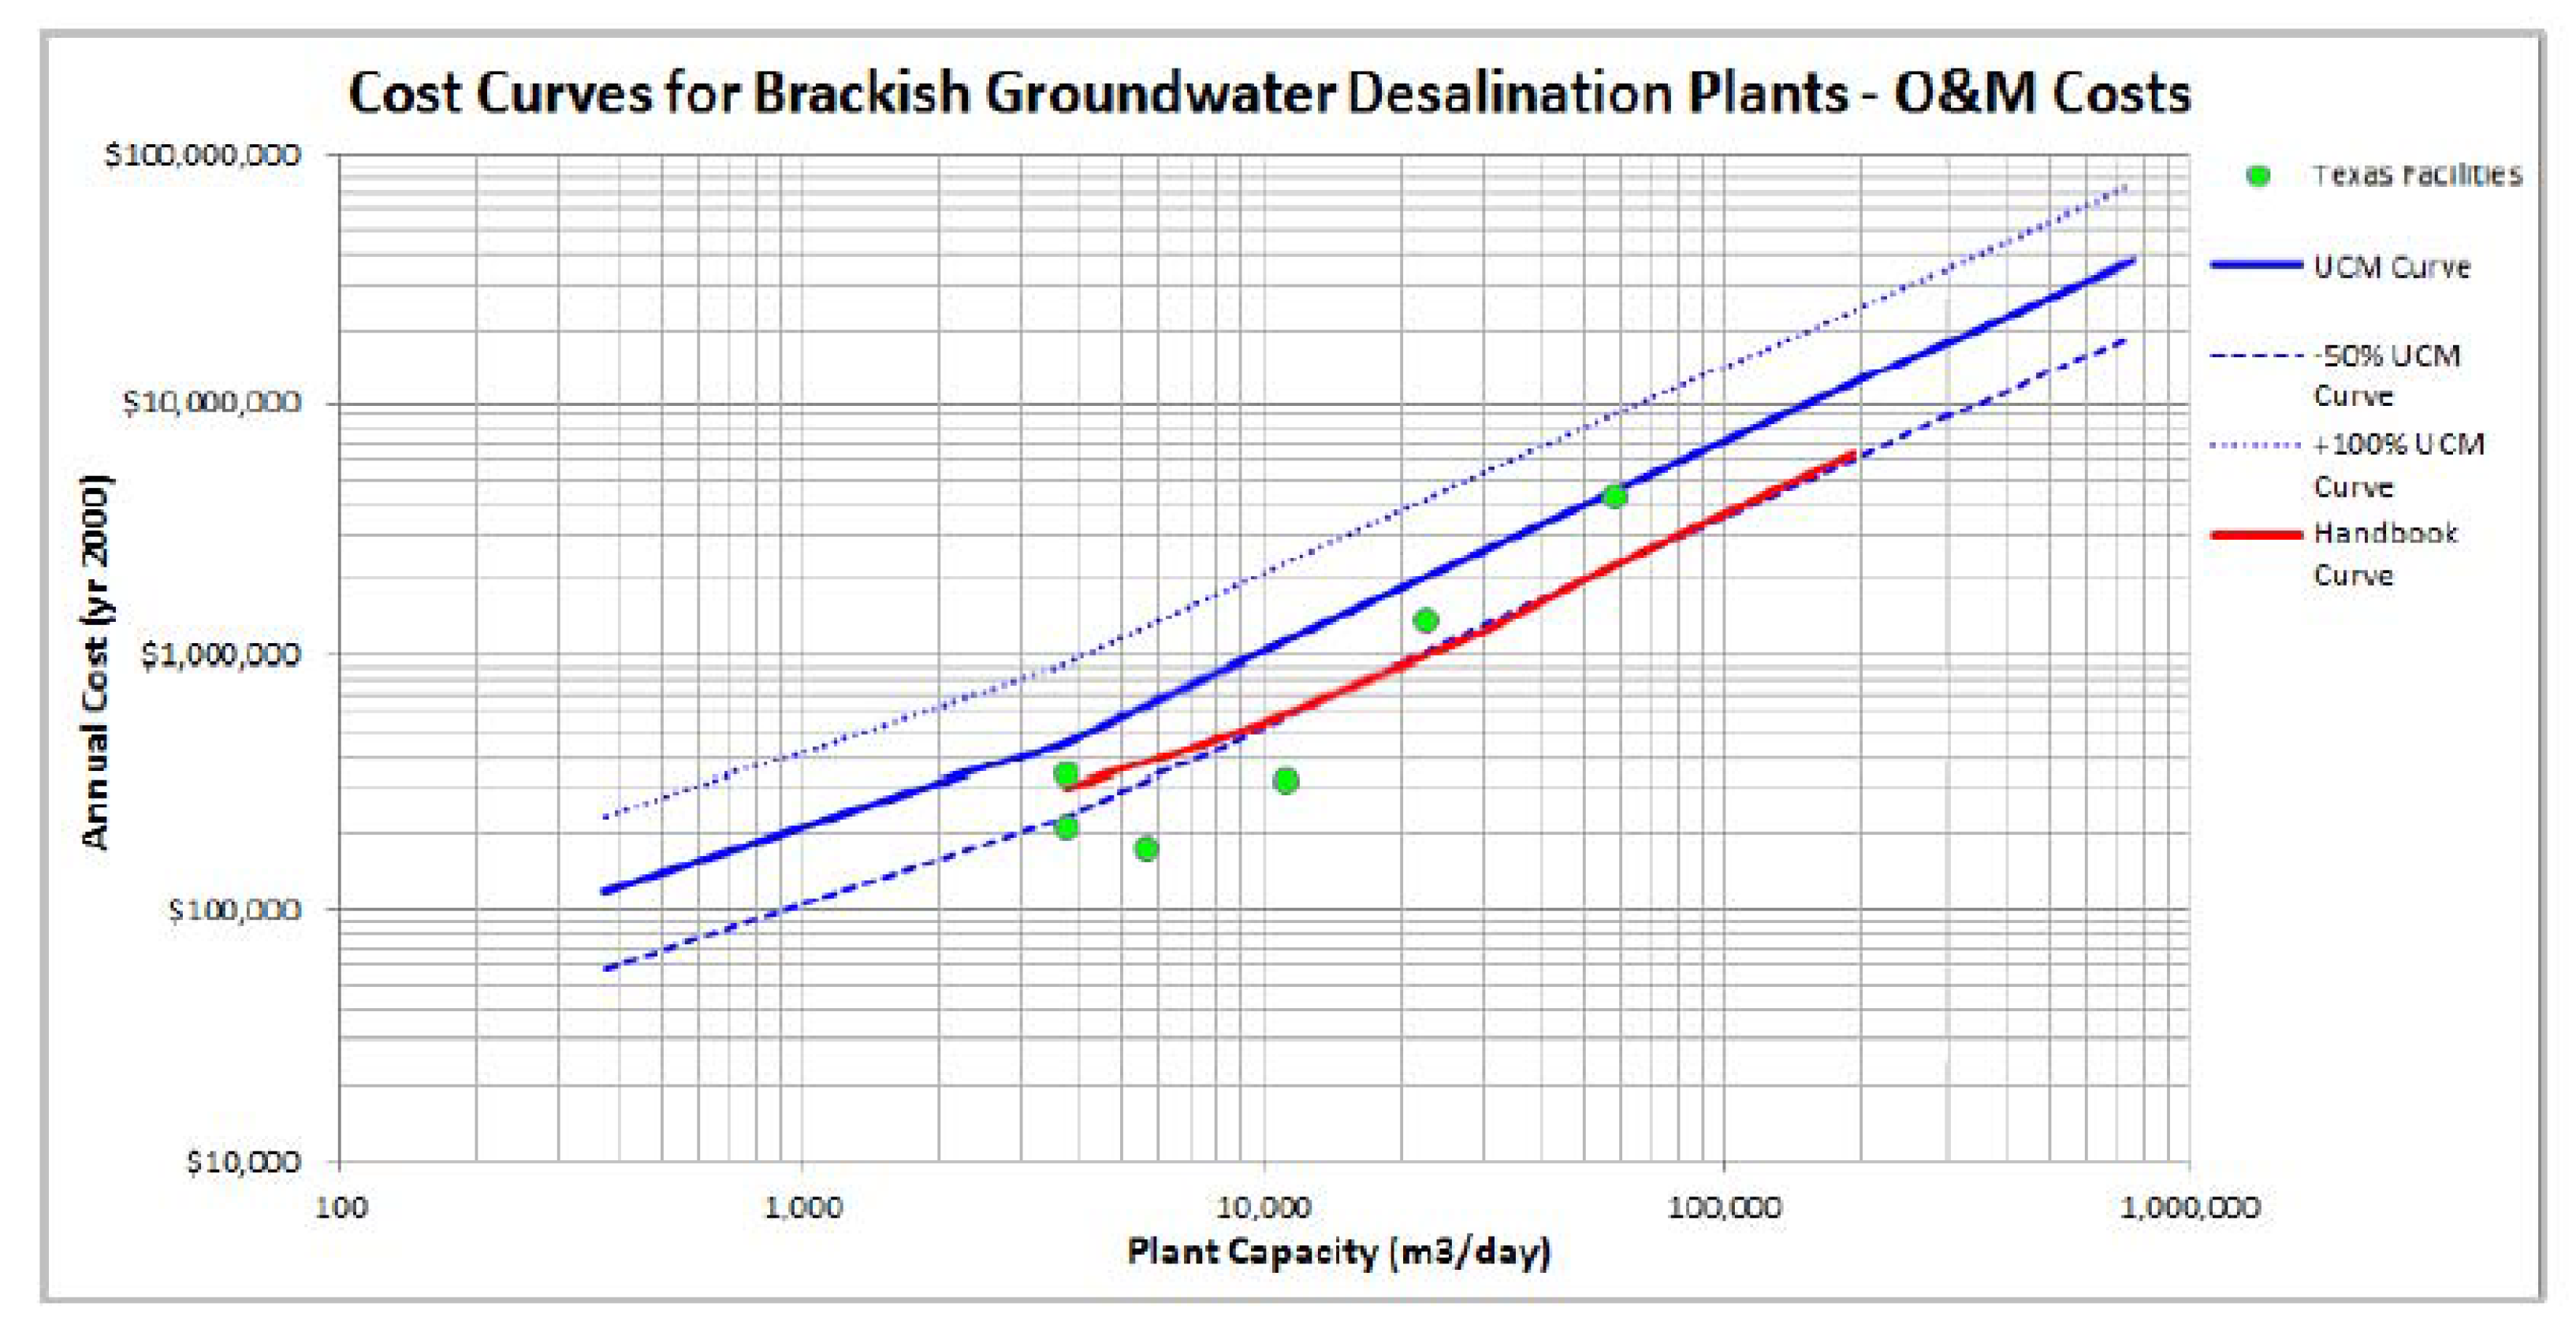
4.3. Cost Analysis of Various BWRO Plants in Texas

Cost data are available from several BWRO plants in Texas [43,44]. A summary of the data is presented in Table 3. The range in capital cost is 536 to 1032 USD/m3 [39]. This range is somewhat misleading, in that the blended cost reduces this range, and there are data from one facility that seem to be too low. The OPEX cost range in USD is 0.23 to 0.63/m3. Two useful figures were produced by the USBOR [40] that show cost curves for CAPEX and OPEX, with comparisons to some published cost curves (Figure 7 and Figure 8). A key observation on the Texas electric cost data is comparatively low, at USD 0.059 to 0.083/kWh.

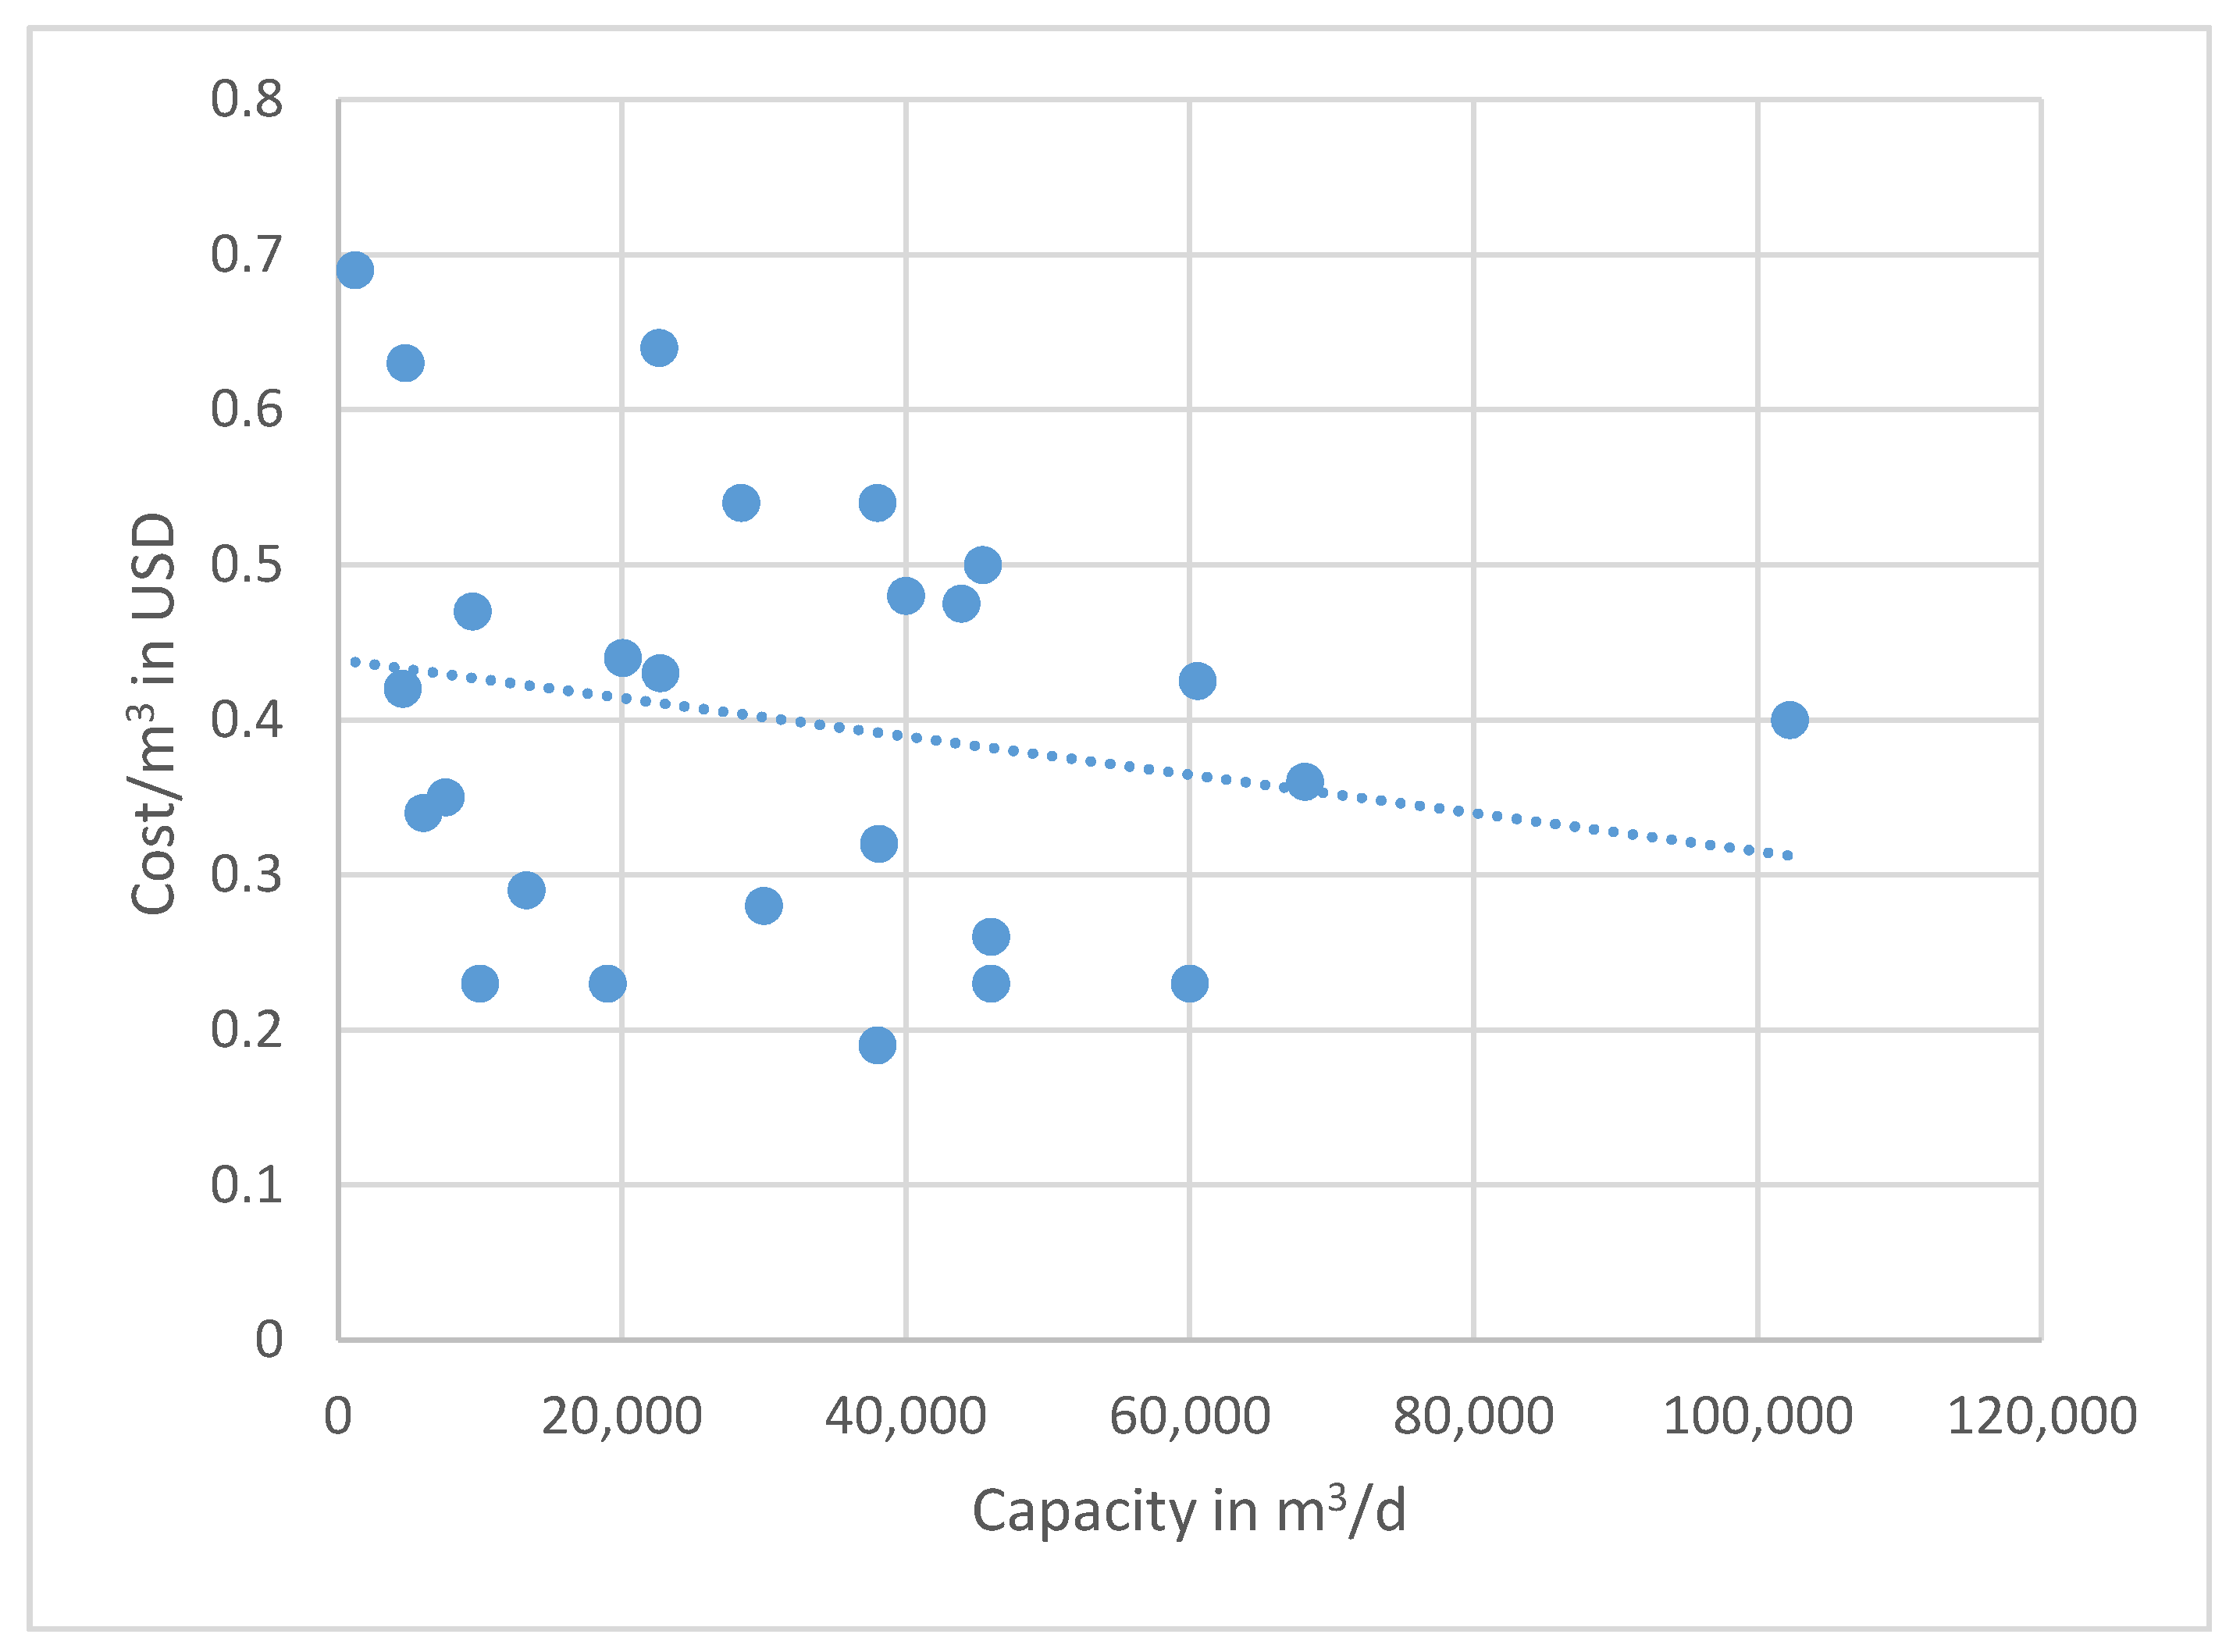
4.4. A Compilation of Various International BWRO Plant Capacities, Feed-Water Quality, and Treatment (OPEX) Cost/m3

A compilation of data on international BWRO facilities, with capacities ranging from <20 to 60,000 m3/d, is given in Table 4. The very-low-capacity facilities have the highest unit costs for desalination, as would be expected. However, the relationship between the capacity and unit cost is not uniform once a capacity of 1200 m3/d is exceeded. The TDS of the water, electrical rate, and pretreatment costs must all impact the cost to some degree. However, the range in costs, between 0.19 and 0.48 USD/m3, is relatively narrow.

5. Discussion

5.1. CAPEX Cost Variation

The CAPEX costs for BWRO facilities vary in the extreme, based on what is included in the project and land costs. The highest cost documented value of over USD 2947/m3 is the North City of Cape Coral, Florida facility. Based on the consumer price index over the years, since the construction of the project, the 2020 cost would be about USD 4067. The detailed breakdown of this cost shows that a large urban land purchase was required to build the BWRO facility, and to accommodate other utility infrastructure at the same location. The building was sized to meet the buildout capacity for the service area of the plant. Also, spare pumps were purchased in addition to other equipment that was needed to provide operational security. The raw water contained hydrogen sulfide, which had to be removed before the treated water could be discharged into the distribution system, so a degassing system had to be designed and constructed. The concentrate disposal for the plant was a deep-well injection, so that the cost was also included in the CAPEX. The Cape Coral North facility is an excellent example of why using cost curves to estimate CAPEX, for new BWRO facilities, can produce inaccurate estimates. Many projects involving BWRO design and construction also include multiple components that cannot be easily separated from the primary project goal. Commonly, distribution system improvements are also contained with these project budgets (e.g., storage tanks, pumping stations, and pipeline improvements). The use of cost curves for the estimation of strictly the BWRO component of a project is reasonable, if it can be separated from the other components of the project.
Perhaps the most consistent data set on BWRO CAPEX is that from Texas. These projects had a rather narrow set of goals and objectives that follow the general trend of reducing CAPEX/m3 with increasing plant capacity. The one possible exception is the largest capacity plant in El Paso (Figure 7). This facility uses a high-pressure deep injection well system for concentrate disposal.

5.2. OPEX Cost Variation

Some important general observations can be made in analyzing the complied OPEX data from various BWRO facilities. First, the local electrical cost is one of the key factors that controls BWRO treatment costs in facilities that treat raw water, within a TDS range of 2000 to 8000 mg/L, and do not have major pretreatment and concentrate disposal challenges. The OPEX costs for BWRO facilities in Florida are generally higher than in Texas, because the average electrical cost is about USD 0.6/kWh in Texas versus USD 0.125/kWh in Florida. The Florida rate is primarily for residential electric use, and industrial or utility rates are lower based on the negotiated rates, considering factors such as interruptible power (on-site generators) and peak load reduction. Most BWRO facilities in Florida must also post-treat the potable water to remove hydrogen sulfide. The international facility costs are lower, which could result from various types of subsidies, or other unknown reasons. At locations where the pretreatment costs only include an antiscalant and acid to reduce the pH, the costs are generally lower. Where any additional control of the substances in the raw water is required, such as silica, iron, or manganese, the costs can be quite high compared to the pretreatment that is used to solely control calcium carbonate scaling.
In general, the cost for BWRO plants capacities, ranging from 10,000 to 70,000 m3/d, is 0.39 to 0.66 USD/m3 based on the time when the data were collected. These data are not corrected for inflation, because the individual utilities do not raise the consumer rates annually and may lag behind real cost recovery. A graph showing all of the compiled OPEX data based on plant capacity (m3/d) versus cost in USD/m3 is given in Figure 9. Note that there is extreme scatter when plotting all of the data that were collected. The variations are caused primarily by the differences in energy costs, pretreatment of the feedwater, and post-treatment of the finished water. There is no distinct pattern of reducing unit costs with increasing plant capacity for all of the data combined. Still, the trend line shows a negative slope, indicating a reduction in OPEX as the capacity increases. The Texas data show a tighter fit to the capacity versus cost scaling line. A second plot of the plant capacity in m3/d versus the cost per day in USD produces less scatter, and a trend line can be drawn with a better correlation (Figure 10). Since the slope of the line is less than one-to-one, as shown in the regression equation, the scaling factor that indicates a lower unit cost as the capacity increase is again confirmed.

5.3. Impacts of Energy Recovery Systems in BWRO

In the past, energy recovery systems were not considered to be effective in cost savings in BWRO plants, because of the low operating pressure, high recovery, and the use of blending with raw water. However, many BWRO plants are now being designed with energy recovery systems or retrofitted with these systems.
An evaluation of two types of energy recovery systems for a BWRO plant showed that both turbocharger and isobaric systems might save electric energy costs, especially when the conversion rate is <84% [57,58,59]; as the conversion rate declines, the electrical energy saving increases [60]. The key method in deciding on the use of energy recovery systems on BWRO plants is to conduct a complete life cycle analysis (LCA) [61].
A large number of BWRO facilities exhibit long-term increases in feed water salinity [62,63,64,65,66]. The use of energy recovery systems to mitigate electric energy costs increases as the feedwater salinity increases, which should be considered. This would potentially mitigate higher energy consumption, to treat higher TDS feedwater. Some recent research on the use of energy recovery in BWRO has suggested integrating a supercapacitor with capacitive deionization into the process [67].

5.4. Impacts of Feedwater Chemistry Issues That Can Potentially Affect the Economics of Brackish-Water Desalination

Feedwater chemistry can significantly impact BWRO costs if additional pretreatment is required to prevent membrane scaling and fouling [68]. In BWRO, the most common problem is scaling and not fouling, although some fouling has been reported at the City of Cape Coral North BWRO facility. There are four common types of scaling in BWRO plants, which are impacted by the feedwater chemistry. This includes scaling with calcium carbonate, calcium sulfate, iron, and silica [69].
Calcium carbonate scaling is commonly controlled using standard pretreatment methods, as described in this paper at the City of Cape Coral facilities. The pH of the inflow water is lowered using acid, and a polyphosphate or polyacrylate is added. Some recent research has been conducted on the use of polyaspartic acid as a pretreatment additive [70]. Unless the hardness of the feedwater is exceptionally high, the standard pretreatment process that is used to control calcium carbonate scaling does not add a higher cost to BWRO desalination. In feedwater with a very high hardness, the additional concentration of acid required could increase OPEX cost.
The control of calcium sulfate scaling (gypsum) can be considerably more complex [71,72]. The closer to saturation that occurs in the feedwater, the greater the difficulty of the pretreatment. A zwitterionic coating on the thin-film composite membranes has been suggested as a means for slowing gypsum scaling [73]. The addition of carboxymethyl cellulose in the feed may also reduce the rate of scaling [74]. The use of sulfuric acid to lower the pH is not recommended, but hydrochloric acid is more effective and does not add additional sulfate to the feedwater. However, hydrochloric acid is more expensive and tends to increase the treatment costs. When the feedwater chemistry contains a high relative concentration of sulfate-to-chloride ratio, the potential for scaling rises and increases the potential for gypsum scaling, the recovery using the RO process must be reduced, thereby significantly increasing the treatment cost [75]. In certain cases, it is more effective to treat this type of feedwater using electrodialysis or electrodialysis reversal if the overall TDS concentration is not too high [76,77,78]. In Florida, this issue occurs in Sarasota County.
The control of iron scaling in BWRO is commonly mitigated by the reduction in the feedwater pH, similar to calcium carbonate. However, if the dissolved iron concentration is too high or the feedwater varies between anoxic and oxic, the iron must be removed at considerable expense. In this case, it may be necessary to add a tray aerator, add a coagulant polymer, and then use a plate settler to remove the iron [79]. An alternative would be to use chlorine dioxide, a plate settler, micro-sand filtration, and then an oxidant remove stage to remove the iron [79]. Therefore, if the dissolved iron must be removed, the BWRO desalination process rises in cost.
Perhaps the most difficult potential scaling issue is that with silica. Most natural groundwater sources do not have high silica concentrations, but in aquifers with elevated temperatures (geothermal), silica concentrations can approach saturation or they can contain silica colloids. Because the scaling of silica on BWRO membranes may not be able to be removed, it is quite important that it be prevented from occurring. Two factors seem to dictate the scaling of silica on the membrane, which include the initial concentration in the feedwater (combined dissolved and colloids) and the surface condition of the membranes [80,81]. The surface electrostatic charge and the occurrence of certain organic materials can either accelerate or inhibit silica deposition. The typical pretreatment methods to prevent scaling are pH adjustment or to add an antiscalant solution [82,83]. These methods are common and do not generally add significant costs to the pretreatment. However, if pretreatment of the feedwater is required, then the costs can become quite high. Expensive pretreatment techniques, such as electrocoagulation, can be used to remove the silica from the brackish water before primary membrane treatment [84].

5.5. Impacts of Zero Liquid Discharge on the Economics of BWRO

Disposal of the concentrate after the BWRO process has also become a potentially large cost factor within the interior facility locations, where surface disposal into the ocean or the use of deep injection wells is not possible. In some locations, the use of zero liquid discharge (ZLD) is the only means of concentrate disposal. Within the realm of seawater desalination, the use of ZDL for large-capacity plants is likely a myth [85]. In small- to medium-capacity BWRO systems, ZLD is feasible, but requires a means of salt disposal, which causes increased costs for both the additional energy for treatment and the solid waste disposal [86,87,88]. A number of methods have been proposed to lower the energy consumption and costs for ZLD, by combining various membrane and thermal processes [89,90,91,92,93,94]. All of the methods, either used or designed to date, cause a major increase in power consumption, resulting in higher water production costs [95]. Perhaps mitigation methods could be used to co-locate inland BWRO plants, where a number of industries require very-high-quality water for makeup water to produce steam or where valuable metals could be extracted from the waste stream.

5.6. Comparative Costs between BRWO and Seawater RO (SWRO) Costs

Over the past decade, the cost of SWRO has steadily decreased, based on the common use of energy recovery devices and the scale factor that is associated with the design and construction of very-large-capacity facilities [38]. The OPEX cost of some seawater plants has now fallen below BWRO OPEX costs for some of the larger facilities, in the 100,000 to 1,000,000 m3/d range. A key difference between the SWRO and BWRO facilities is the chemistry differences in the raw water supply, and the ability to design and construct very-large-capacity SWRO plants above 200,000 m3/d. The issue of concentrate disposal is another factor favoring a lower seawater desalination cost, where the disposal is back into the ocean. While equivalent-capacity plants will continue to show higher OPEX costs for BWRO, the trend will continue to reduce SWRO costs as the capacities grow. It is interesting to note that the use of seawater from groundwater sources should significantly reduce pretreatment, due to the lack of organic carbon in groundwater. However, the possible occurrence of hydrogen sulfide in the feedwater will necessitate its removal after membrane treatment, and thereby could cause an increase in the overall treatment cost.

6. Conclusions

An analysis of the actual BRWO CAPEX costs illustrates the vast variability based on the scope of the facility design. Commonly, the actual BWRO plant construction is only part of an overall project and cannot be easily separated. Other utility system improvements, spare pumps and membranes, specialized concentrate disposal systems, and other costs, are added to the overall CAPEX. Specialized pretreatment equipment to remove silica, iron, and manganese, and post-treatment equipment to remove hydrogen sulfide, can also cause CAPEX variability. A “normal” range in CAPEX is roughly USD 500–USD 600/m3 (USD 550–USD 660 with inflation correction). However, much greater costs can occur, such as the City of Cape Coral North Plant, which had a cost of over USD 2974/m3 (over USD 4000 with inflation), because of the various scope items funded under the project.
OPEX costs also vary considerably based on the site-specific water chemistry, electricity costs, and, to a degree, the scale factor that is associated with the plant capacity. One surprising observation is that in the feedwater TDS range of 2000 to 6000 mg/L, there is little difference in OPEX based on the low pressure of the membrane operation and the improvements made in the BWRO membrane design over the last few decades. However, there is a distinct scale trend with the unit cost reducing with increased capacity, as expected. Major OPEX difference increases occur in zero liquid discharge systems, at facilities located inland, away from the sea, or areas where inexpensive deep-well injection disposal is not an option.
Many BWRO facilities use groundwater for feed. In many locations, the groundwater tends to increase in salinity with time, as pumping induces upward and/or lateral migration of the higher salinity water. In the past, such changes in salinity would result in higher energy consumption to treat the water, but energy recovery systems may be used in the future to mitigate the increased salinity. However, once the TDS reaches some critical concentration, there will be a necessity to change the membrane to a higher-pressure type, with an inherent lower recovery and greater energy consumption. Then, the costs will rise eventually towards the SWRO costs.

Author Contributions

Conceptualization, T.M.M. and J.L.P.; investigation, J.L.P., P.R.M., N.G. and T.M.M.; writing—review and editing, J.L.P., P.R.M., N.G. and T.M.M.; supervision, T.M.M. All authors have read and agreed to the published version of the manuscript.

Funding

Funding for this research was provided by the Emergent Technologies Institute, U.A. Whitaker College of Engineering, Florida Gulf Coast University.

Institutional Review Board Statement

Not applicable.

Informed Consent Statement

Not applicable.

Data Availability Statement

Not applicable.

Acknowledgments

The cost of this research was funded by the U.A. Whitaker College of Engineering, Emergent Technologies Institute, Florida Gulf Coast University, and the Water Desalination and Reuse Center, Biological and Environmental Science and Engineering Division, King Abdullah University of Science and Technology. The authors thank the City of Cape Coral for providing cost data on their BWRO plants.

Conflicts of Interest

The authors declare no conflict of interest.

References

  1. United Nations Educational, Scientific and Cultural Organization (UNESCO). Water a Shared Responsibility: The United Nations Water Development Report 2; Berghahn Books: New York, NY, USA, 2007. [Google Scholar]
  2. van Weert, F.; van der Gun, J.; Reckman, J. Global Overview of Saline Groundwater Genesis; International Groundwater Assessment Centre Report GP 2009-1; Internationsl Groundwater Resources Assessment Center: Utrecht, The Netherlands, 2009. [Google Scholar]
  3. BRL Ingenerie and DHV Consultants. Seawater and Brackish-Water Desalination in the Middle East, North Africa, and Central Asia, A Review of Key Issues and Experience in Six Countries; Final Report for the World Bank; World Bank: Paris, France, 2004. [Google Scholar]
  4. Afonso, M.D.; Jaber, J.O.; Mohsen, M.S. Brackish groundwater treatment by reverse osmosis in Jorden. Desalination 2004, 164, 157–171. [Google Scholar] [CrossRef]
  5. Feth, J.H. Selected References on Saline Ground-Water Resources of the United States; U.S. Geological Survey: Reston, VA, USA, 1965. Available online: https://pubs.er.usgs.gov/publication/cir499 (accessed on 10 May 2021).
  6. Bush, P.W.; Ulery, R.L.; Rittmaster, R.L. Dissolved-Solids Concentrations and Hydrochemical Facies in Water of the Edwards-Trinity Aquifer System, West Central Texas; U.S. Geological Survey Water-Resources Investigation Report 93–4126. 1994. Available online: https://pubs.er.usgs.gov/publication/wri934126 (accessed on 10 June 2021).
  7. Busby, J.F.; Kimball, B.A.; Downey, J.S.; Peter, K.D. Geochemistry of Water in Aquifers and Confining Units of the Northern Great Plains in Parts of Montana, North Dakota, South Dakota, and Wyoming; U.S. Geological Survey Professional Paper 1402–F. 1995. Available online: https://pubs.er.usgs.gov/publication/pp1402F (accessed on 10 June 2021).
  8. AndrowskiJ, J.; Springer, A.; Acker, T.; Manone, M. Wind-powered desalination—An estimate of saline groundwater in the United States. J. Am. Water Res. Assoc. 2011, 47, 93–101. [Google Scholar] [CrossRef]
  9. Anning, D.W.; Bauch, N.J.; Gerner, S.J.; Flynn, M.E.; Hamlin, S.N.; Moore, S.J.; Schaefer, D.H.; Anderholm, S.K.; Spangler, L.E. Dissolved Solids in Basin-Fill Aquifers and Streams in the Southwestern United States (ver. 1.1, 22 March 2010). U.S. Geological Survey Scientific Investigations Report 2006–5315. 2010. Available online: https://pubs.er.usgs.gov/publication/sir20065315 (accessed on 10 June 2021).
  10. Thiros, S.A.; Paul, A.P.; Bexfiled, L.M.; Anning, D.W. The Quality of Our Nation’s Waters—Water Quality in Basin-Fill Aquifers of Southwestern United States: Arizona, California, Colorado, Nevada, New Mexico, and Utah, 1993–2009; US Geological Survey: Reston, VA, USA, 2014. [Google Scholar] [CrossRef]
  11. McMahon, P.B.; Böhlke, J.K.; Dahm, K.G.; Parkhurst, D.L.; Anning, D.W.; Stanton, J.S. Chemical considerations for an updated national assessment of brackish groundwater resources. Groundwater 2015, 54, 464–475. [Google Scholar] [CrossRef]
  12. Stanton, J.S.; Anning, D.W.; Brown, C.J.; Moore, R.B.; McGuire, P.B.; Degnan, J.R. Brackish Groundwater in the United States; U.S. Geological Survey Professional Paper 1833; U.S. Geological Survey: Reston, VA, USA, 2017.
  13. Qi, S.L.; Harris, A.C. Geochemical Database for the Brackish Groundwater Assessment of the United States; U.S. Geological Survey: Reston, VA, USA, 2017. [Google Scholar] [CrossRef]
  14. Lunin, J.; Gallatin, M.H.; Bower, C.A.; Wilcox, L.V. Use of Brackish Water for Irrigation in Humid Regions; U.S. Department of Agriculture, Agricultural Research Service, Agriculture Information Bulletin No. 213. 1960. Available online: https://naldc.nal.usda.gov/download/CAT87210399/PDF#:~:text=brackish%20water%20for%20irrigation.%20If%20soils%20have%20been,be%20used%20for%20the%20crop%20that%20is%20being (accessed on 14 June 2021).
  15. NRS Engineering Water Solutions. Guidance Manual for Brackish Groundwater Desalination in Texas; Texas Water Development Board: Austin, TX, USA, 2008. Available online: http://www.twdb.texas.gov/publications/reports/contractedreports/doc/0604830581_BrackishDesal.pdf (accessed on 14 June 2021).
  16. Bauder, T.A.; Waskom, R.M.; Sutherland, P.L.; Davis, J.G. Irrigation Water Quality Criteria; Colorado State University Extension Fact Sheet 0.506; Colorado State University: Fort Collins, CO, USA, 2014; Available online: http://extension.colostate.edu/topic-areas/agriculture/irrigation-water-quality-criteria-0-506/ (accessed on 20 May 2021).
  17. National Research Council. Desalination: A National Perspective; The National Academies Press: Washington, DC, USA, 2008. [Google Scholar]
  18. Mickley, M. US municipal desalination plants—Number, types, locations, sizes, and concentrate management practices. J. Desal. Water Reuse 2012, 4, 44–51. [Google Scholar] [CrossRef]
  19. Mickley, M. Updated and Extended Survey of U.S. Municipal Desalination Plants; Desalination and Water Purification Research and Development Program Report No. 27; U.S. Department of Interior, Bureau of Reclamation, Technical Service Center: Denver, CO, USA, 2018.
  20. Florida Department of Environmental Protection (FDEP). Desalination in Florida: Technology, Implementation, and Environmental Issues; Florida Department of Environmental Protection, Division of Water Resource Management: Tallahassee, FL, USA, 2010. Available online: https://ufdimages.uflib.ufl.edu/UF/00/10/82/00001/desalination-in-florida-report.pdf (accessed on 20 May 2021).
  21. South Florida Water Management District (SFWMD). Facilities Using Brackish Groundwater and Seawater in South Florida; South Florida Water Management District: West Palm Beach, FL, USA, 2019. Available online: https://www.sfwmd.gov/sites/default/files/2019 (accessed on 20 May 2021).
  22. Nicot, J.-P.; Walden, S.; Greenlee, L.; Els, J. A Desalination Database for Texas; Report Prepared for the Texas Water Development Board; Texas Bureau of Economic Geology: Austin, TX, USA, 2006; Available online: www.beg.utexas.edu/files/content/beg/research/water-energy-nexus/Final%20Report_R1_1.pdf (accessed on 20 May 2021).
  23. Maupin, M.A.; Kenny, J.F.; Hutson, J.S.S.; Lovelace, J.K.; Barber, N.L.; Linsey, K.S. Estimated Use of Water in the United States in 2010; U.S. Geological Survey Circular 1405; Reston, VA, USA, 2014. Available online: https://pubs.er.usgs.gov/publication/cir1405 (accessed on 15 June 2021).
  24. U.S. Department of Interior, Office of Saline Water. A Standardized Procedure for Costs of Saline Water Conversion; U.S. Department of Interior, Office of Saline Water: Washington, DC, USA, 1956.
  25. U.S. Department of the Interior, Office of Saline Water. Guidelines for Uniform Presentation of Desalting Cost Estimates; U.S. Department of Interior, Office of Saline Water: Washington, DC, USA, 1967.
  26. U.S. Office of Water Research and Technology. Desalting Handbook for Planners; U.S. Office of Water Research and Technology: Washington, DC, USA, 1972.
  27. U.S. Office of Water Research and Technology. Desalting Handbook for Planners, 2nd ed.; U.S. Office of Water Research and Technology: Washington, DC, USA, 1979.
  28. Leitner, G.M. International Desalination Association Desalting Costs Program, Brackish and Seawater; International Desalination Association: Topsfield, MA, USA, 1990. [Google Scholar]
  29. Chapman-Wilbert, M. The Desalting and Water Treatment Membrane Manual: A Guide to Membranes for Municipal Water Treatment, 2nd ed.; Water Treatment and Technology Program Report No. 29; U.S. Department of Interior, Bureau of Reclamation: Denver, CO, USA, 1998.
  30. U.S. Department of Interior, Bureau of Reclamation. Water Treatment Cost Estimation Routine; U.S. Department of Interior, Bureau of Reclamation: Denver, CO, USA, 1999.
  31. International Atomic Energy Agency. Desalination Economic Evaluation Program (DEEP); International Atomic Energy Agency: Vienna, Austria, 2000; Available online: https://www.iaea.org/publications/6049/desalination-economic-evaluation-program-deep (accessed on 10 July 2021).
  32. Moch, I.M.; Chapman, D.; Steward, D. WTCost—A computerized water treatment cost estimating program. In Proceedings of the International Desalination Association International Conference on Desalination and Water Reuse, Lanaca, Cyprus, 6–8 December 2004. [Google Scholar]
  33. Watson, I.; Morin, O.J.; Henthorne, L. Desalting Handbook for Planners, 3rd ed.; Desalination and Water Purification Research and Development Program Report No. 72; U.S. Department of Interior, Bureau of Reclamation: Denver, CO, USA, 2003.
  34. Adham, S.; Kumar, M.; Pearce, B. Development of a Model for Brackish and Reclaimed Water Membrane Desalination Costs; Desalination Research and Innovation Partnership (DROIP): Washington, DC, USA, 2004. [Google Scholar]
  35. Middle East Desalination Research Center (MEDRC). International Desalination Conference on Desalination Costing; Middle East Desalination Research Center: Muscat, Oman, 2004. [Google Scholar]
  36. Reddy, K.V.; Ghaffour, N. Over of the cost of desalinated water and costing methodologies. Desalination 2007, 205, 340–353. [Google Scholar] [CrossRef]
  37. Montgomery Water & Harza. Brackish Ground Water Desalination Treatment Process Evaluation & Cost Model Development/Guidance Tool; Final Report, Report Prepared for the City of San Diego; Montgomery Water & Harza: San Diego, CA, USA, 2008. [Google Scholar]
  38. Moch, I.; Querns, W.R.; Stewart, D. Modeling the Capital and Operating Costs of Thermal Desalination Processes Utilizing a Recently Developed Computer Program that Evaluates Membrane Desalting, Electrodialysis, and Ion Exchange Plants; U.S. Department of Interior, Bureau of Reclamation, Technical Service Center, Denver Federal Center: Denver, CO, USA, 2008.
  39. Huehmer, R. Cost modeling of desalination systems. In Proceedings of the International Desalination Association World Conference on Desalination and Reuse, Perth, Australia, 4–9 September 2011. [Google Scholar]
  40. Frenkel, V. Consideration for the Co-Siting of Desalination Facilities with Municipal and Industrial Facilities; Final Project Report and Decisions Tool; WateReuse Research Foundation: Alexandria, VA, USA, 2012. [Google Scholar]
  41. Ghaffour, N.; Missimer, T.M.; Amy, G.L. Technical review and evaluation of the economics of water desalination: Current and future challenges for better water supply sustainability. Desalination 2013, 9, 197–207. [Google Scholar] [CrossRef] [Green Version]
  42. Harvey, N.J.; Missimer, T.M. Impacts of projected changes in feedwater salinity on the City of Cape Coral, Florida north brackish-water reverse osmosis desalination plant operation. Desalin. Water Treat. 2020, 181, 1–16. [Google Scholar] [CrossRef]
  43. Arroyo, J.; Shirazi, S. Cost of Brackish Water Desalination in Texas. Innovation Technologies; Texas Water Development Board: Austin, TX, USA, 2012. Available online: https://www.twdb.texas.gov/innovativewater/desal/doc/CostofDesalinationinTexas.pdf (accessed on 10 April 2021).
  44. U.S. Department of the Interior, Bureau of Reclamation (USBOR). Estimating the Cost of Brackish Groundwater Desalination in Texas; U.S. Department of the Interior, Bureau of Reclamation, Water Treatment Engineering Research Group: Denver, CO, USA, 2014.
  45. Judd, S.J. Membrane technology costs and me. Water Res. 2017, 122, 1–9. [Google Scholar] [CrossRef]
  46. Arras, W.; Ghaffour, N.; Hamou, A. Performance evaluation of a BWRO desalination plant—A case study. Desalination 2009, 235, 170–178. [Google Scholar] [CrossRef]
  47. Harvey, N.J.; Johnston, D.; Missimer, T.M. Long-term pumping-induced groundwater quality changes at a brackish-water desalination facility, Sanibel Island, Florida. Desalin. Water Treat. 2020, 202, 1–13. [Google Scholar] [CrossRef]
  48. Johnson Engineering. Green Meadows Water Treatment Plant Expansion/Upgrade; Report to the Lee County, Florida Utilities Department, FL, USA, 2018. Available online: https://johnsonengineering.com/blog/green-meadows-water-treatment-plant-expansion-upgrade (accessed on 10 April 2021).
  49. Carollo Engineering. North Lee County Water Treatment Plant Rehabilitation and Expansion; Report to Lee County; Florida Utilities Department. 2012. Available online: https://www.carollo.com/projects/north-lee-county-water-treatment-plant-rehabilitation-and-expansion (accessed on 10 April 2021).
  50. Missimer, T.M.; Martin, W.K. Hydrogeology of Lee County, Florida. In Geology and Hydrology of Lee County, Florida; Missimer, T.M., Scott, T.M., Eds.; Florida Geological Survey Special Publication 49; Florida Geological Survey: Tallahassee, FL, USA, 2001; pp. 91–137. [Google Scholar]
  51. Carollo Engineering. Pinewoods Nanofiltration WTP Rehabilitation and Brackish Reverse Osmosis Expansion; Report to the Lee County; Florida Utilities Department. Available online: https://www.carollo.com/projects/pinewoods-nanofiltration-wtp-rehabilitation-and-brackish-reverse-osmosis-expansion (accessed on 10 April 2021).
  52. City of Marco Island South Water Treatment Plant. 2019. Available online: https://www.cityofmarcoisland.com/watersewer/page/south-water-treatment-plant (accessed on 10 April 2021).
  53. Texas Water Development Board. Uniform Costing Model User’s Guide; Texas Water Development Board: Austin, TX, USA, 2018.
  54. Atab, M.S.; Smallbone, A.J.; Roskilly, A.P. An operational and economic study of a reverse osmosis desalination system for potable water and land irrigation. Desalination 2016, 397, 174–184. [Google Scholar] [CrossRef] [Green Version]
  55. Voutchkov, N. Desalination Cost Trends, from Cost Estimating of SWRO Desalination Plants; Middle East Desalination Research Center (MEDRC): Muscat, Oman, 2012. [Google Scholar]
  56. Wilf, M.; Awerbach, L.; Bartels, C.; Mickley, M.; Pearce, G.; Voutchkov, N. The Guide to Membrane Desalination Technology; Balaban Desalination Publications: L’Aquila, Italy, 2007. [Google Scholar]
  57. Al-Karaghouli, A.; Kazmerski, L.L. Energy consumption and water production cost of conventional and renewable-energy-powered desalination processes. Renew. Sustain. Energy Rev. 2013, 24, 343–356. [Google Scholar] [CrossRef]
  58. Zarzo, D.; Campos, E.; Terrero, P. Spanish experience in desalination agriculture. Desalin. Water Treat. 2012, 51, 53–66. [Google Scholar] [CrossRef]
  59. Chaudhry, S. Unit Cost of Desalination; California Desalination Task Force, California Energy Commission: Sacramento, CA, USA, 2003.
  60. Drak, A.; Adato, M. Energy recovery consideration in brackish water desalination. Desalination 2014, 239, 34–39. [Google Scholar] [CrossRef]
  61. Martin, J.; Eisberg, D. Brackish Water Desalination—Energy and Cost Considerations. 2014. Available online: www.energyrecovery.com/wp-content/uploads/2014/12/ (accessed on 15 July 2021).
  62. Missimer, T.M. Water Supply Development, Aquifer Storage and Concentrate Disposal for Membrane Water Treatment Facilities, 2nd ed.; Methods in Water Resources Evaluation Series No. 1; Schlumberger Media: Sugar Land, TX, USA, 2009. [Google Scholar]
  63. Drendal, R.; Kinzli, K.D.; Koebel, A.; Missimer, T.M. Management of brackish water desalination systems using long-term monitoring of feed water quality. Desalin. Water Treat. 2016, 57, 16209–16219. [Google Scholar] [CrossRef] [Green Version]
  64. Mead, E.; Victory, J.; Missimer, T.M. Changes in feed water salinity with pumping in wellfields used to supply a brackish water RO facility at the City of Fort Myers, Florida. Desalin. Water Treat. 2020, 171, 1–12. [Google Scholar] [CrossRef]
  65. Schroeder, D.W.; Thomson, A.; Missimer, T.M. Characterization change of the production aquifer affects the successful design and operation of a brackish-water reverse osmosis plant over the lifespan of the facility, The Town of Jupiter, Florida. Desalin. Water Treat. 2021, 227, 1–15. [Google Scholar] [CrossRef]
  66. Schroeder, D.W.; Missimer, T.M. Production aquifer water salinity change impacts on brackish-water reverse osmosis desalination facility process design: The City of Clewiston, Florida. Desalin. Water Treat. 2021. [Google Scholar] [CrossRef]
  67. Chen, Y.-W.; Chen, J.-F.; Lin, C.-H.; Hou, C.-H. Integrating a supercapacitor with capacitive deionization for direct energy recovery from the desalination of brackish water. Appl. Energy 2019, 252, 113417. [Google Scholar] [CrossRef]
  68. Zhao, S.; Liao, Z.; Fane, A.; Li, J.; Tang, C.; Zheng, C.; Liu, J.; Kong, L. Engineering antifouling reverse osmosis membranes: A review. Desalination 2021, 499, 114857. [Google Scholar] [CrossRef]
  69. Honarparvar, S.; Zhang, X.; Chen, T.; Alborzi, A.; Afroz, K.; Reible, D. Frontiers of membranes desalination processes for brackish water treatment: A review. Membranes 2021, 11, 246. [Google Scholar] [CrossRef]
  70. Pramanik, B.K.; Gao, Y.; Fan, L.; Roddick, F.A.; Liu, Z. Antiscaling effect of polyaspartic acid and its derivative for RO membranes used for saline wastewater and brackish water desalination. Desalination 2017, 404, 224–229. [Google Scholar] [CrossRef]
  71. Sweity, A.; Zere, T.R.; David, I.; Bason, S.; Oren, Y.; Ronen, Z.; Herzberg, M. Side effects of antiscalants on biofouling of reverse osmosis membranes in brackish water desalination. J. Membr. Sci. 2015, 481, 172–187. [Google Scholar] [CrossRef]
  72. Rabizadeh, T.; Morgan, D.J.; Peacock, C.L.; Benning, L.G. Effectiveness of green additives vs poly (acrylic acid) in inhibiting calcium sulfate dihydrate crystallization. Ind. Eng. Chem. Res. 2019, 58, 1561–1569. [Google Scholar] [CrossRef]
  73. Jaramillo, H.; Boo, C.; Hashmi, S.M.; Elimelech, M. Zwitterionic coating on thin-film composite membranes to delay gypsum scaling in reverse osmosis. J. Membr. Sci. 2021, 618, 118568. [Google Scholar] [CrossRef]
  74. Yu, W.; Song, D.; Li, A.; Yang, H. Control of gypsum-dominated scaling in reverse osmosis system using carboxymethyl cellulose. J. Membr. Sci. 2019, 577, 20–30. [Google Scholar] [CrossRef]
  75. Rahmawati, K.; Ghaffour, N.; Aubry, C.; Amy, G.L. Boron removal efficiency from Red Sea water using different SWRO/BWRO membranes. J. Membr. Sci. 2012, 423–424, 522–529. [Google Scholar] [CrossRef]
  76. Katz, W.E. The electrodialysis reversal (EDR) process. Desalination 1979, 28, 31–40. [Google Scholar] [CrossRef]
  77. Mei, Y.; Tang, C.Y. Recent developments and future perspectives of reverse electrodialysis technology: A review. Desalination 2018, 425, 156–174. [Google Scholar] [CrossRef]
  78. Turek, M.; Dydo, P. Electrodialysis reversal of calcium sulphate and calcium carbonate supersaturated solution. Desalination 2003, 158, 91–94. [Google Scholar] [CrossRef]
  79. Missimer, T.M.; Watson, I.; Maliva, R.G.; Ghafour, N.; Dehwah, A.H.A.; Woolschlager, J.; Hegy, M. Impacts of natural pore-water an offshore aquifer chemistry on the operation and economics of some subsurface intake types for SWRO plants. Desalin. Water Treat. 2018, 132, 1–9. [Google Scholar] [CrossRef]
  80. Rathinam, K.; Abraham, S.; Oren, Y.; Schwahn, D.; Petry, W.; Kaufman, Y.; Kasher, R. Surface-induced silica scaling during brackish water desalination: The role of surface charge and specific chemical groups. Environ. Sci. Technol. 2019, 53, 5202. [Google Scholar] [CrossRef]
  81. Lu, K.-G.; Huang, H. Dependence of initial silica scaling on the surface physiochemical properties of reverse osmosis membranes during bench-scale brackish water desalination. Water Res. 2019, 150, 358–367. [Google Scholar] [CrossRef]
  82. Bush, J.A.; Vanneste, J.; Gustafson, E.M.; Waechter, C.A.; Jassby, D.; Turchi, C.S.; Cath, T.Y. Prevention and management of silica scaling in membrane distillation using pH adjustment. J. Membr. Sci. 2018, 554, 366–377. [Google Scholar] [CrossRef]
  83. Neofotisou, E.; Demadis, K.D. Use of antiscalants for mitigation of silica fouling and deposition: Fundamental and applications in desalination systems. Desalination 2004, 167, 257–272. [Google Scholar] [CrossRef]
  84. Den, W.; Wang, C.J. Removal of silica from brackish water by electrocoagulation pretreatment to prevent fouling of reverse osmosis membranes. Sep. Purif. Technol. 2008, 59, 318–325. [Google Scholar]
  85. Tsai, J.-H.; Macedonio, F.; Drioli, E.; Giorno, L.; Chou, C.-Y.; Hu, F.-C.; Li, C.-L.; Chuang, C.-J.; Tung, K.-L. Membrane-based zero liquid discharge: Myth or reality? J. Taiwan Inst. Chem. Eng. 2017, 80, 192–202. [Google Scholar] [CrossRef]
  86. Qiu, T.; Davies, P.A. Comparison of configurations for high-recovery inland desalination systems. Water 2012, 4, 690–706. [Google Scholar] [CrossRef] [Green Version]
  87. Giwa, A.; Dufour, V.; Al Marzooqi, F.; Al Kaabi, M.; Hasan, S.W. Brine management methods: Recent innovations and current status. Desalination 2017, 407, 1–23. [Google Scholar] [CrossRef]
  88. Bond, R.; Warner, J. Zero Liquid Discharge; The Water Research Foundation: Alexandria, VA, USA, 2011. [Google Scholar]
  89. Bond, R.; Batchelor, B.; Davis, T.; Klayman, B. Zero liquid discharge desalination of brackish water with an innovative form of electrodialysis: Electrodialysis metathesis. Fla. Water Resour. J. 2011, 63, 36–44. [Google Scholar]
  90. Efraty, A. Closed circuit desalination series no-3: High recovery low energy desalination of brackish water by a new two-mode consecutive sequential method. Desalin. Water Treat. 2012, 42, 256–261. [Google Scholar]
  91. Loganathan, K.; Chelme-Ayala, P.; Gamal El-Din, M. Treatment of basal water using a hybrid electrodialysis reversal–reverse osmosis system combined with a low-temperature crystallizer for near-zero liquid discharge. Desalination 2015, 363, 92–98. [Google Scholar] [CrossRef]
  92. Zhang, C.; Shi, Y.; Li, H.; Li, R.; Hong, S.; Zhuo, S.; Zhang, T.; Wang, P. Designing a next generation solar crystallizer for real seawater brine treatment with zero liquid discharge. Nat. Commun. 2021, 12, 998. [Google Scholar] [CrossRef]
  93. van Wyk, S.; van der Ham, A.G.J.; Kersten, S.R.A. Potential of supercritical water desalination (SCWD) as zero liquid discharge (ZLD) technology. Desalination 2020, 495, 114593. [Google Scholar] [CrossRef]
  94. Odu, S.O.; van der Ham, A.G.J.; Metz, S.; Kersten, S.R.A. Design of a process for supercritical water desalination with zero liquid discharge. Ind. Eng. Chem. Res. 2015, 54, 5527–5535. [Google Scholar] [CrossRef]
  95. Son, H.S.; Soukane, S.; Lee, J.; Kim, Y.; Kim, Y.-D.; Ghaffour, N. Towards sustainable circular brine reclamation using seawater reverse osmosis, membrane distillation and forward osmosis hybrids: An experimental investigation. J. Environ. Manag. 2021, 293, 112836. [Google Scholar] [CrossRef]
Figure 4. Diagram of total water cost components.
Membranes 11 00616 g004
Figure 5. Produced water from seven BWRO plants in Southwest Florida in megaliters from 2017 to 2019. Note that the Lee Green Meadows RO Plant began operating in May 2018; no data were available for 2017 and January–April 2018.
Membranes 11 00616 g005
Figure 6. Southwest Florida RO desalination plant cost of water produced in (USD/m³). Note: the Lee County Green Meadows RO Plant began operating in May 2018; therefore, no data were available for 2017 and January–April 2018. Note that the consumer price index for the 3 years was 6.3% or slightly over 2%/year.
Membranes 11 00616 g006
Figure 7. Comparison of the CAPEX costs for nine BWRO plants in Texas to the cost curves developed by Unified Costing Model [53] and the Desalting Handbook for Planners [33]. This cost model has not been corrected for the consumer cost increase from when the model was created to the current cost.
Membranes 11 00616 g007
Figure 8. Comparison of the OPEX costs for nine BWRO plants in Texas to the cost curves developed by the Unified Costing Model [53] and the Desalting Handbook for Planners [30]. Note the cost increase may have occurred at these utilities since the data were compiled for use in the model until current conditions.
Membranes 11 00616 g008
Figure 9. U.S. and global OPEX cost for various plant capacities. Note the extreme scatter of data based on the arithmetic plot. The R2 value of the trend line is poor, with the data having a standard deviation of 0.13 m2/d, but shows a reducing unit cost as capacity increases. Note that these costs are not corrected for local inflation, which may not directly correlate with increased costs to consumers (e.g., foreign water subsidies).
Membranes 11 00616 g009
Figure 10. Plot of capacity versus total OPEX cost/day. Note that this plot shows a better fit to the trend line with a high R2 value. The equation for the trend line has a slope of less than one-to-one, which is indicative of a lower unit cost with a larger capacity. Therefore, scaling of capacity is an important economic factor. Note that these costs are not corrected for local inflation, which may not directly correlate with increased costs to consumers (e.g., foreign water subsidies).
Membranes 11 00616 g010
Table 1. Total CAPEX costs for the City of Cape Coral North RO Plant were constructed beginning in 2006 and completed in 2010. The initial capacity of the plant was 45,420 m³/day, with the facility designed to be expanded to 113,550 m³/day.
Work AuthorizationNorth Cape Coral BWRO Facility Costs (USD)
Site Master Plan449,500
Site Common Facilities Design317,736
Permitting241,647
North RO Water Treatment Plant Design3,566,654
North RO Water Treatment Plant Site and Civil6,071,679
North RO Plant Construction92,804,241
North RO Deep-Well Injection Design131,552
North RO Deep Injection Well Construction9,556,963
North RO Wellfield Design439,417
North RO Wellhead and Generator Design809,482
North RO Wells and Generator Construction6,022,448
North RO Raw Water Transmission Design1,640,916
North RO Central Loop Raw Water Transmission Construction2,525,476
Summary
Total Design, Planning and Construction Cost124,577,711
Total Land Cost4,601,466
Total Program Management Cost4,668,183
Total North RO Plant Cost133,847,360
Table 2. Comparison of capacities, feedwater TDS, range in OPEX over 3 years, and average cost over 3 years. Note that the Lee County Pinewoods Plant has less than 3 years of data. Note that the general increase in cost correlates well with the annual rate of inflation of 2%/year.
PlantCapacity (m3/d)Avg. Feedwater TDS (mg/L)Range in OPEX (USD/m3)Average OPEX (USD/m3)
City of Cape Coral North45,42024520.48–0.520.50
City of Cape Coral Southwest68,13021320.32–0.400.36
Island Water Association22,61728000.62–0.660.64
Lee County Green Meadows IX & RO60,56029130.40–0.450.425
Lee County North43,906None Reported0.42–0.530.475
Lee County Pinewoods RO & NF20,06038480.41–0.470.44
Marco Island22,710None Reported0.39–0.470.43
Table 3. BWRO plants in Texas USA (recalculated from Arroyo and Shirazi [43], original costs in year constructed). Note that the compiled consumer cost index increase from 2002 to 2020 is about 38% or close to 2%/year in the US.
Plant NameYear BuiltBWRO Capacity (m3/d)Capacity with Blend (m3/d)Feed Water TDS (mg/L)PretreatmentPost TreatmentTotal Cost (USD × 106)Cost USD/m3 without BLENDCost USD/m3 with BlendOPEX (USD/m3)Power Cost USD/kWh
NAWSC Victoria2012757685233800NANA3.7(?)488(?)434(?)--
NAWSC Doolittle200811,36413,2582500–3000CF, CAGas removal, pH adj., DI87046030.290.069
NAWSC Owassa2008568275762500–3000CFGas removal, pH adj.5.8510307720.350.059
Fort Hancock WCID20121894NA2000–2400CFNA3.3751782NA0.860.082
Roscoe2013136418943800NANA0.9747145140.230.07
Kay Bailey Hutchinson200756,818102,2722000–3000CF, scaling controlpH adj., corrosion control, DI9116028900.400.0835
North Cameron Regional2007378847353500CF, CAGas removal, pH adj., DI7184814780.630.08
North Cameron Regional2007757694703500CF, CAGas removal, pH adj., DI810568450.470.08
Southmost200422,72728,4093500CF, CA, AntiscalantGas removal, pH adj., CC, DI2310128100.540.0749
NAWSC Lasara2005378845452500–3000CF, CAGas removal, pH adj., DI15284400.630.072
North Alamo WSC Donna20129470NA3800NANA6.7707NA0.370.7
Table 4. OPEX cost data for various BWRO plants. Uncorrected for local inflation costs since construction.
Plant Capacity (m3/d)Total Dissolved Solids Concentration (mg/L)Cost (USD/m3)Source
<20-5.08–11.55Atab [51]
5057007.24Voutchkov [52]
20–1200-0.69–1.19Atab [51]
600081160.34Wilf [53]
10,00042210.23Wilf [53]
19,000-0.23Atab [51]
30,0005844–11,6880.28Wilf [53]
38,000-0.19Atab [51]
~38,00010,0000.54Al-Karaghouli [54]
~38,00030000.32Al-Karaghouli [54]
40,000–46,000-0.23–0.48Atab [51]
46,00050000.26Zarzo [55]
5000–60,000-0.23–0.48Chandhry [56]
Publisher’s Note: MDPI stays neutral with regard to jurisdictional claims in published maps and institutional affiliations.

