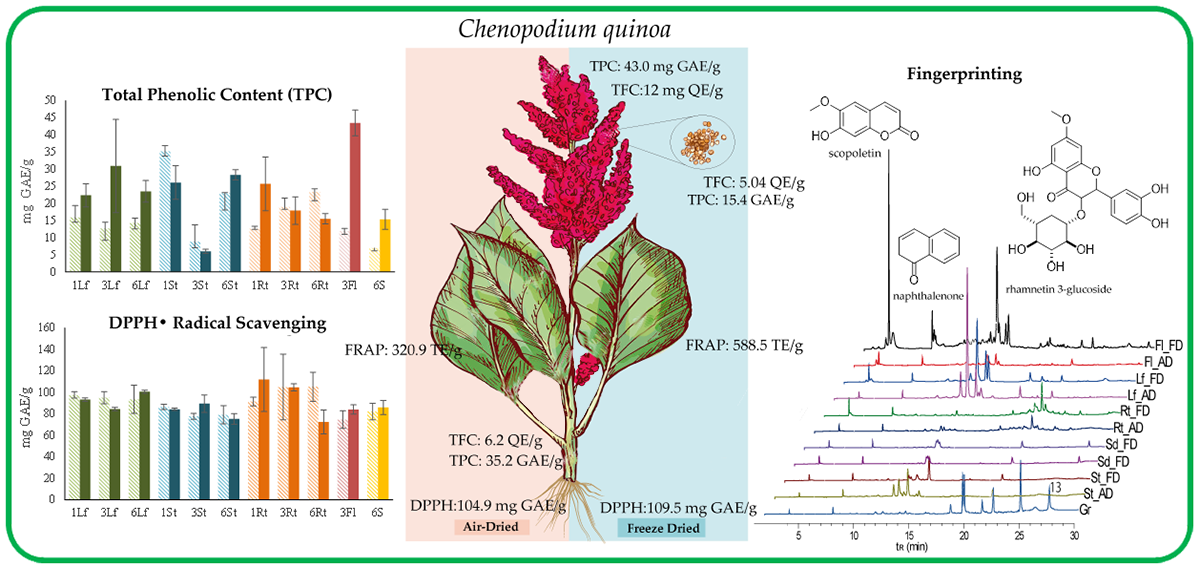
Comparative Examination of Antioxidant Capacity and Fingerprinting of Unfractionated Extracts from Different Plant Parts of Quinoa (Chenopodium quinoa) Grown under Greenhouse Conditions


Abstract
:
1. Introduction
2. Materials and Methods
2.1. Plant Material and Raw Plant Material Preparation
2.2. Extract Preparation
2.3. Determination of Antioxidant Capacity, TPC, and TFC of Ethanolic Extracts
2.3.1. DPPH Radical Scavenging and Ferric Reducing Antioxidant Power (FRAP) Assays
2.3.2. Total Phenol Content (TPC) and Total Flavonoid Content (TFC)
2.3.3. Data Analysis
2.4. Metabolite Fingerprinting
2.4.1. Liquid Chromatography hyphenated with Photodiode-Array Detection and Electrospray Ionization Mass Spectrometry (LC-DAD-ESI-MS) Analysis
2.4.2. Multivariate Statistical Analysis
3. Results and Discussion
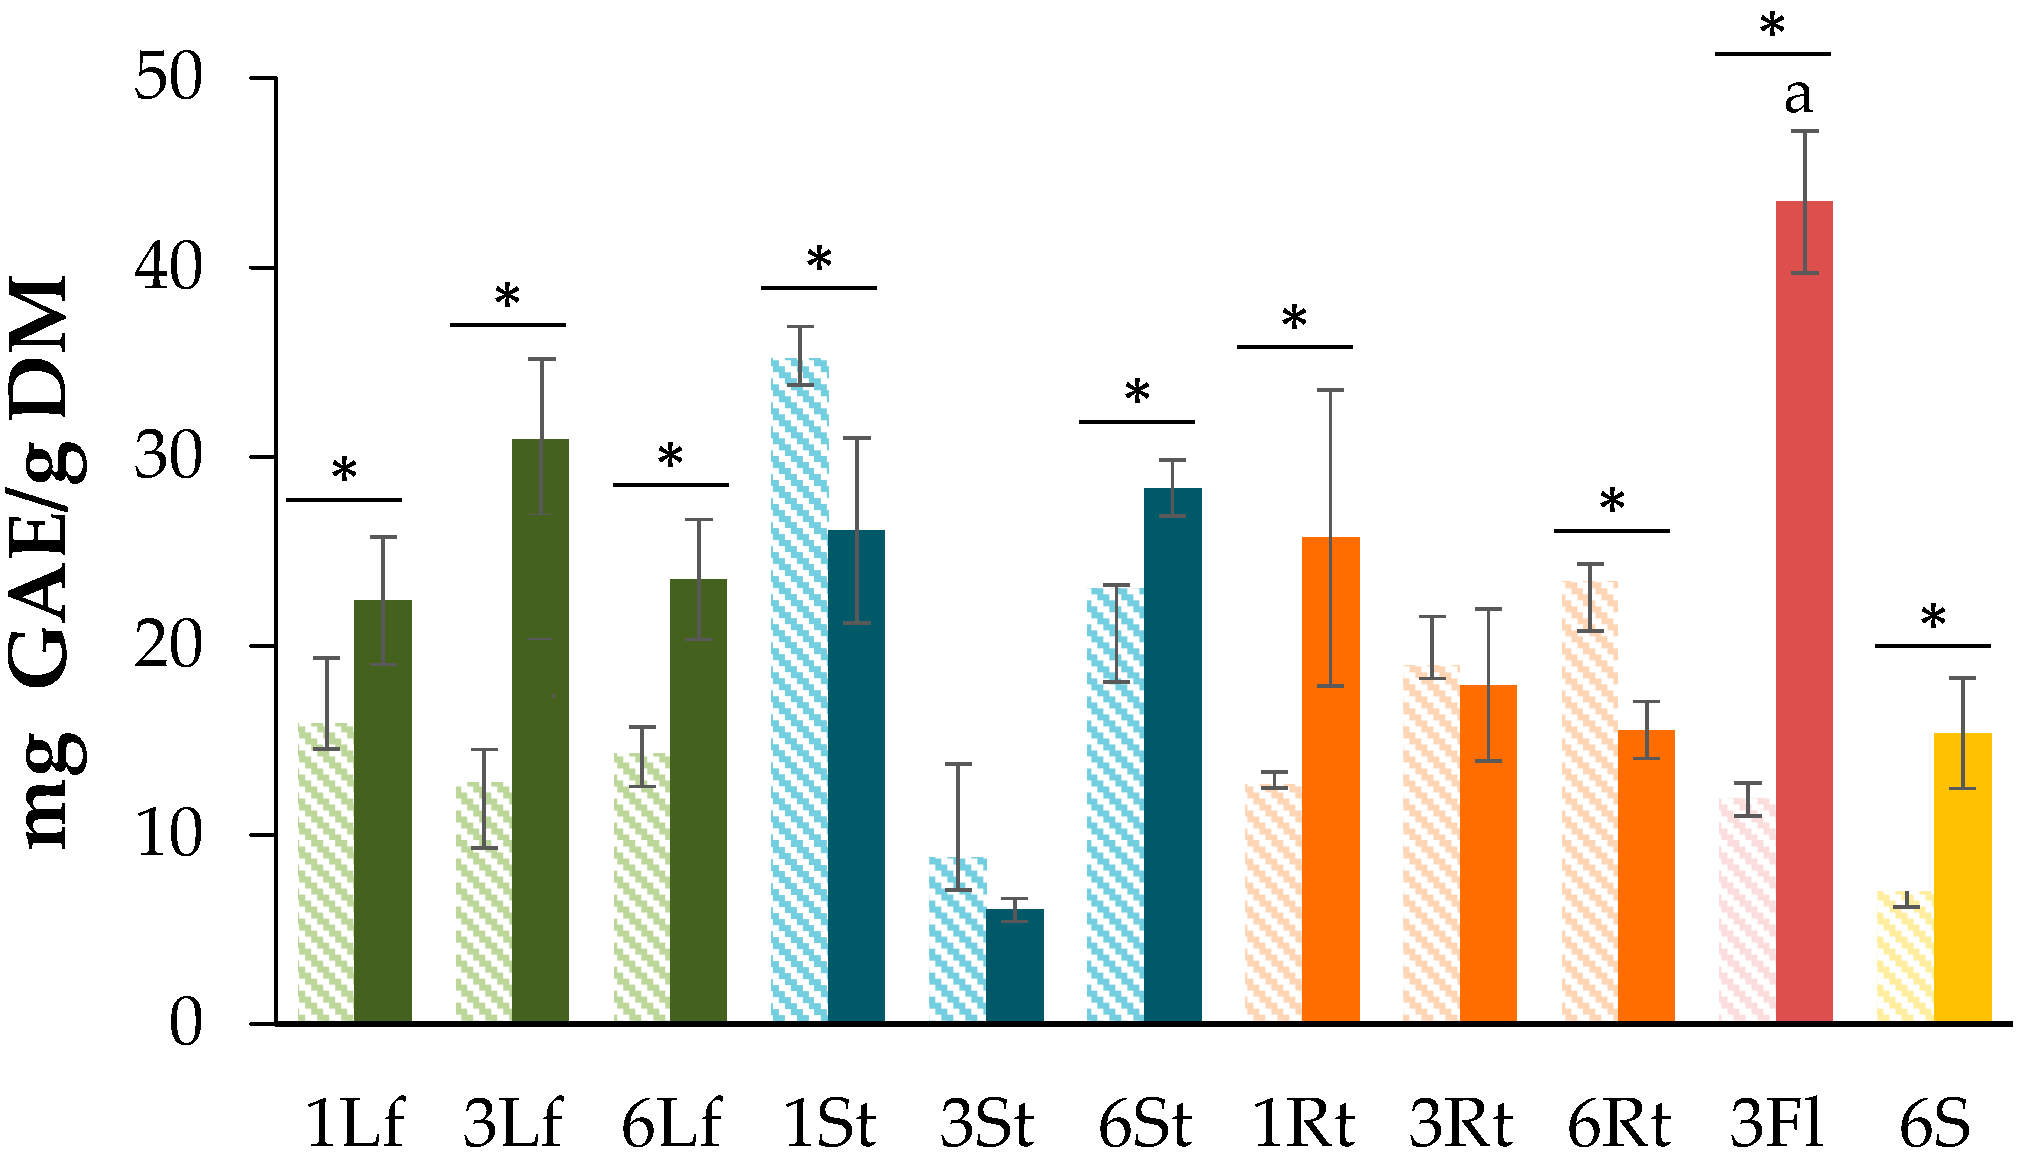
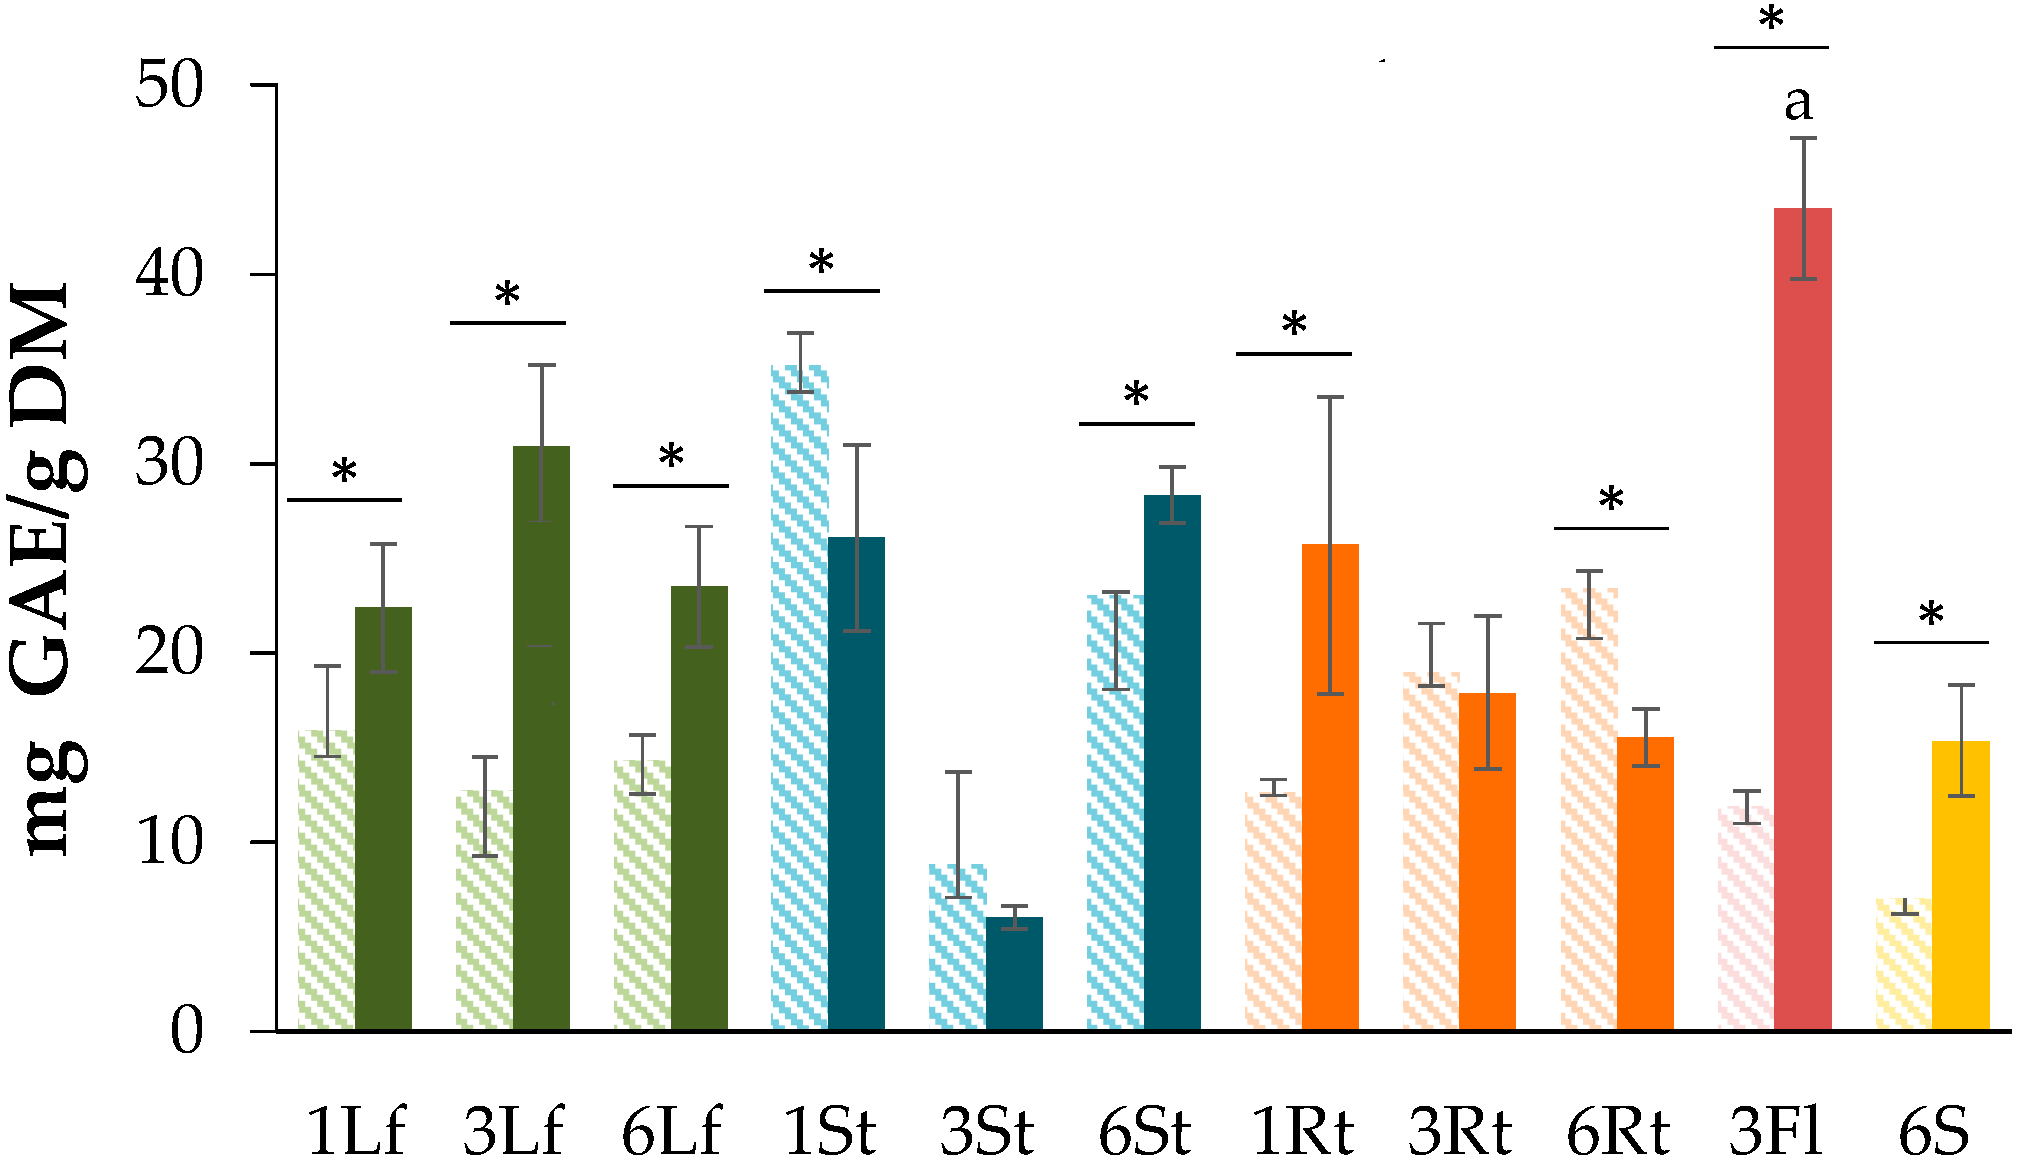
3.1. Determination of Total Phenolic Content (TPC)
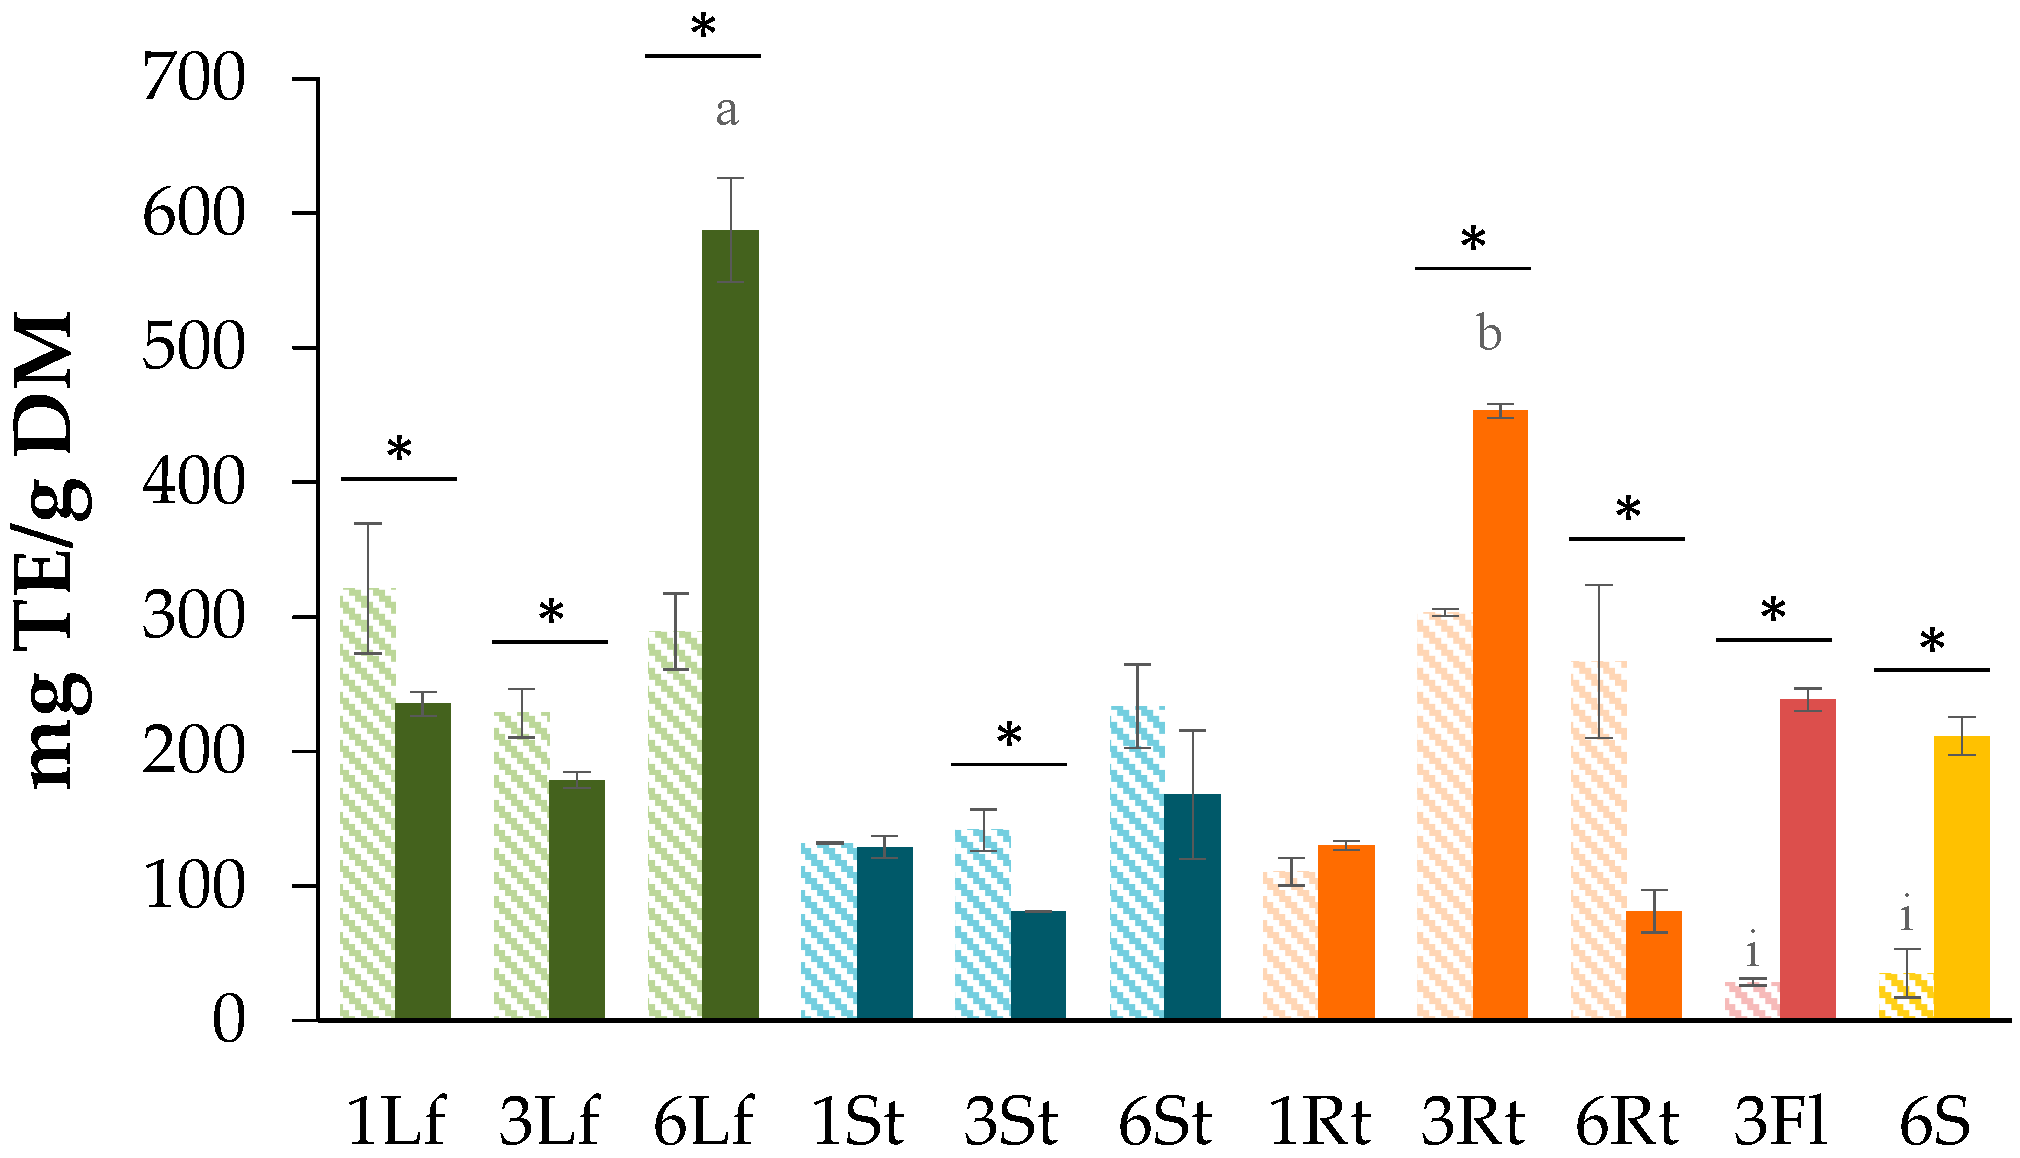
3.2. Determination of Total Flavonoid Content (TFC)
3.3. Evaluation of the Antioxidant Capacity
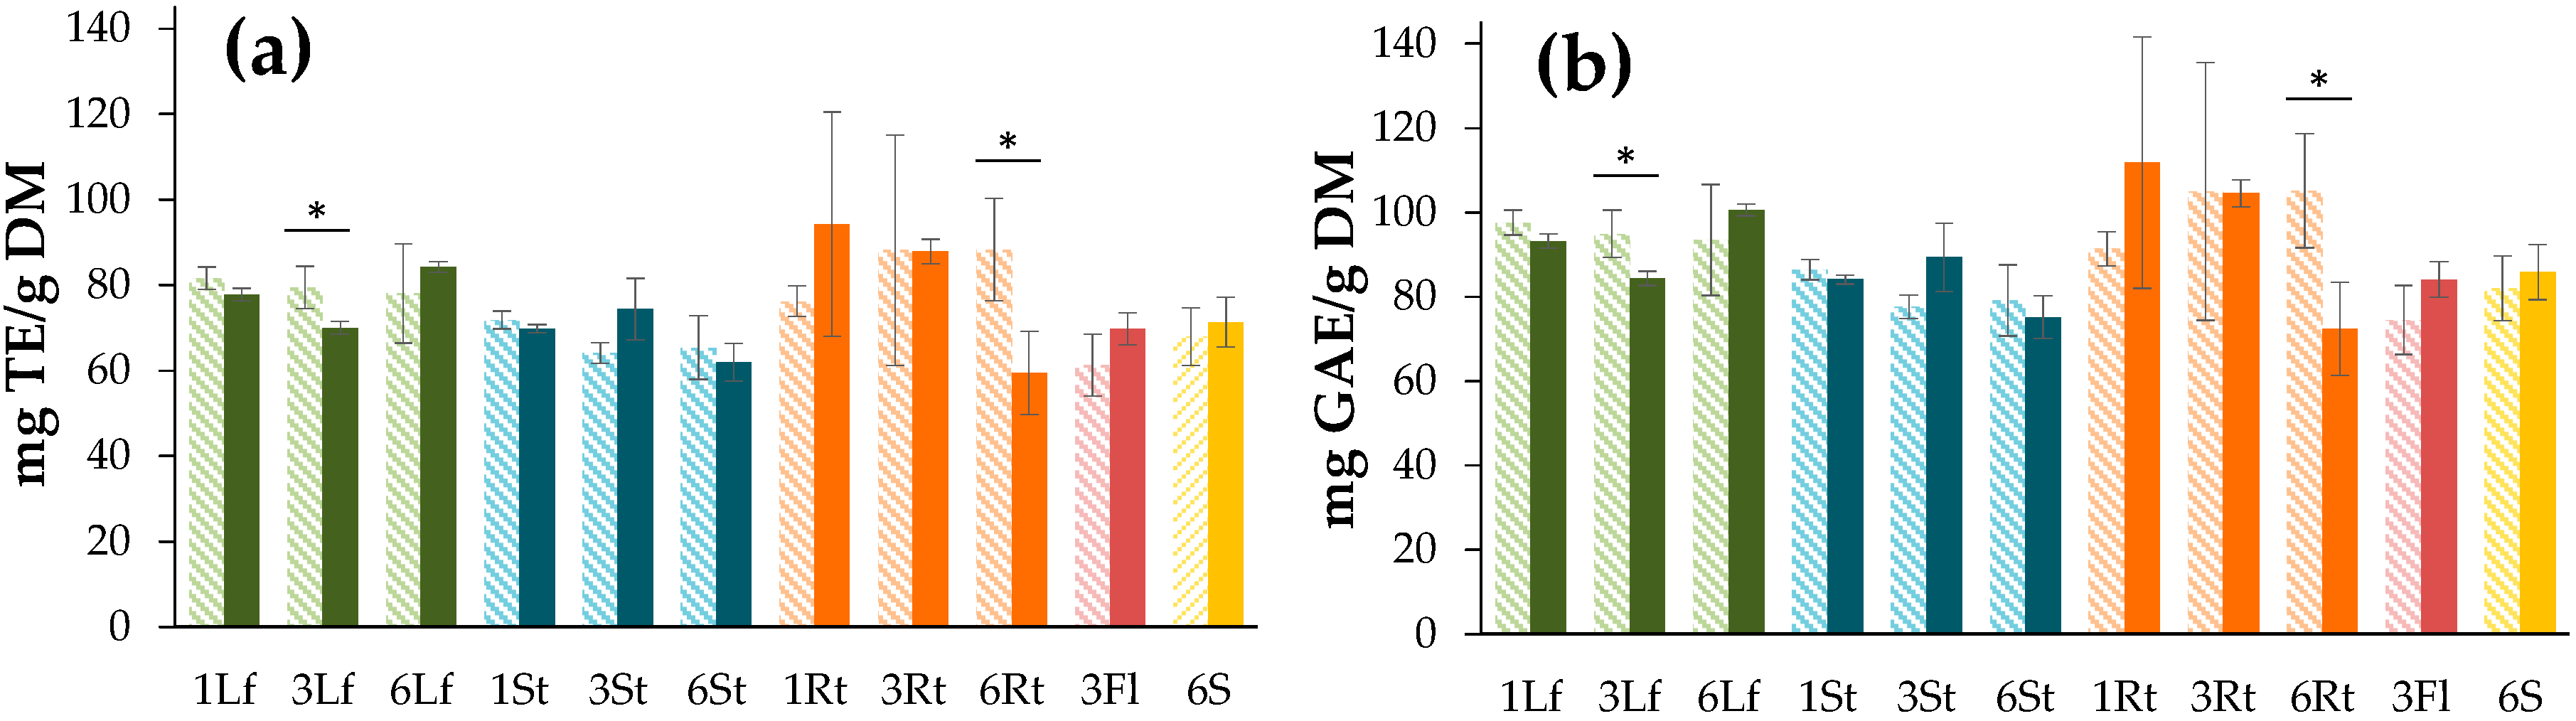
3.3.1. DPPH Free Radical Scavenging Assay
3.3.2. Ferric-Reducing Antioxidant Power (FRAP) Assay
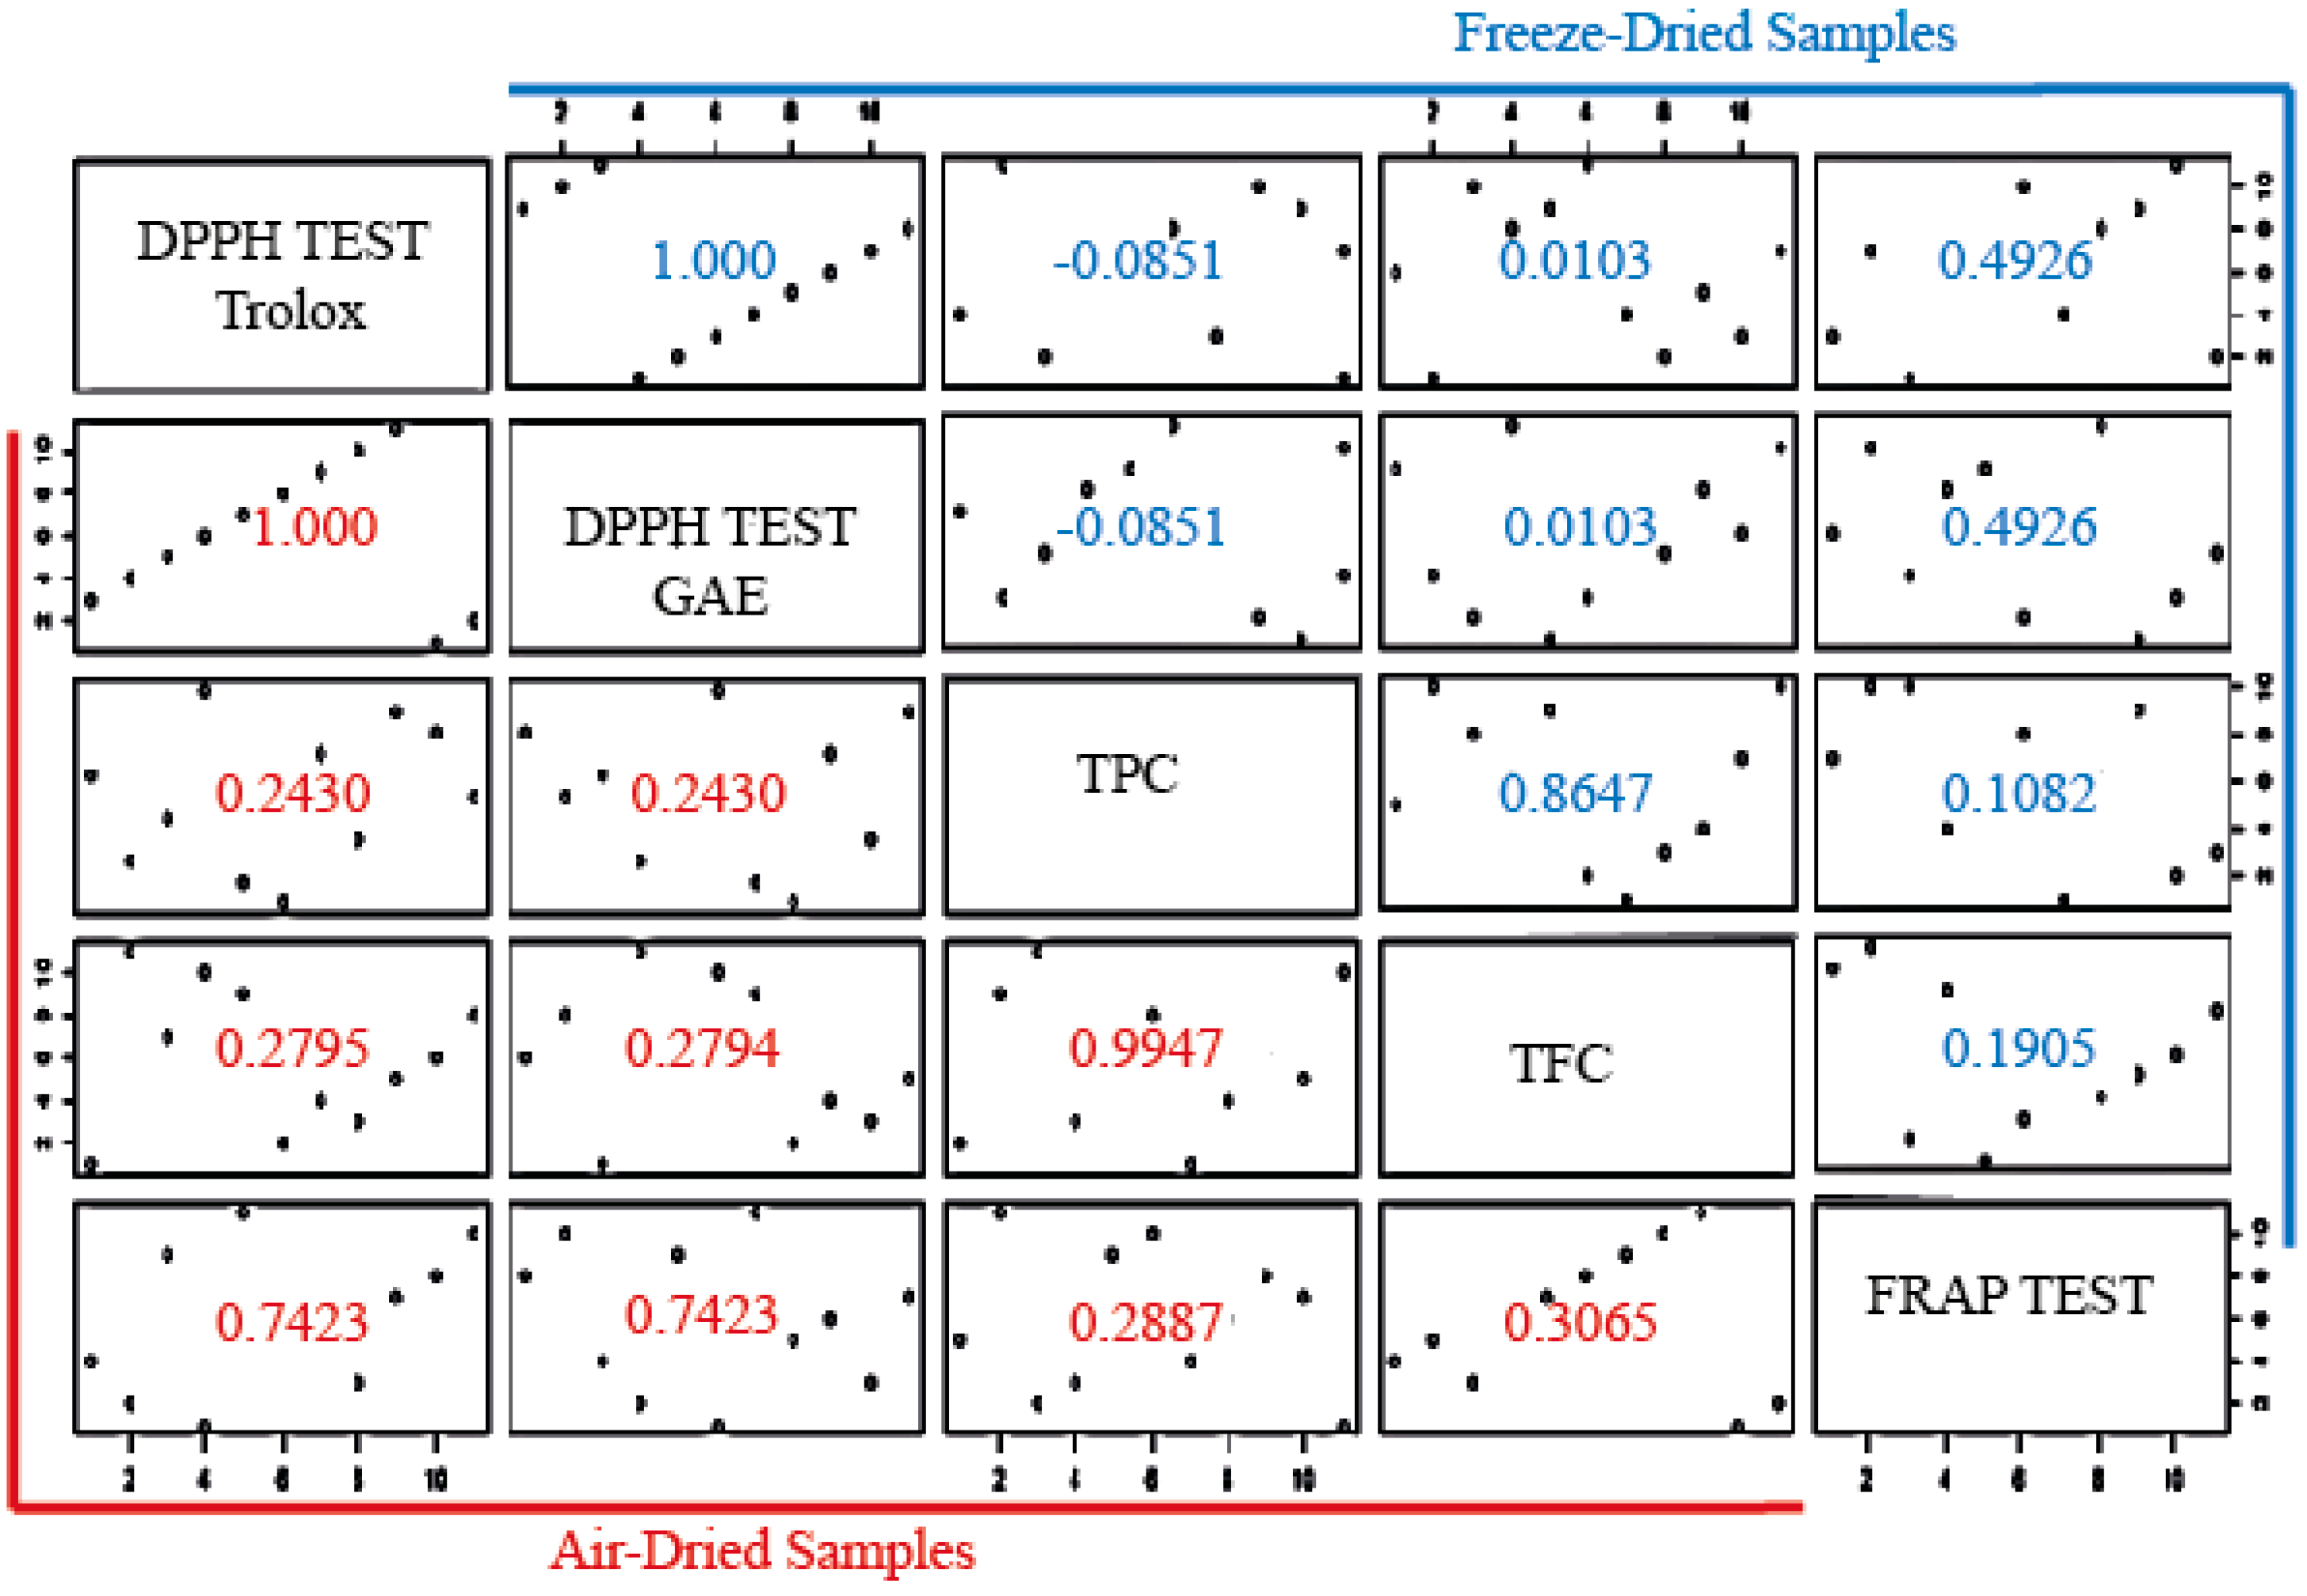
3.3.3. Correlation of TPC, TFC, DPPH, and FRAP Tests
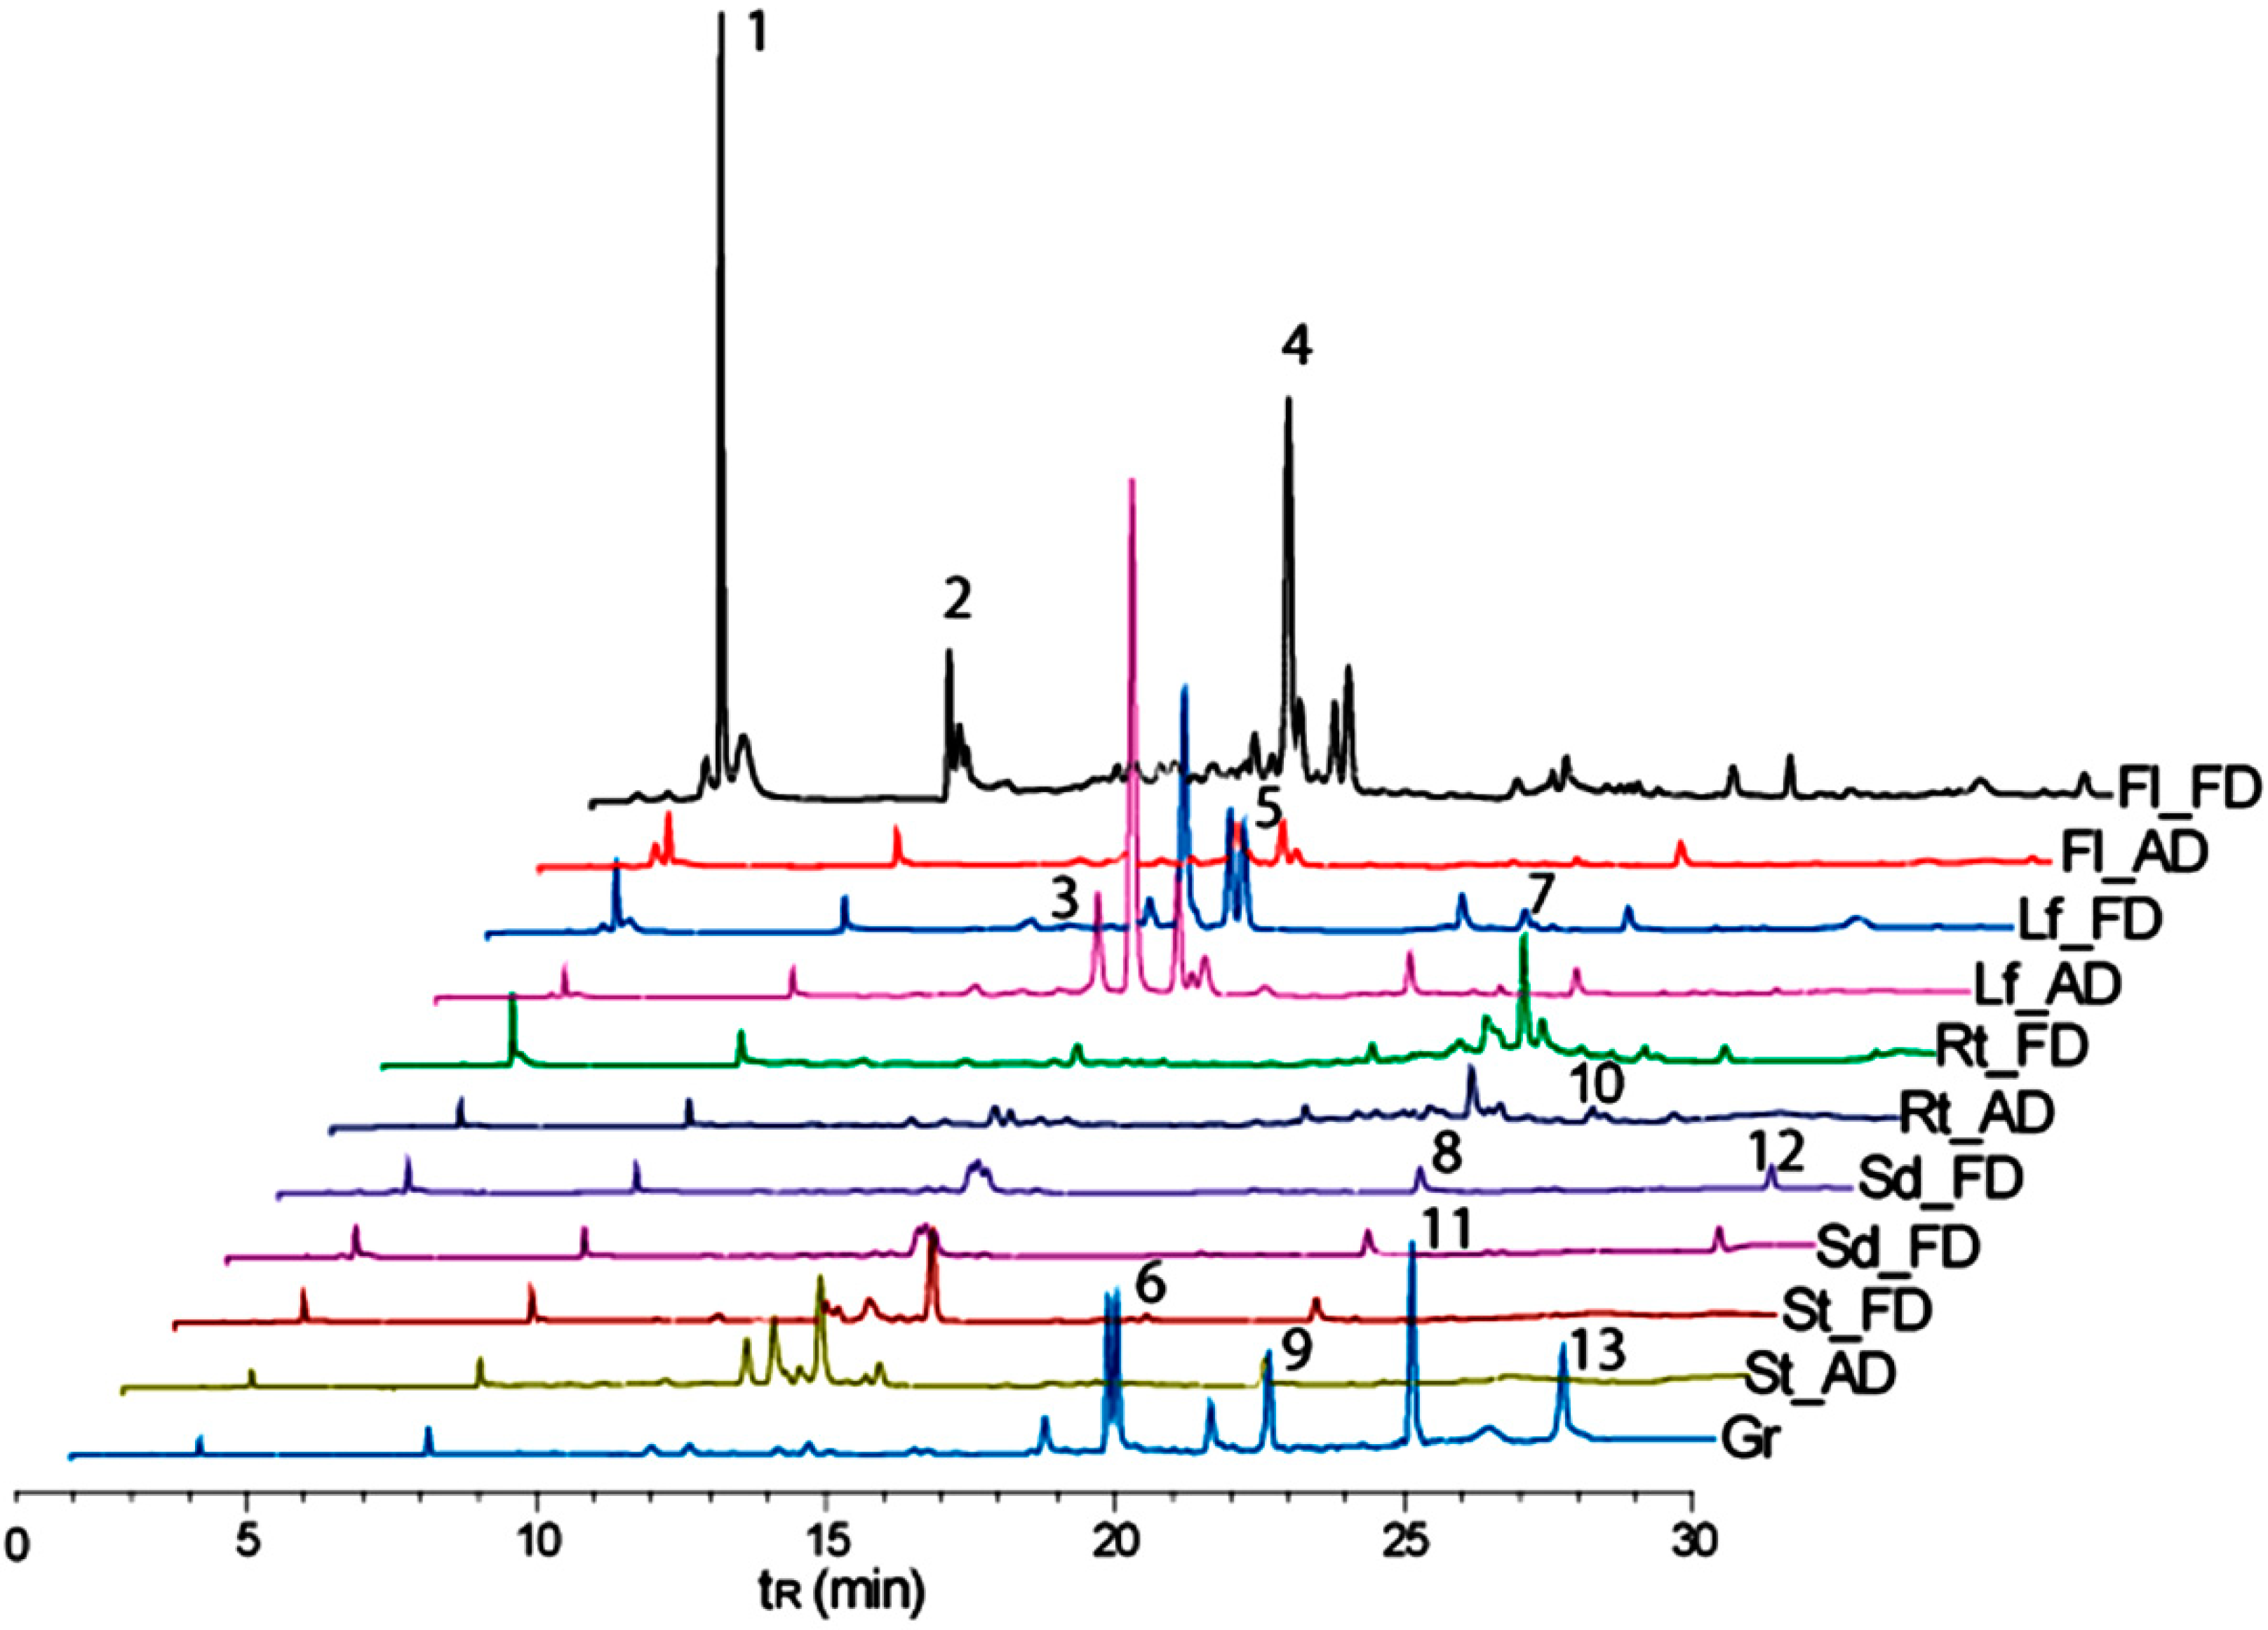
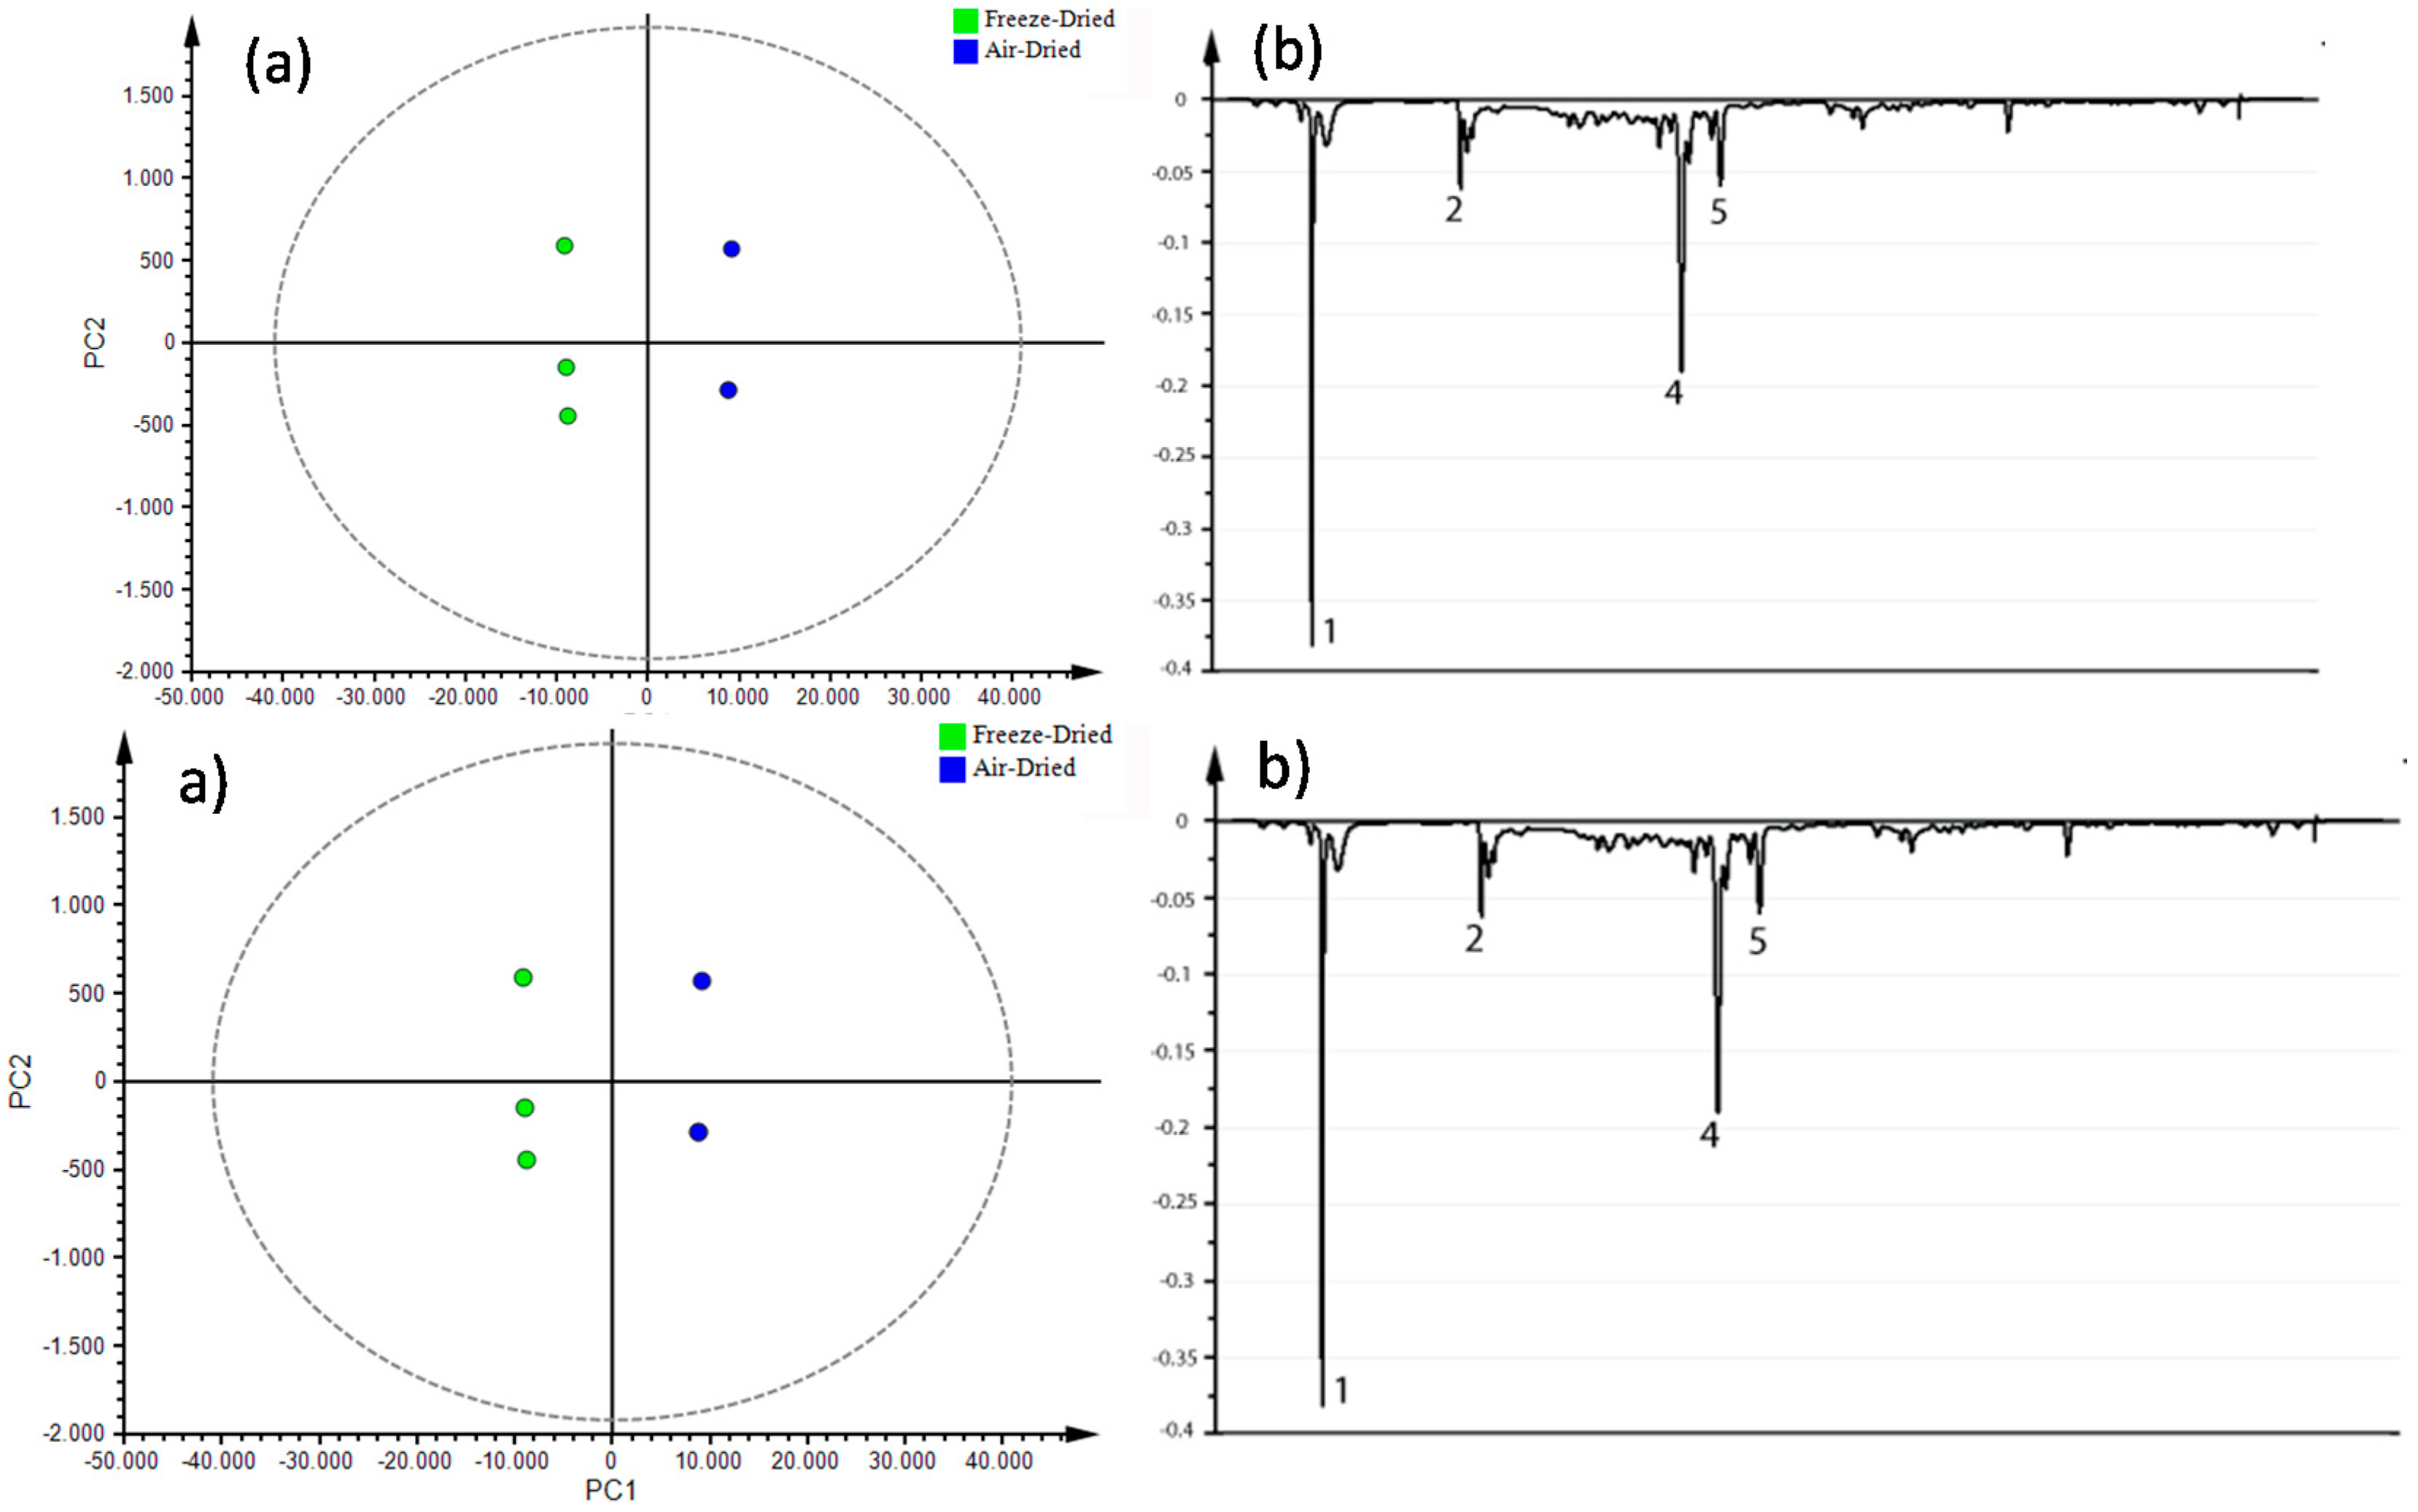
3.4. Metabolite Fingerprinting
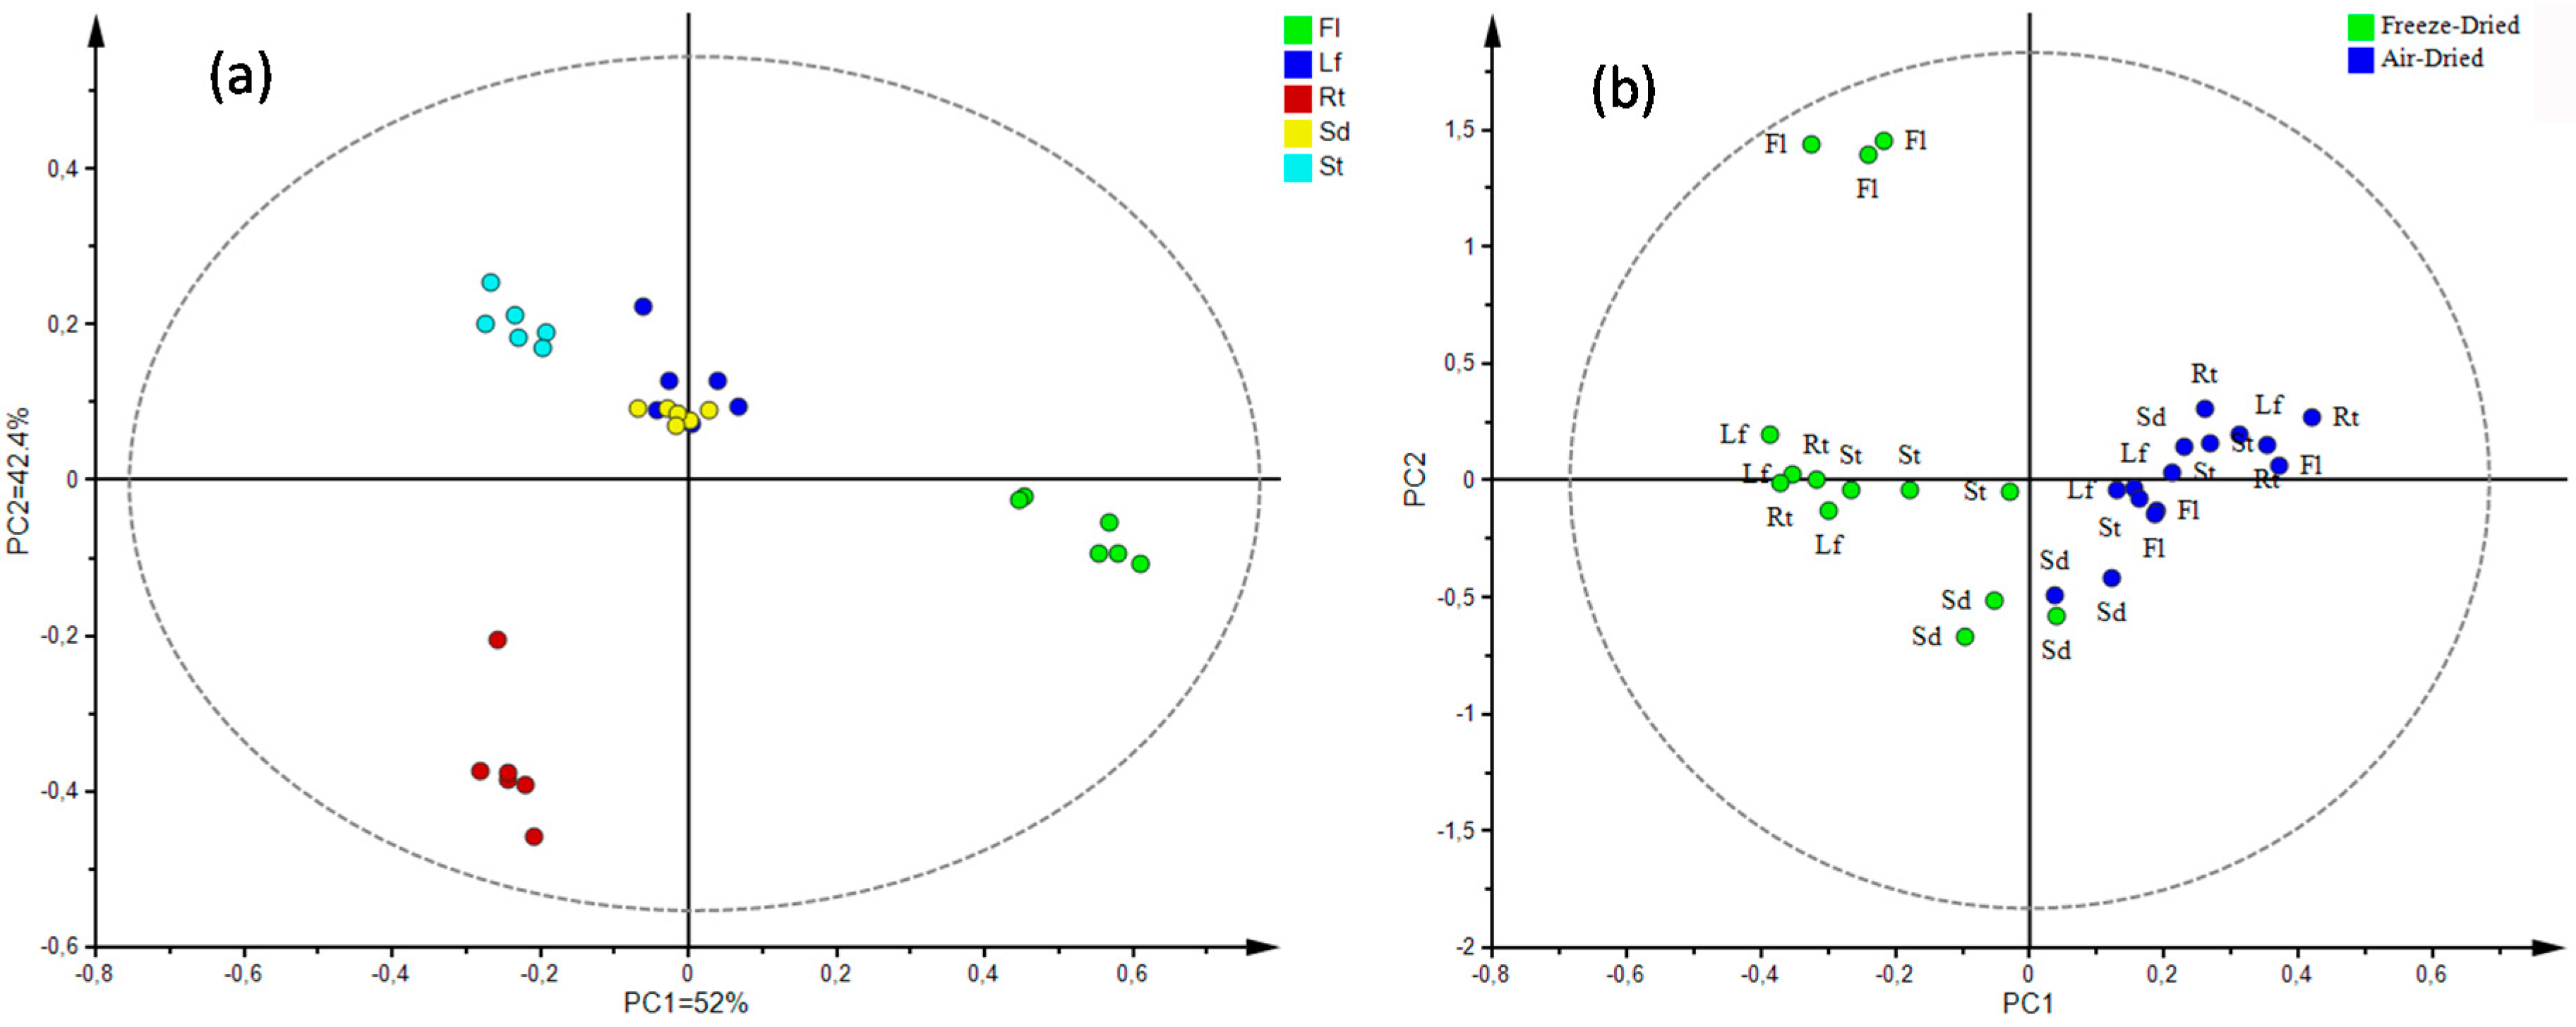
Multivariate Statistical Analysis
4. Conclusions
Author Contributions
Funding
Acknowledgments
Conflicts of Interest
References
- Alvarez-Jubete, L.; Wijngaard, H.; Arendt, E.K.; Gallagher, E. Polyphenol composition and in vitro antioxidant activity of amaranth, quinoa buckwheat and wheat as affected by sprouting and baking. Food Chem. 2010, 119, 770–778. [Google Scholar] [CrossRef]
- Paśko, P.; Bartoń, H.; Zagrodzki, P.; Gorinstein, S.; Fołta, M.; Zachwieja, Z. Anthocyanins, total polyphenols and antioxidant activity in amaranth and quinoa seeds and sprouts during their growth. Food Chem. 2009, 115, 994–998. [Google Scholar] [CrossRef]
- Paśko, P.; Sajewicz, M.; Gorinstein, S.; Zachwieja, Z. Analysis of selected phenolic acids and flavonoids in Amaranthus cruentus and Chenopodium quinoa seeds and sprouts by HPLC. Acta Chromatogr. 2008, 20, 661–672. [Google Scholar] [CrossRef]
- Bigliardi, B.; Galati, F. Innovation trends in the food industry: The case of functional foods. Trends Food Sci. Technol. 2013, 31, 118–129. [Google Scholar] [CrossRef]
- Blades, M. Functional foods or nutraceuticals. Nutr. Food Sci. 2000, 30, 73–76. [Google Scholar] [CrossRef]
- Tur, J.A.; Bibiloni, M.M. Functional Foods. In Encyclopedia of Food and Health; Elsevier: Amsterdam, The Netherlands, 2016; pp. 157–161. [Google Scholar]
- Nimse, S.B.; Pal, D. Free radicals, natural antioxidants, and their reaction mechanisms. RSC Adv. 2015, 5, 27986–28006. [Google Scholar] [CrossRef] [Green Version]
- Creus, E.G. Phenolic compounds. An analysis of its health benefits. Offarm Farm. Soc. 2004, 23, 80–84. [Google Scholar]
- Delgado-Olivares, L.; Betanzos-Cabrera, G.; Sumaya-Martínez, M.T. Importance of dietary antioxidants in the reduction of oxidative stress. Investig. Cienc. 2010, 18, 10–15. [Google Scholar]
- King, A.M.Y.; Young, G. Characteristics and occurrence of phenolic phytochemicals. J. Am. Diet. Assoc. 1999, 99, 213–218. [Google Scholar] [CrossRef]
- Sreelatha, S.; Padma, P.R. Antioxidant activity and total phenolic content of Moringa oleifera leaves in two stages of maturity. Plant Foods Hum. Nutr. 2009, 64, 303–311. [Google Scholar] [CrossRef]
- Mutasim, M.K.; Hussein, M.D.A.N.; Khalid, M.A.E.; Hany, A.E.S.; Eltayb, A. Dedifferentiation of leaf explants and antileukemia activity of an ethanolic extract of cell cultures of Moringa oleifera. Afr. J. Biotechnol. 2011, 10, 2746–2750. [Google Scholar] [CrossRef]
- Gutteridge, J.M.C.; Halliwell, B. Antioxidant Protection and Ixygen Radical Signaling. In Reactive Oxygen Species in Biological Systems; Kluwer Academic Publishers: Doddrecht, The Netherlands, 2002; pp. 189–218. [Google Scholar]
- Mariani, E.; Polidori, M.C.; Cherubini, A.; Mecocci, P. Oxidative stress in brain aging, neurodegenerative and vascular diseases: An overview. J. Chromatogr. B 2005, 827, 65–75. [Google Scholar] [CrossRef] [PubMed]
- Gawlik-Dziki, U.; Świeca, M.; Sułkowski, M.; Dziki, D.; Baraniak, B.; Czyż, J. Antioxidant and anticancer activities of Chenopodium quinoa leaves extracts: In vitro study. Food Chem. Toxicol. 2013, 57, 154–160. [Google Scholar] [CrossRef] [PubMed]
- San-Miguel, A.; Martin-Gil, F.J. Importance of reactive oxygen species (free radicals) and antioxidants in clinics. Gac. Med. Bilbao 2009, 106, 106–113. (In Spanish) [Google Scholar] [CrossRef]
- Chandrasekara, A.; Shahidi, F. Inhibitory activities of soluble and bound millet seed phenolics on free radicals and reactive oxygen species. J. Agric. Food Chem. 2011, 59, 428–436. [Google Scholar] [CrossRef]
- Gebicki, J.M. Oxidative stress, free radicals and protein peroxides. Arch. Biochem. Biophys. 2016, 595, 33–39. [Google Scholar] [CrossRef]
- Wojtunik-Kulesza, K.A.; Oniszczuk, A.; Oniszczuk, T.; Waksmundzka-Hajnos, M. The influence of common free radicals and antioxidants on development of Alzheimer’s Disease. Biomed. Pharmacother. 2016, 78, 39–49. [Google Scholar] [CrossRef]
- Lobo, V.; Patil, A.; Phatak, A.; Chandra, N. Free radicals, antioxidants and functional foods: Impact on human health. Pharmacogn. Rev. 2010, 4, 118–126. [Google Scholar] [CrossRef]
- Kaur, C.; Kapoor, H.C. Antioxidants in fruits and vegetables—The millennium’s health. Int. J. Food Sci. Technol. 2001, 36, 703–725. [Google Scholar] [CrossRef]
- Shahidi, F. Antioxidants: Principles and applications. In Woodhead Publishing Series in Food Science, Technology and Nutrition; Shahidi, F., Ed.; Woodhead Publishing: Cambridge, UK, 2015; pp. 1–14. [Google Scholar]
- Pandey, K.B.; Rizvi, S.I. Plant polyphenols as dietary antioxidants in human health and disease. Oxid. Med. Cell. Longev. 2009, 2, 270–278. [Google Scholar] [CrossRef]
- Berti, C.; Ballabio, C.; Restani, P.; Porrini, M.; Bonomi, F.; Iametti, S. immunochemical and molecular properties of proteins in Chenopodium quinoa. Cereal Chem. J. 2004, 81, 275–277. [Google Scholar] [CrossRef]
- Mahoney, A.W.; Lopez, J.G.; Hendricks, D.G. Evaluation of the protein quality of quinoa. J. Agric. Food Chem. 1975, 23, 190–193. [Google Scholar] [CrossRef] [PubMed]
- Repo-Carrasco, R.; Espinoza, C.; Jacobsen, S.-E. Nutritional value and use of the andean crops quinoa (Chenopodium quinoa) and kañiwa (Chenopodium pallidicaule). Food Rev. Int. 2003, 19, 179–189. [Google Scholar] [CrossRef]
- Woldemichael, G.M.; Wink, M. Identification and Biological activities of triterpenoid saponins from Chenopodium quinoa. J. Agric. Food Chem. 2001, 49, 2327–2332. [Google Scholar] [CrossRef] [PubMed]
- Jacobsen, S.E.; Mujica, A.; Ortiz, R. The importance of Andean crops. Fermentum 2003, 13, 14–24. [Google Scholar]
- Mujica, A.; Jacobsen, S.-E. Quinoa (Chenopodium quinoa Willd.) and its wild relatives. Botánica Económica los Andes Cent. 2007, 449–457. [Google Scholar]
- Romo, S.; Rosero, A.; Forero, C.; Céron, E. Nutritional potential of quinoa flours (Chenopodium quinoa w) piartal variety in the Colombian Andes Part One. Biotecnol. en el Sect. Agropecu. y Agroindustrial 2006, 4, 112–125. (In Spanish) [Google Scholar]
- Brito, I.L.; de Souza, E.L.; Felex, S.S.S.; Madruga, M.S.; Yamashita, F.; Magnani, M. Nutritional and sensory characteristics of gluten-free quinoa (Chenopodium quinoa Willd)-based cookies development using an experimental mixture design. J. Food Sci. Technol. 2015, 52, 5866–5873. [Google Scholar] [CrossRef] [PubMed]
- Lutz, M.; Martínez, A.; Martínez, E.A. Daidzein and Genistein contents in seeds of quinoa (Chenopodium quinoa Willd.) from local ecotypes grown in arid Chile. Ind. Crops Prod. 2013, 49, 117–121. [Google Scholar] [CrossRef]
- Alvarez-Jubete, L.; Arendt, E.K.; Gallagher, E. Nutritive value and chemical composition of pseudocereals as gluten-free ingredients. Int. J. Food Sci. Nutr. 2009, 60, 240–257. [Google Scholar] [CrossRef]
- Alvarez-Jubete, L.; Arendt, E.K.; Gallagher, E. Nutritive value of pseudocereals and their increasing use as functional gluten-free ingredients. Trends Food Sci. Technol. 2010, 21, 106–113. [Google Scholar] [CrossRef]
- Nowak, V.; Du, J.; Charrondière, U.R. Assessment of the nutritional composition of quinoa (Chenopodium quinoa Willd.). Food Chem. 2016, 193, 47–54. [Google Scholar] [CrossRef] [PubMed]
- Bai, J.C.; Fried, M.; Corazza, G.R.; Schuppan, D.; Farthing, M.; Catassi, C.; Greco, L.; Cohen, H.; Ciacci, C.; Eliakim, R.; et al. World Gastroenterology Organisation Global Guidelines on Celiac Disease. J. Clin. Gastroenterol. 2013, 47, 121–126. [Google Scholar] [CrossRef] [PubMed] [Green Version]
- Fischer, S.; Wilckens, R.; Jara, J.; Aranda, M. Variation in antioxidant capacity of quinoa (Chenopodium quinoa Will) subjected to drought stress. Ind. Crops Prod. 2013, 46, 341–349. [Google Scholar] [CrossRef]
- Hirose, Y.; Fujita, T.; Ishii, T.; Ueno, N. Antioxidative properties and flavonoid composition of Chenopodium quinoa seeds cultivated in Japan. Food Chem. 2010, 119, 1300–1306. [Google Scholar] [CrossRef]
- Tang, Y.; Li, X.; Zhang, B.; Chen, P.X.; Liu, R.; Tsao, R. Characterisation of phenolics, betanins and antioxidant activities in seeds of three Chenopodium quinoa Willd. genotypes. Food Chem. 2015, 166, 380–388. [Google Scholar] [CrossRef]
- Kuljanabhagavad, T.; Wink, M. Biological activities and chemistry of saponins from Chenopodium quinoa Willd. Phytochem. Rev. 2009, 8, 473–490. [Google Scholar] [CrossRef]
- Kuljanabhagavad, T.; Thongphasuk, P.; Chamulitrat, W.; Wink, M. Triterpene saponins from Chenopodium quinoa Willd. Phytochemistry 2008, 69, 1919–1926. [Google Scholar] [CrossRef]
- Bernal, F.A.; Cuca-Suárez, L.E.; Yamaguchi, L.F.; Coy-Barrera, E. LC-DAD-UV and LC-ESI-MS-based analyses, antioxidant capacity, and antimicrobial activity of a polar fraction from Iryanthera ulei leaves. Rec. Nat. Prod. 2013, 7, 152–156. [Google Scholar]
- Mad, T.; Sterk, H.; Mittelbach, M.; Rechberger, G.N. Tandem mass spectrometric analysis of a complex triterpene saponin mixture of Chenopodium quinoa. J. Am. Soc. Mass Spectrom. 2006, 17, 795–806. [Google Scholar] [CrossRef]
- Zhang, D.; Hamauzu, Y. Phenolics, ascorbic acid, carotenoids and antioxidant activity of broccoli and their changes during conventional and microwave cooking. Food Chem. 2004, 88, 503–509. [Google Scholar] [CrossRef]
- Ismail, A.; Marjan, Z.; Foong, C. Total antioxidant activity and phenolic content in selected vegetables. Food Chem. 2004, 87, 581–586. [Google Scholar] [CrossRef]
- Toor, R.K.; Savage, G.P. Effect of semi-drying on the antioxidant components of tomatoes. Food Chem. 2006, 94, 90–97. [Google Scholar] [CrossRef]
- Roy, M.K.; Takenaka, M.; Isobe, S.; Tsushida, T. Antioxidant potential, anti-proliferative activities, and phenolic content in water-soluble fractions of some commonly consumed vegetables: Effects of thermal treatment. Food Chem. 2007, 103, 106–114. [Google Scholar] [CrossRef]
- Miranda, M.; Vega-Gálvez, A.; López, J.; Parada, G.; Sanders, M.; Aranda, M.; Uribe, E.; Scala, K. Di Impact of air-drying temperature on nutritional properties, total phenolic content and antioxidant capacity of quinoa seeds (Chenopodium quinoa Willd.). Ind. Crops Prod. 2010, 32, 258–263. [Google Scholar] [CrossRef]
- Martín-Cabrejas, M.A.; Aguilera, Y.; Pedrosa, M.M.; Cuadrado, C.; Hernández, T.; Díaz, S.; Esteban, R.M. The impact of dehydration process on antinutrients and protein digestibility of some legume flours. Food Chem. 2009, 114, 1063–1068. [Google Scholar] [CrossRef]
- Qu, W.; Pan, Z.; Ma, H. Extraction modeling and activities of antioxidants from pomegranate marc. J. Food Eng. 2010, 99, 16–23. [Google Scholar] [CrossRef]
- Repo-Carrasco-Valencia, R.; Hellström, J.K.; Pihlava, J.-M.; Mattila, P.H. Flavonoids and other phenolic compounds in Andean indigenous grains: Quinoa (Chenopodium quinoa), kañiwa (Chenopodium pallidicaule) and kiwicha (Amaranthus caudatus). Food Chem. 2010, 120, 128–133. [Google Scholar] [CrossRef]
- Asao, M.; Watanabe, K. Functional and bioactive properties of quinoa and amaranth. Food Sci. Technol. Res. 2010, 16, 163–168. [Google Scholar] [CrossRef]
- Weinig, C.; Gravuer, K.A.; Kane, N.C.; Schmitt, J. Testing adaptive plasticity to UV: Costs and benefits of stem elongation and light-induced phenolics. Evolution (N. Y.) 2004, 58, 2645–2656. [Google Scholar]
- Vollmannová, A.; Margitanová, E.; Tóth, T.; Timoracká, M.; Urminská, D.; Bojňanská, T.; Čičová, I. Cultivar influence on total polyphenol and rutin contents and total antioxidant capacity in buckwheat, amaranth, and quinoa seeds. Czech J. Food Sci. 2013, 31, 589–595. [Google Scholar] [CrossRef] [Green Version]
- Repo-Carrasco, R.; Encina, R. Determination of the antioxidant capacity and phenolic compounds of Andean cereals: Quinoa (Chenopodium quinoa), kañiwa (Chenopodium pallidicaule) and kiwicha (Amaranthus caudatus). Rev. Soc. Quim. Perú 2008, 74, 85–99. [Google Scholar]
- Nsimba, R.Y.; Kikuzaki, H.; Konishi, Y. Antioxidant activity of various extracts and fractions of Chenopodium quinoa and Amaranthus spp. seeds. Food Chem. 2008, 106, 760–766. [Google Scholar] [CrossRef]
- Zhu, N.; Sheng, S.; Li, D.; Lavoie, E.J.; Karwe, M.V.; Rosen, R.T.; Ho, C.T. Antioxidative flavonoid glycosides from quinoa seeds (Chenopodium quinoa Willd). J. Food Lipids 2001, 8, 37–44. [Google Scholar] [CrossRef]
- Lindeboom, N.; Chang, P.R.; Tyler, R.T. Analytical, biochemical and physicochemical aspects of starch granule size, with emphasis on small granule starches: A review. Starch 2004, 56, 89–99. [Google Scholar] [CrossRef]
- Lorenz, K. Quinoa (Chenopodium quinoa) starch: Physico-chemical properties and functional characteristics. Starch 1990, 42, 81–86. [Google Scholar] [CrossRef]
- Brady, K.; Ho, C.-T.; Rosen, R.T.; Sang, S.; Karwe, M. V Effects of processing on the nutraceutical profile of quinoa. Food Chem. 2007, 100, 1209–1216. [Google Scholar] [CrossRef]
- Palama, T.L.; Khatib, A.; Choi, Y.H.; Côme, B.; Fock, I.; Verpoorte, R.; Kodja, H. Metabolic characterization of green pods from Vanilla planifolia accessions grown in La Réunion. Environ. Exp. Bot. 2011, 72, 258–265. [Google Scholar] [CrossRef]
- Chlopicka, J.; Pasko, P.; Gorinstein, S.; Jedryas, A.; Zagrodzki, P. Total phenolic and total flavonoid content, antioxidant activity and sensory evaluation of pseudocereal breads. LWT-Food Sci. Technol. 2012, 46, 548–555. [Google Scholar] [CrossRef]

| No a | tRb (min) | [M + H]+ m/z | [M − H]− m/z | Annotated Metabolites | Molecular Formula | Exact Mass m/z | Type |
|---|---|---|---|---|---|---|---|
| 1 | 3.8 | 191 | scopoletin | C10H8O4 | 192.0422 | C | |
| 2 | 7.7 | 294 | naphthalenone | C17H26O4 | 294.1831 | T | |
| 3 | 12.9 | 609 | kaempferol 3-O-sophoroside | C27H30O16 | 610.1533 | F | |
| 4 | 13.5 | 479 | 477 | rhamnetin 3-glucoside | C22H22O12 | 478.1111 | F |
| 5 | 14.5 | 493 | 491 | unidentified | - | - | * |
| 6 | 19.5 | 810 | quinoasaponin 3 | C42H66O15 | 810.4401 | S | |
| 7 | 20.3 | 647 | unidentified | C27H30O16 | - | * | |
| 8 | 21.2 | 592 | kaempferol 3-rhamnosyl-(1→2)-galactoside | C27H30O15 | 594.1584 | F | |
| 9 | 22.2 | 959 | quinoasaponin 2 | C48H78O19 | 958.5137 | S | |
| 10 | 23.0 | 815 | unidentified | - | - | ● | |
| 11 | 24.7 | 792 | chikusetsusaponin IVa | C42H66O14 | 794.4452 | S | |
| 12 | 27.0 | 285 | kaempferol | C15H10O6 | 286.0477 | ● | |
| 13 | 27.3 | 411 | unidentified | - | - | * |
© 2019 by the authors. Licensee MDPI, Basel, Switzerland. This article is an open access article distributed under the terms and conditions of the Creative Commons Attribution (CC BY) license (http://creativecommons.org/licenses/by/4.0/).
Share and Cite
Buitrago, D.; Buitrago-Villanueva, I.; Barbosa-Cornelio, R.; Coy-Barrera, E. Comparative Examination of Antioxidant Capacity and Fingerprinting of Unfractionated Extracts from Different Plant Parts of Quinoa (Chenopodium quinoa) Grown under Greenhouse Conditions. Antioxidants 2019, 8, 238. https://doi.org/10.3390/antiox8080238
Buitrago D, Buitrago-Villanueva I, Barbosa-Cornelio R, Coy-Barrera E. Comparative Examination of Antioxidant Capacity and Fingerprinting of Unfractionated Extracts from Different Plant Parts of Quinoa (Chenopodium quinoa) Grown under Greenhouse Conditions. Antioxidants. 2019; 8(8):238. https://doi.org/10.3390/antiox8080238
Chicago/Turabian StyleBuitrago, Dayana, Ivon Buitrago-Villanueva, Ricardo Barbosa-Cornelio, and Ericsson Coy-Barrera. 2019. "Comparative Examination of Antioxidant Capacity and Fingerprinting of Unfractionated Extracts from Different Plant Parts of Quinoa (Chenopodium quinoa) Grown under Greenhouse Conditions" Antioxidants 8, no. 8: 238. https://doi.org/10.3390/antiox8080238