
In Vitro Antidiabetic, Antioxidant, and Prebiotic Activities of the Chemical Compounds Isolated from Guizotia abyssinica

 ,
,  ,
,  , , and
Abstract
: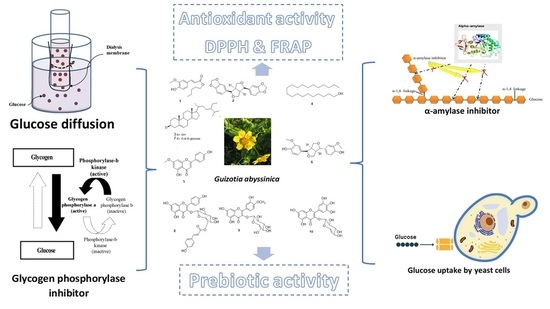
1. Introduction
2. Materials and Methods
2.1. Material
2.1.1. Plant Material
2.1.2. Chemicals
2.1.3. Strains and Starter Culture
2.2. Extraction and Isolation
2.3. General Procedures for Compounds’ Identification
2.4. In Vitro Assay of G. abyssinica Extract and Isolated Bioactive Compounds to Be Used as Ingredients of Synbiotic Preparations
2.4.1. Prebiotic Activity Score (Apreb) of Selected Probiotic Strains
2.4.2. Assessment of Lactic Acid’s Optically Active Forms
2.4.3. The Effect of Isolated Bioactive Compounds or Extract on the Enzymatic Profile of Selected Strains
2.5. In Vitro Evaluation of the Antioxidant Activity
2.6. Antidiabetic Properties of G. abyssinica Extract and Isolated Compounds
2.6.1. In Vitro Glycogen Phosphorylase Inhibition Assay
2.6.2. Determination of the Inhibitory Effect of G. abyssinica Extract and Isolated Compounds on α-Amylase Activity
2.6.3. Determination of the Effects of Isolated Compounds and Extract on Glucose Diffusion
2.6.4. Effect of G. abyssinica Extract and Isolated Compounds on Glucose Uptake by Yeast Cells
3. Results
3.1. Identification of Isolated Compounds
3.2. Evaluation of the Prebiotic Potential of G. abyssinica Extract and Isolated Compounds
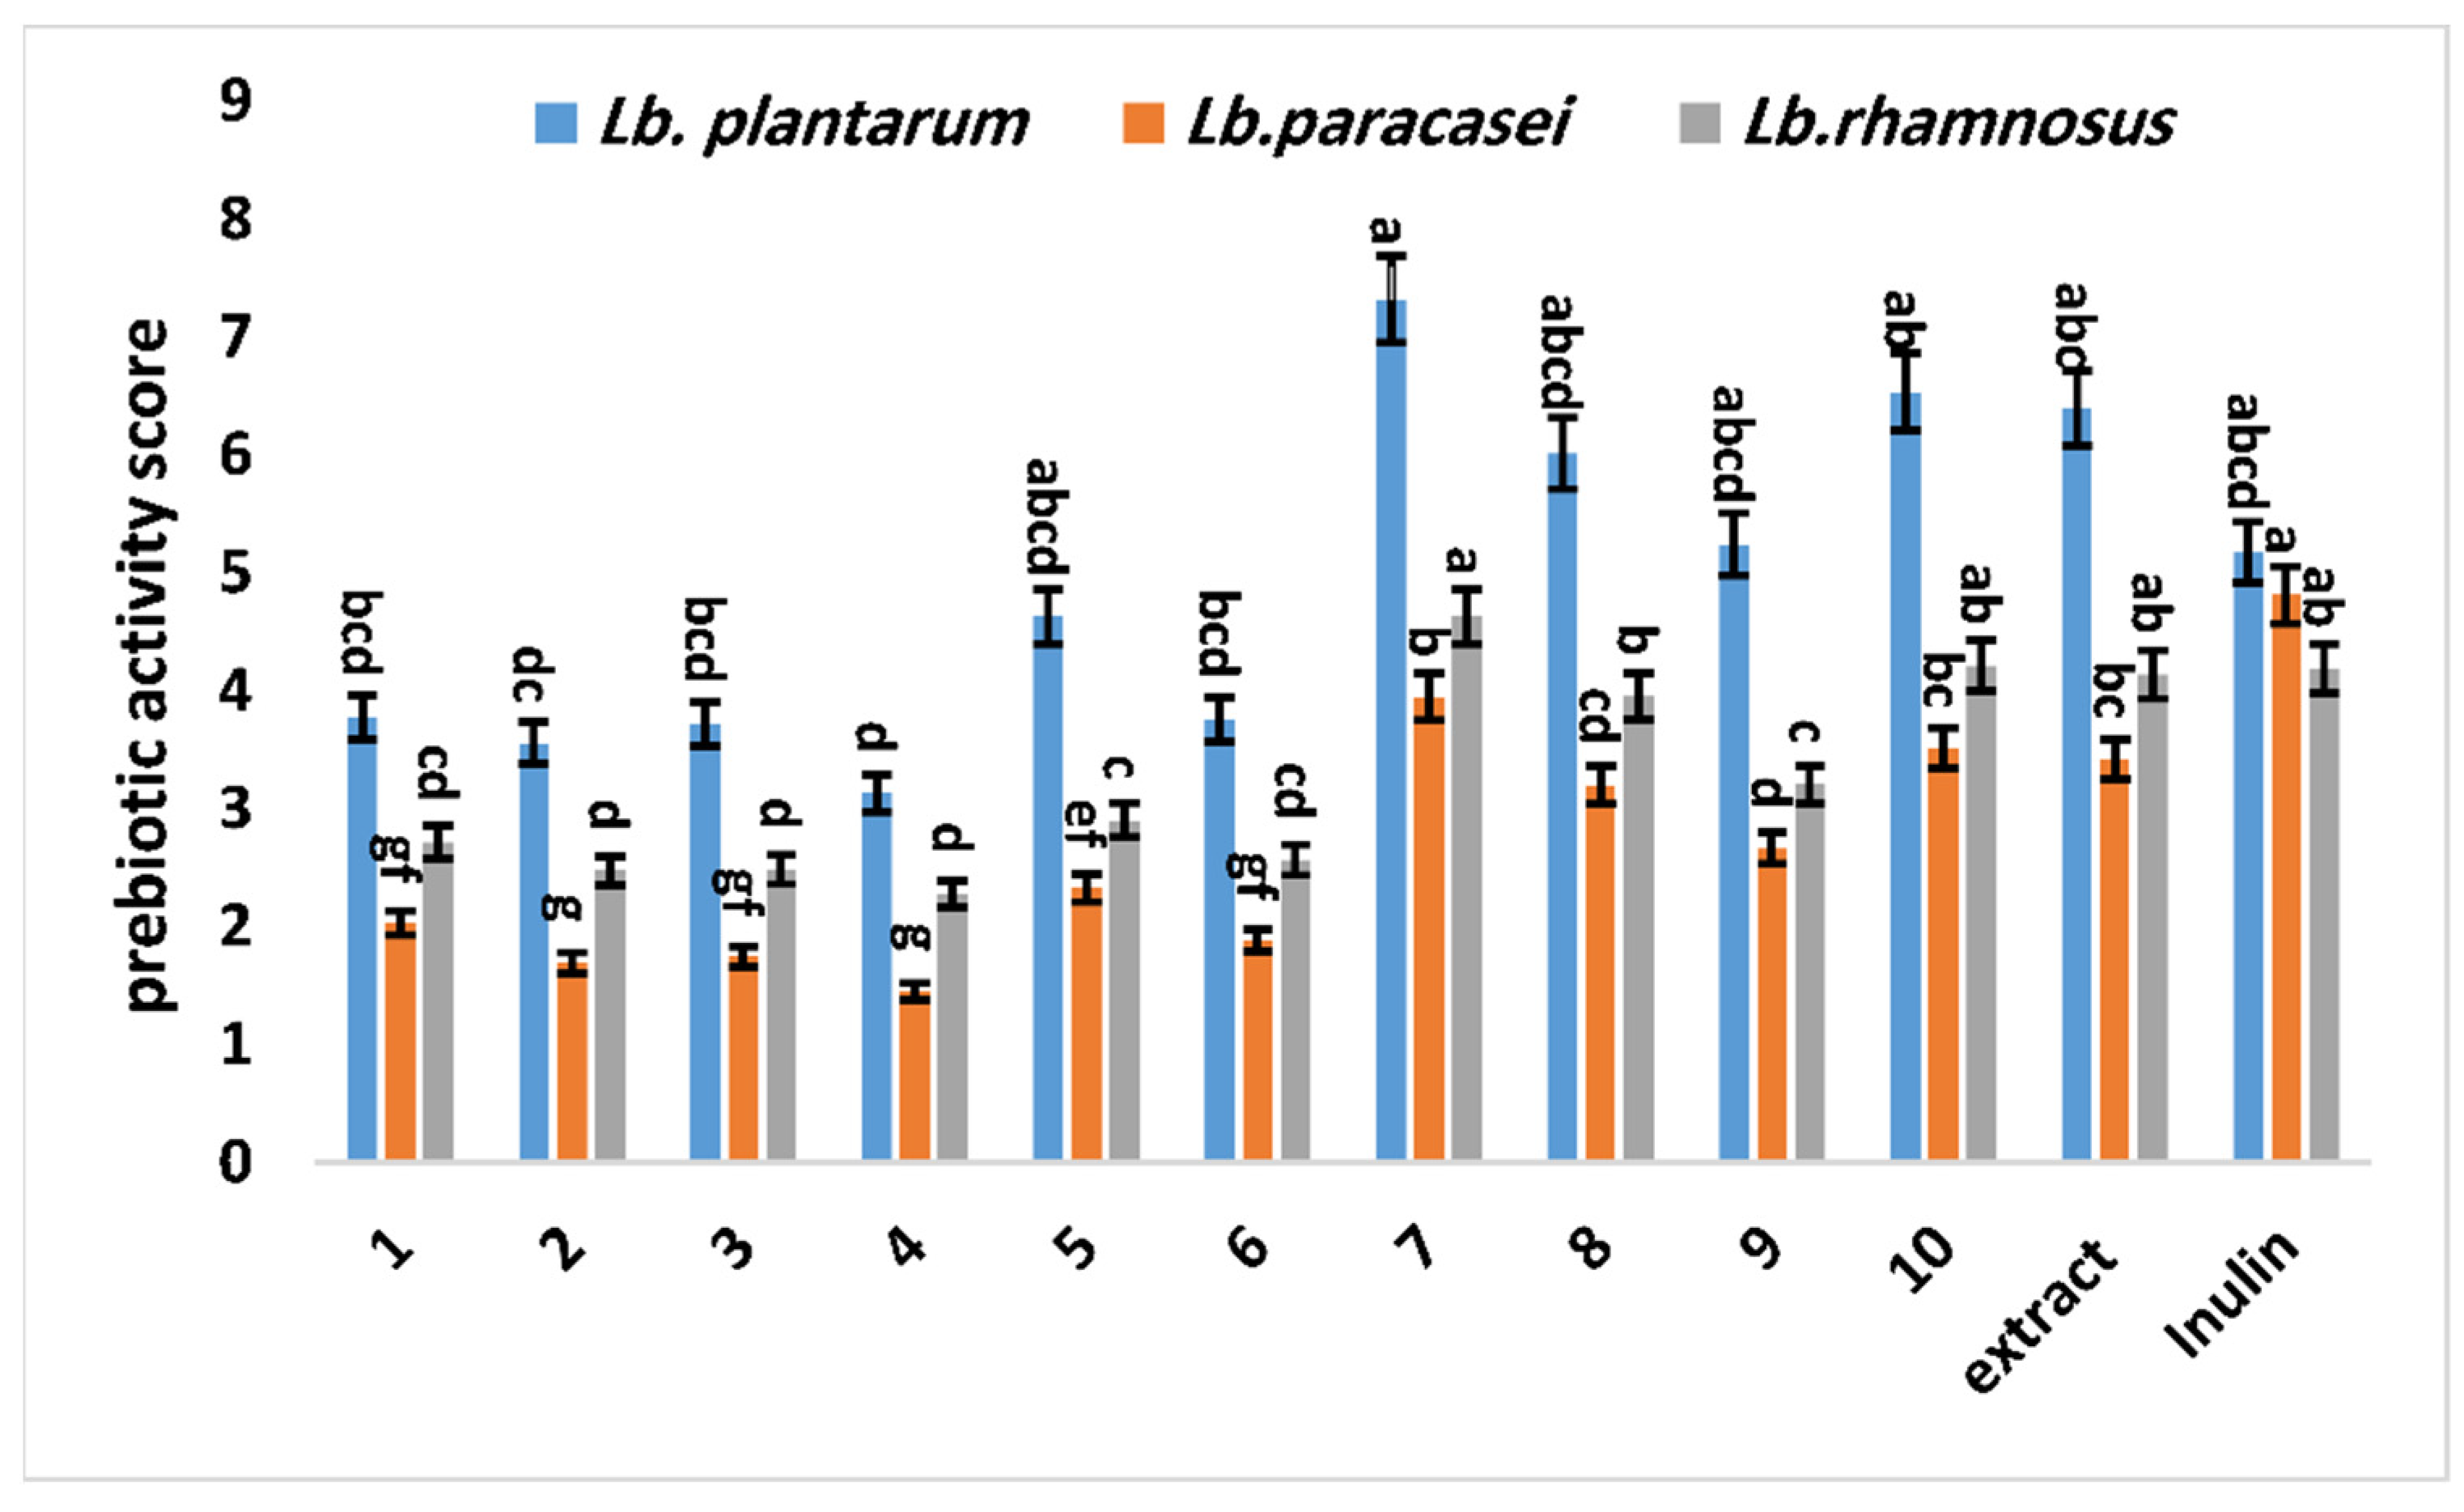
3.2.1. Prebiotic Activity Scores (Apreb) of G. abyssinica Extract and Isolated Compounds
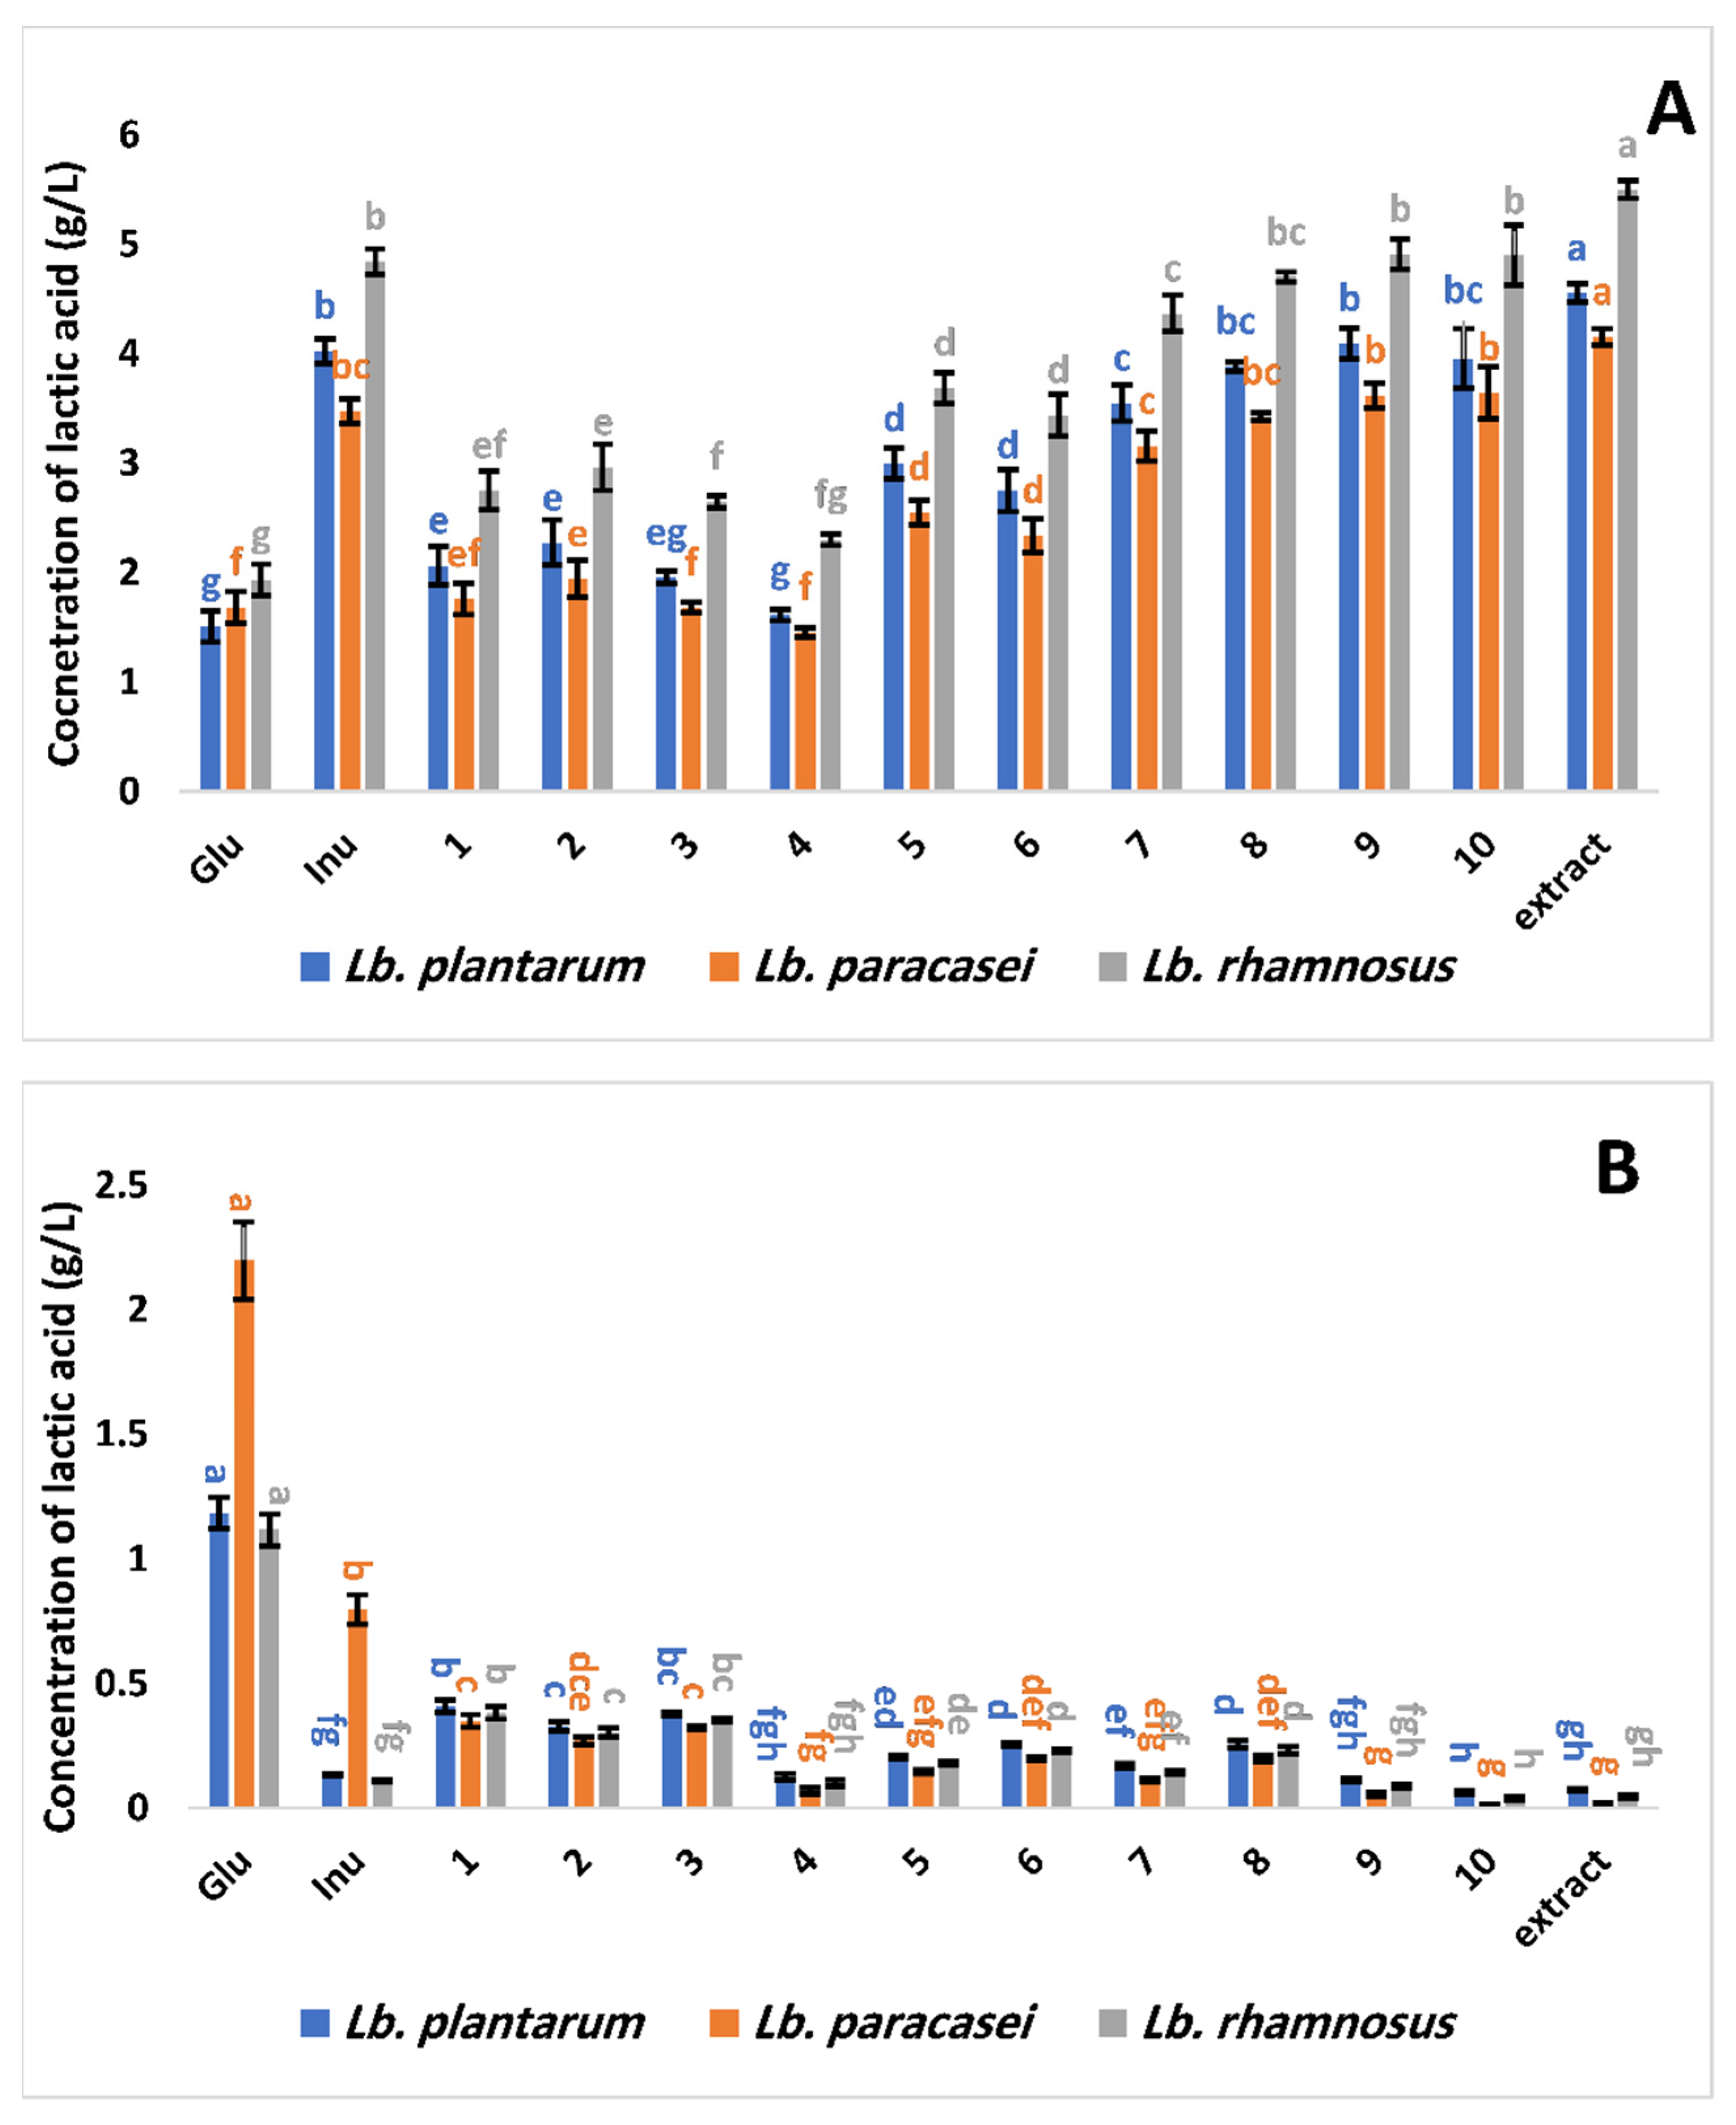
3.2.2. The Optical Type of Lactic Acid Synthesized by Selected Lactobacillus Strains
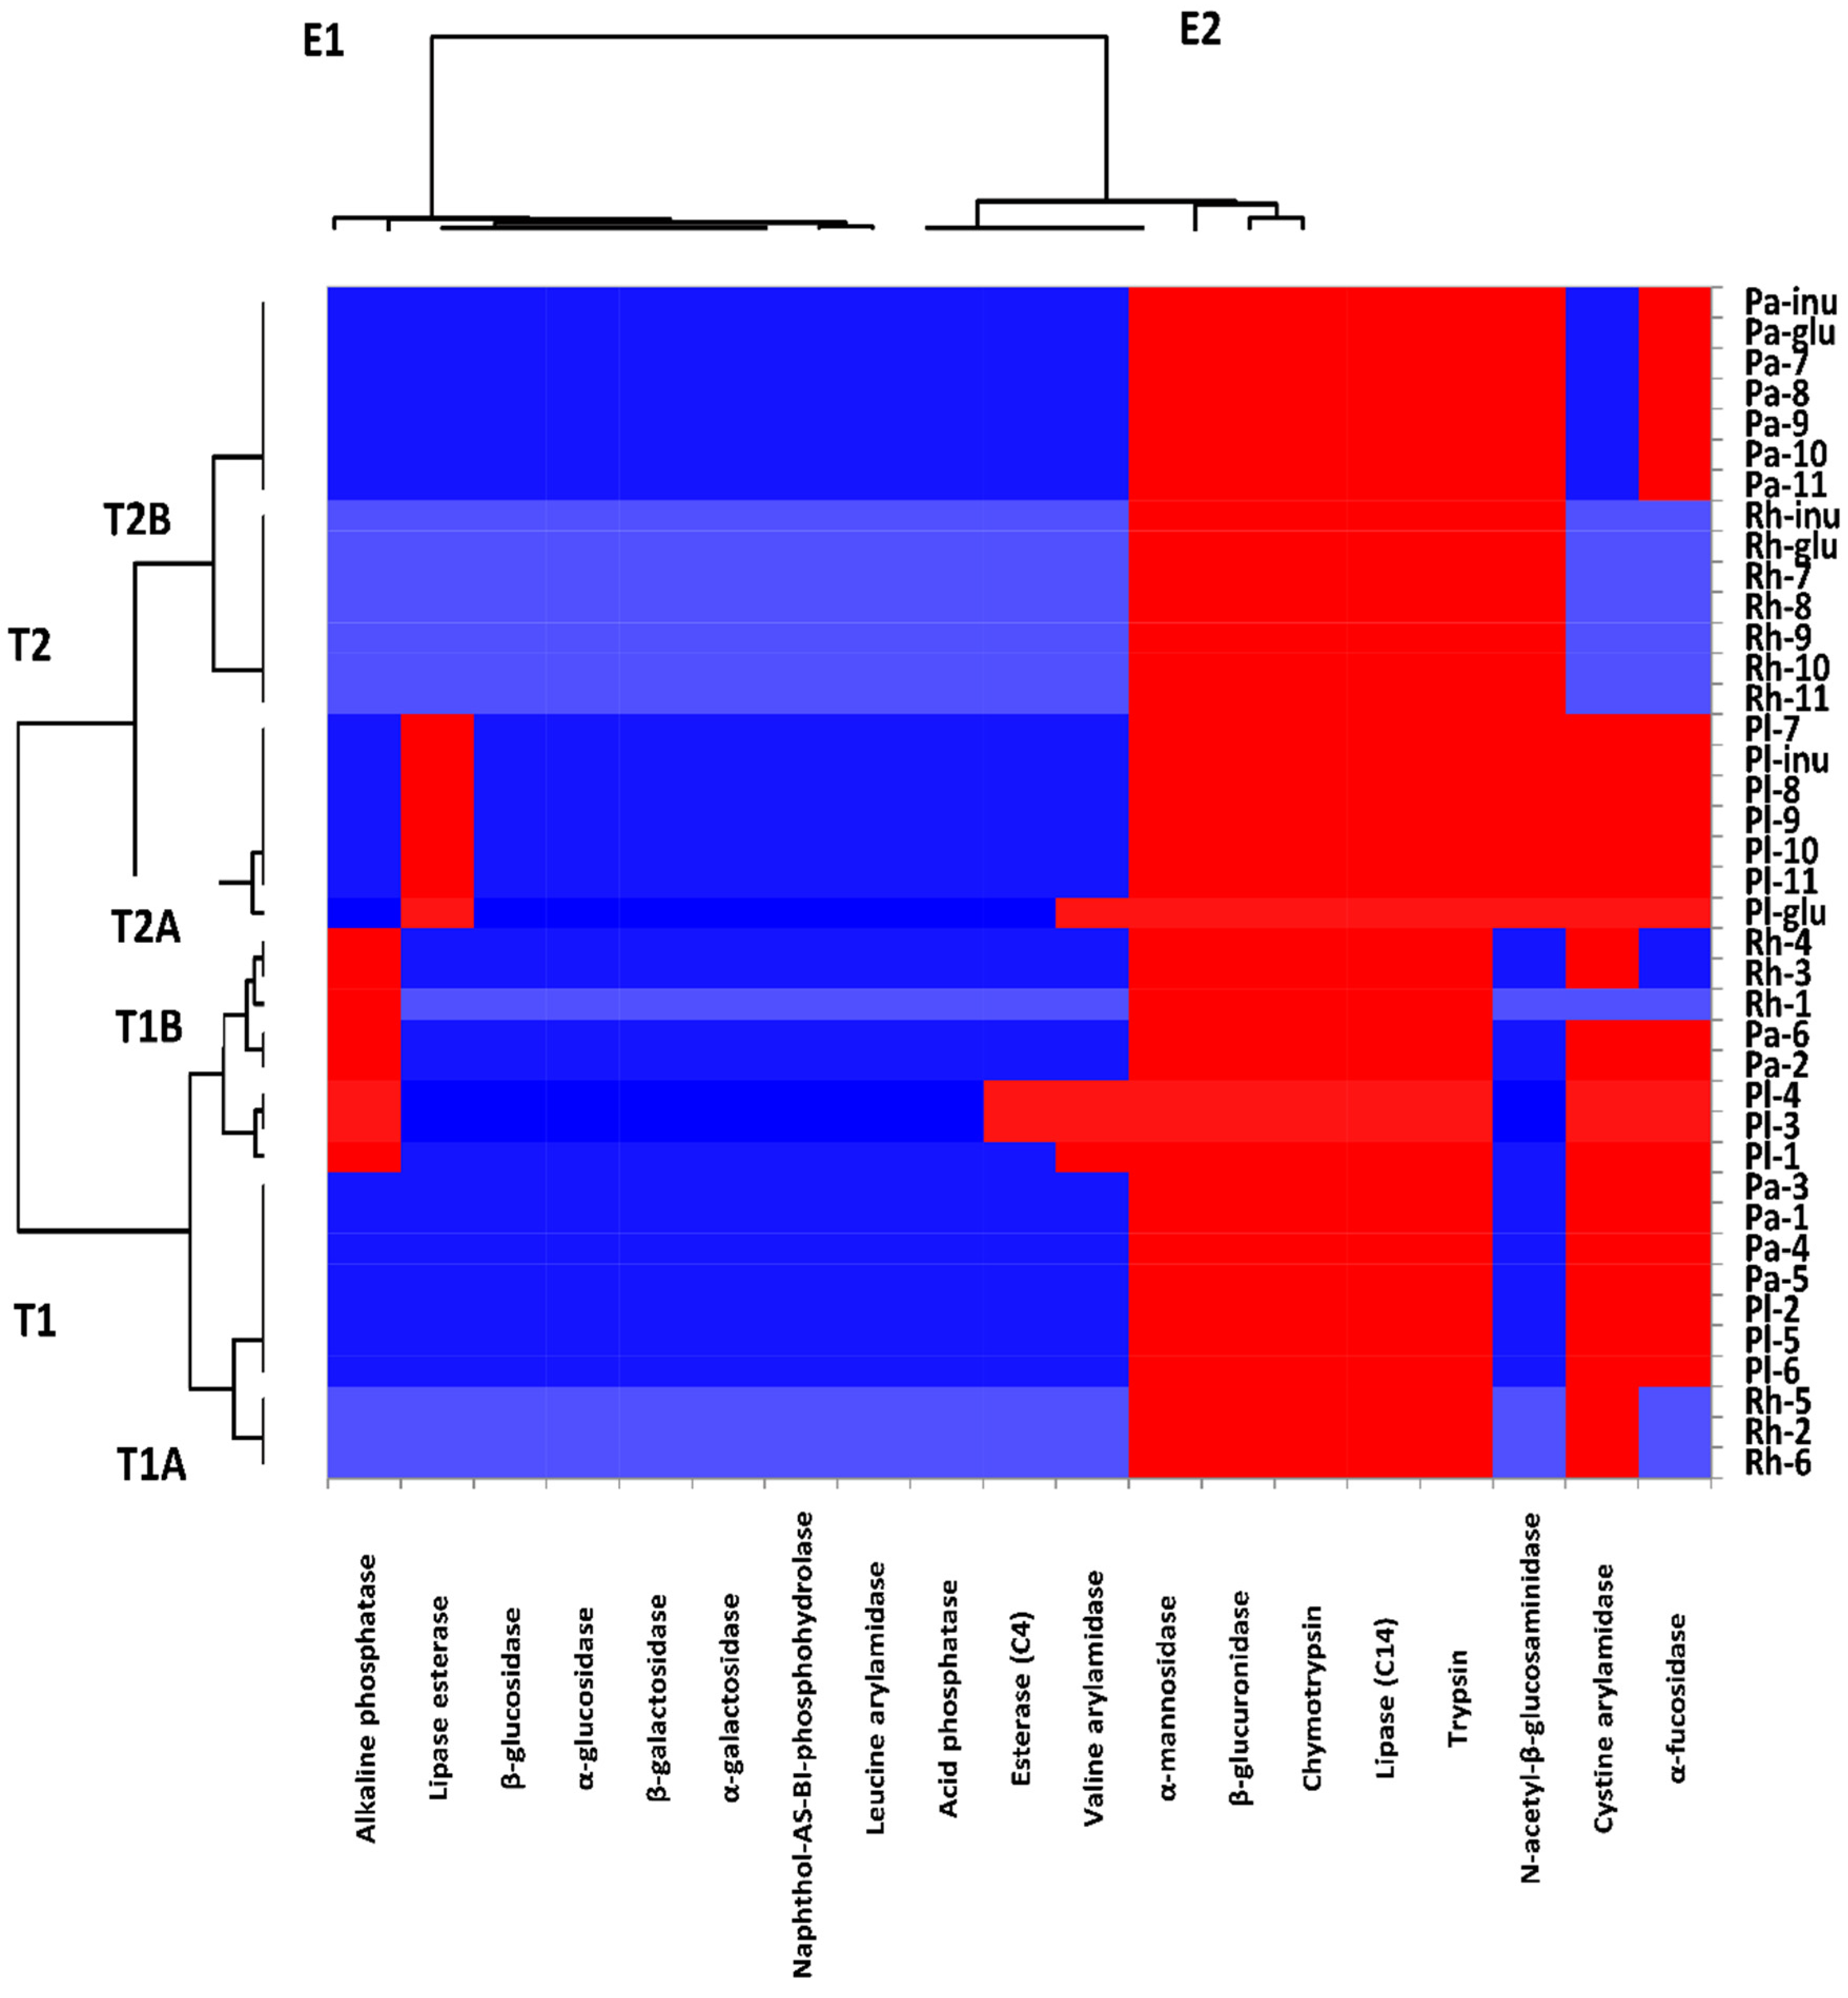
3.2.3. The Effects of Isolated Compounds and Methanol Extract on the Enzymatic Profiles of Probiotic Strains
3.3. Biological Activity of G. abyssinica Methanol Extract and Isolated Compounds
3.3.1. Antioxidant Activity of G. abyssinica Extract and Isolated Compounds
3.3.2. Antidiabetic Activity of G. abyssinica Extract and the Isolated Compounds
Inhibitory Effect on α-Amylase Activity
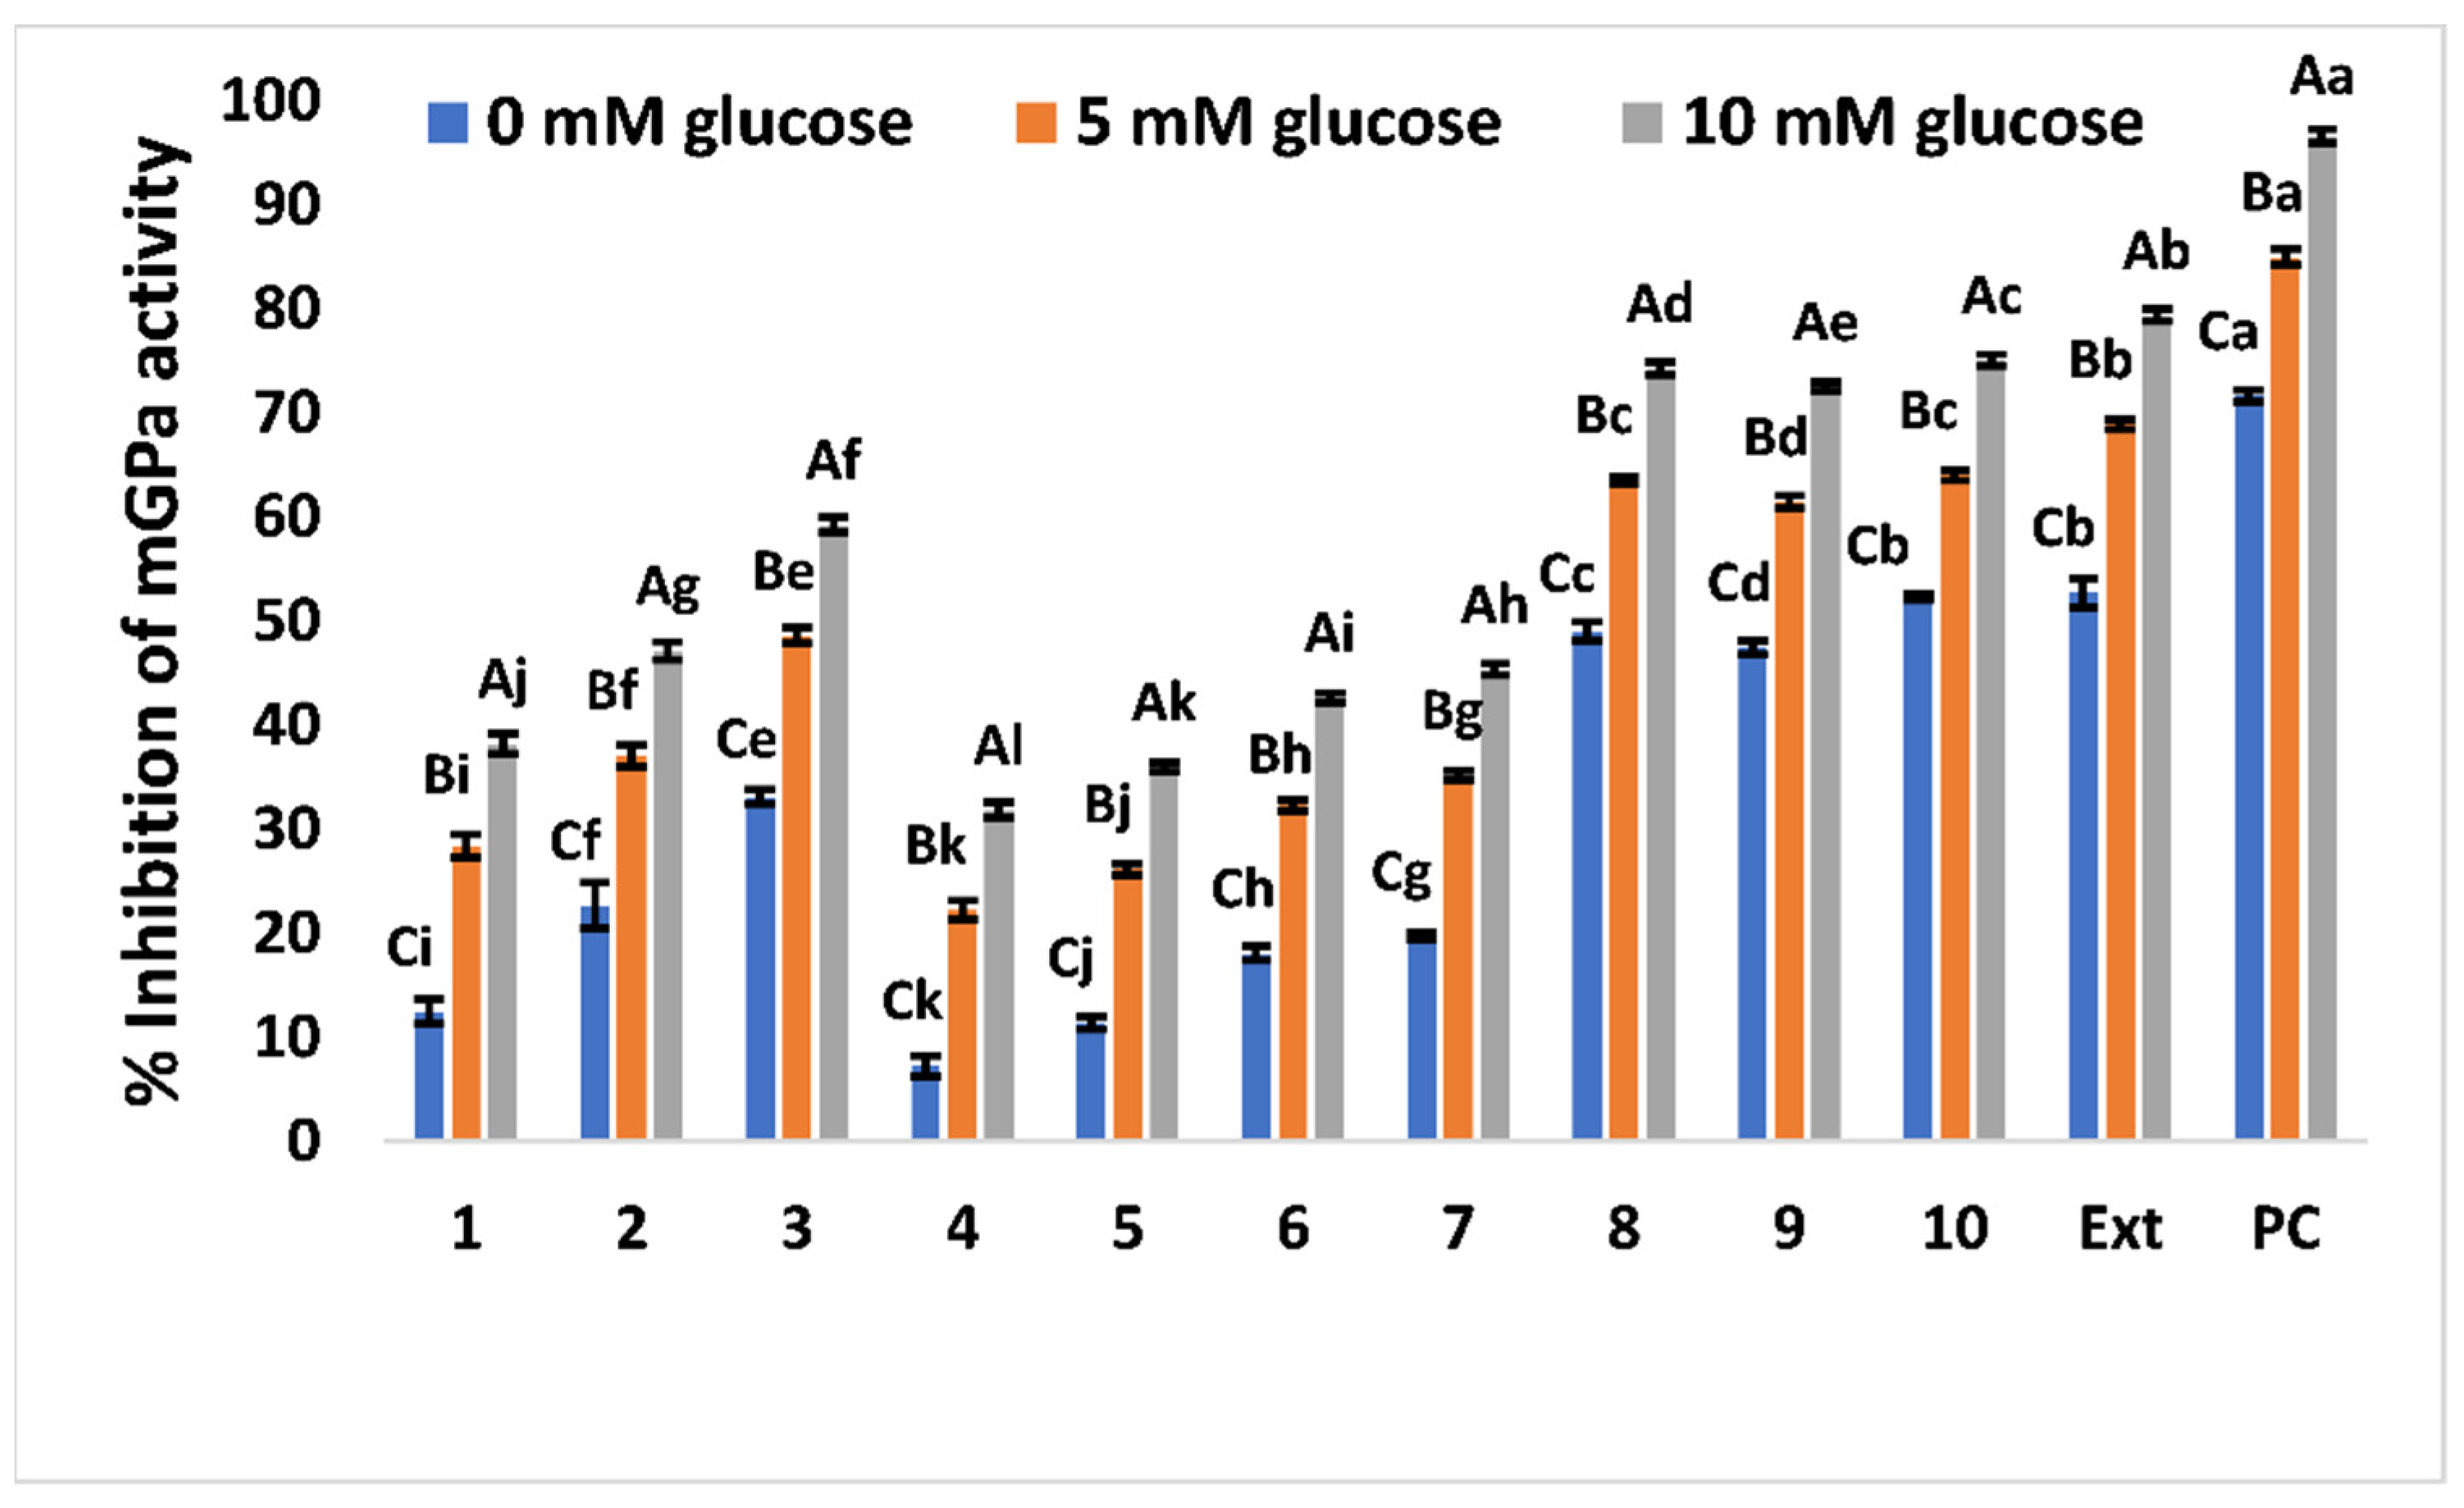
Inhibitory Effect on Glycogen Phosphorylase
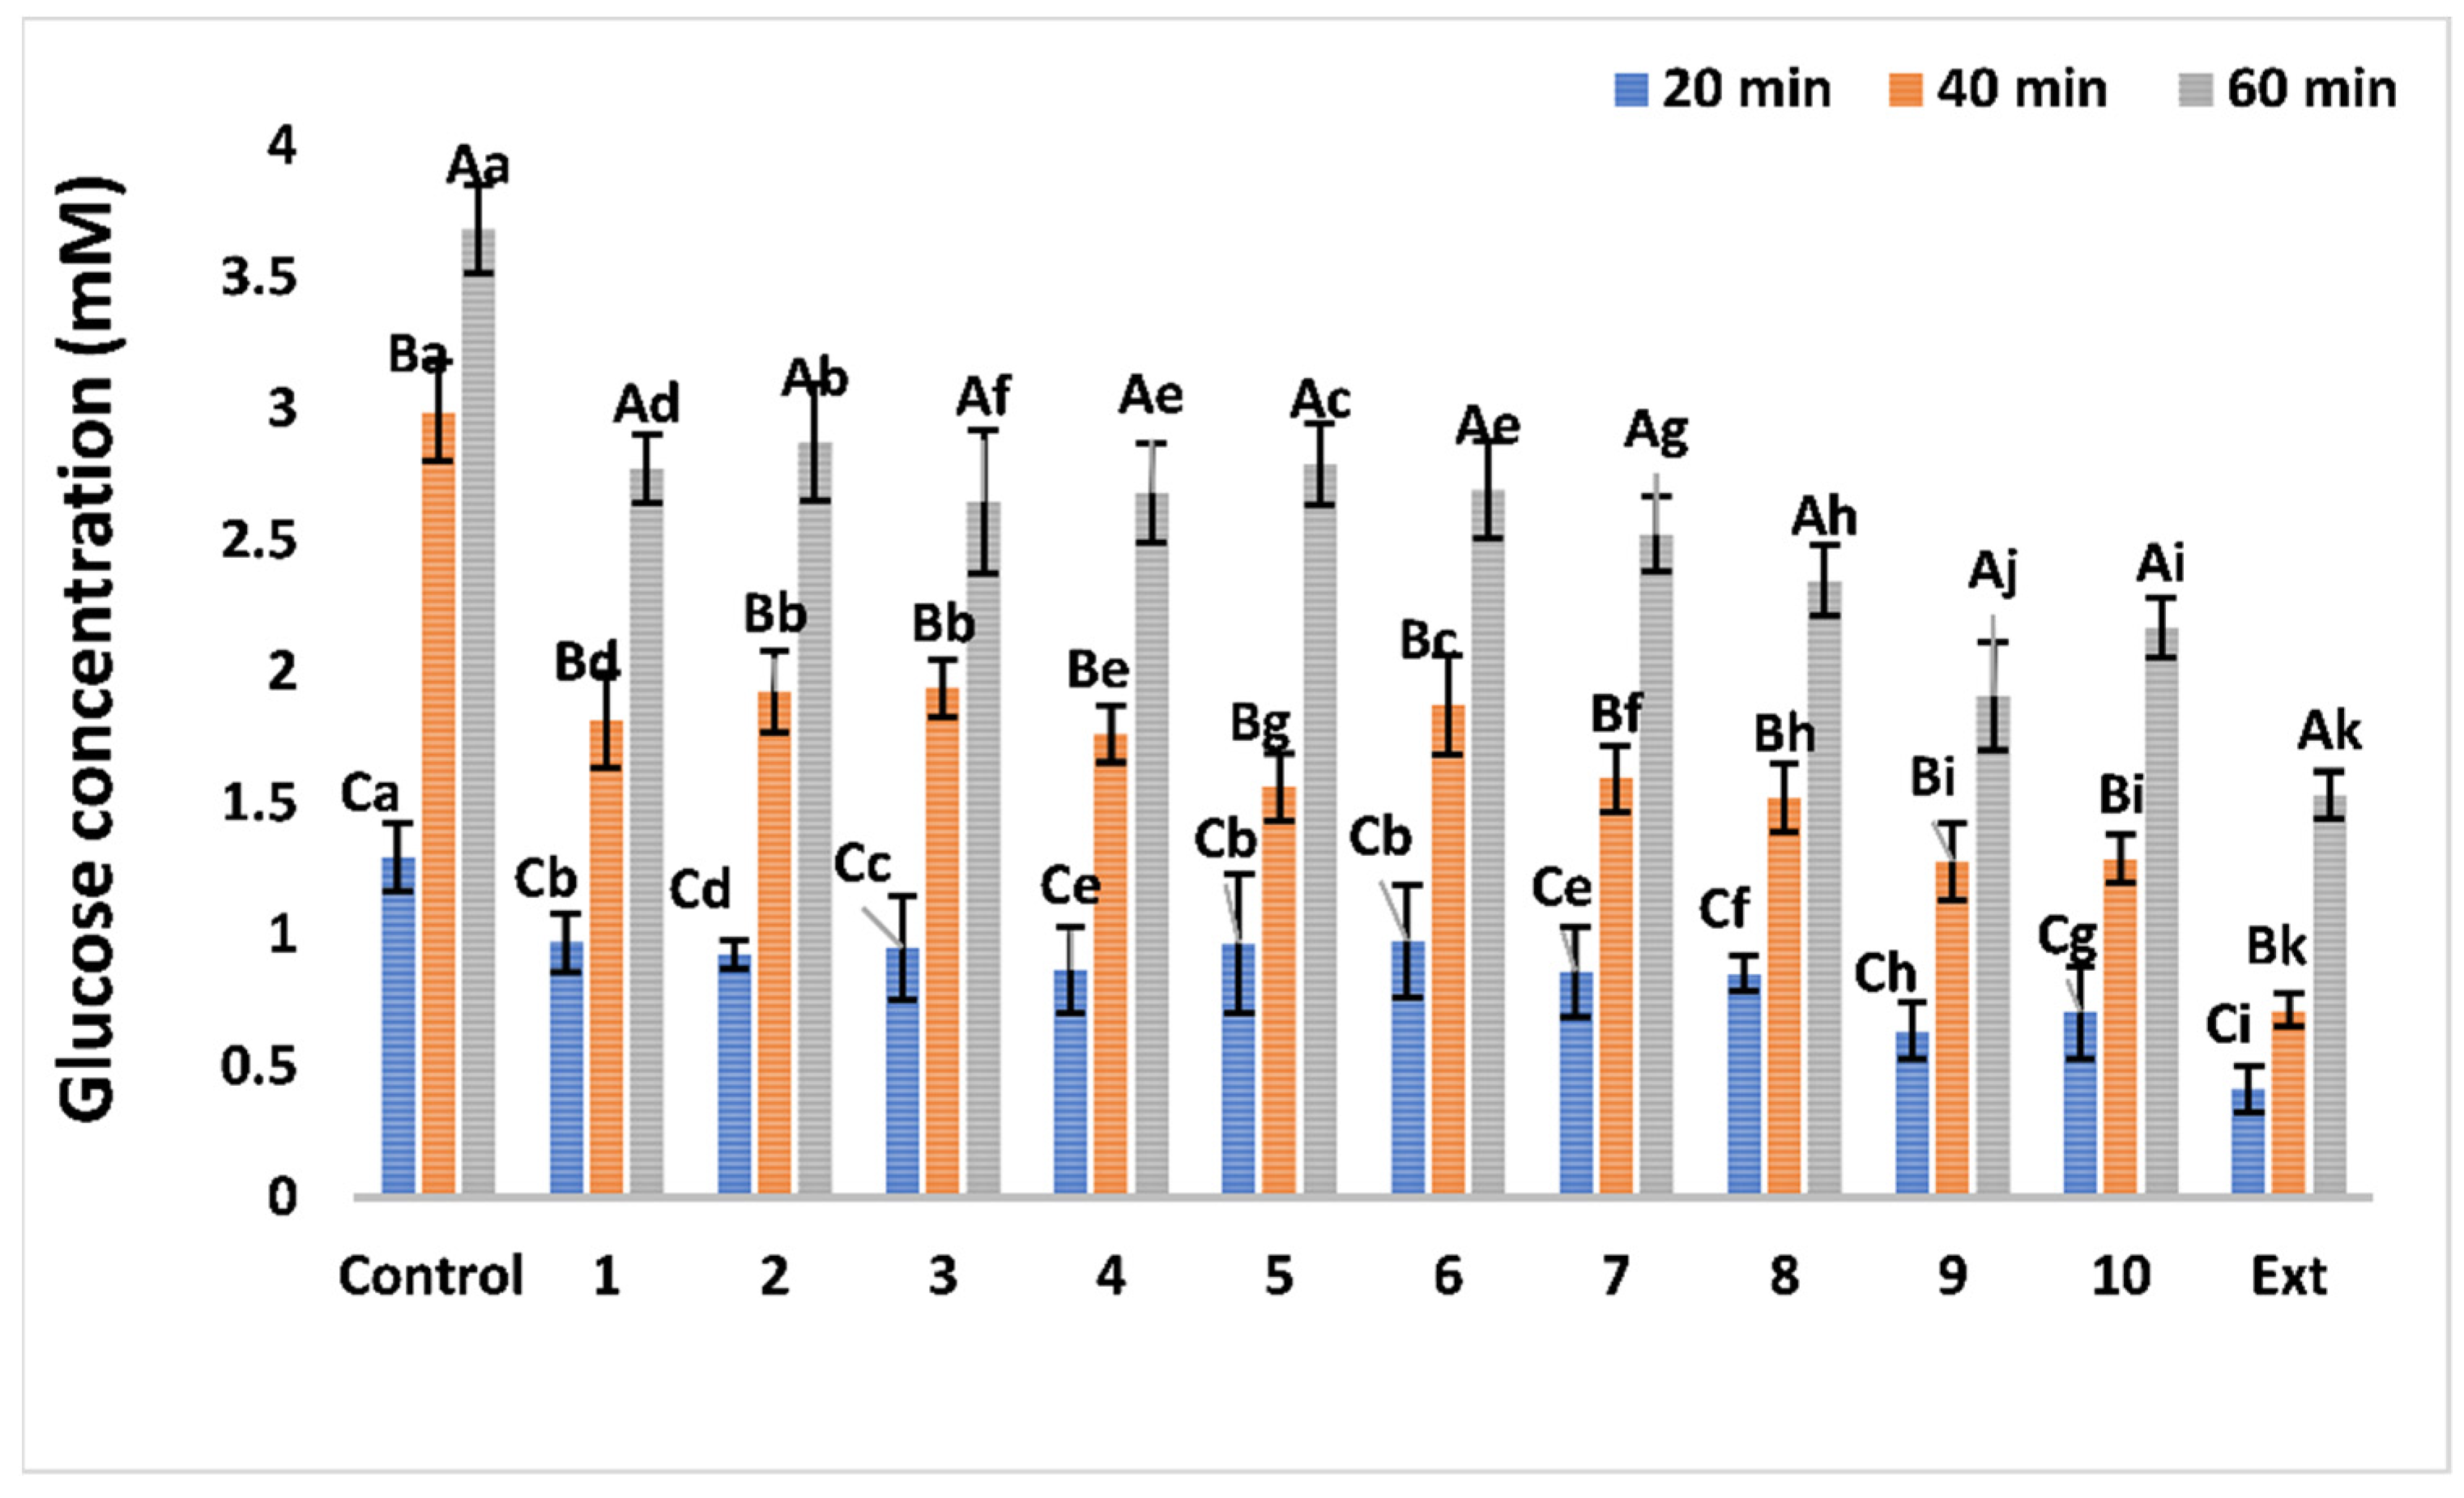
Effects on Glucose Diffusion
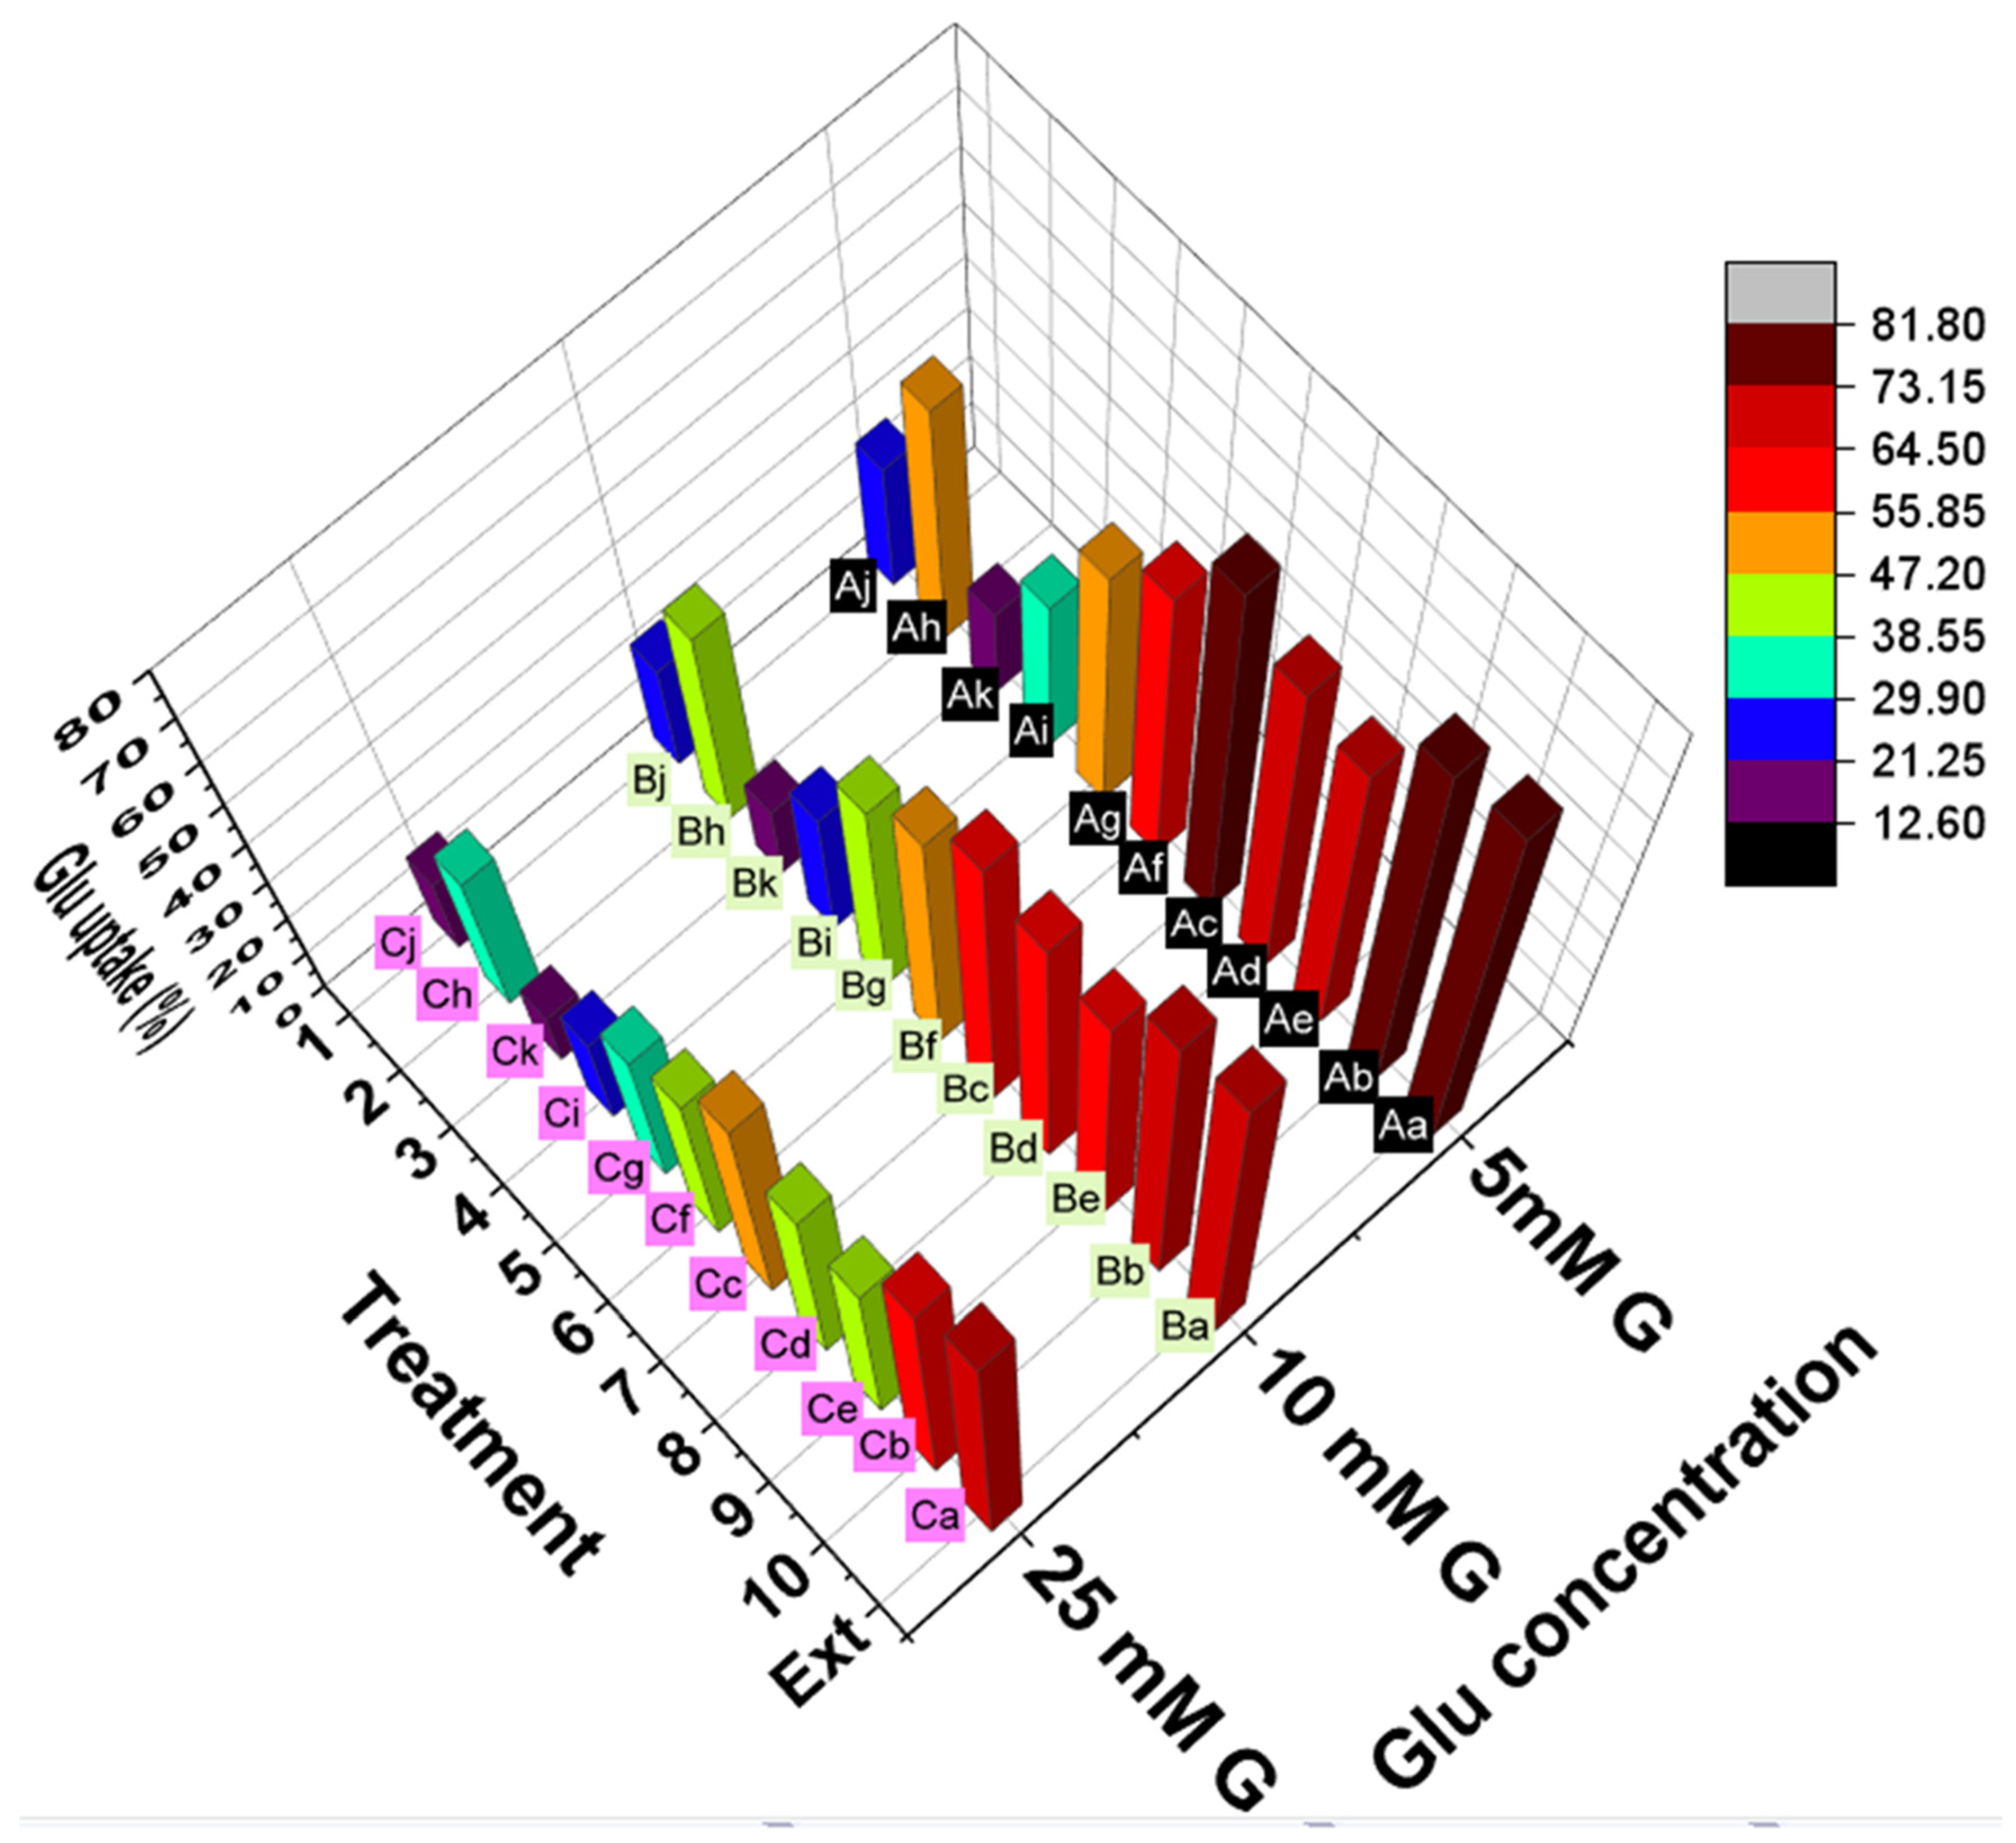
Effects on Glucose Uptake by Yeast Cells
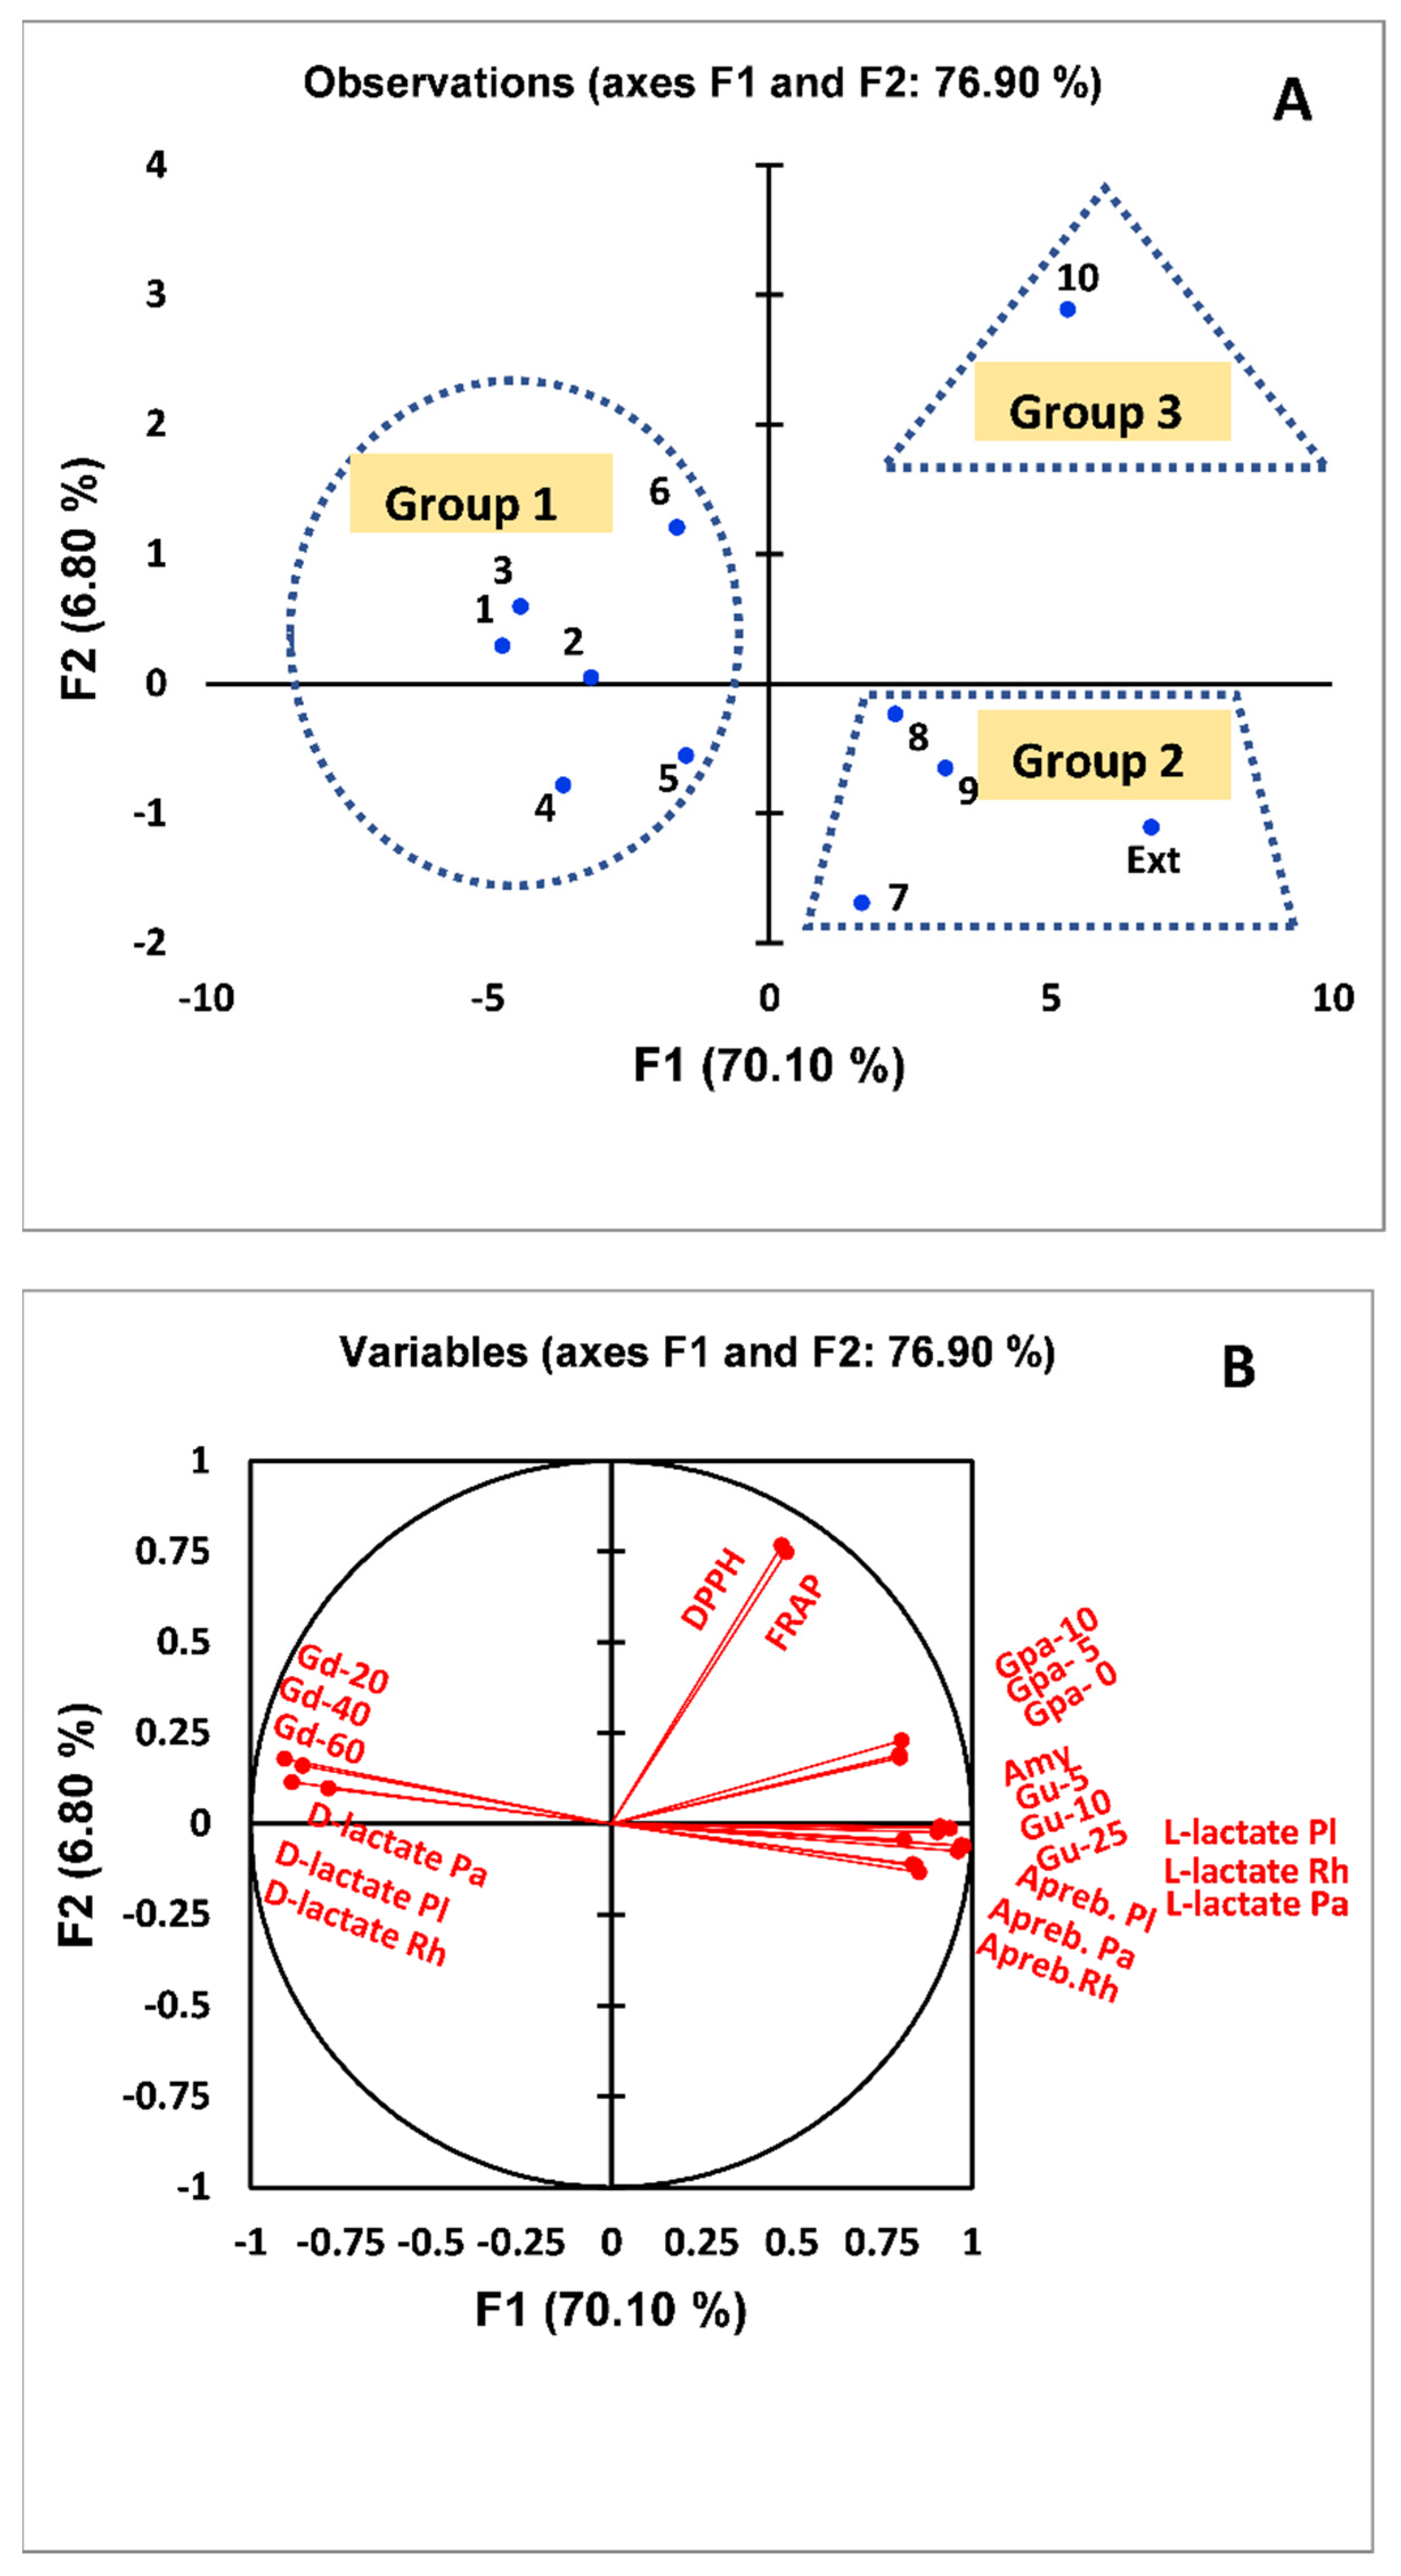
3.4. PCA of the Multifunctional Activity of G. abyssinica Extract and Isolated Compounds
4. Discussion
5. Conclusions
Supplementary Materials
Author Contributions
Funding
Institutional Review Board Statement
Informed Consent Statement
Data Availability Statement
Acknowledgments
Conflicts of Interest
References
- Bello-Ovosi, B.O.; Asuke, S.; Abdulrahman, S.O.; Ibrahim, M.S.; Ovosi, J.O.; Ogunsina, M.A.; Anumah, F.O. Prevalence and correlates of hypertension and diabetes mellitus in an urban community in North-Western Nigeria. Pan Afr. Med. J. 2018, 29, 1–7. [Google Scholar] [CrossRef] [PubMed]
- Hegazi, R.; El-Gamal, M.; Abdel-Hady, N.; Hamdy, O. Epidemiology of and Risk Factors for Type 2 Diabetes in Egypt. Ann. Glob. Health 2015, 81, 814–820. [Google Scholar] [CrossRef] [PubMed] [Green Version]
- Farzaei, F.; Morovati, M.R.; Farjadmand, F.; Farzaei, M.H. A mechanistic review on medicinal plants used for diabetes mellitus in traditional persian medicine. J. Evid.-Based Complement. Altern. Med. 2017, 22, 944–955. [Google Scholar] [CrossRef] [PubMed] [Green Version]
- Erukainure, O.L.; Chukwuma, C.I.; Sanni, O.; Matsabisa, M.G.; Islam, M.S. Histochemistry, phenolic content, antioxidant, and anti-diabetic activities of Vernonia amygdalina leaf extract. J. Food Biochem. 2019, 43, e12737. [Google Scholar] [CrossRef]
- Erukainure, O.L.; Hafizur, R.M.; Kabir, N.; Choudhary, M.I.; Atolani, O.; Banerjee, P.; Preissner, R.; Chukwuma, C.I.; Muhammad, A.; Amonsou, E.O.; et al. Suppressive effects of Clerodendrum volubile P Beauv. [Labiatae] methanolic extract and Its fractions on type 2 diabetes and Its complications. Front. Pharmacol. 2018, 9, 8. [Google Scholar] [CrossRef] [PubMed] [Green Version]
- Chukwuma, C.I.; Mopuri, R.; Nagiah, S.; Chuturgoon, A.A.; Islam, M.S. Erythritol reduces small intestinal glucose absorption, increases muscle glucose uptake, improves glucose metabolic enzymes activities and increases expression of Glut-4 and IRS-1 in type 2 diabetic rats. Eur. J. Nutr. 2018, 57, 2431–2444. [Google Scholar] [CrossRef]
- Nair, C. Upper concave envelopes and auxiliary random variables. Int. J. Adv. Eng. Sci. Appl. Math. 2013, 5, 12–20. [Google Scholar] [CrossRef]
- Arumugam, G.; Manjula, P.; Paari, N. A review: Anti diabetic medicinal plants used for diabetes mellitus. J. Acute Dis. 2013, 2, 196–200. [Google Scholar] [CrossRef] [Green Version]
- Weiss, E.A. Oilseed crops. Tropical series. In Leonard Hill Books New York; Longman Inc.: Los Angeles, CA, USA, 1983; p. 603. [Google Scholar]
- Shivarkar, H.S.; Kashid, P.S. Niger (Guizotia abyssinica): An overview. Int. J. Pharm. Chem. Biol. Sci. 2020, 10, 75–79. [Google Scholar]
- Fatima, A.; Villani, T.S.; Komar, S.; Simon, J.E.; Juliani, H.R. Quality and chemistry of niger seeds (Guizotia abyssinica) grown in the United States. Ind. Crops Prod. 2015, 75, 40–42. [Google Scholar] [CrossRef]
- Getinet, A.; Teklewold, A. An agronomic and seed-quality evaluation of niger (Guizotia abyssinica Cass.) germplasm grown in Ethiopia. Plant Breed. 1995, 114, 375–376. [Google Scholar] [CrossRef]
- Deme, T.; Haki, G.D.; Retta, N.; Woldegiorgis, A.; Geleta, M. Fatty acid profile, total phenolic content, and antioxidant activity of niger seed (Guizotia abyssinica) and linseed (Linum usitatissimum). Front. Nutr. 2021, 8, 674882. [Google Scholar] [CrossRef] [PubMed]
- Kuo, W.-L.; Chen, C.-C.; Chang, P.-H.; Cheng, L.-Y.; Shien, B.-J.; Huang, Y.-L. Flavonoids from Guizotia abyssinica. J. Chin. Med. 2007, 18, 121–128. [Google Scholar]
- Hayes, J.M.; Kantsadi, A.L.; Leonidas, D.D. Natural products and their derivatives as inhibitors of glycogen phosphorylase: Potential treatment for type 2 diabetes. Phytochem. Rev. 2014, 13, 471–498. [Google Scholar] [CrossRef]
- Sun, L.; Wang, Y.; Miao, M. Inhibition of α-amylase by polyphenolic compounds: Substrate digestion, binding interactions and nutritional intervention. Trends Food Sci. Technol. 2020, 104, 190–207. [Google Scholar] [CrossRef]
- Swati, H.; Sourabh, J.; Karunakar, S. In vitro and in vivo anti-diabetic activities of ethanolic leaf extracts of Guizotia abyssinica. GSC Adv. Res. Rev. 2020, 4, 1–6. [Google Scholar] [CrossRef]
- Nazzaro, F.; Fratianni, F.; De Feo, V.; Battistelli, A.; Da Cruz, A.G.; Coppola, R. Chapter two-polyphenols, the new frontiers of prebiotics. In Advances in Food and Nutrition Research; da Cruz, A.G., Prudencio, E.S., Esmerino, E.A., da Silva, M.C., Eds.; Academic Press: Cambridge, MA, USA, 2020; Volume 94, pp. 35–89. [Google Scholar]
- Lee, C.-P.; Yen, G.-C. Antioxidant activity and bioactive compounds of tea seed (Camellia oleifera Abel.) oil. J. Agric. Food Chem. 2006, 54, 779–784. [Google Scholar] [CrossRef]
- Agrawal, P.K. Carbon-13 NMR of Flavonoids; Elsevier: Amsterdam, The Netherlands, 2013. [Google Scholar]
- Porras, G.; Bacsa, J.; Tang, H.; Quave, C.L. Characterization and structural analysis of genkwanin, a natural product from Callicarpa americana. Crystals 2019, 9, 491. [Google Scholar] [CrossRef] [Green Version]
- Nishibe, S.; Tsukamoto, H.; Hisada, S. Effects of O-methylation and O-glucosylation on carbon-13 nuclear magnetic resonance chemical shifts of matairesinol,(+)-pinoresinol and (+)-epipinoresinol. Chem. Pharm. Bull. 1984, 32, 4653–4657. [Google Scholar] [CrossRef]
- Peshin, T.; Kar, H. Isolation and characterization of β-sitosterol-3-O-β-D-glucoside from the extract of the fowers of Viola odorata. Br. J. Pharm. Res. 2017, 16, 1–8. [Google Scholar] [CrossRef] [Green Version]
- Choudhary, M.I.; Naheed, N.; Abbaskhan, A.; Ali, S. Hemiterpene glucosides and other constituents from Spiraea canescens. Phytochemistry 2009, 70, 1467–1473. [Google Scholar] [CrossRef] [PubMed]
- Wang, Q.; Zhou, D.; Chen, Y.; Guan, F.; Yin, M.; Liu, F.; Shan, Y. Flavonoids from Suaeda salsa II. isolation, structural determination, and antioxidant activity. Chem. Nat. Compd. 2018, 54, 354–355. [Google Scholar] [CrossRef]
- Amaro-Luis, J.M.; Koteich-Khatib, S.; Carrillo-Rodríguez, F.; Bahsas, A. Myrsicorianol, a new prenylated benzoic acid derivative from Myrsine coriacea. Nat. Prod. Commun. 2008, 3, 323–327. [Google Scholar] [CrossRef] [Green Version]
- Śliżewska, K.; Chlebicz-Wójcik, A. The in vitro analysis of prebiotics to be used as a component of a synbiotic preparation. Nutrients 2020, 12, 1272. [Google Scholar] [CrossRef] [PubMed]
- Dawood, D.H.; Darwish, M.S.; El-Awady, A.A.; Mohamed, A.H.; Zaki, A.A.; Taher, M.A. Chemical characterization of Cassia fistula polysaccharide (CFP) and its potential application as a prebiotic in synbiotic preparation. RSC Adv. 2021, 11, 13329–13340. [Google Scholar] [CrossRef]
- Yu, M.; Gouvinhas, I.; Rocha, J.; Barros, A.I.R.N.A. Phytochemical and antioxidant analysis of medicinal and food plants towards bioactive food and pharmaceutical resources. Sci. Rep. 2021, 11, 10041. [Google Scholar] [CrossRef]
- Rocha, S.; Lucas, M.; Araújo, A.N.; Corvo, M.L.; Fernandes, E.; Freitas, M. Optimization and Validation of an In Vitro Standardized Glycogen Phosphorylase Activity Assay. Molecules 2021, 26, 4635. [Google Scholar] [CrossRef]
- Elbermawi, A.; Darwish, M.S.; El-Awady, A.A.; Zaki, A.A.; Qiu, L.; Samra, R.M. Isolation and biological activities of compounds from Rumex vesicarius L. and their use as a component of a synbiotic preparation. Food Chem. X 2022, 14, 100306. [Google Scholar] [CrossRef]
- Hu, J.-L.; Nie, S.-P.; Li, C.; Xie, M.-Y. In vitro effects of a novel polysaccharide from the seeds of Plantago asiatica L. on intestinal function. Int. J. Biol. Macromol. 2013, 54, 264–269. [Google Scholar] [CrossRef]
- Miller, G.L. Use of dinitrosalicylic acid reagent for determination of reducing sugar. Anal. Chem. 1959, 31, 426–428. [Google Scholar] [CrossRef]
- Paul, S.; Majumdar, M. In-Vitro antidiabetic propensities, phytochemical analysis, and mechanism of action of commercial antidiabetic polyherbal formulation “mehon”. Multidiscip. Digit. Publ. Inst. Proc. 2020, 79, 7. [Google Scholar] [CrossRef]
- Kumar Singh, A.; Cabral, C.; Kumar, R.; Ganguly, R.; Kumar Rana, H.; Gupta, A.; Rosaria Lauro, M.; Carbone, C.; Reis, F.; Pandey, A.K. Beneficial effects of dietary polyphenols on gut microbiota and strategies to improve delivery efficiency. Nutrients 2019, 11, 2216. [Google Scholar] [CrossRef]
- Bouarab Chibane, L.; Degraeve, P.; Ferhout, H.; Bouajila, J.; Oulahal, N. Plant antimicrobial polyphenols as potential natural food preservatives. J. Sci. Food Agric. 2019, 99, 1457–1474. [Google Scholar] [CrossRef] [PubMed] [Green Version]
- Darwish, M.S.; Qiu, L.; Taher, M.A.; Zaki, A.A.; Abou-Zeid, N.A.; Dawood, D.H.; Shalabi, O.M.A.K.; Khojah, E.; Elawady, A.A. Health benefits of postbiotics produced by E. coli Nissle 1917 in functional yogurt enriched with Cape gooseberry (Physalis peruviana L.). Fermentation 2022, 8, 128. [Google Scholar] [CrossRef]
- Piekarska-Radzik, L.; Klewicka, E. Mutual influence of polyphenols and Lactobacillus spp. bacteria in food: A review. Eur. Food Res. Technol. 2021, 247, 9–24. [Google Scholar] [CrossRef]
- Rodríguez, H.; Curiel, J.A.; Landete, J.M.; de las Rivas, B.; de Felipe, F.L.; Gómez-Cordovés, C.; Mancheño, J.M.; Muñoz, R. Food phenolics and lactic acid bacteria. Int. J. Food Microbiol. 2009, 132, 79–90. [Google Scholar] [CrossRef] [Green Version]
- Cizeikiene, D.; Juodeikiene, G.; Damasius, J. Use of wheat straw biomass in production of L-lactic acid applying biocatalysis and combined lactic acid bacteria strains belonging to the genus Lactobacillus. Biocatal. Agric. Biotechnol. 2018, 15, 185–191. [Google Scholar] [CrossRef]
- Mayeur, C.; Gratadoux, J.-J.; Bridonneau, C.; Chegdani, F.; Larroque, B.; Kapel, N.; Corcos, O.; Thomas, M.; Joly, F. Faecal D/L lactate ratio is a metabolic signature of microbiota imbalance in patients with short bowel syndrome. PLoS ONE 2013, 8, e54335. [Google Scholar] [CrossRef]
- Cheon, M.-J.; Lim, S.-M.; Lee, N.-K.; Paik, H.-D. Probiotic properties and neuroprotective effects of Lactobacillus buchneri KU200793 isolated from Korean fermented foods. Int. J. Mol. Sci. 2020, 21, 1227. [Google Scholar] [CrossRef] [Green Version]
- Shokryazdan, P.; Jahromi, M.F.; Liang, J.B.; Sieo, C.C.; Kalavathy, R.; Idrus, Z.; Ho, Y.W. In Vitro assessment of bioactivities of Lactobacillus strains as potential probiotics for humans and chickens. J. Food Sci. 2017, 82, 2734–2745. [Google Scholar] [CrossRef]
- Aziz, G.; Fakhar, H.; Rahman, S.u.; Tariq, M.; Zaidi, A. An assessment of the aggregation and probiotic characteristics of Lactobacillus species isolated from native (desi) chicken gut. J. Appl. Poult. Res. 2019, 28, 846–857. [Google Scholar] [CrossRef]
- Ng, S.Y.; Koon, S.S.; Padam, B.S.; Chye, F.Y. Evaluation of probiotic potential of lactic acid bacteria isolated from traditional Malaysian fermented Bambangan (Mangifera pajang). Cyta-J. Food 2015, 13, 563–572. [Google Scholar] [CrossRef]
- Kumar, S.; Pandey, A.K. Chemistry and biological activities of flavonoids: An Overview. Sci. World J. 2013, 2013, 162750. [Google Scholar] [CrossRef] [PubMed] [Green Version]
- Pietta, P.G. Flavonoids as antioxidants. J. Nat. Prod. 2000, 63, 1035–1042. [Google Scholar] [CrossRef]
- Hayder, N.; Bouhlel, I.; Skandrani, I.; Kadri, M.; Steiman, R.; Guiraud, P.; Mariotte, A.M.; Ghedira, K.; Dijoux-Franca, M.G.; Chekir-Ghedira, L. In vitro antioxidant and antigenotoxic potentials of myricetin-3-o-galactoside and myricetin-3-o-rhamnoside from Myrtus communis: Modulation of expression of genes involved in cell defence system using cDNA microarray. Toxicol. Vitr. 2008, 22, 567–581. [Google Scholar] [CrossRef]
- Mendes, R.A.; Almeida, S.K.C.; Soares, I.N.; Barboza, C.A.; Freitas, R.G.; Brown, A.; de Souza, G.L.C. Evaluation of the antioxidant potential of myricetin 3-O-α-L-rhamnopyranoside and myricetin 4(')-O-α-L-rhamnopyranoside through a computational study. J. Mol. Model. 2019, 25, 89. [Google Scholar] [CrossRef]
- Yamauchi, S.; Sugahara, T.; Matsugi, J.; Someya, T.; Masuda, T.; Kishida, T.; Akiyama, K.; Maruyama, M. Effect of the benzylic structure of lignan on antioxidant activity. Biosci. Biotechnol. Biochem. 2007, 71, 2283–2290. [Google Scholar] [CrossRef] [Green Version]
- Eklund, P.C.; Långvik, O.K.; Wärnå, J.P.; Salmi, T.O.; Willför, S.M.; Sjöholm, R.E. Chemical studies on antioxidant mechanisms and free radical scavenging properties of lignans. Org. Biomol. Chem. 2005, 3, 3336–3347. [Google Scholar] [CrossRef]
- Leu, Y.L.; Lin, C.L.; Kuo, P.C. Constituents from Senecio scandens and their antioxidant bioactivity. Arch. Pharmacal Res. 2011, 34, 377–382. [Google Scholar] [CrossRef]
- Nakai, M.; Harada, M.; Nakahara, K.; Akimoto, K.; Shibata, H.; Miki, W.; Kiso, Y. Novel antioxidative metabolites in rat liver with ingested sesamin. J. Agric. Food Chem. 2003, 51, 1666–1670. [Google Scholar] [CrossRef]
- Wan, Y.; Li, H.; Fu, G.; Chen, X.; Chen, F.; Xie, M. The relationship of antioxidant components and antioxidant activity of sesame seed oil. J. Sci. Food Agric. 2015, 95, 2571–2578. [Google Scholar] [CrossRef] [PubMed]
- Proença, C.; Freitas, M.; Ribeiro, D.; Tomé, S.M.; Oliveira, E.F.T.; Viegas, M.F.; Araújo, A.N.; Ramos, M.J.; Silva, A.M.S.; Fernandes, P.A. Evaluation of a flavonoids library for inhibition of pancreatic α-amylase towards a structure–activity relationship. J. Enzym. Inhib. Med. Chem. 2019, 34, 577–588. [Google Scholar] [CrossRef] [PubMed]
- Cao, H.; Chen, X. Structures required of flavonoids for inhibiting digestive enzymes. Anti-Cancer Agents Med. Chem. 2012, 12, 929–939. [Google Scholar] [CrossRef] [PubMed]
- Gonzales, G.B.; Smagghe, G.; Grootaert, C.; Zotti, M.; Raes, K.; Camp, J.V. Flavonoid interactions during digestion, absorption, distribution and metabolism: A sequential structure–activity/property relationship-based approach in the study of bioavailability and bioactivity. Drug Metab. Rev. 2015, 47, 175–190. [Google Scholar] [CrossRef]
- Lo Piparo, E.; Scheib, H.; Frei, N.; Williamson, G.; Grigorov, M.; Chou, C.J. Flavonoids for controlling starch digestion: Structural requirements for inhibiting human α-amylase. J. Med. Chem. 2008, 51, 3555–3561. [Google Scholar] [CrossRef]
- Rocha, S.; Aniceto, N.; Guedes, R.C.; Albuquerque, H.M.T.; Silva, V.L.M.; Silva, A.M.S.; Corvo, M.L.; Fernandes, E.; Freitas, M. An In Silico and an In Vitro inhibition analysis of glycogen phosphorylase by Flavonoids, styrylchromones, and pyrazoles. Nutrients 2022, 14, 306. [Google Scholar] [CrossRef]
- Chetter, B.A.; Kyriakis, E.; Barr, D.; Karra, A.G.; Katsidou, E.; Koulas, S.M.; Skamnaki, V.T.; Snape, T.J.; Psarra, A.-M.G.; Leonidas, D.D.; et al. Synthetic flavonoid derivatives targeting the glycogen phosphorylase inhibitor site: QM/MM-PBSA motivated synthesis of substituted 5,7-dihydroxyflavones, crystallography, in vitro kinetics and ex-vivo cellular experiments reveal novel potent inhibitors. Bioorganic Chem. 2020, 102, 104003. [Google Scholar] [CrossRef]
- Brás, N.F.; Neves, R.P.P.; Lopes, F.A.A.; Correia, M.A.S.; Palma, A.S.; Sousa, S.F.; Ramos, M.J. Combined in silico and in vitro studies to identify novel antidiabetic flavonoids targeting glycogen phosphorylase. Bioorganic Chem. 2021, 108, 104552. [Google Scholar] [CrossRef]
- Jakobs, S.; Fridrich, D.; Hofem, S.; Pahlke, G.; Eisenbrand, G. Natural flavonoids are potent inhibitors of glycogen phosphorylase. Mol. Nutr. Food Res. 2006, 50, 52–57. [Google Scholar] [CrossRef]
- Sattar, N.A.; Hussain, F.; Iqbal, T.; Sheikh, M.A. Determination of in vitro antidiabetic effects of Zingiber officinale Roscoe. Braz. J. Pharm. Sci. 2012, 48, 601–607. [Google Scholar] [CrossRef] [Green Version]
- Gallagher, A.M.; Flatt, P.R.; Duffy, G.; Abdel-Wahab, Y.H.A. The effects of traditional antidiabetic plants on in vitro glucose diffusion. Nutr. Res. 2003, 23, 413–424. [Google Scholar] [CrossRef]
- Büyükbalci, A.; El, S.N. Determination of in vitro antidiabetic effects, antioxidant activities and phenol contents of some herbal teas. Plant Foods Hum. Nutr. 2008, 63, 27–33. [Google Scholar] [CrossRef]
- Qujeq, D.; Babazadeh, A. The entrapment ability of aqueous and ethanolic extract of teucrium polium: Glucose diffusion into the external solution. Int. J. Mol. Cell. Med. 2013, 2, 93–96. [Google Scholar] [PubMed]
- Amoako, D.; Awika, J.M. Polyphenol interaction with food carbohydrates and consequences on availability of dietary glucose. Curr. Opin. Food Sci. 2016, 8, 14–18. [Google Scholar] [CrossRef]
- Phan, A.D.T.; Netzel, G.; Wang, D.; Flanagan, B.M.; D’Arcy, B.R.; Gidley, M.J. Binding of dietary polyphenols to cellulose: Structural and nutritional aspects. Food Chem. 2015, 171, 388–396. [Google Scholar] [CrossRef] [PubMed]
- Bordenave, N.; Hamaker, B.R.; Ferruzzi, M.G. Nature and consequences of non-covalent interactions between flavonoids and macronutrients in foods. Food Funct. 2014, 5, 18–34. [Google Scholar] [CrossRef]
- Tang, H.R.; Covington, A.D.; Hancock, R.A. Structure–activity relationships in the hydrophobic interactions of polyphenols with cellulose and collagen. Biopolym. Orig. Res. Biomol. 2003, 70, 403–413. [Google Scholar] [CrossRef]
- Le Bourvellec, C.; Renard, C.M. Interactions between polyphenols and macromolecules: Quantification methods and mechanisms. Crit. Rev. Food Sci. Nutr. 2012, 52, 213–248. [Google Scholar] [CrossRef]
- Pinelo, M.; Arnous, A.; Meyer, A.S. Upgrading of grape skins: Significance of plant cell-wall structural components and extraction techniques for phenol release. Trends Food Sci. Technol. 2006, 17, 579–590. [Google Scholar] [CrossRef]
- Padayachee, A.; Netzel, G.; Netzel, M.; Day, L.; Zabaras, D.; Mikkelsen, D.; Gidley, M.J. Binding of polyphenols to plant cell wall analogues–Part 1: Anthocyanins. Food Chem. 2012, 134, 155–161. [Google Scholar] [CrossRef]
- Rehman, G.; Hamayun, M.; Iqbal, A.; Ul Islam, S.; Arshad, S.; Zaman, K.; Ahmad, A.; Shehzad, A.; Hussain, A.; Lee, I. In vitro antidiabetic effects and antioxidant potential of Cassia nemophila pods. BioMed Res. Int. 2018, 2018, 1–6. [Google Scholar] [CrossRef] [PubMed] [Green Version]
- Bhinge, S.D.; Bhutkar, M.A.; Randive, D.S.; Wadkar, G.H.; Hasabe, T.S. In vitro hypoglycemic effects of unripe and ripe fruits of Musa sapientum. Braz. J. Pharm. Sci. 2018, 53. [Google Scholar] [CrossRef]
- Singh, V.; Bedi, G.K.; Shri, R. In vitro and In vivo antidiabetic evaluation of selected culinary-medicinal mushrooms (Agaricomycetes). Int. J. Med. Mushrooms 2017, 19, 17–25. [Google Scholar] [CrossRef] [PubMed]


| Compounds | Antioxidant Activity in FRAP Assay | Antioxidant Activity in DPPH Assay |
|---|---|---|
| (µmol TE/g Compound or Extract) | (µmol TE/g Compound or Extract) | |
| 1 | 492 ± 4.58 e | 192.67 ± 5.03 d |
| 2 | 122.33 ± 1.53 gh | 24.45 ± 0.80 g |
| 3 | 131.67 ± 5.69 g | 12.67 ± 1.16 h |
| 4 | 105.67 ± 3.5 h | 7.36 ± 0.95 h |
| 5 | 694.26 ± 5.45 d | 107.57 ± 3.5 e |
| 6 | 2119.33 ± 6.03 b | 237 ± 3.0 c |
| 7 | 149 ± 7.55 f | 18.55 ± 0.94 g |
| 8 | 508.67 ± 8.02 e | 108.84 ± 3.05 e |
| 9 | 688 ± 6.57 d | 63.74 ± 3.2 f |
| 10 | 2666.67 ± 7.5 a | 4635.33 ± 6.02 a |
| G. abyssinicaextract | 1059 ± 4.58 c | 378 ± 7.9 b |
Publisher’s Note: MDPI stays neutral with regard to jurisdictional claims in published maps and institutional affiliations. |
© 2022 by the authors. Licensee MDPI, Basel, Switzerland. This article is an open access article distributed under the terms and conditions of the Creative Commons Attribution (CC BY) license (https://creativecommons.org/licenses/by/4.0/).
Share and Cite
Elbermawi, A.; Darwish, M.S.; Zaki, A.A.; Abou-Zeid, N.A.; Taher, M.A.; Khojah, E.; Bokhari, S.A.; Soliman, A.F. In Vitro Antidiabetic, Antioxidant, and Prebiotic Activities of the Chemical Compounds Isolated from Guizotia abyssinica. Antioxidants 2022, 11, 2482. https://doi.org/10.3390/antiox11122482
Elbermawi A, Darwish MS, Zaki AA, Abou-Zeid NA, Taher MA, Khojah E, Bokhari SA, Soliman AF. In Vitro Antidiabetic, Antioxidant, and Prebiotic Activities of the Chemical Compounds Isolated from Guizotia abyssinica. Antioxidants. 2022; 11(12):2482. https://doi.org/10.3390/antiox11122482
Chicago/Turabian StyleElbermawi, Ahmed, Mohamed Samir Darwish, Ahmed A. Zaki, Noha A. Abou-Zeid, Mohamed A. Taher, Ebtihal Khojah, Somaiah A. Bokhari, and Amal F. Soliman. 2022. "In Vitro Antidiabetic, Antioxidant, and Prebiotic Activities of the Chemical Compounds Isolated from Guizotia abyssinica" Antioxidants 11, no. 12: 2482. https://doi.org/10.3390/antiox11122482