Characteristic of Stimulus Frequency Otoacoustic Emissions: Detection Rate, Musical Training Influence, and Gain Function

Abstract
:1. Introduction
2. Materials and Methods
2.1. Participants
2.2. Instruments
2.3. Design and Procedure
2.4. Data Analysis
2.4.1. Experiment 1: Detection Rates
2.4.2. Experiment 2: Musical Training Influence
2.4.3. Experiment 3: Gain Function
3. Results
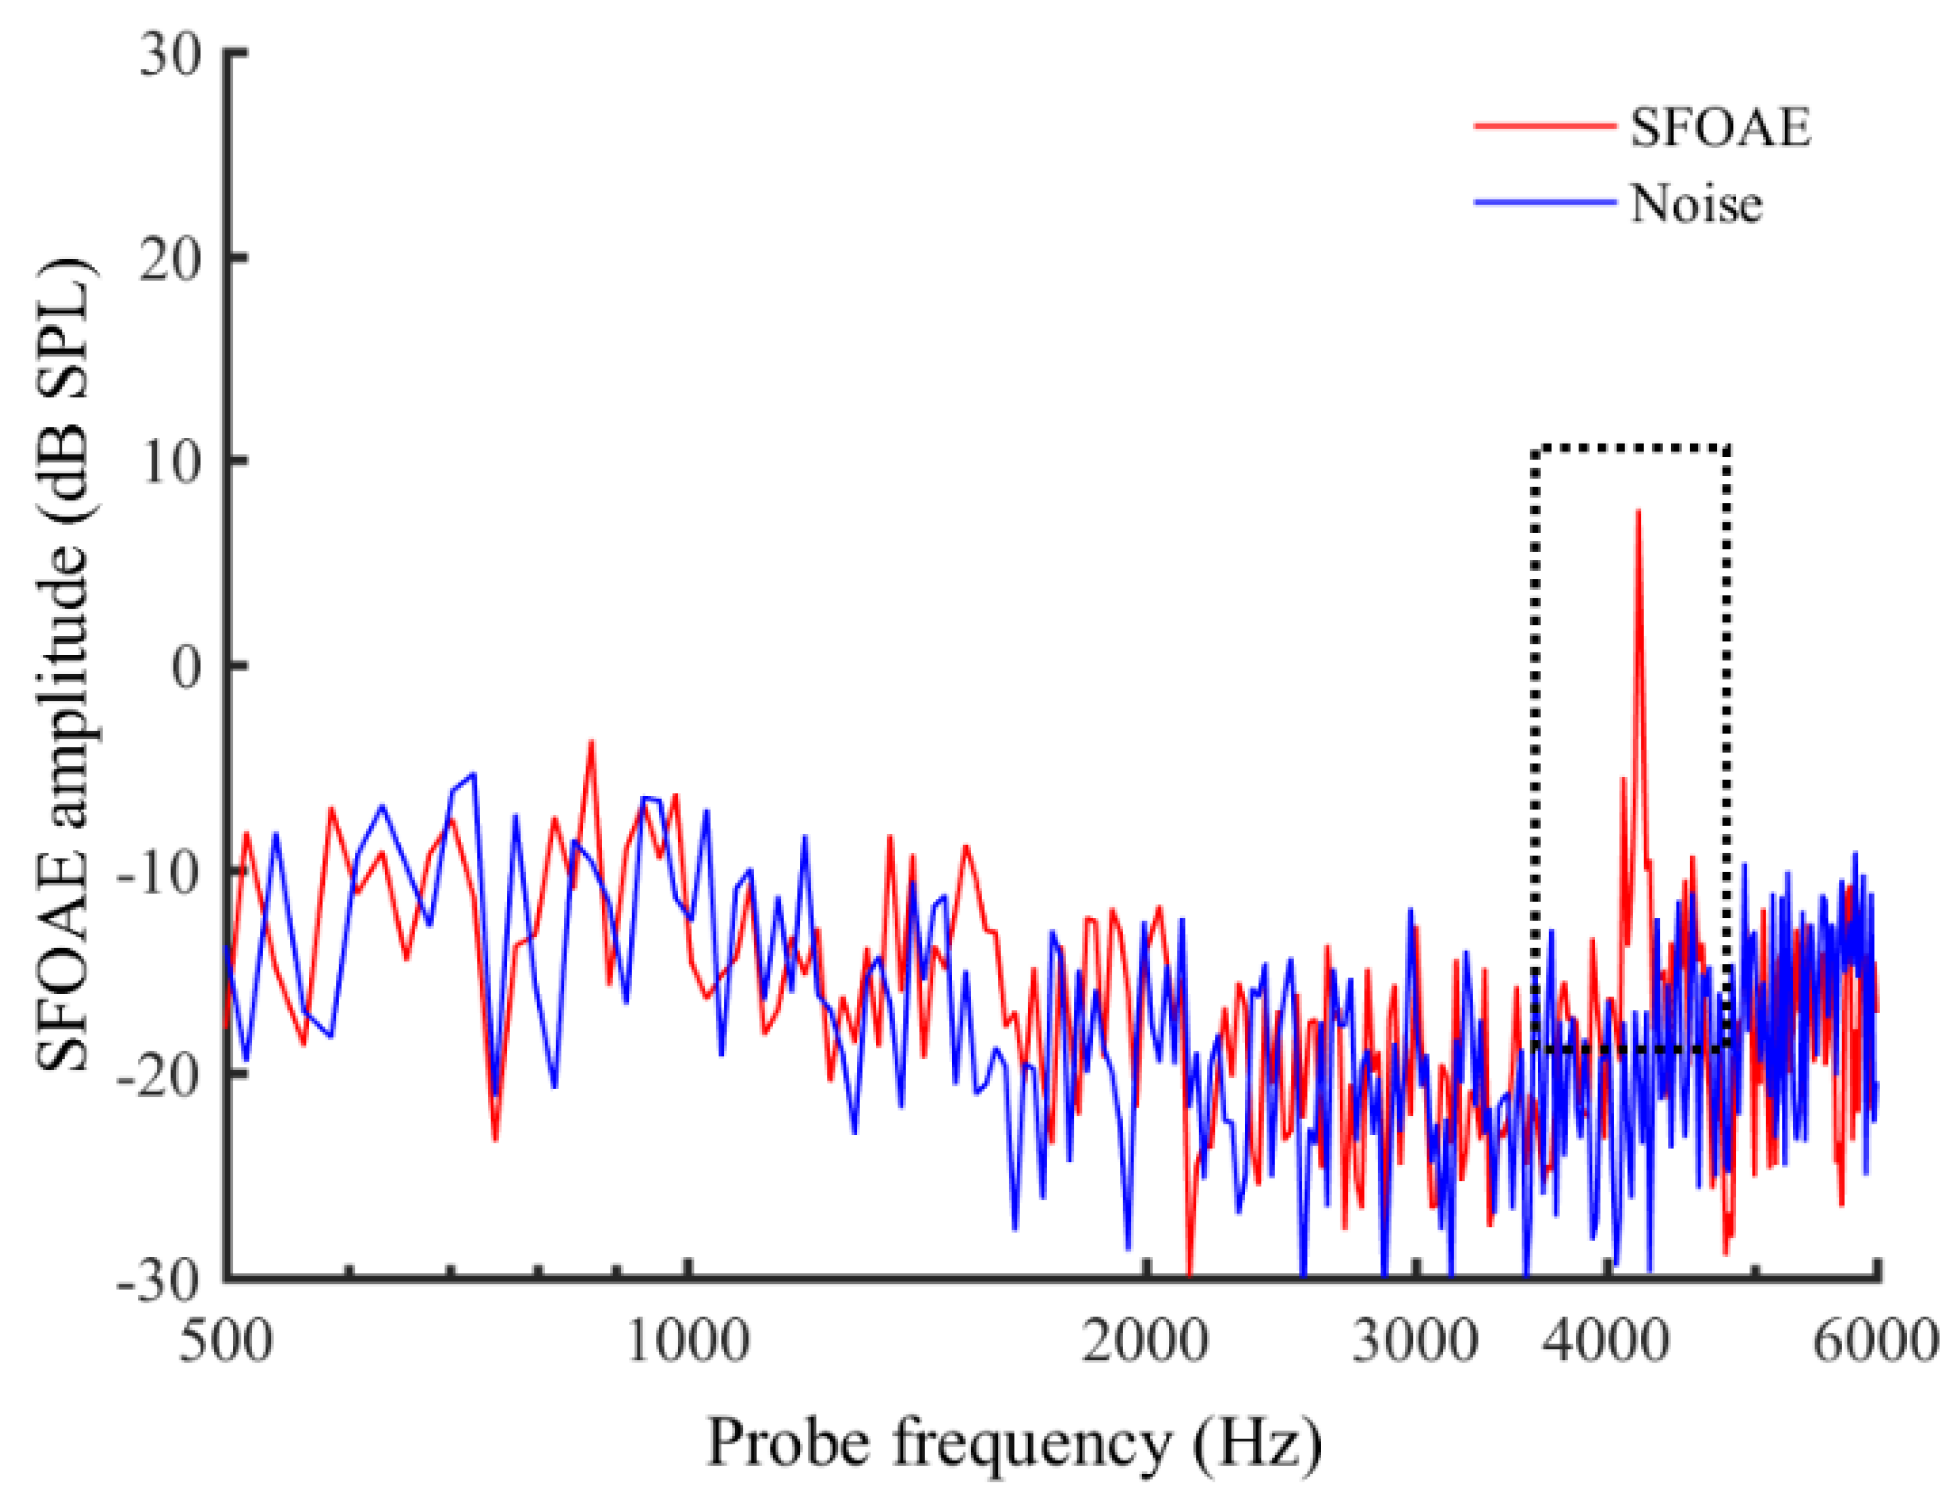
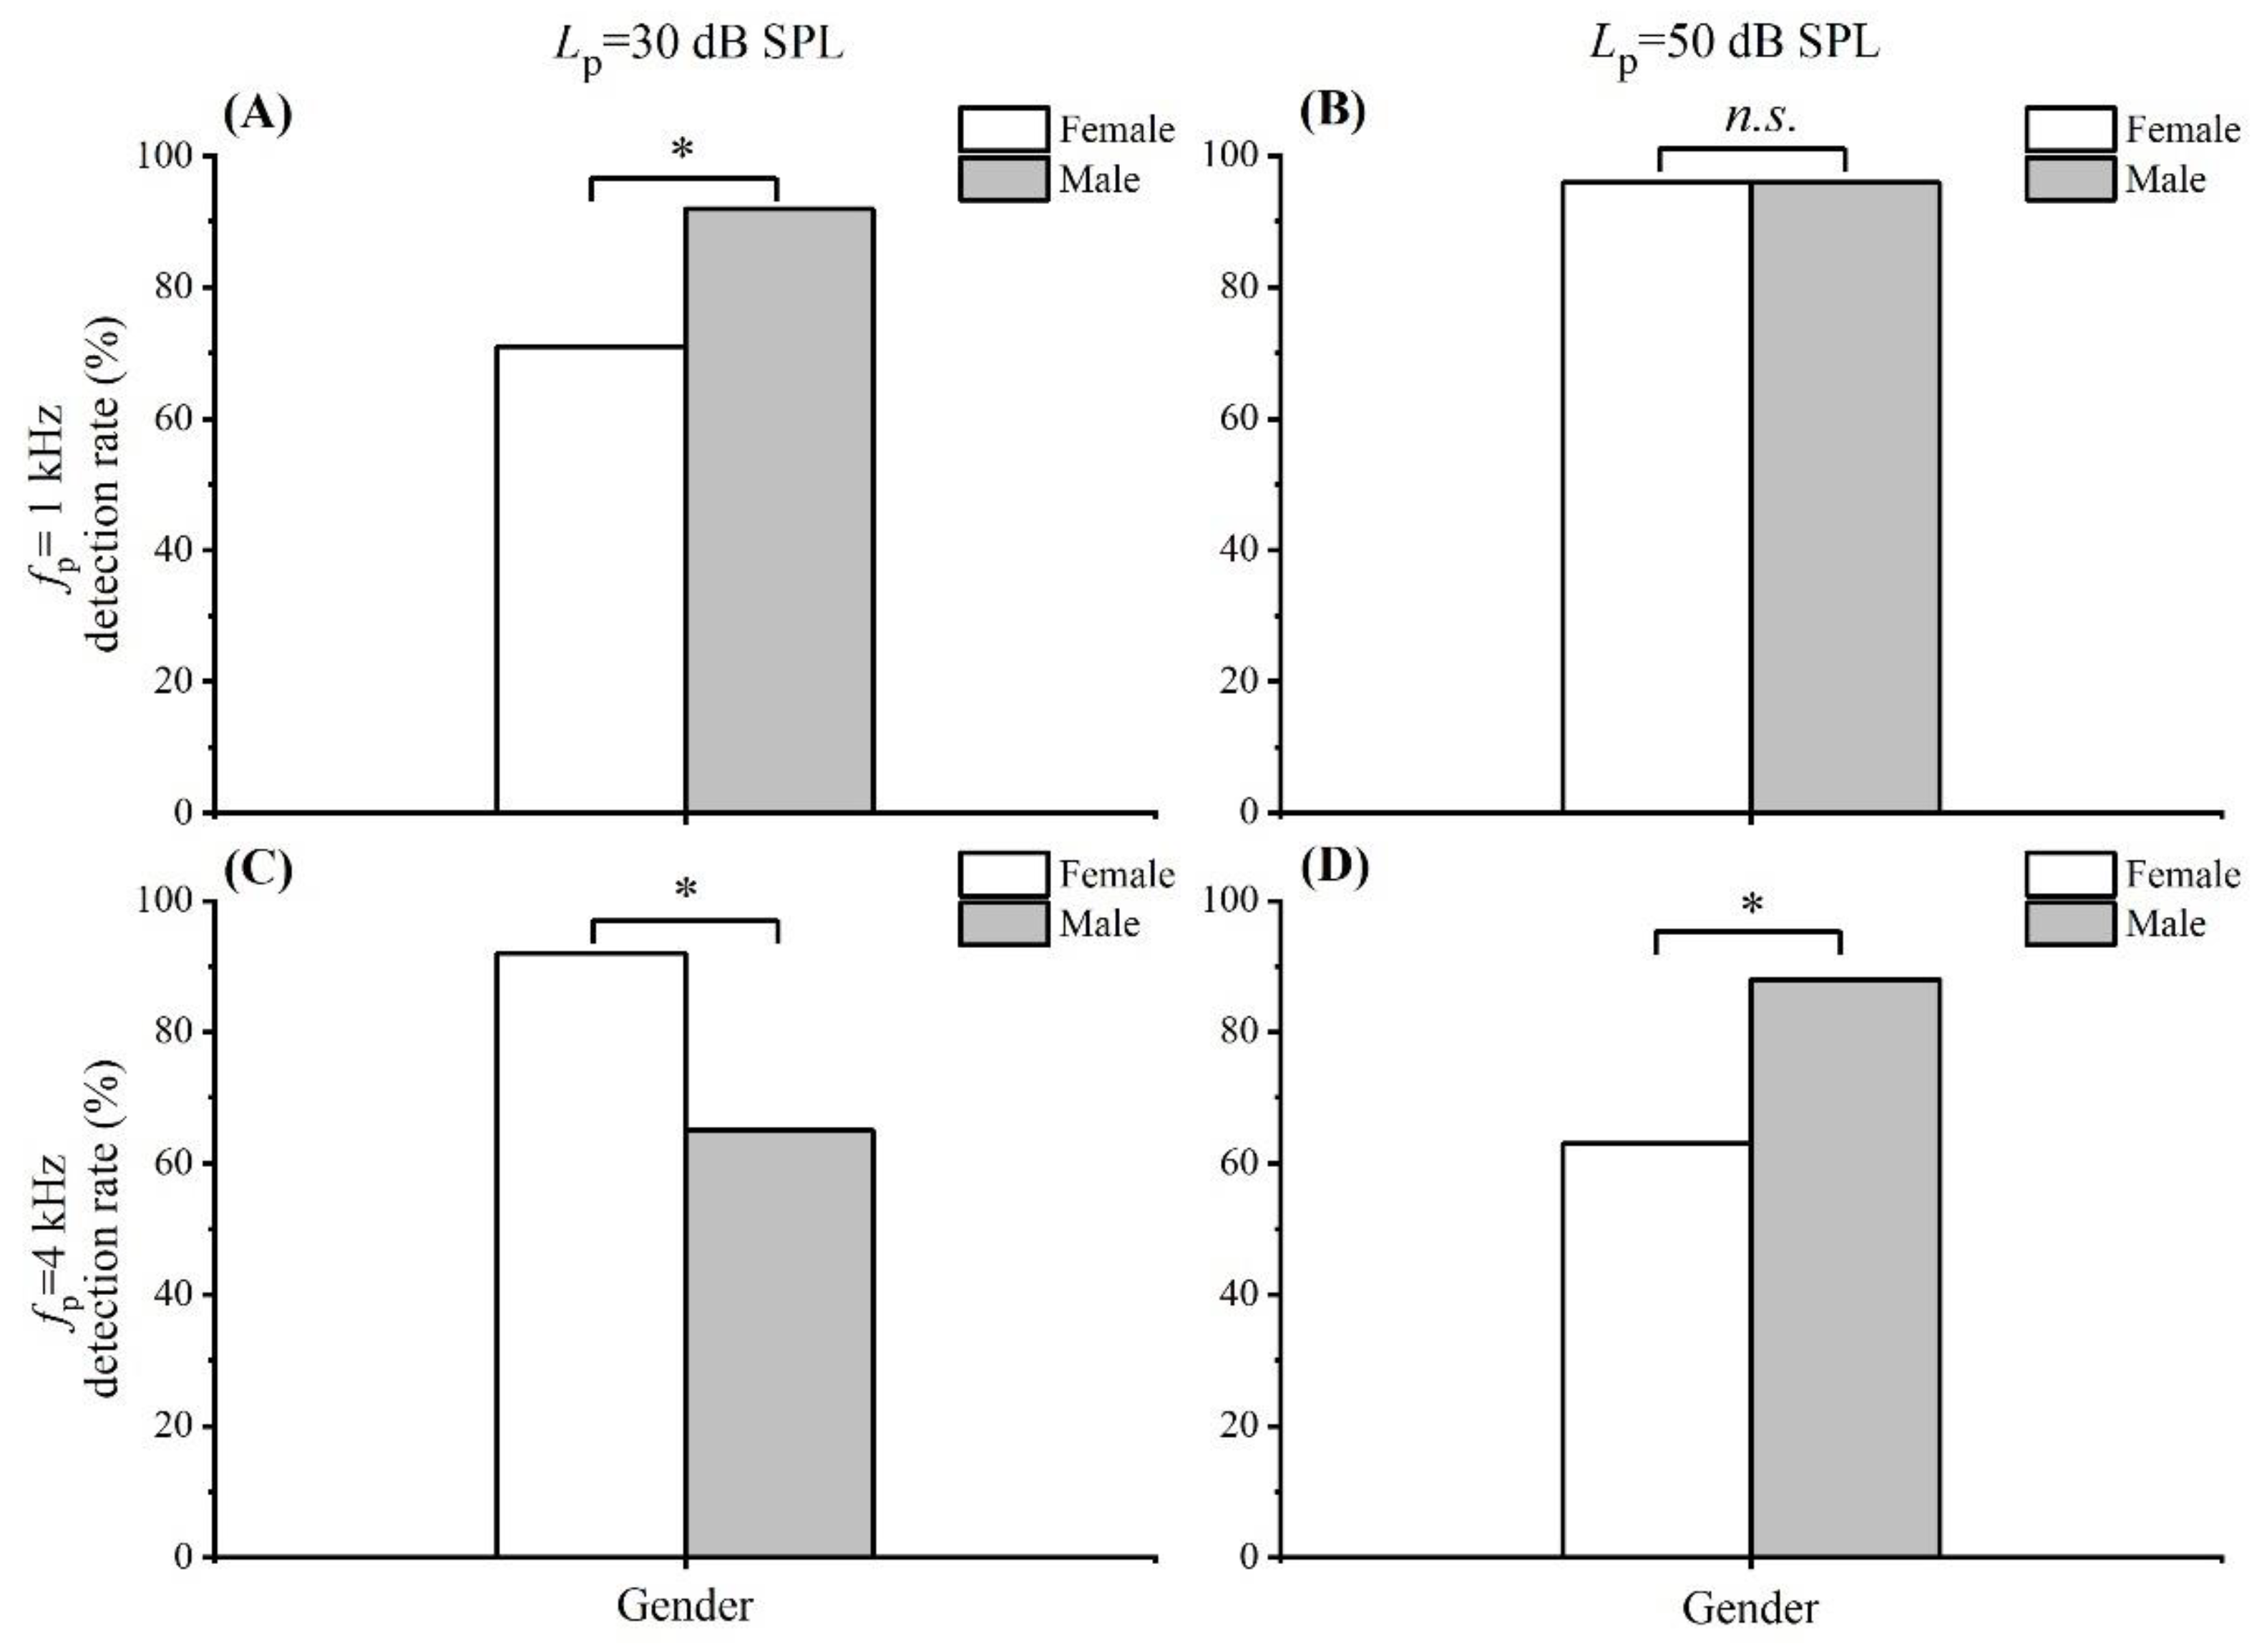
3.1. Detection Rate
3.2. Musical Training Influence
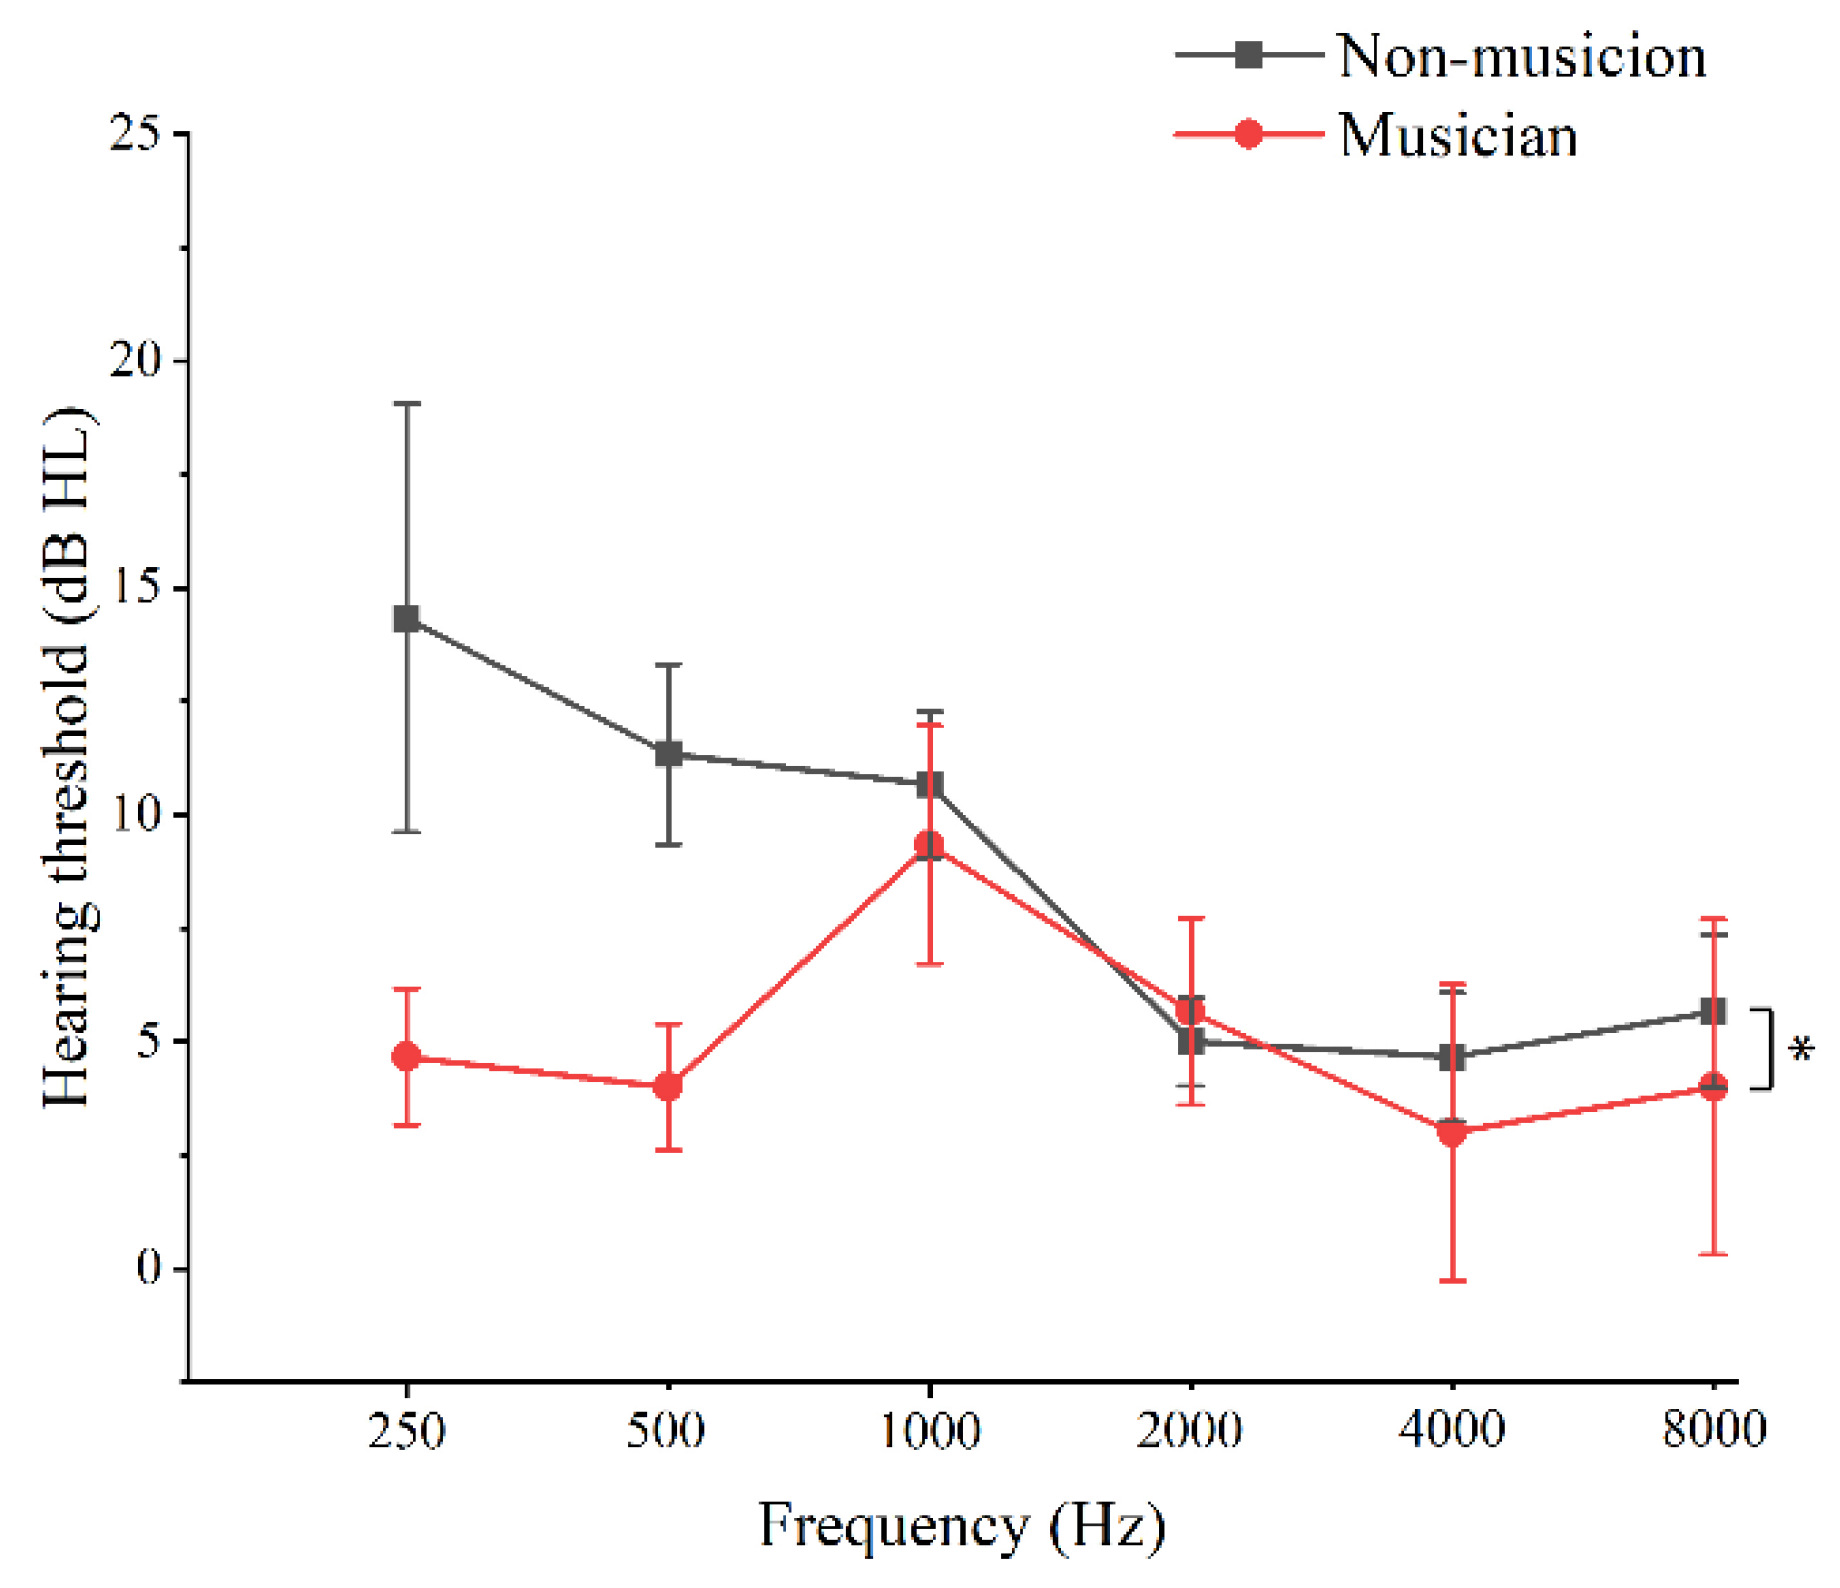
3.2.1. PTA Test Results between Musicians and Non-Musicians
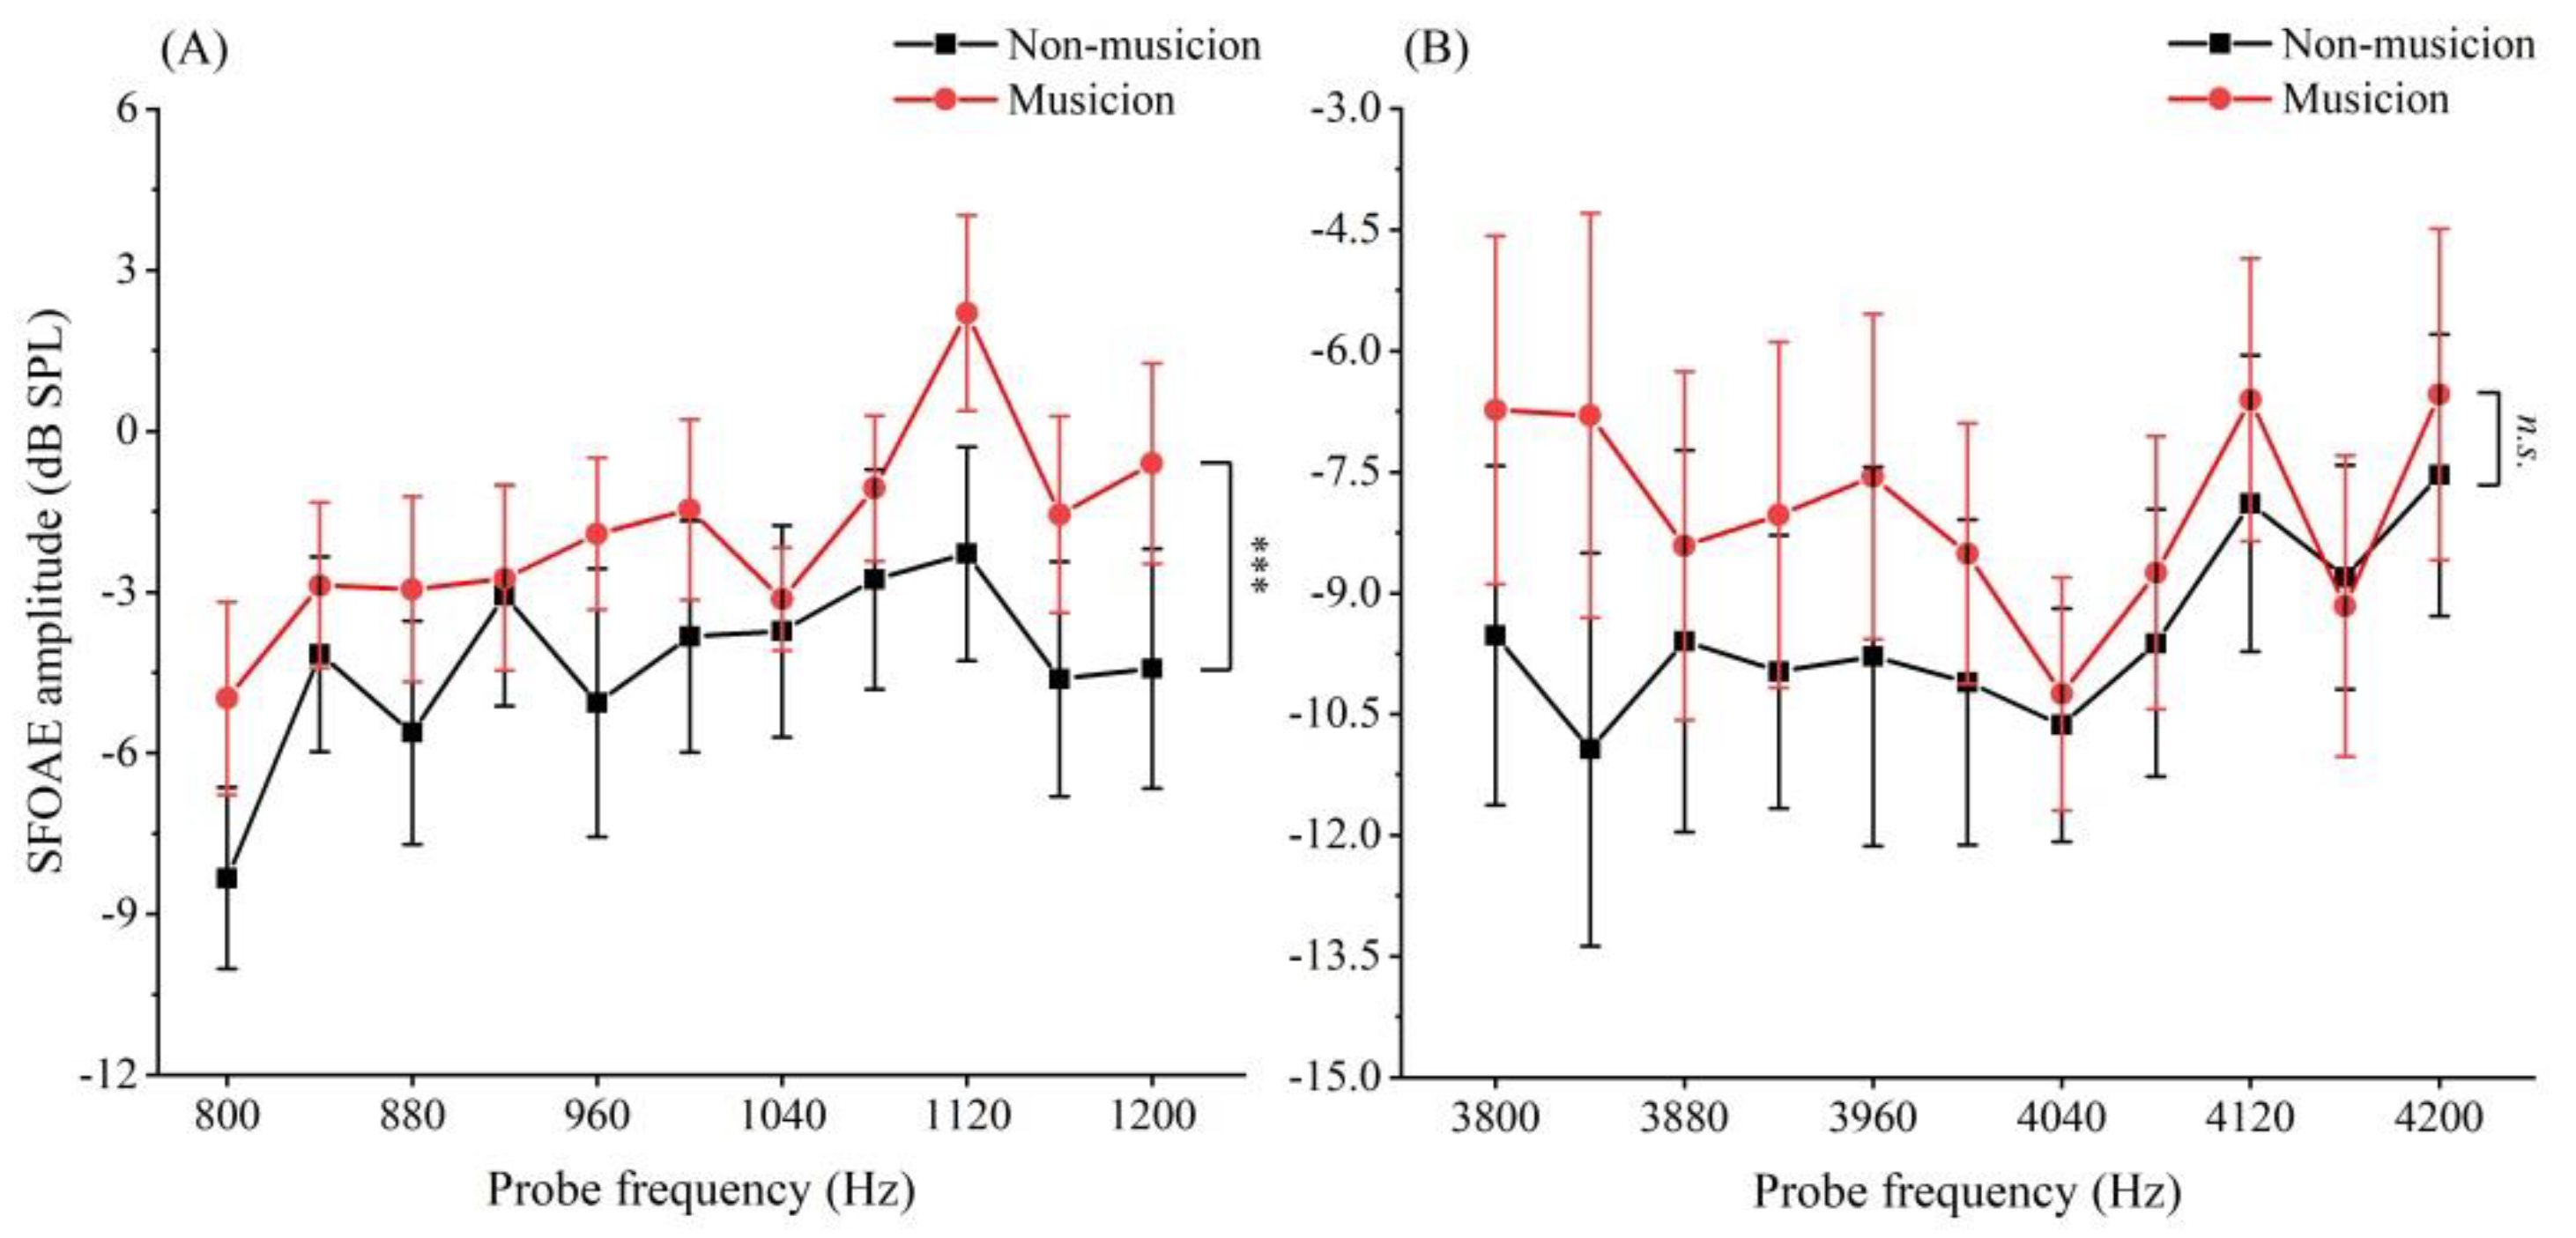
3.2.2. SFOAE Amplitudes between Musicians and Non-Musicians
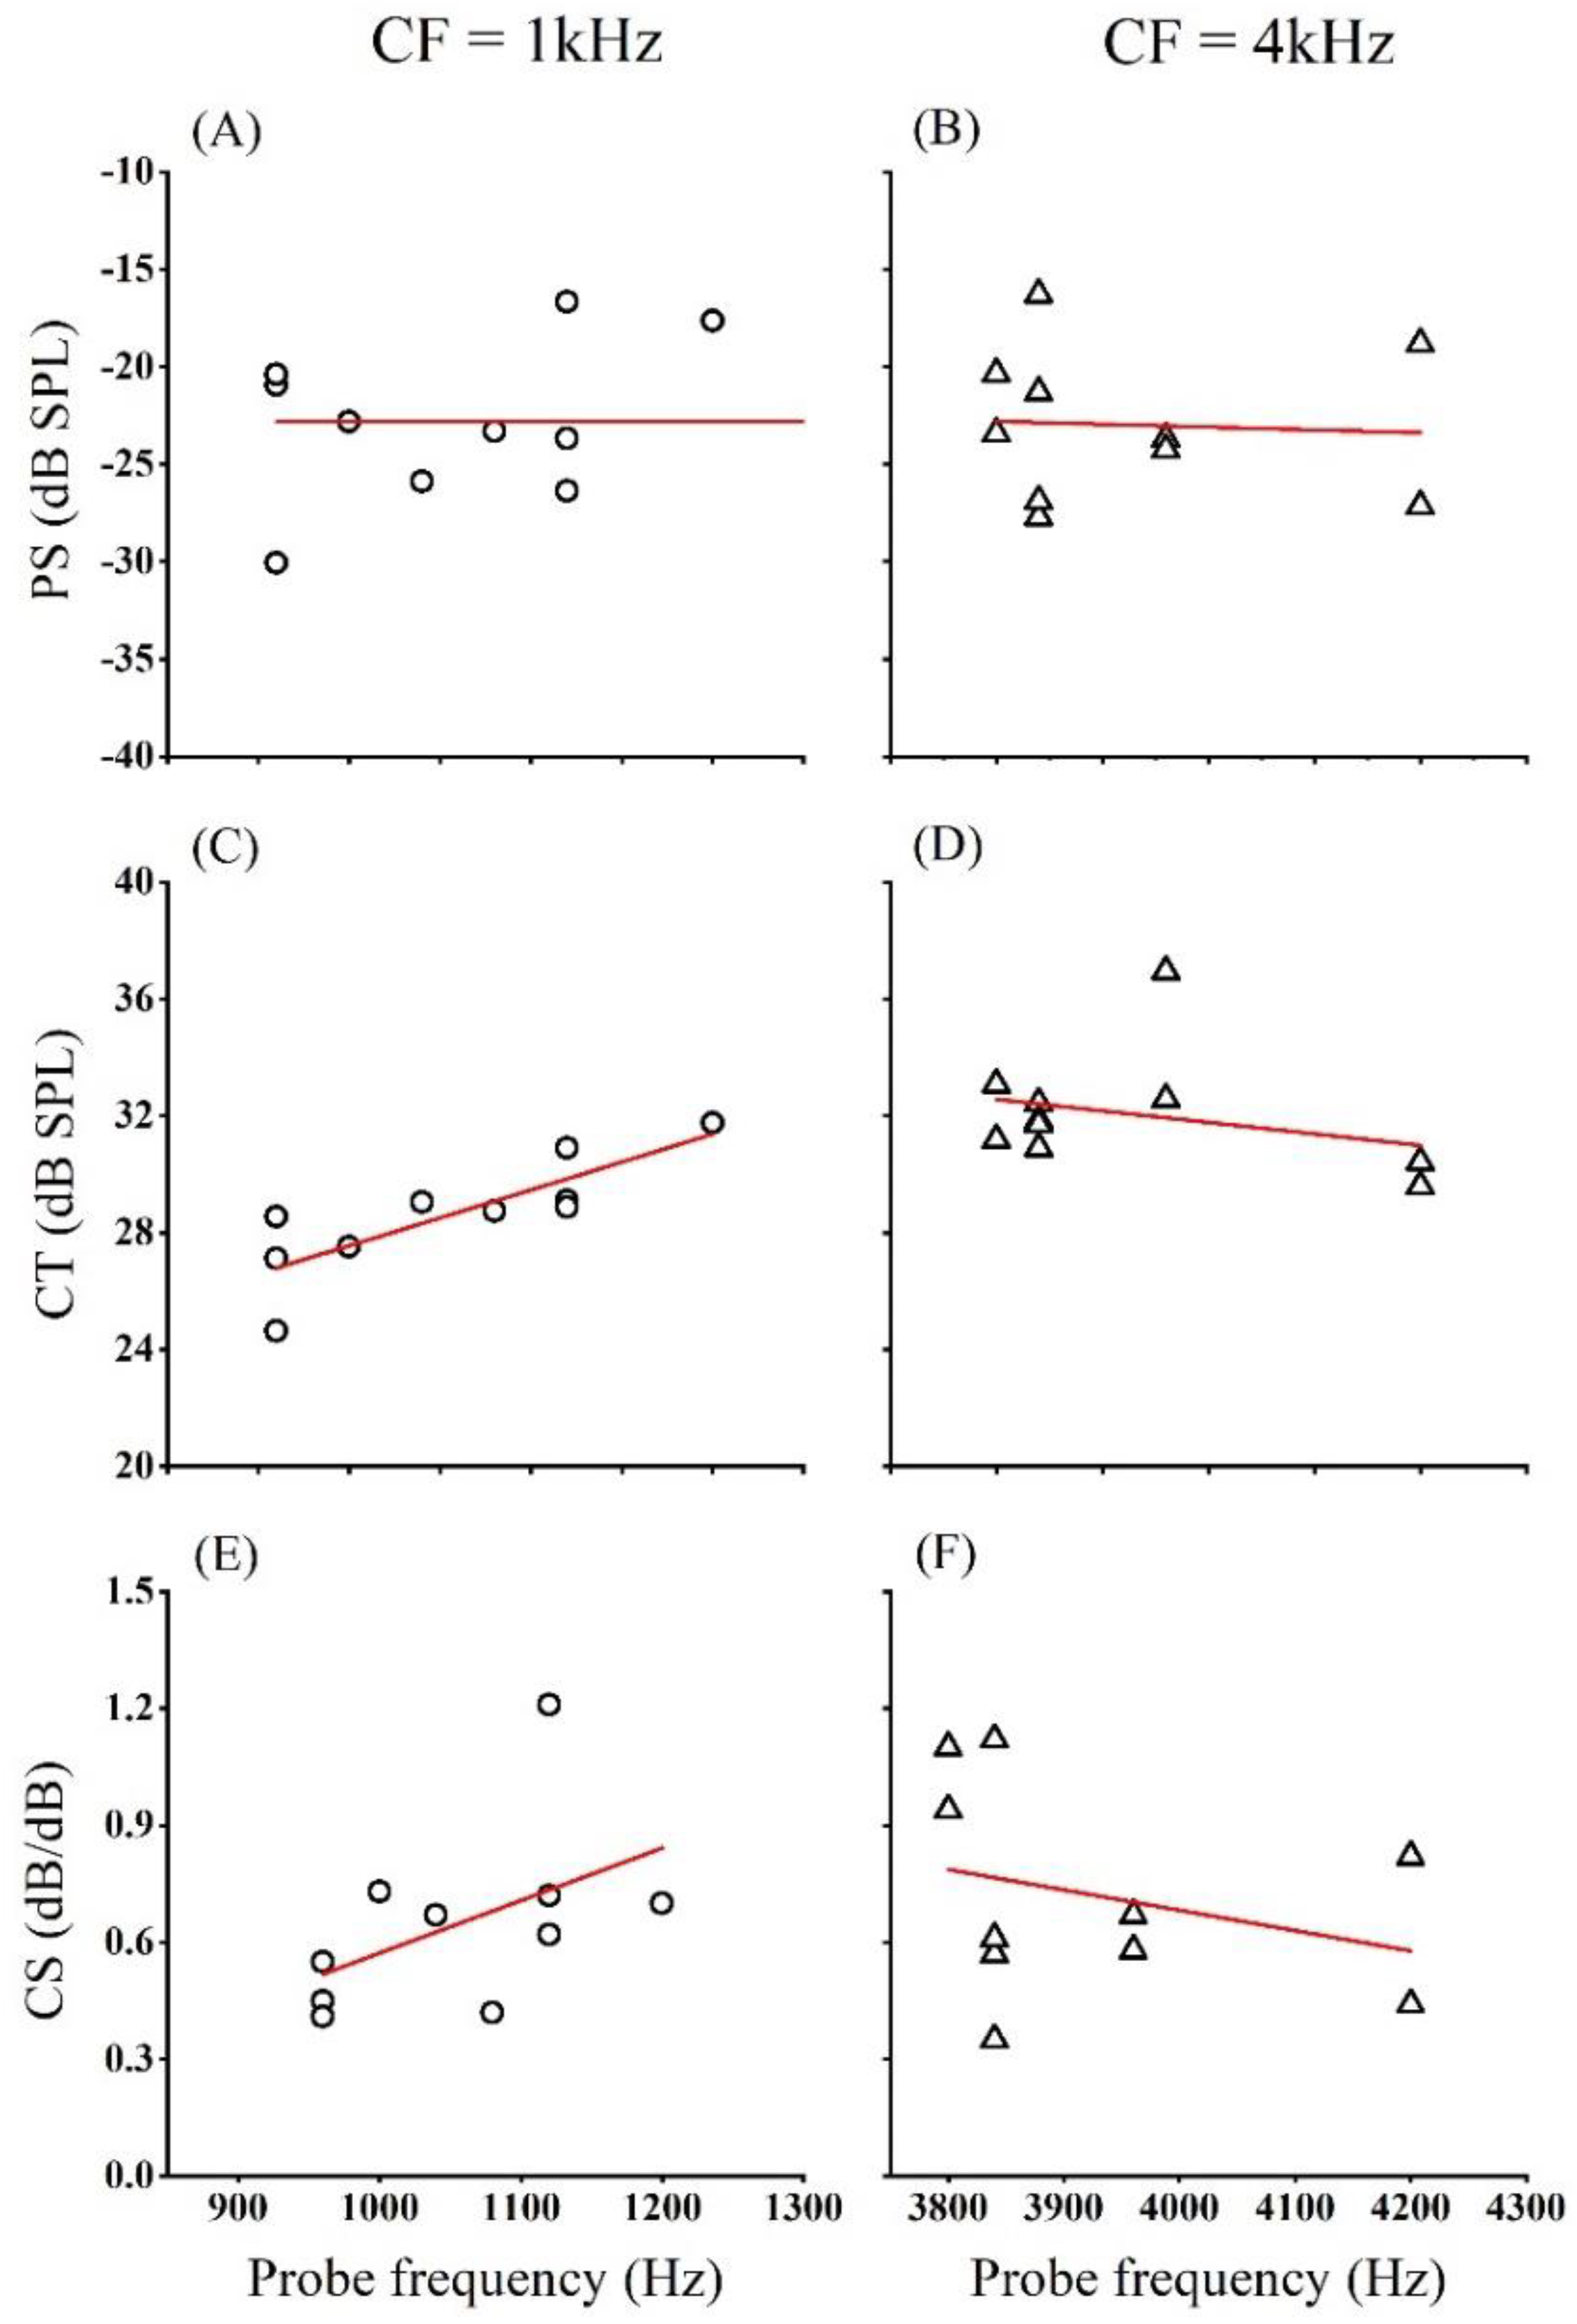
3.3. Gain Function
4. Discussion
4.1. Detection Rate
4.2. Musical Training Influence
4.3. Gain Function
5. Conclusions
Supplementary Materials
Author Contributions
Funding
Acknowledgments
Conflicts of Interest
References
- Kemp, D.T. Stimulated acoustic emissions from within the human auditory system. J. Acoust. Soc. Am. 1978, 64, 1386. [Google Scholar] [CrossRef] [PubMed]
- Karolina, K.C.; Pamela, E.S.; Jonathan, H.S. Exploration of stimulus-frequency otoacoustic emissionsuppression tuning in hearing-impaired listeners. Int. J. Audiol. 2015, 54, 96–105. [Google Scholar]
- Radha, K.; Carolina, A. Stimulus-frequency otoacoustic emissions in human newborns. J. Acoust. Soc. Am. 2015, 137, 78–84. [Google Scholar]
- Bidelman, G.M.; Nelms, C.; Bhagat, S.P. Musical experience sharpens human cochlear tuning. Hear. Res. 2016, 335, 40–46. [Google Scholar] [CrossRef] [PubMed]
- Kemp, D.T. Otoacoustic Emissions: The basics, the science and the future potential. In Otoacoustic Emissions: Clinical Applications, 3rd ed.; Robinette, M.S., Glattke, T.J., Eds.; Thieme: New York, NY, USA, 2011. [Google Scholar]
- Gold, T. Hearing. II. The Physical Basis of the Action of the Cochlea. P. Roy. Soc. Lond. B Biol. 1948, 135, 492–498. [Google Scholar] [CrossRef]
- Shera, C.A. Mammalian spontaneous otoacoustic emissions are amplitude-stabilized cochlear standing waves. J. Acoust. Soc. Am. 2003, 114, 244–262. [Google Scholar] [CrossRef] [PubMed]
- Baiduc, R.R.; Lee, J.; Dhar, S. Spontaneous otoacoustic emissions, threshold microstructure, and psychophysical tuning over a wide frequency range in humans. J. Acoust. Soc. Am. 2014, 135, 300–314. [Google Scholar] [CrossRef] [PubMed]
- Kemp, D.T.; Chum, R.A. Observations on the Generator Mechanism of Stimulus Frequency Acoustic Emissions—Two Tone Suppression. In Psychophysical, Physiological and Behavioural Studies in Hearing; Springer Science and Business Media LLC: Berlin, Germany, 1980; pp. 34–42. [Google Scholar]
- Souter, M. Stimulus frequency otoacoustic emissions from guinea pig and human subjects. Hear. Res. 1995, 90, 1–11. [Google Scholar] [CrossRef]
- Goodman, S.S.; Withnell, R.H.; Shera, C.A. The origin of SFOAE microstructure in the guinea pig. Hear. Res. 2003, 183, 7–17. [Google Scholar] [CrossRef]
- Brass, D. Time-domain observation of otoacoustic emissions during constant tone stimulation. J. Acoust. Soc. Am. 1991, 90, 2415. [Google Scholar] [CrossRef] [PubMed]
- Bentsen, T.; Harte, J.M.; Dau, T. Human cochlear tuning estimates from stimulus-frequency otoacoustic emissions. J. Acoust. Soc. Am. 2011, 129, 3797–3807. [Google Scholar] [CrossRef] [PubMed] [Green Version]
- Wang, Y.; Gong, Q.; Zhang, T. The influence of probe level on the tuning of stimulus frequency otoacoustic emissions and behavioral test in human. Biomed. Eng. Online 2016, 15, 51. [Google Scholar] [CrossRef] [PubMed] [Green Version]
- Ellison, J.C.; Keefe, D.H. Audiometric predictions using SFOAE and middle-ear measurements. Ear. Hear. 2005, 26, 487–503. [Google Scholar] [CrossRef] [PubMed]
- Bright, K.E. Spontaneous Otoacoustic Emissions in Populations with Normal Hearing Sensitivity. In Otoacoustic Emissions: Clinical Applications, 3rd ed.; Robinette, M.S., Glattke, T.J., Eds.; Thieme: New York, NY, USA, 2011. [Google Scholar]
- Ni, D.F.; Dan, H.C. Effect of age and gender on distortion product otoacoustic emissions in normal hearing human. In Proceedings of the 1st International Conference on Prevention and Rehabilitation of Hearing Impairment, Beijing, China, 26–28 April 2007; pp. 310–315. [Google Scholar]
- Shi, Y.B.; Gu, R.; Jiang, S. Acoustic emission examination in normal young ear. Chin. J. Otorhinolaryngol. Head. Neck. Surg. 1989, 24, 349–351. [Google Scholar]
- Yu, L.M.; Li, X.; Qiu, C.Y.; Jiang, S.C. Clinical use of Click Evoked Otoacoustic Emissions in Detection Early Cochlear Impairment. J. Audiol. Speech Pathol. 1996, 3, 18–19. [Google Scholar]
- Yu, H.; Yu, L.; Li, Q.; Ding, Y.; Ma, X.; Ding, G. Measurement of transient evoked otoacoustic emissions and follow-up of 215 healthy newborns. Lin Chuang Er Bi Yan Hou Ke Za Zhi 2003, 17, 22–24. [Google Scholar]
- Yang, L.; Li, W.R.; Qian, L.; Wang, Y.B. Otoacoustic Emission in Tinnitus Patients with Normal Hearing. J. Audiol. Speech Pathol. 2003, 11, 187–188. [Google Scholar]
- Botelho, C.T.; Carvalho, S.A.D.S.; Silva, I.N. Increased prevalence of early cochlear damage in young patients with type 1 diabetes detected by distortion product otoacoustic emissions. Int. J. Audiol. 2014, 53, 402–408. [Google Scholar] [CrossRef]
- Pantev, C.; Herholz, S.C. Plasticity of the human auditory cortex related to musical training. Neurosci. Biobehav. Rev. 2011, 35, 2140–2154. [Google Scholar] [CrossRef]
- Herholz, S.C.; Zatorre, R.J. Musical Training as a Framework for Brain Plasticity: Behavior, Function, and Structure. Neuron 2012, 76, 486–502. [Google Scholar] [CrossRef] [Green Version]
- Brown, R.M.; Zatorre, R.J.; Penhune, V.B. Expert music performance: Cognitive, neural, and developmental bases. In Motivation—Theory, Neurobiology and Applications; Elsevier BV: Amsterdam, The Netherlands, 2015; Volume 217, pp. 57–86. [Google Scholar]
- Kraus, N.; Chandrasekaran, B. Music training for the development of auditory skills. Nat. Rev. Neurosci. 2010, 11, 599–605. [Google Scholar] [CrossRef] [PubMed]
- Kishon-Rabin, L.; Amir, O.; Vexler, Y.; Zaltz, Y. Pitch Discrimination: Are Professional Musicians Better than Non-Musicians? J. Basic Clin. Physiol. Pharmacol. 2001, 12, 125–144. [Google Scholar] [CrossRef] [PubMed]
- Bianchi, F.; Santurette, S.; Wendt, D.; Dau, T. Pitch Discrimination in Musicians and Non-Musicians: Effects of Harmonic Resolvability and Processing Effort. J. Assoc. Res. Otolaryngol. 2016, 17, 69–79. [Google Scholar] [CrossRef] [PubMed]
- Parbery-Clark, A.; Skoe, E.; Lam, C.; Kraus, N. Musician Enhancement for Speech-In-Noise. Ear Hear. 2009, 30, 653–661. [Google Scholar] [CrossRef] [PubMed]
- Parbery-Clark, A.; Strait, D.L.; Anderson, S.; Hittner, E.; Kraus, N. Musical Experience and the Aging Auditory System: Implications for Cognitive Abilities and Hearing Speech in Noise. PLoS ONE 2011, 6, e18082. [Google Scholar] [CrossRef]
- Coffey, E.B.; Mogilever, N.B.; Zatorre, R.J. Speech-in-noise perception in musicians: A review. Hear. Res. 2017, 352, 49–69. [Google Scholar] [CrossRef]
- Strait, D.L.; Kraus, N.; Parbery-Clark, A.; Ashley, R. Musical experience shapes top-down auditory mechanisms: Evidence from masking and auditory attention performance. Hear. Res. 2010, 261, 22–29. [Google Scholar] [CrossRef]
- Oechslin, M.S.; Van De Ville, D.; Lazeyras, F.; Hauert, C.A.; James, C.E. Degree of musical expertise modulates higher order brain functioning. Cereb. Cortex. 2013, 23, 2213–2224. [Google Scholar] [CrossRef]
- Schneider, P.; Scherg, M.; Dosch, H.G.; Specht, H.J.; Gutschalk, A.; Rupp, A. Morphology of Heschl’s gyrus reflects enhanced activation in the auditory cortex of musicians. Nat. Neurosci. 2002, 5, 688–694. [Google Scholar] [CrossRef]
- Habib, M.; Besson, M. What do music training and musical experience teach us about brain plasticity? Music. Percept. 2009, 26, 279–285. [Google Scholar] [CrossRef]
- Soderquist, D.R. Frequency analysis and the critical band. Psychon. Sci. 1970, 21, 117–119. [Google Scholar] [CrossRef] [Green Version]
- Bidelman, G.M.; Gandour, J.T.; Krishnan, A. Musicians and tone-language speakers share enhanced brainstem encoding but not perceptual benefits for musical pitch. Brain Cogn. 2011, 77, 1–10. [Google Scholar] [CrossRef] [PubMed] [Green Version]
- Innes, K.E.; Selfe, T.K.; Khalsa, D.S.; Kandati, S. Meditation and Music Improve Memory and Cognitive Function in Adults with Subjective Cognitive Decline: A Pilot Randomized Controlled Trial. J. Alzheimer’s Dis. 2017, 56, 899–916. [Google Scholar] [CrossRef] [PubMed]
- Sihvonen, A.J.; Särkämö, T.; Leo, V.; Tervaniemi, M.; Altenmüller, E.; Soinila, S. Music-based interventions in neurological rehabilitation. Lancet Neurol. 2017, 16, 648–660. [Google Scholar] [CrossRef] [Green Version]
- Coutinho, E.; Schuller, B. Correction: Shared acoustic codes underlie emotional communication in music and speech—Evidence from deep transfer learning. PLoS ONE 2018, 13, e0191754. [Google Scholar] [CrossRef]
- Brashears, S.M.; Morlet, T.G.; Berlin, C.I.; Hood, L.J. Olivocochlear efferent suppression in classical musicians. J. Am. Acad. Audiol. 2003, 14, 314–324. [Google Scholar] [PubMed]
- Micheyl, C.; Carbonnel, O.; Collet, L. Medial Olivocochlear System and Loudness Adaptation - Differences between Musicians and Non-Musicians. Brain Cogn. 1995, 29, 127–136. [Google Scholar] [CrossRef]
- Perrot, X.; Collet, L. Function and plasticity of the medial olivocochlear system in musicians: A review. Hear. Res. 2014, 308, 27–40. [Google Scholar] [CrossRef]
- Abdala, C.; Kalluri, R. Towards a joint reflection-distortion otoacoustic emission profile: Results in normal and impaired ears. J. Acoust. Soc. Am. 2017, 142, 812–824. [Google Scholar] [CrossRef]
- Schairer, K.S.; Keefe, D.H. Simultaneous recording of stimulus-frequency and distortion-product otoacoustic emission input-output functions in human ears. J. Acoust. Soc. Am. 2005, 117, 818–832. [Google Scholar] [CrossRef]
- Schairer, K.S.; Fitzpatrick, D.; Keefe, D.H. Input-output functions for stimulus-frequency otoacoustic emissions in normal-hearing adult ears. J. Acoust. Soc. Am. 2003, 114, 944–966. [Google Scholar] [CrossRef] [PubMed]
- Abdala, C.; Kalluri, R. Exploiting dual otoacoustic emission sources. In Proceedings of the 12th International Workshop on the Mechanics of Hearing, Cape Sounio, Greece, 23–29 June 2014; Corey, D.P., Karavitaki, K.D., Eds.; AIP: New York, NY, USA, 2015. [Google Scholar]
- Jäncke, L. The Hand Performance Test with a Modified Time Limit Instruction Enables the Examination of Hand Performance Asymmetries in Adults. Percept. Mot. Ski. 1996, 82, 735–738. [Google Scholar] [CrossRef] [PubMed]
- Bidelman, G.M.; Krishnan, A. Effects of reverberation on brainstem representation of speech in musicians and non-musicians. Brain Res. 2010, 1355, 112–125. [Google Scholar] [CrossRef] [PubMed] [Green Version]
- Bidelman, G.M.; Schug, J.M.; Jennings, S.G.; Bhagat, S.P. Psychophysical auditory filter estimates reveal sharper cochlear tuning in musicians. J. Acoust. Soc. Am. 2014, 136, EL33–EL39. [Google Scholar] [CrossRef] [Green Version]
- Sokal, R.R.; Rohlf, F.J. Biometry: The Principles and Practice of Statistics in Biological Research, 4th ed.; WH.Freeman: New York, NY, USA, 2012. [Google Scholar]
- Bilger, R.C.; Matthies, M.L.; Hammel, D.R.; Demorest, M.E. Gentic implication of gender differences in the prevalence of spontaneous otoacoustic emissions. J. Speech. Hear. Res. 1990, 33, 418–432. [Google Scholar] [CrossRef]
- Xia, A.; Song, Y.; Wang, R.; Gao, S.S.; Clifton, W.; Raphael, P.; Chao, S.-I.; Pereira, F.A.; Groves, A.K.; Oghalai, J.S. Prestin Regulation and Function in Residual Outer Hair Cells after Noise-Induced Hearing Loss. PLoS ONE 2013, 8, e82602. [Google Scholar] [CrossRef]
- Lüders, D.; Gonçalves, C.G.D.O.; Lacerda, A.B.D.M.; Ribas, A.; De Conto, J. Music students: Conventional hearing thresholds and at high frequencies. Braz. J. Otorhinolaryngol. 2014, 80, 296–304. [Google Scholar] [CrossRef]


| Factor | Condition | Group a | Detection Ratio (%) | χ2 Value | P Value | ES |
|---|---|---|---|---|---|---|
| Gender | fp = 1 kHz Lp = 30 dB SPL | F | 71 | 3.899 | 0.048 * | 0.583 |
| M | 92 | |||||
| fp = 1 kHz Lp = 50 dB SPL | F | 96 | 0.003 | 0.954 | 0.016 | |
| M | 96 | |||||
| fp = 4 kHz Lp = 30 dB SPL | F | 92 | 5.024 | 0.025 * | 0.668 | |
| M | 65 | |||||
| fp = 4 kHz Lp = 50 dB SPL | F | 63 | 4.612 | 0.032 * | 0.637 | |
| M | 88 |
| Frequency (Hz) | Group | df | H Value | p Value |
|---|---|---|---|---|
| 250 | / | 1 | 10.276 | 0.001 ** |
| 500 | 1 | 6.484 | 0.011 * | |
| 1000 | 1 | 0.077 | 0.781 | |
| 2000 | 1 | 0.179 | 0.672 | |
| 4000 | 1 | 0.076 | 0.783 | |
| 8000 | 1 | 0.012 | 0.913 | |
| / | musicians | 5 | 7.943 | 0.159 |
| non-musicians | 5 | 19.141 | 0.002 ** |
| Metrics | Mean (SD) at 1 kHz | Mean (SD a) at 4 kHz | t/z Value | p Value | ES |
|---|---|---|---|---|---|
| PS | −22.773(4.080) | −22.985(3.789) | 0.120 | 0.905 | 0.054 |
| CT | 28.627(1.969) | 32.062(2.010) | −3.861 | 0.001 ** | 1.754 |
| CS | 0.648(0.233) | 0.720(0.266) | −0.416 | 0.677 | / |
© 2019 by the authors. Licensee MDPI, Basel, Switzerland. This article is an open access article distributed under the terms and conditions of the Creative Commons Attribution (CC BY) license (http://creativecommons.org/licenses/by/4.0/).
Share and Cite
Wang, Y.; Qi, Z.; Yu, M.; Wang, J.; Chen, R. Characteristic of Stimulus Frequency Otoacoustic Emissions: Detection Rate, Musical Training Influence, and Gain Function. Brain Sci. 2019, 9, 255. https://doi.org/10.3390/brainsci9100255
Wang Y, Qi Z, Yu M, Wang J, Chen R. Characteristic of Stimulus Frequency Otoacoustic Emissions: Detection Rate, Musical Training Influence, and Gain Function. Brain Sciences. 2019; 9(10):255. https://doi.org/10.3390/brainsci9100255
Chicago/Turabian StyleWang, Yao, Zhihang Qi, Mengmeng Yu, Jinhai Wang, and Ruijuan Chen. 2019. "Characteristic of Stimulus Frequency Otoacoustic Emissions: Detection Rate, Musical Training Influence, and Gain Function" Brain Sciences 9, no. 10: 255. https://doi.org/10.3390/brainsci9100255
APA StyleWang, Y., Qi, Z., Yu, M., Wang, J., & Chen, R. (2019). Characteristic of Stimulus Frequency Otoacoustic Emissions: Detection Rate, Musical Training Influence, and Gain Function. Brain Sciences, 9(10), 255. https://doi.org/10.3390/brainsci9100255