Visually Evoked Response Differences to Contrast and Motion in Children with Autism Spectrum Disorder

 and
and
Abstract
:1. Introduction
2. Methods
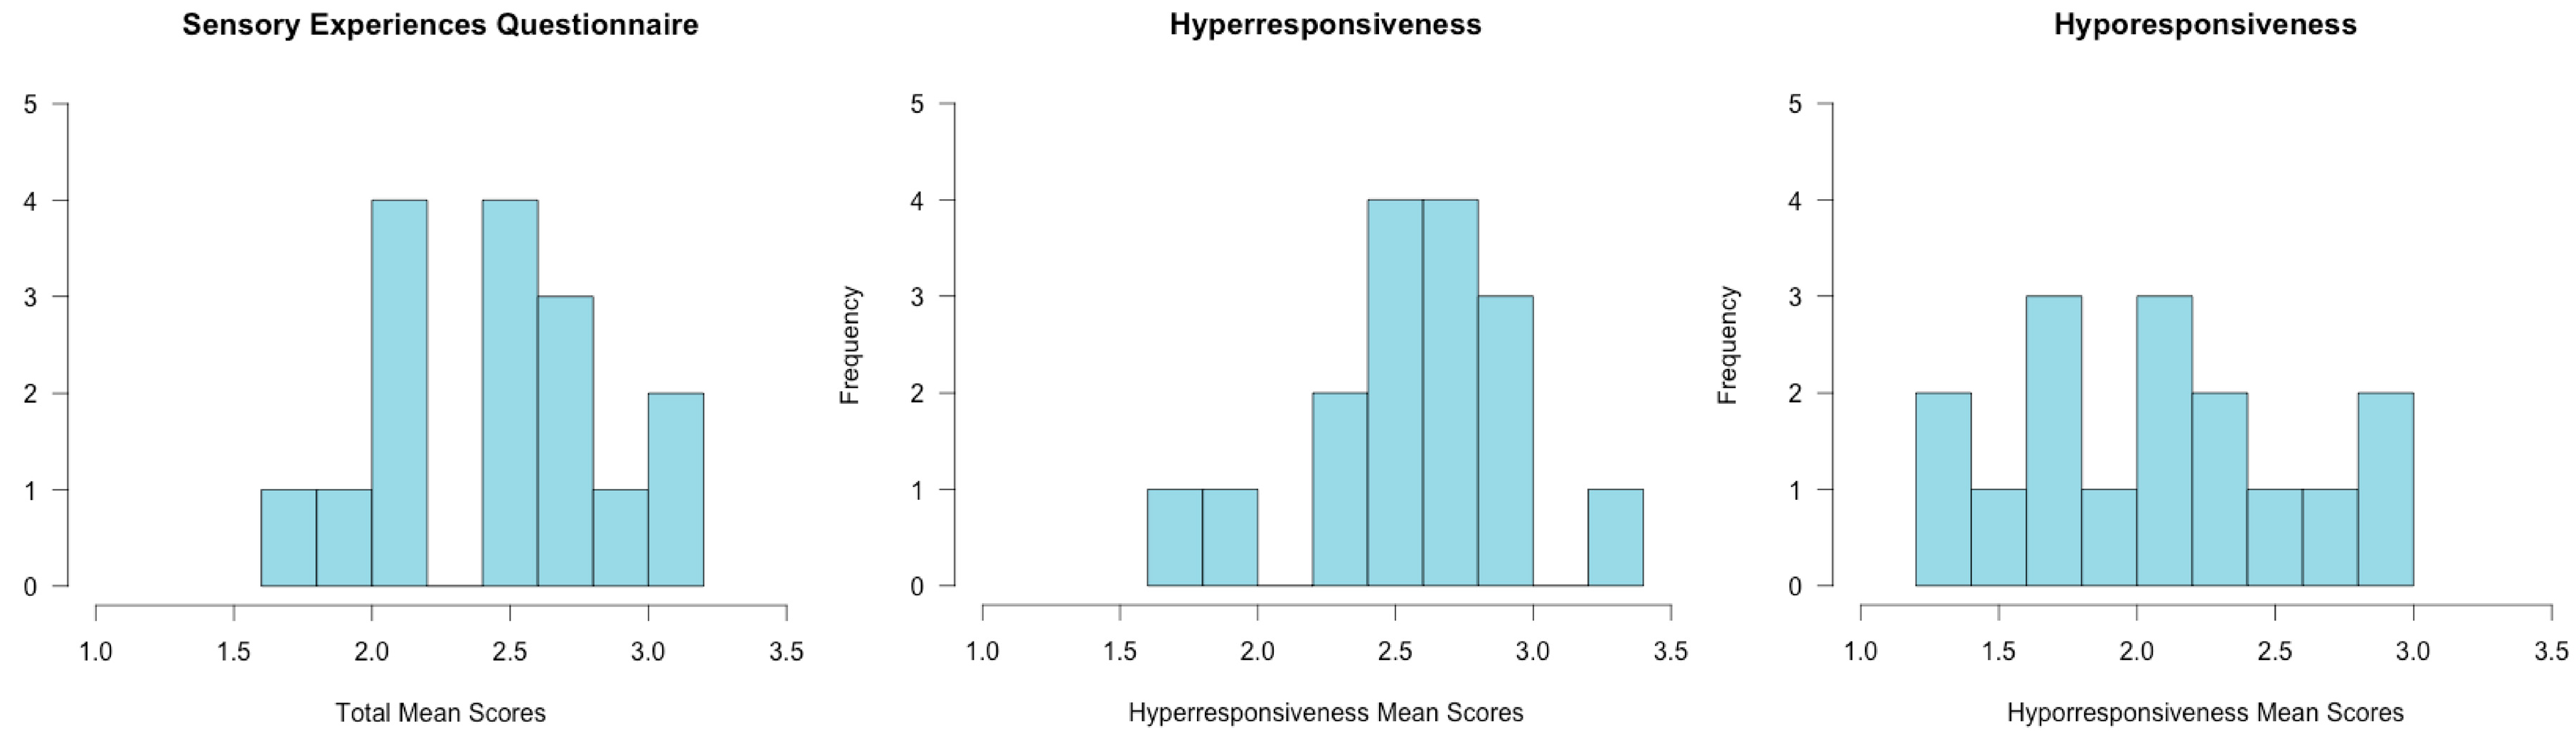
2.1. Assessments
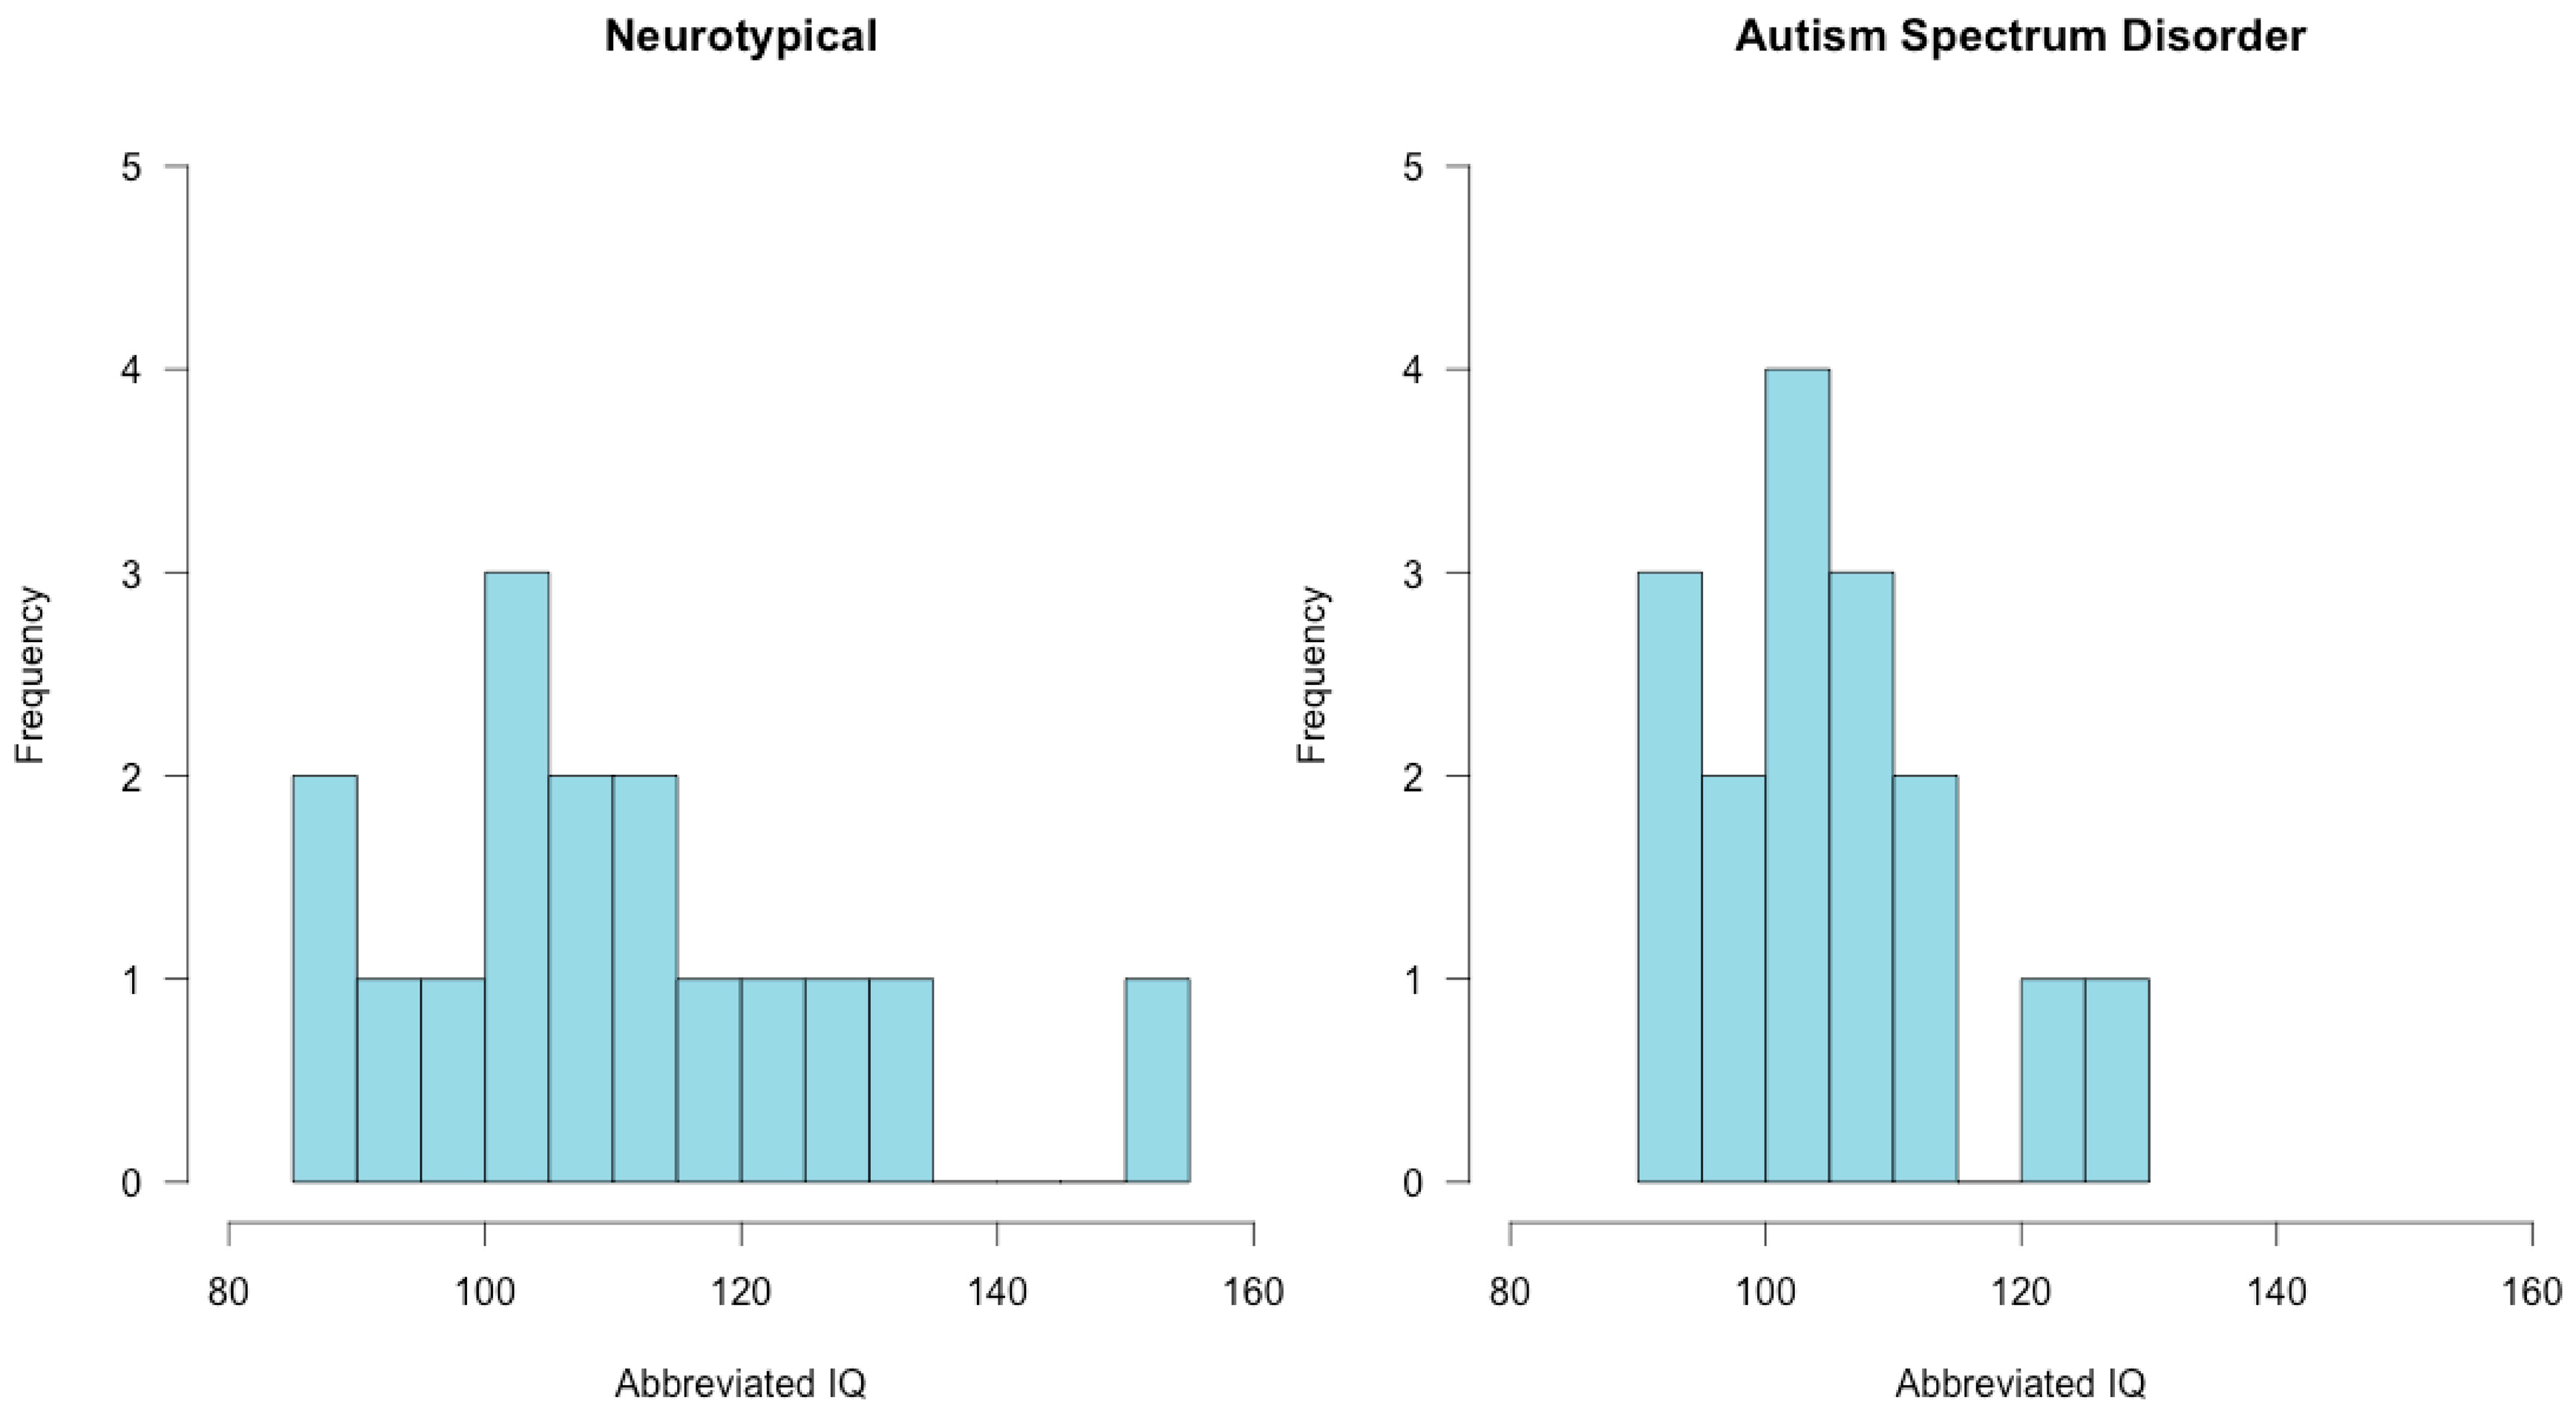
2.2. Participants
2.3. Experimental Stimuli
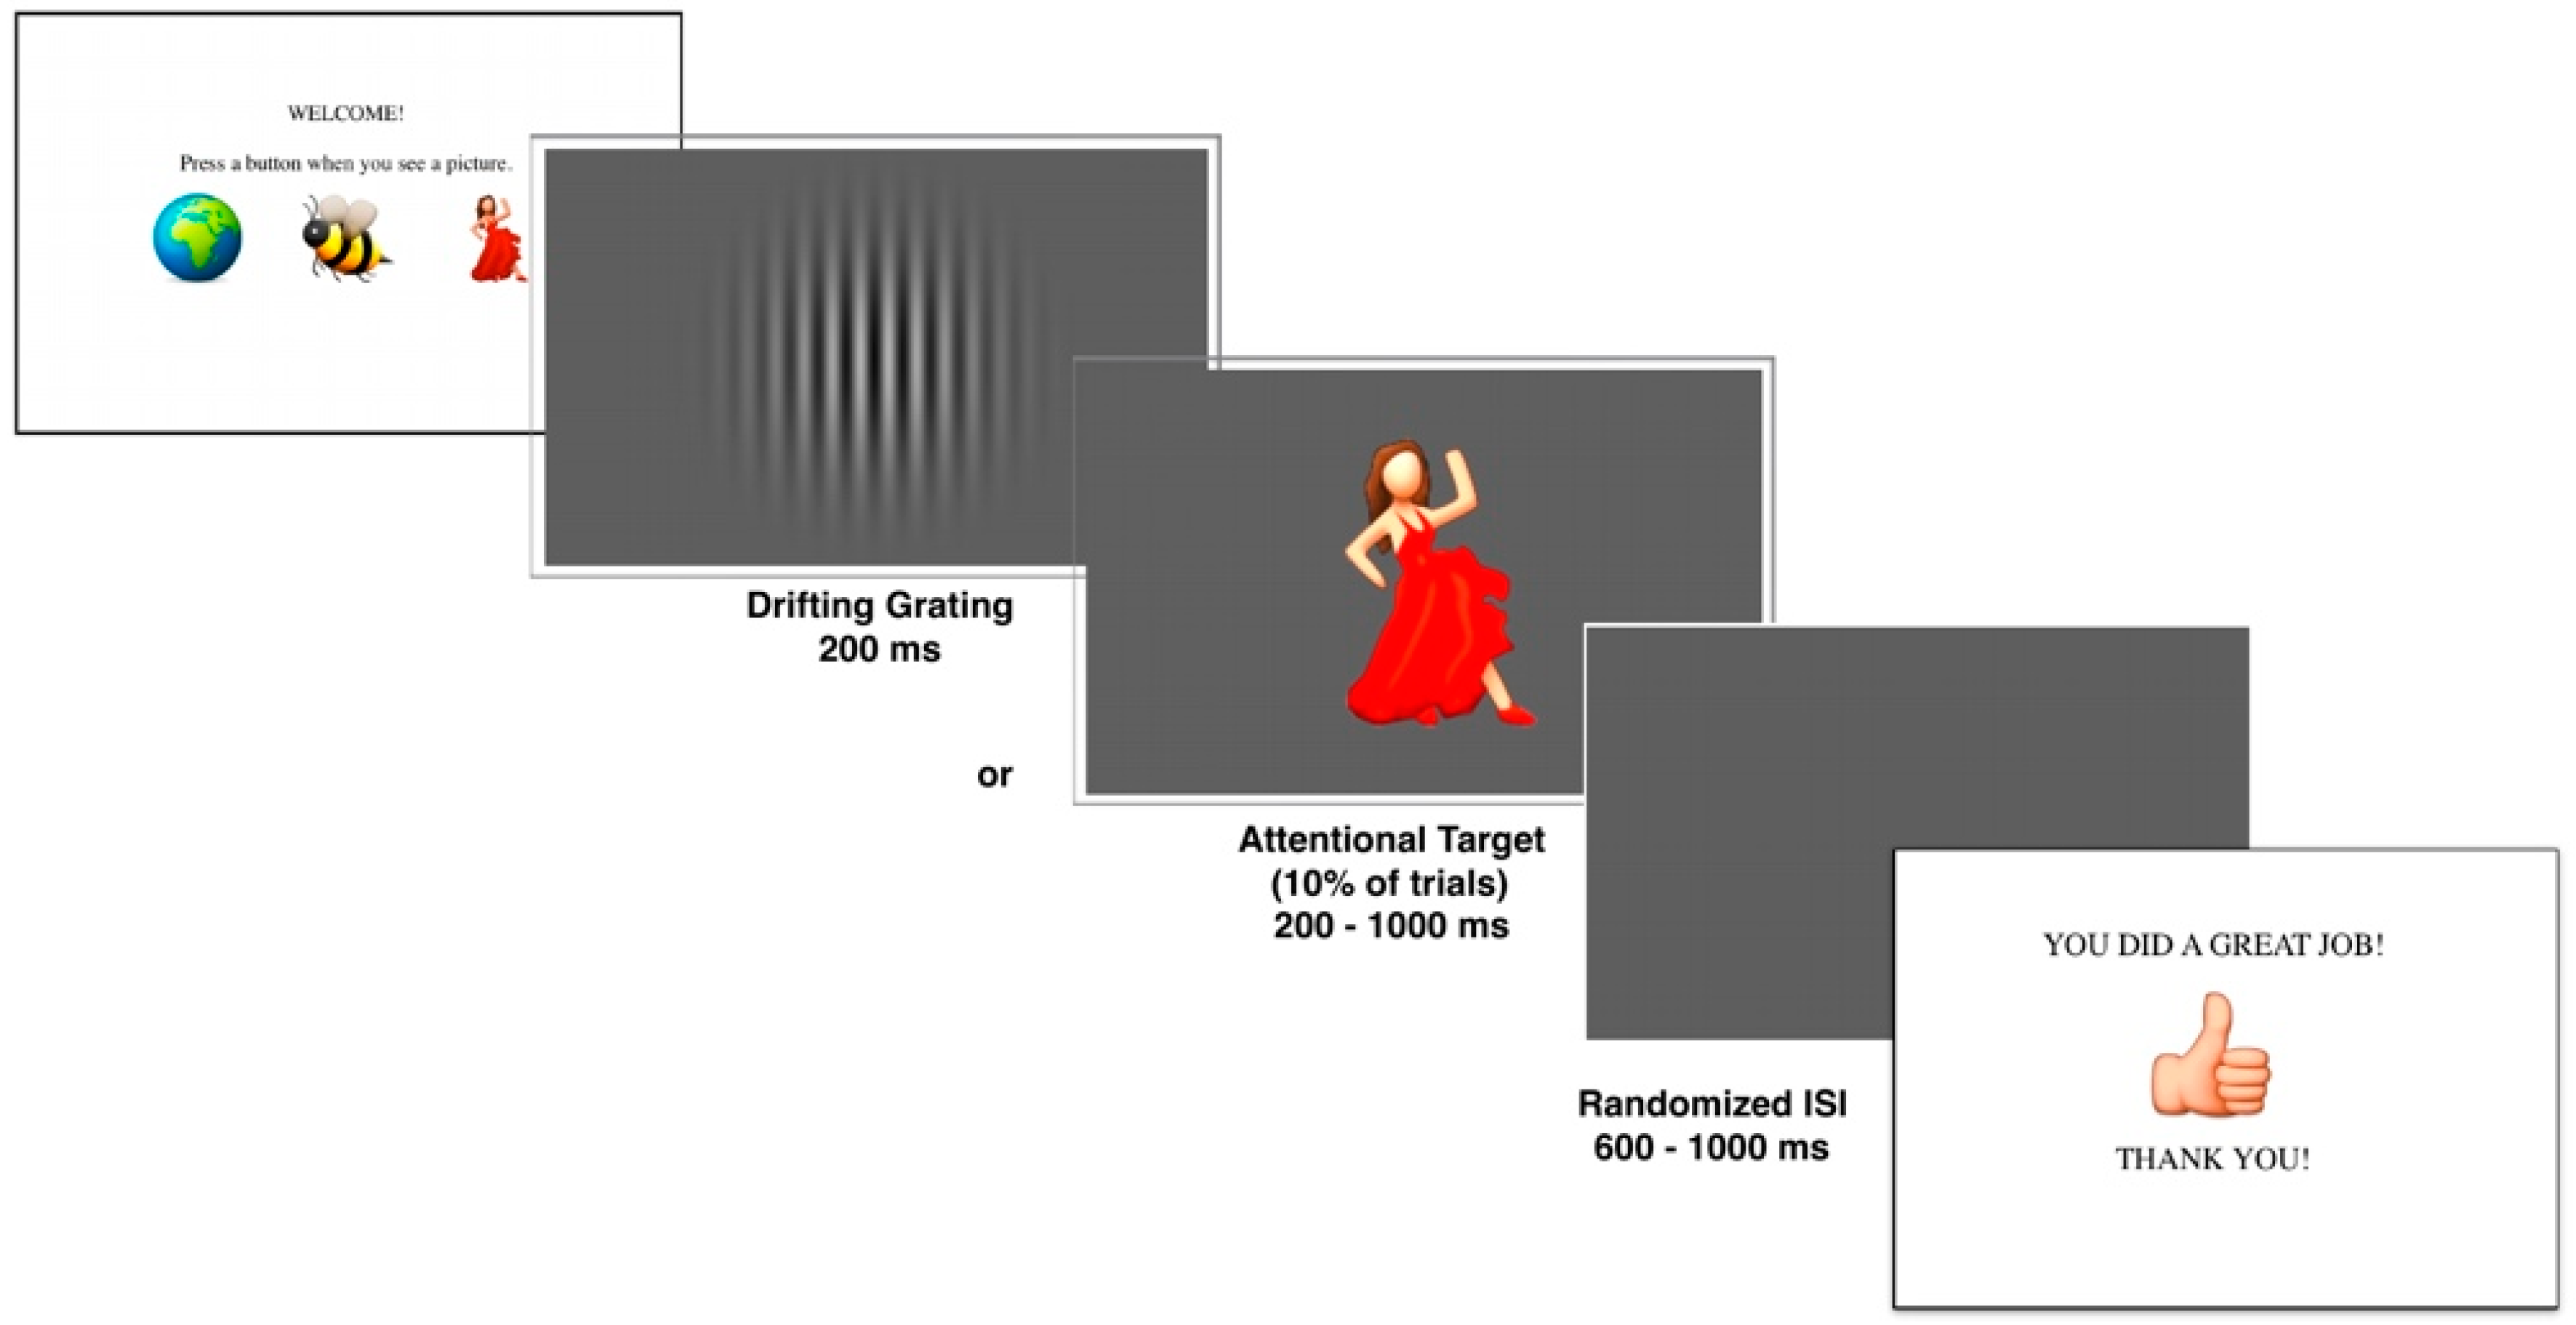
2.4. Experimental Task
2.5. Data Analysis
3. Results
3.1. Assessment Results
3.2. EEG Results
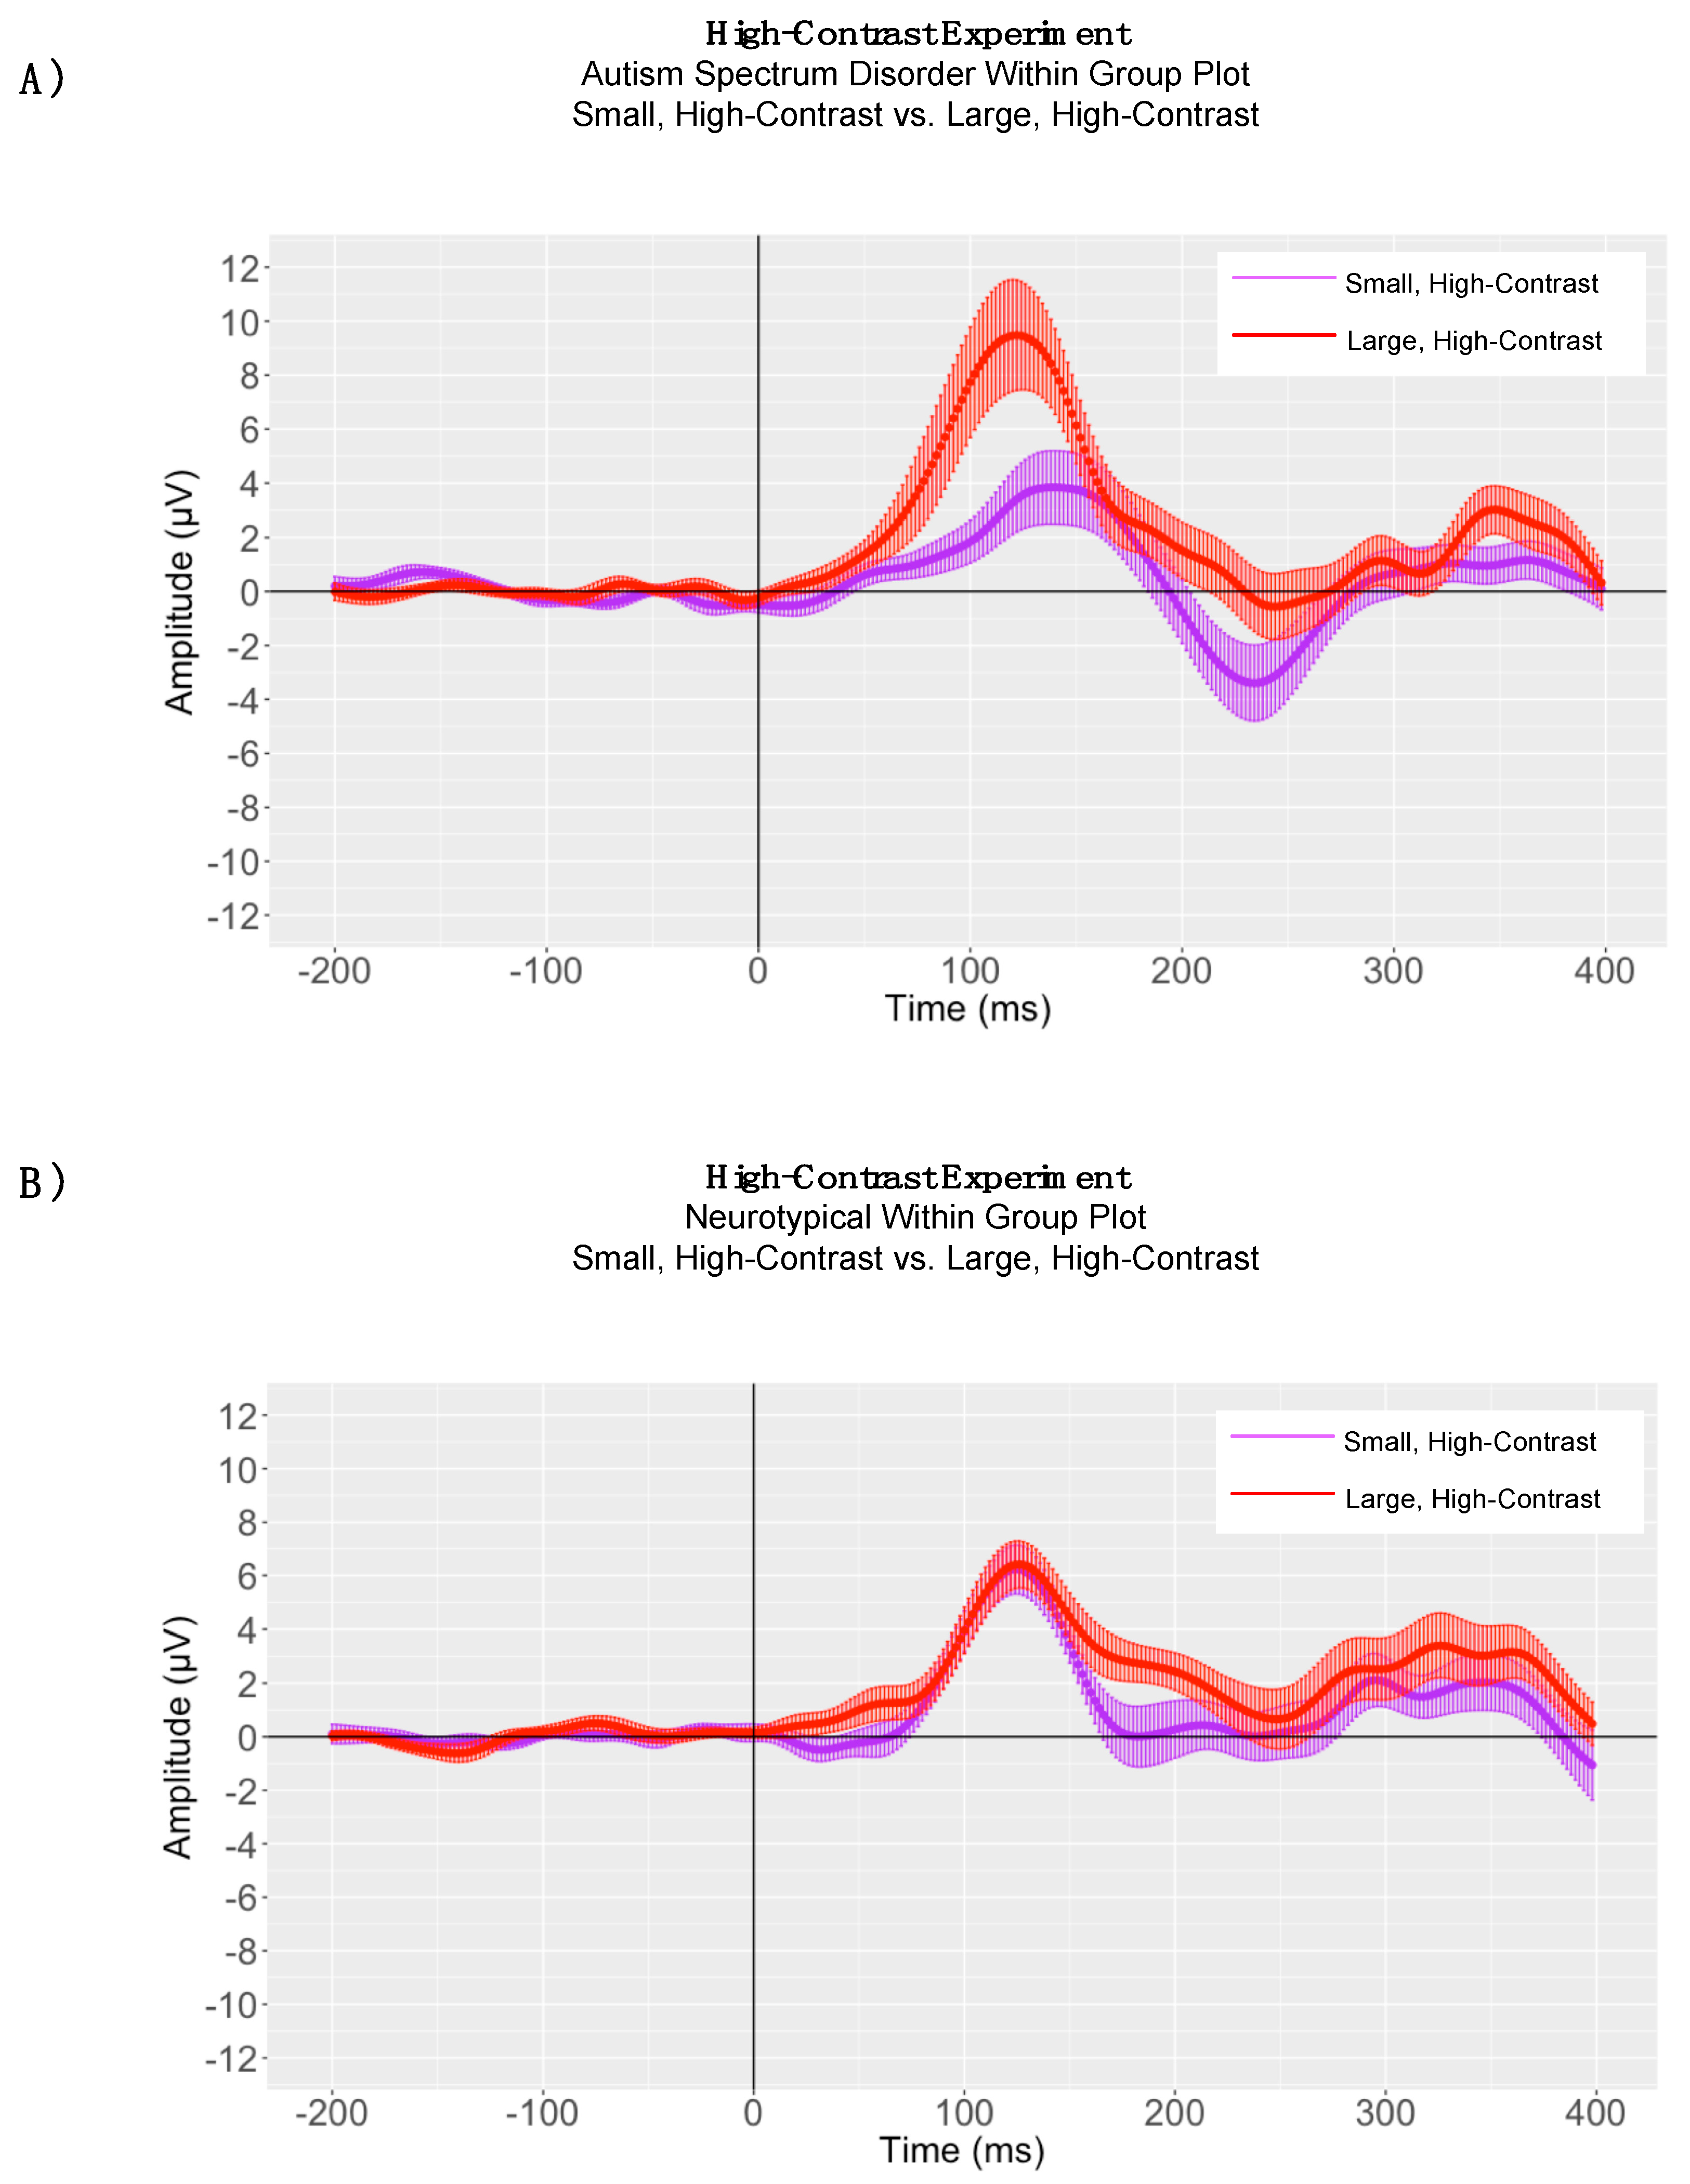
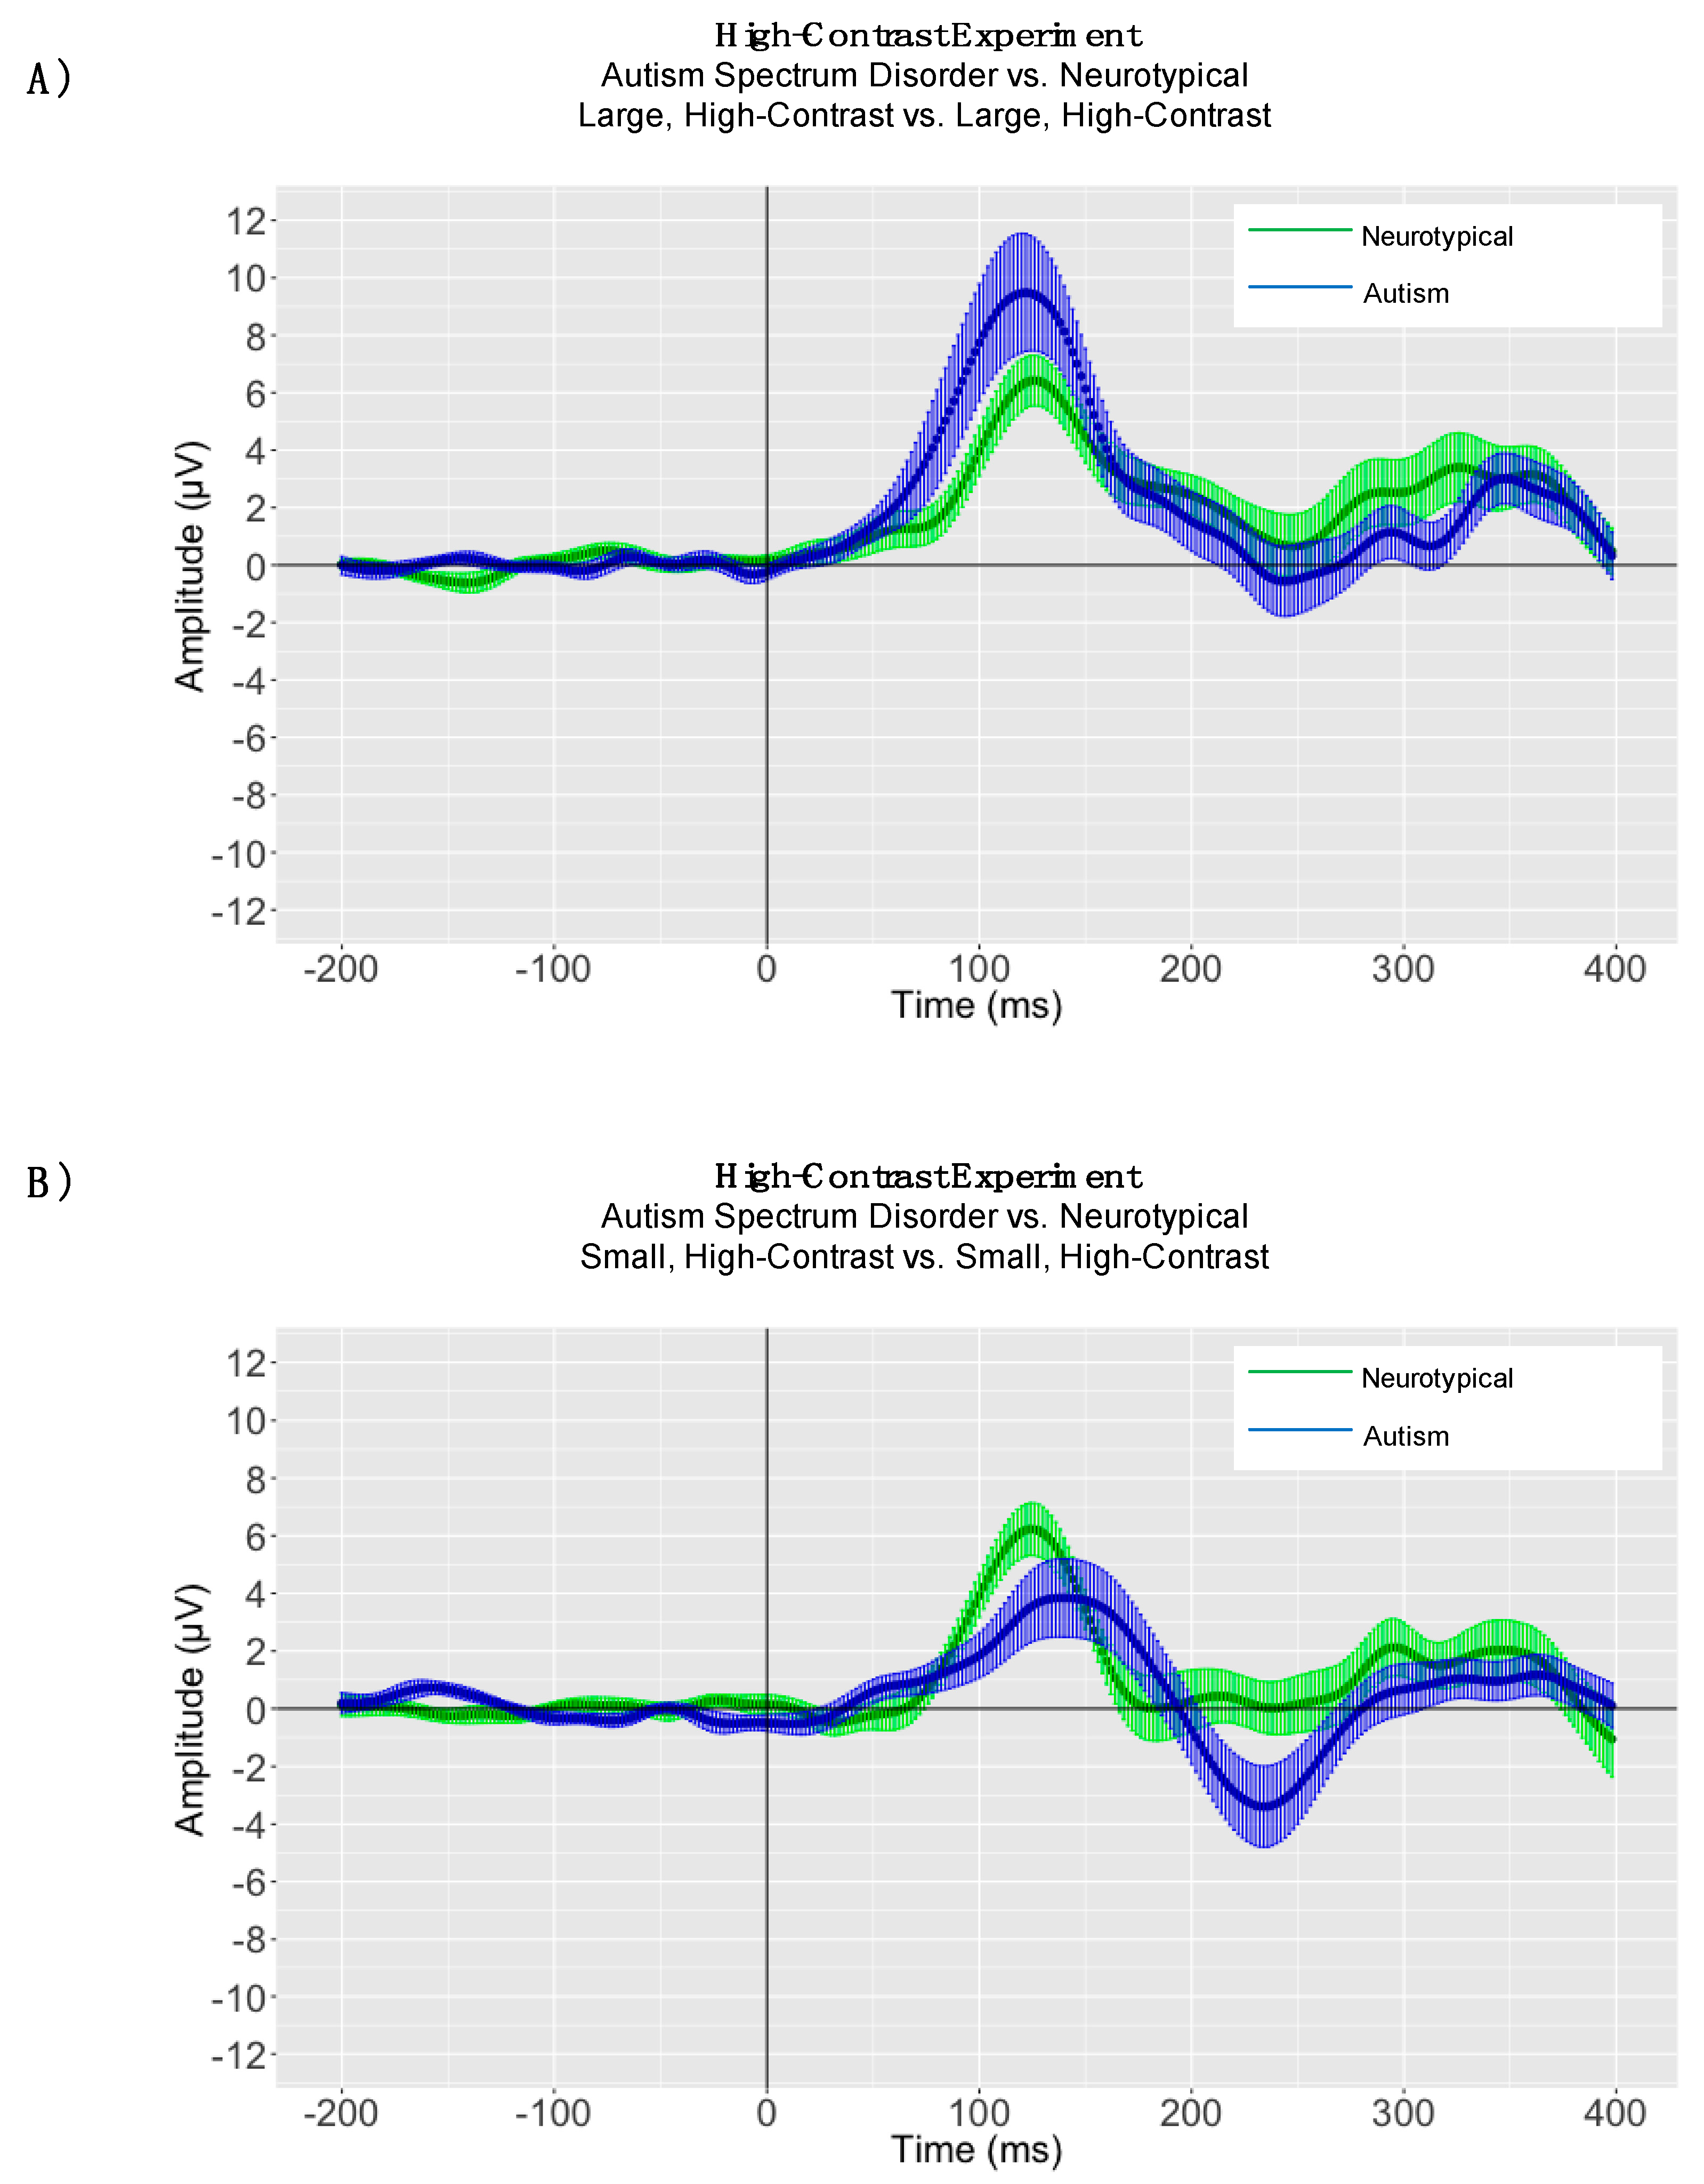
4. High-Contrast Experiment
4.1. Peak Latency Analyses
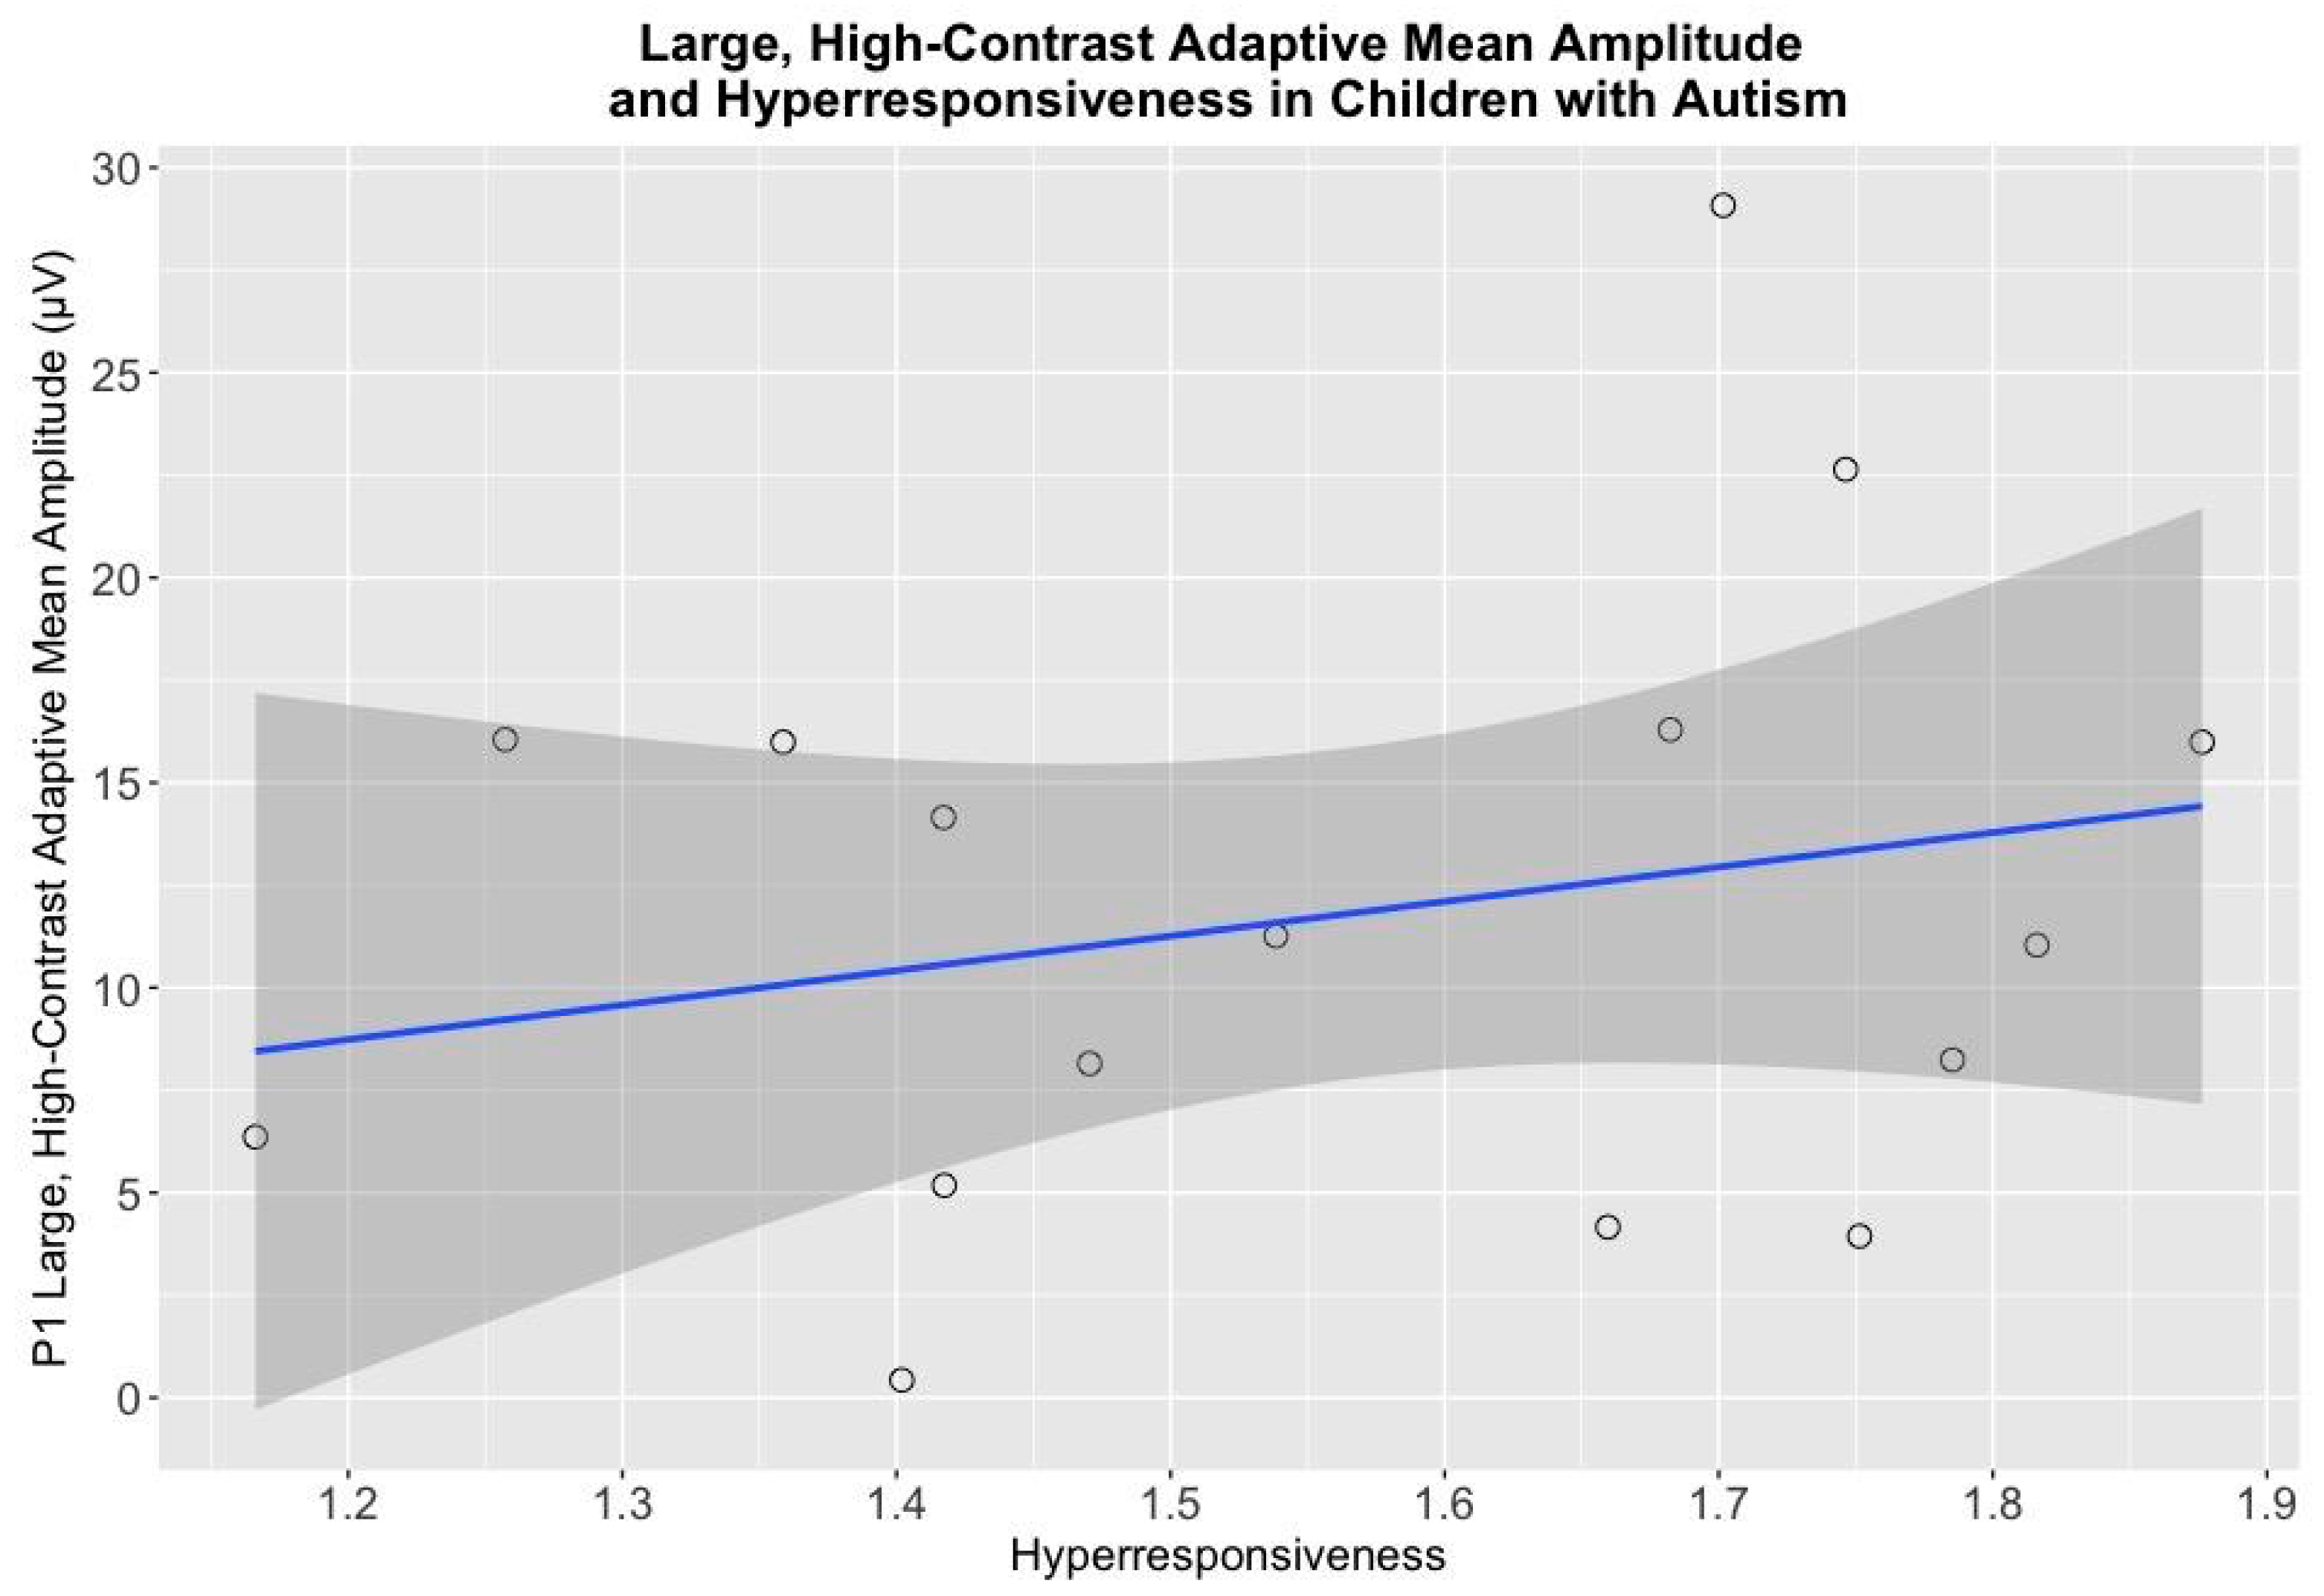
4.2. High-Contrast Adaptive Mean Amplitude Analyses
4.3. Electrophysiological Associations with Cognitive and Behavioral Measures
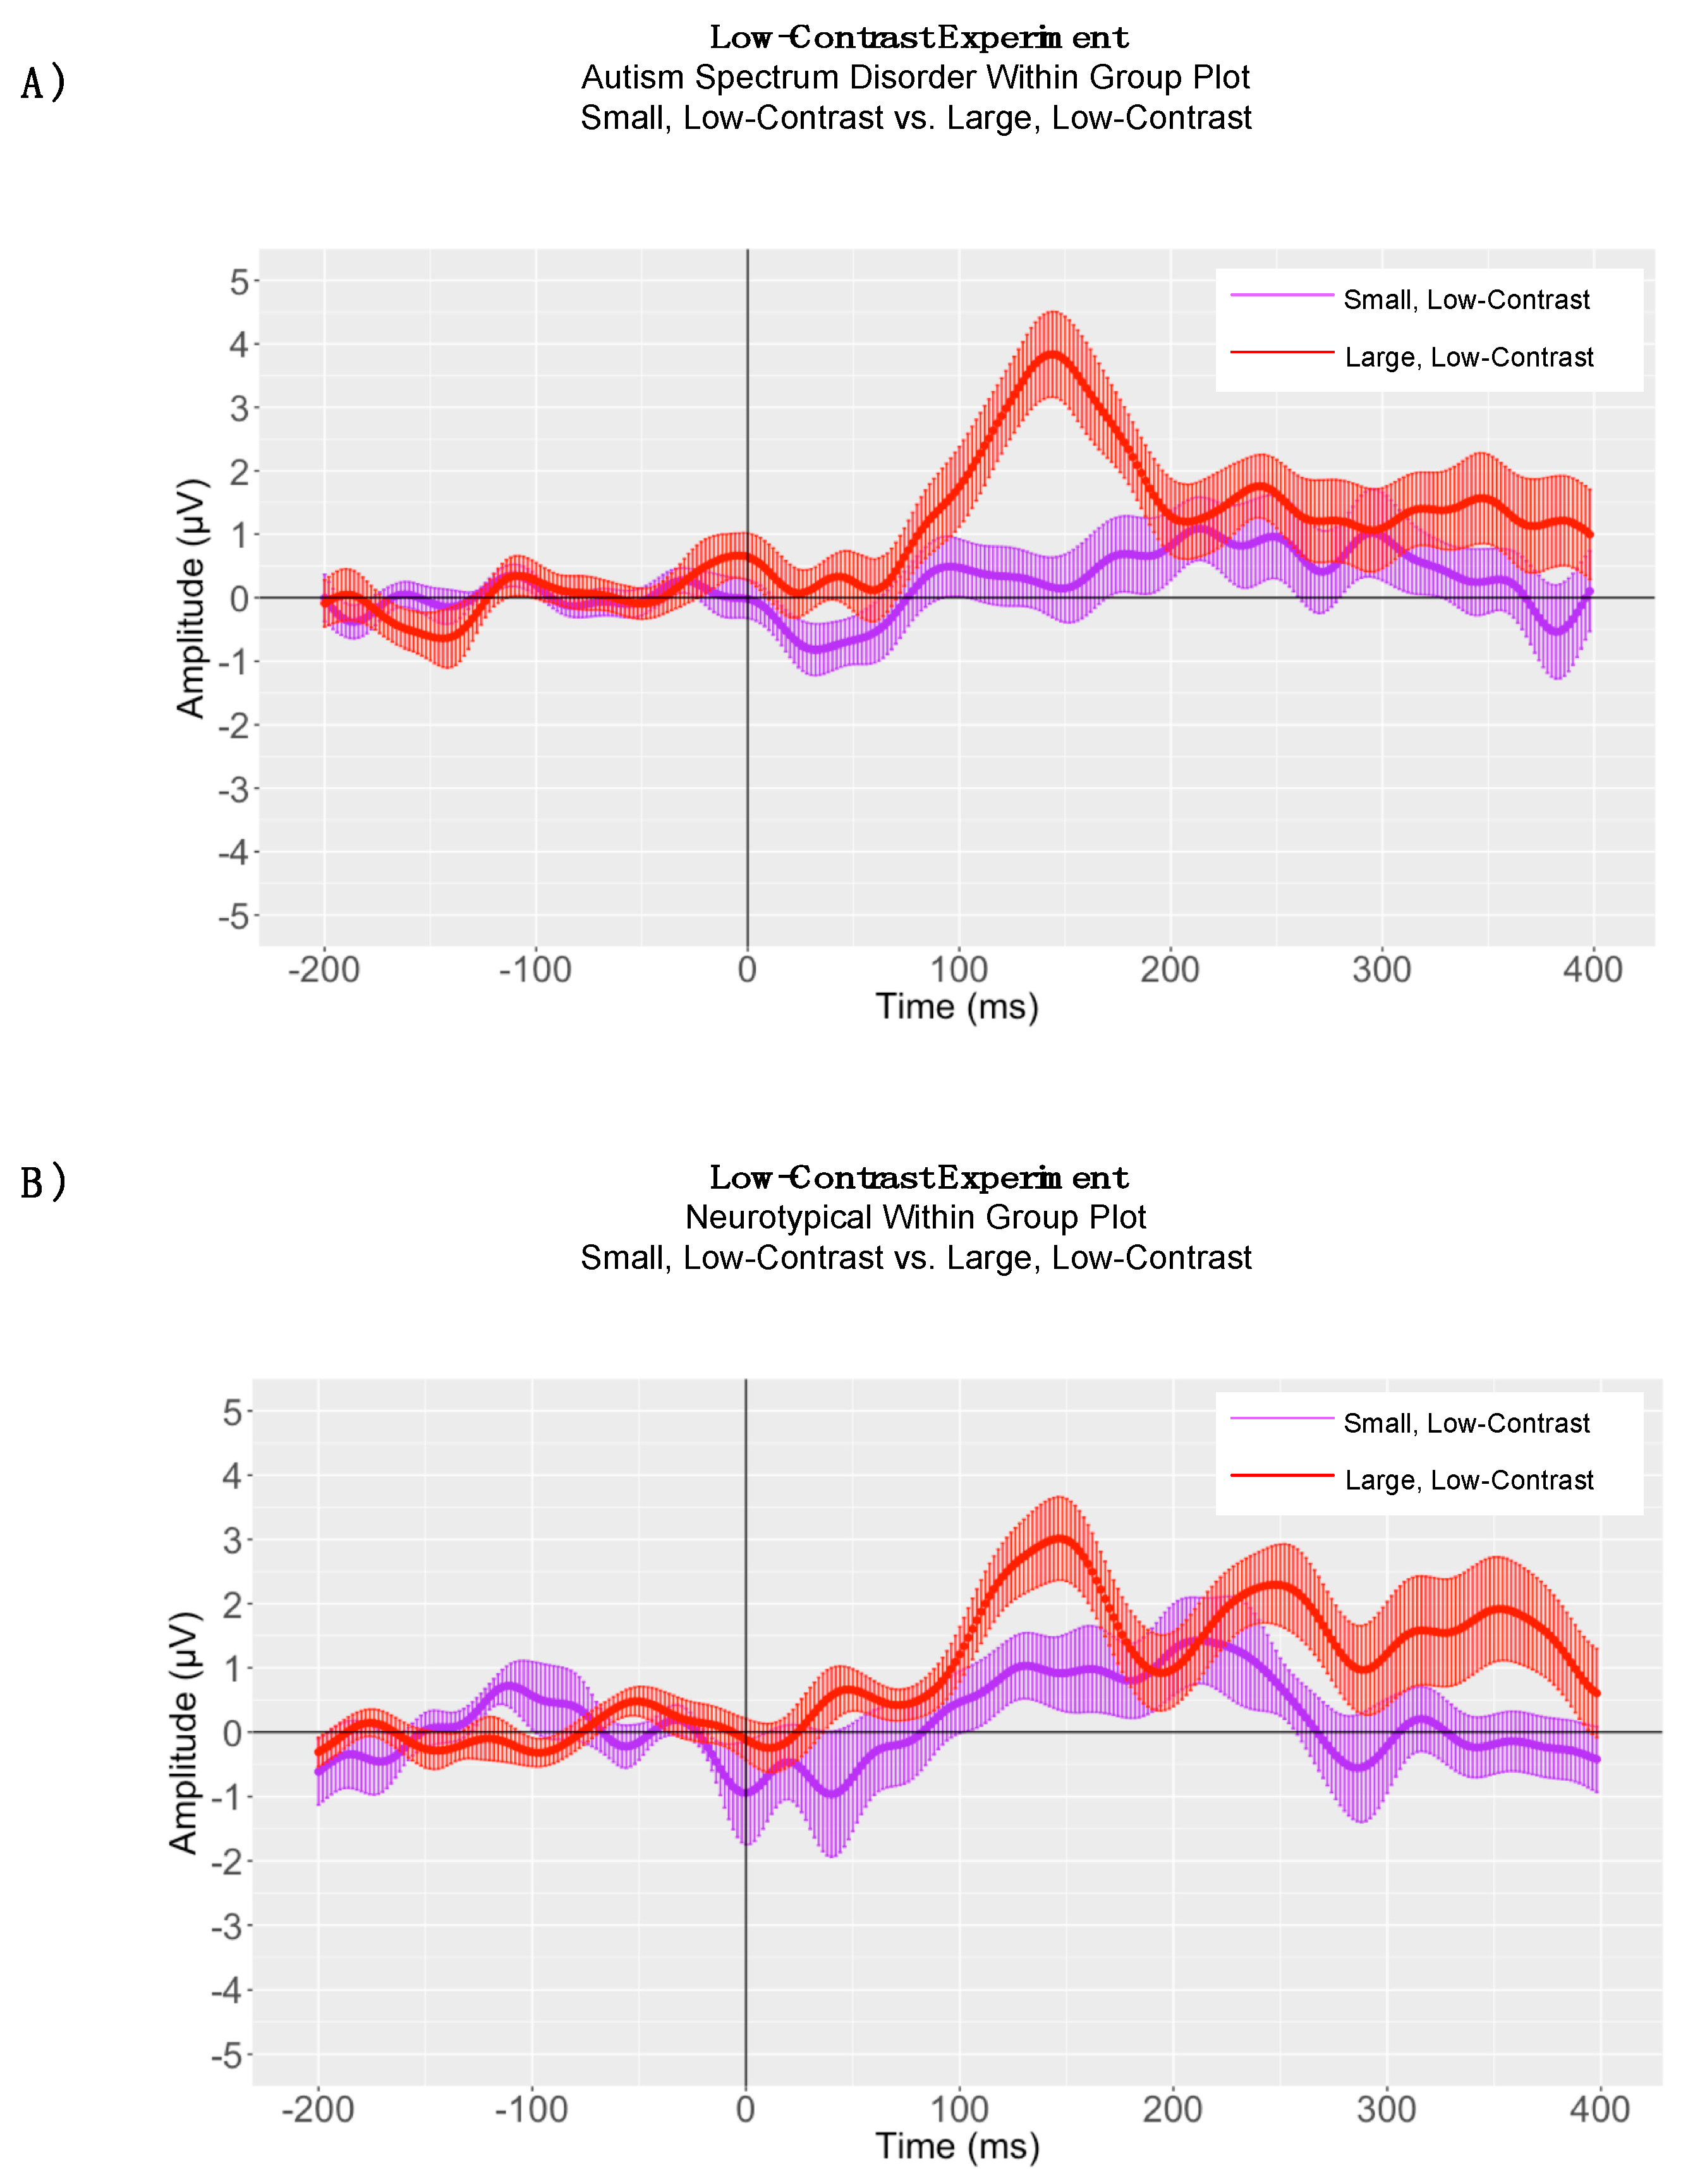
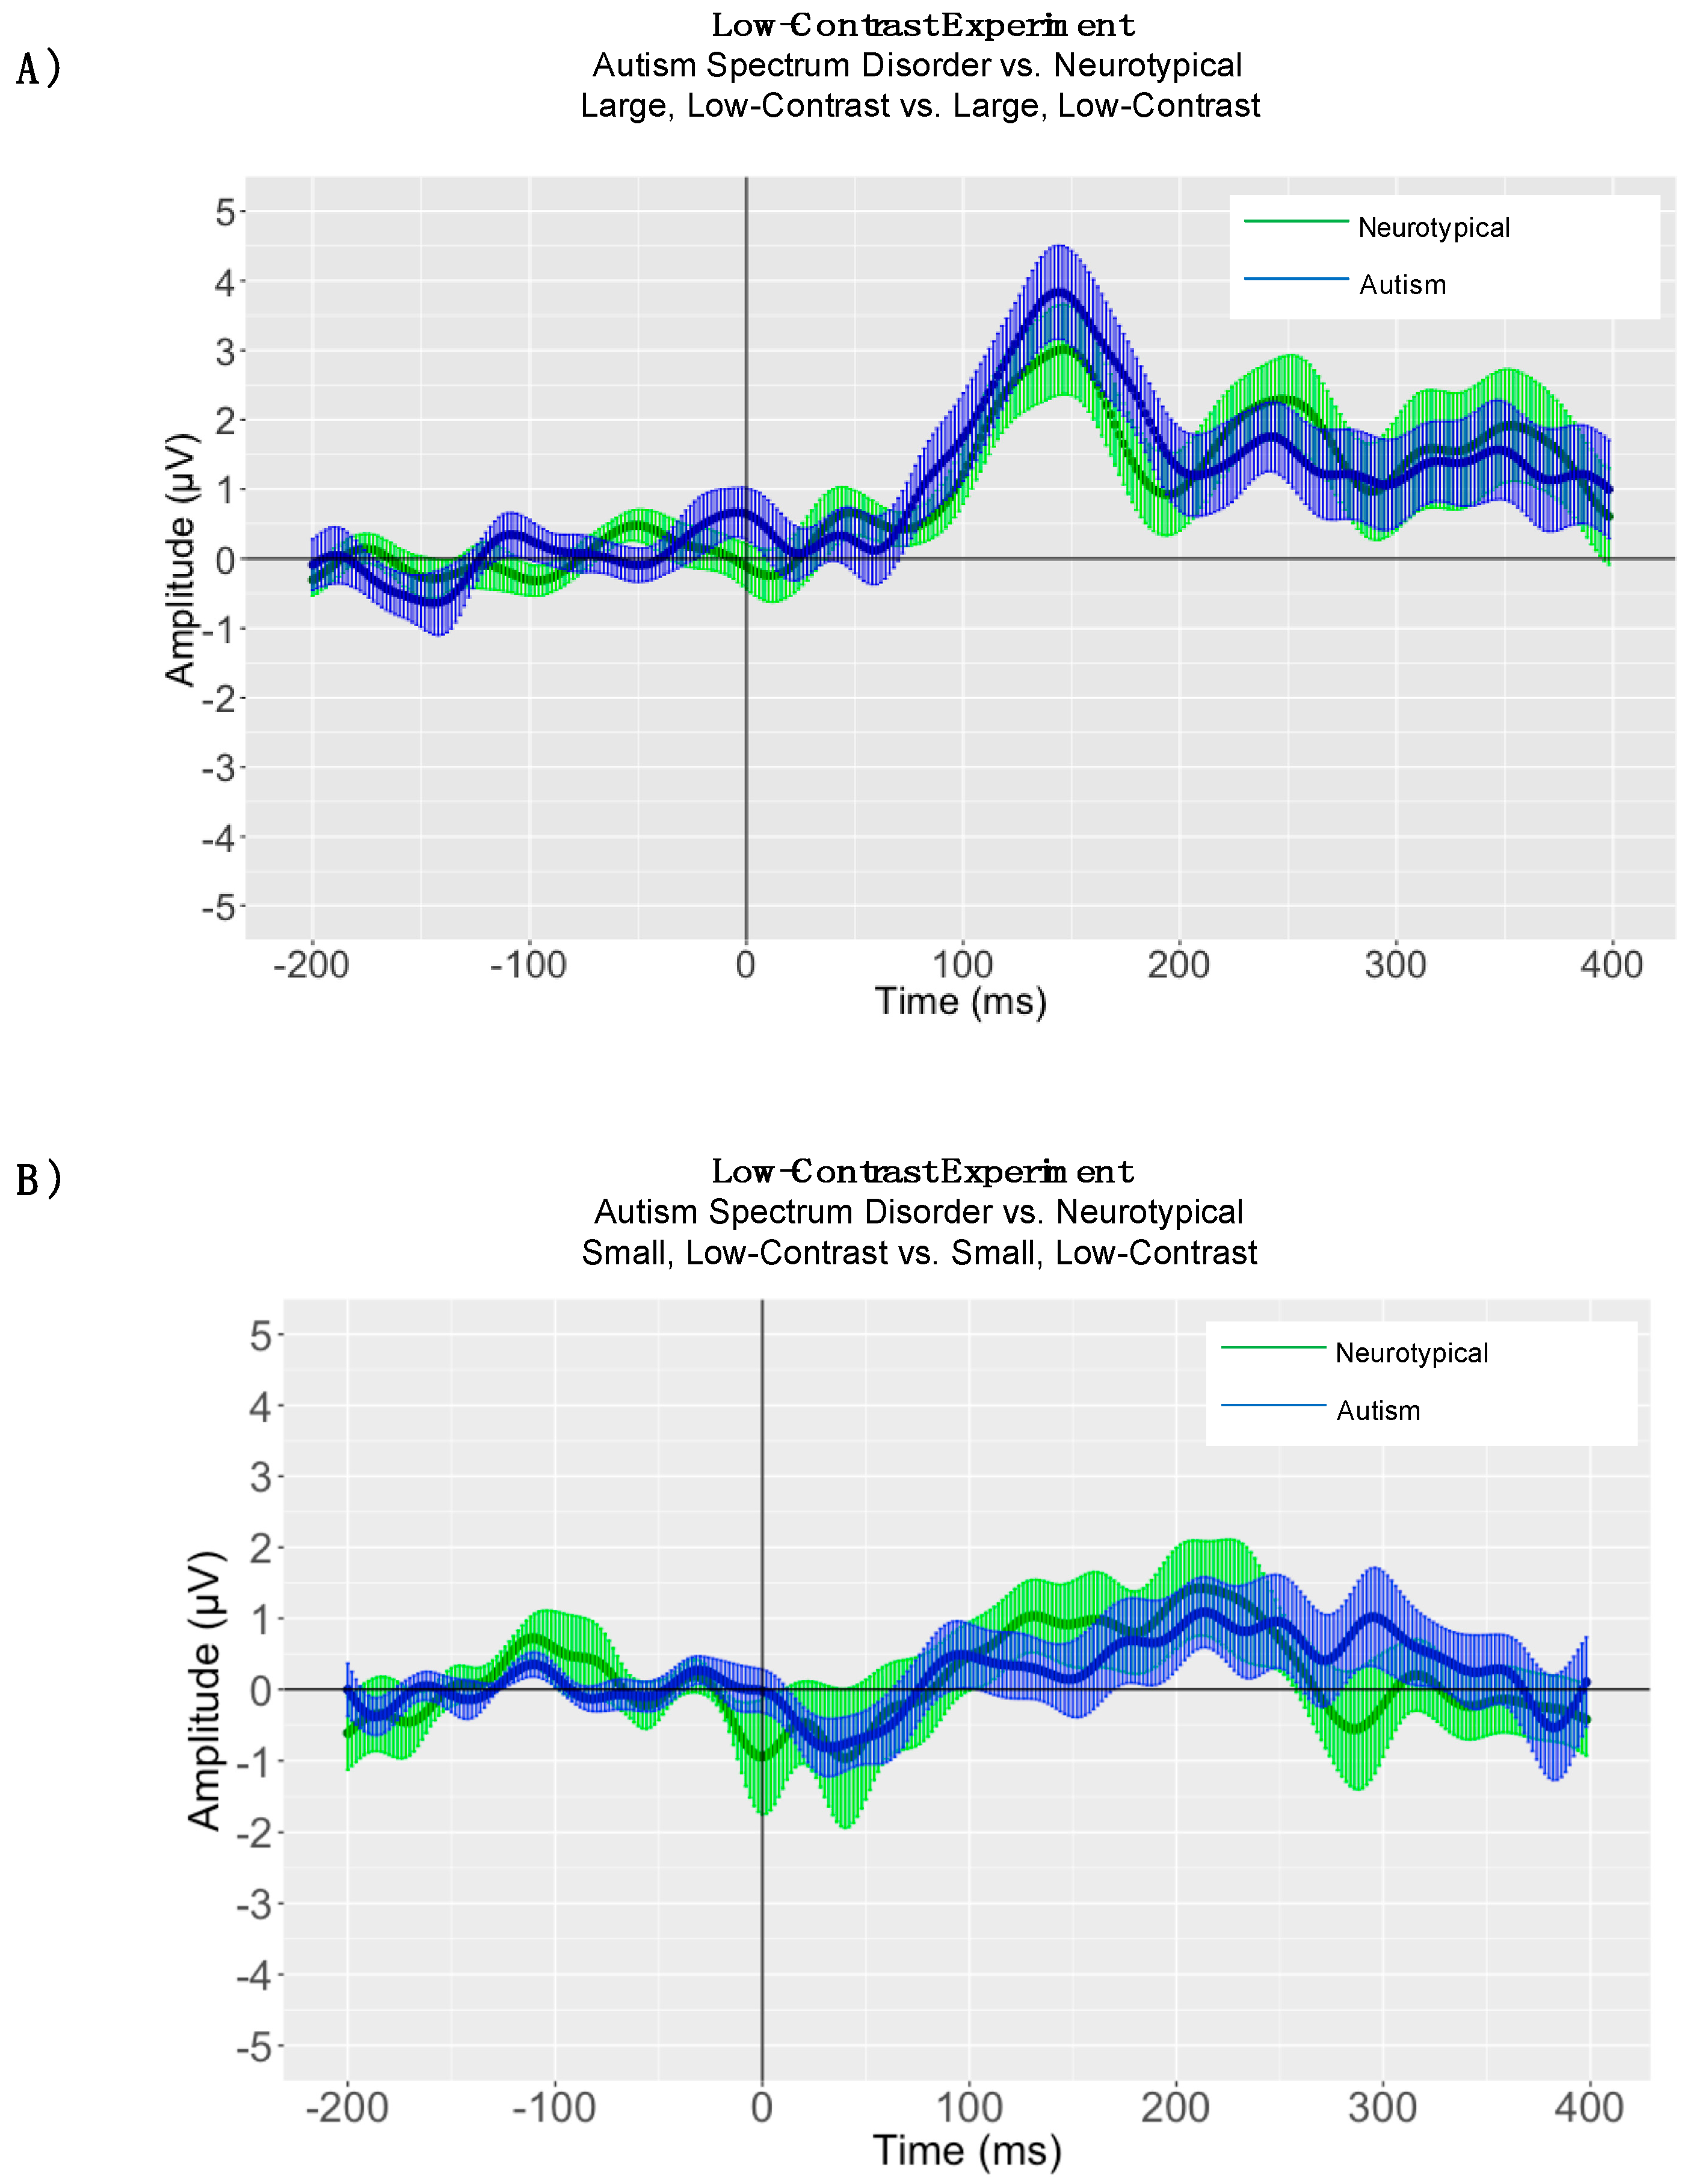
5. Low-Contrast Experiment
5.1. Within-Group Peak Latency Analyses
5.2. Between-Group Peak Latency Analyses
5.3. Adaptive Mean Amplitude Analysis
6. Study Limitations and Delimitations
7. Discussion
Author Contributions
Funding
Acknowledgments
Conflicts of Interest
References
- Association, A.P. Diagnostic and Statistical Manual of Mental Disorders, 5th ed.; American Psychiatric Publishing: Arlington, VA, USA, 2013. [Google Scholar]
- Weitlauf, A.S.; Sathe, N.; McPheeters, M.L.; Warren, Z.E. Interventions targeting sensory challenges in autism spectrum disorder: A systematic review. Pediatrics 2017, 139, e20170347. [Google Scholar] [CrossRef] [PubMed]
- Klin, A.; Shultz, S.; Jones, W. Social visual engagement in infants and toddlers with autism: Early developmental transitions and a model of pathogenesis. Neurosci. Biobehav. Rev. 2015, 50, 189–203. [Google Scholar] [CrossRef] [PubMed] [Green Version]
- Simon, D.M.; Wallace, M.T. Dysfunction of sensory oscillations in autism spectrum disorder. Neurosci. Biobehav. Rev. 2016, 68, 848–861. [Google Scholar] [CrossRef] [PubMed]
- Sacrey, L.A.; Armstrong, V.L.; Bryson, S.E.; Zwaigenbaum, L. Impairments to visual disengagement in autism spectrum disorder: A review of experimental studies from infancy to adulthood. Neurosci. Biobehav. Rev. 2014, 47, 559–577. [Google Scholar] [CrossRef] [PubMed]
- Simmons, D.R.; Robertson, A.E.; McKay, L.S.; Toal, E.; McAleer, P.; Pollick, F.E. Vision in autism spectrum disorders. Vis. Res. 2009, 49, 2705–2739. [Google Scholar] [CrossRef] [PubMed]
- Bertone, A.; Faubert, J. How is complex second-order motion processed? Vis. Res. 2003, 43, 2591–2601. [Google Scholar] [CrossRef] [Green Version]
- Ronconi, L.; Molteni, M.; Casartelli, L. Building blocks of others’ understanding: A perspective shift in investigating social-communicative deficit in autism. Front. Hum. Neurosci. 2016, 10, 144. [Google Scholar] [CrossRef] [PubMed]
- Marco, E.J.; Hinkley, L.B.; Hill, S.S.; Nagarajan, S.S. Sensory processing in autism: A review of neurophysiologic findings. Pediatr. Res. 2011, 69. Available online: https://www.nature.com/articles/pr9201193 (accessed on 12 June 2018). [CrossRef] [PubMed]
- Koh, H.C.; Milne, E.; Dobkins, K. Spatial contrast sensitivity in adolescents with autism spectrum disorders. J. Autism Dev. Disord. 2010, 40, 978–987. [Google Scholar] [CrossRef] [PubMed]
- Foss-Feig, J.H.; Tadin, D.; Schauder, K.B.; Cascio, C.J. A substantial and unexpected enhancement of motion perception in autism. J. Neurosci. 2013, 33, 8243–8249. [Google Scholar] [CrossRef] [PubMed]
- Sysoeva, O.V.; Galuta, I.A.; Davletshina, M.S.; Orekhova, E.V.; Stroganova, T.A. Abnormal size-dependent modulation of motion perception in children with autism spectrum disorder (asd). Front. Neurosci. 2017, 11, 164. [Google Scholar] [CrossRef] [PubMed]
- Schauder, K.B.; Park, W.J.; Tadin, D.; Bennetto, L. Larger receptive field size as a mechanism underlying atypical motion perception in autism spectrum disorder. Clin. Psychol. Sci. 2017, 5, 827–842. [Google Scholar] [CrossRef] [PubMed]
- Tadin, D. Suppressive mechanisms in visual motion processing: From perception to intelligence. Vis. Res. 2015, 115, 58–70. [Google Scholar] [CrossRef] [PubMed]
- Hubel, D.H.; Wiesel, T.N. Effects of varying stimulus size and color on single lateral geniculate cells in rhesus monkeys. Proc. Natl. Acad. Sci. USA 1966, 55, 1345–1346. [Google Scholar] [CrossRef] [PubMed]
- Tadin, D.; Silvanto, J.; Pascual-Leone, A.; Battelli, L. Improved motion perception and impaired spatial suppression following disruption of cortical area MT/V5. J. Neurosci. 2011, 31, 1279–1283. [Google Scholar] [CrossRef] [PubMed]
- Series, P.; Lorenceau, J.; Fregnac, Y. The “silent” surround of V1 receptive fields: Theory and experiments. J. Physiol. Paris 2003, 97, 453–474. [Google Scholar] [CrossRef] [PubMed]
- Tailby, C.; Solomon, S.G.; Peirce, J.W.; Metha, A.B. Two expressions of “surround suppression” in V1 that arise independent of cortical mechanisms of suppression. Vis. Neurosci. 2007, 24, 99–109. [Google Scholar] [CrossRef] [PubMed]
- Solomon, S.G.; Peirce, J.W.; Lennie, P. The impact of suppressive surrounds on chromatic properties of cortical neurons. J. Neurosci. 2004, 24, 148–160. [Google Scholar] [CrossRef] [PubMed]
- Lamme, V.A.; Super, H.; Spekreijse, H. Feedforward, horizontal, and feedback processing in the visual cortex. Curr. Opin. Neurobiol. 1998, 8, 529–535. [Google Scholar] [CrossRef]
- Geisler, W.S.; Albrecht, D.G. Cortical neurons: Isolation of contrast gain control. Vis. Res. 1992, 32, 1409–1410. [Google Scholar] [CrossRef]
- Tang, Q.; Sang, N.; Liu, H. Contrast-dependent surround suppression models for contour detection. Pattern Recognit. 2016, 60, 51–61. [Google Scholar] [CrossRef]
- Ohzawa, I.; Sclar, G.; Freeman, R.D. Contrast gain control in the cat’s visual system. J. Neurophysiol. 1985, 54, 651–667. [Google Scholar] [CrossRef] [PubMed]
- Butler, P.D.; Silverstein, S.M.; Dakin, S.C. Visual perception and its impairment in schizophrenia. Biol. Psychiatry 2008, 64, 40–47. [Google Scholar] [CrossRef] [PubMed]
- Pelli, D.G.; Robson, J.G. The design of a new letter chart for measuring contrast sensitivity. Clin. Vis. Sci. 1988, 2, 187–199. [Google Scholar]
- Roid, G.H. Stanford-Binet Intelligence Scales; Riverside Publishing: Itasca, IL, USA, 2005. [Google Scholar]
- Schopler, E.; Van Bourgondien, M.E.; Wellman, G.J.; Love, S.R. Childhood Autism Rating Scale, 2nd ed.; Western Psychological Services: Los Angeles, CA, USA, 2010. [Google Scholar]
- Lord, C.; Rutter, M.; DiLavore, P.; Risi, S.; Gotham, K.; Bishop, S. Autism Diagnostic Observation Schedule, 2nd ed.; Western Psychological Corporation: Los Angeles, CA, USA, 2012. [Google Scholar]
- Baranek, G.T.; David, F.J.; Poe, M.D.; Stone, W.L.; Watson, L.R. Sensory experiences questionnaire: Discriminating sensory features in young children with autism, developmental delays, and typical development. J. Child Psychol. Psychiatry 2006, 47, 591–601. [Google Scholar] [CrossRef] [PubMed]
- Golomb, J.D.; McDavitt, J.R.; Ruf, B.M.; Chen, J.I.; Saricicek, A.; Maloney, K.H.; Hu, J.; Chun, M.M.; Bhagwagar, Z. Enhanced visual motion perception in major depressive disorder. J. Neurosci. 2009, 29, 9072–9077. [Google Scholar] [CrossRef] [PubMed]
- Beaudot, W.H. Psykinematix: A new psychophysical tool for investigating visual impairment due to neural dysfunctions. J. Vis. Soc. Jpn. 2009, 21, 19–32. [Google Scholar]
- Tucker, D.M. Spatial sampling of head electrical fields: The geodesic sensor net. Electroencephalogr. Clin. Neurophysiol. 1993, 87, 154–163. [Google Scholar] [CrossRef]
- Handy, T.C. Event-Related Potentials: A Methods Handbook; MIT Press: Cambridge, MA, USA, 2005. [Google Scholar]
- Luck, S.J. An Introduction to the Event-Related Potential Technique; MIT Press: Cambridge, MA, USA, 2014. [Google Scholar]
- Picton, T.W.; Taylor, M.J. Electrophysiological evaluation of human brain development. Dev. Neuropsychol. 2007, 31, 249–278. [Google Scholar] [CrossRef] [PubMed]
- DeBoer, T.; Scott, L.S.; Nelson, C.A. Event-related potentials in developmental populations. In Methodological Handbook for Research Using Event-Related Potentials; Todd, H., Ed.; The MIT Press: Cambridge, MA, USA, 2005. [Google Scholar]
- Mitchell, T.V.; Neville, H.J. Asynchronies in the development of electrophysiological responses to motion and color. J. Cogn. Neurosci. 2004, 16, 1363–1374. [Google Scholar] [CrossRef] [PubMed]
- Coch, D.; Skendzel, W.; Grossi, G.; Neville, H. Motion and color processing in school-age children and adults: An erp study. Dev. Sci. 2005, 8, 372–386. [Google Scholar] [CrossRef] [PubMed]
- Bakroon, A.; Lakshminarayanan, V. Visual function in autism spectrum disorders: A critical review. Clin. Exp. Optom. 2016, 99, 297–308. [Google Scholar] [CrossRef] [PubMed]
- Wallisch, P.; Bornstein, A.M. Enhanced motion perception as a psychophysical marker for autism? J. Neurosci. 2013, 33, 14631–14632. [Google Scholar] [CrossRef] [PubMed]
- Constable, P.A.; Gaigg, S.B.; Bowler, D.M.; Thompson, D.A. Motion and pattern cortical potentials in adults with high-functioning autism spectrum disorder. Doc. Ophthalmol. 2012, 125, 219–227. [Google Scholar] [CrossRef] [PubMed] [Green Version]
- Rosenberg, A.; Patterson, J.S.; Angelaki, D.E. A computational perspective on autism. Proc. Natl. Acad. Sci. USA 2015, 112, 9158–9165. [Google Scholar] [CrossRef] [PubMed] [Green Version]
- Bullier, J.; Hupe, J.M.; James, A.; Girard, P. Functional interactions between areas v1 and v2 in the monkey. J. Physiol. Paris 1996, 90, 217–220. [Google Scholar] [CrossRef]
- Nowak, L.G.; James, A.C.; Bullier, J. Corticocortical connections between visual areas 17 and 18a of the rat studied in vitro: Spatial and temporal organisation of functional synaptic responses. Exp. Brain Res. 1997, 117, 219–241. [Google Scholar] [CrossRef] [PubMed]


| Autism (n = 16) | Neurotypical (n = 16) | Total (n = 32) | |
|---|---|---|---|
| Sex | |||
| Male | 11 | 9 | 20 |
| Female | 5 | 7 | 12 |
| Age in years: Mean (SD) | 8.04 (1.78) | 9.44 (2.29) | 8.94 (2.14) |
| Race | |||
| African-American | 4 | 2 | 6 |
| Asian-American | 1 | 5 | 6 |
| Caucasian | 6 | 9 | 15 |
| Native American | 1 | 0 | 1 |
| Mixed Race | 4 | 0 | 4 |
| Ethnicity | |||
| Hispanic or Latino | 7 | 2 | 9 |
| Not Hispanic or Latino | 9 | 14 | 23 |
| P1 Peak Latency | P1 Adaptive Mean Amplitude | |
|---|---|---|
| High-Contrast Experiment |
|
|
| Low-Contrast Experiment |
|
|
© 2018 by the authors. Licensee MDPI, Basel, Switzerland. This article is an open access article distributed under the terms and conditions of the Creative Commons Attribution (CC BY) license (http://creativecommons.org/licenses/by/4.0/).
Share and Cite
Shuffrey, L.C.; Levinson, L.; Becerra, A.; Pak, G.; Moya Sepulveda, D.; Montgomery, A.K.; Green, H.L.; Froud, K. Visually Evoked Response Differences to Contrast and Motion in Children with Autism Spectrum Disorder. Brain Sci. 2018, 8, 160. https://doi.org/10.3390/brainsci8090160
Shuffrey LC, Levinson L, Becerra A, Pak G, Moya Sepulveda D, Montgomery AK, Green HL, Froud K. Visually Evoked Response Differences to Contrast and Motion in Children with Autism Spectrum Disorder. Brain Sciences. 2018; 8(9):160. https://doi.org/10.3390/brainsci8090160
Chicago/Turabian StyleShuffrey, Lauren C., Lisa Levinson, Alexis Becerra, Grace Pak, Dayna Moya Sepulveda, Alicia K. Montgomery, Heather L. Green, and Karen Froud. 2018. "Visually Evoked Response Differences to Contrast and Motion in Children with Autism Spectrum Disorder" Brain Sciences 8, no. 9: 160. https://doi.org/10.3390/brainsci8090160