
Perceptual Temporal Asymmetry Associated with Distinct ON and OFF Responses to Time-Varying Sounds with Rising versus Falling Intensity: A Magnetoencephalography Study

 ,
, 
Abstract
:
1. Introduction
2. Materials and Methods
2.1. Participants
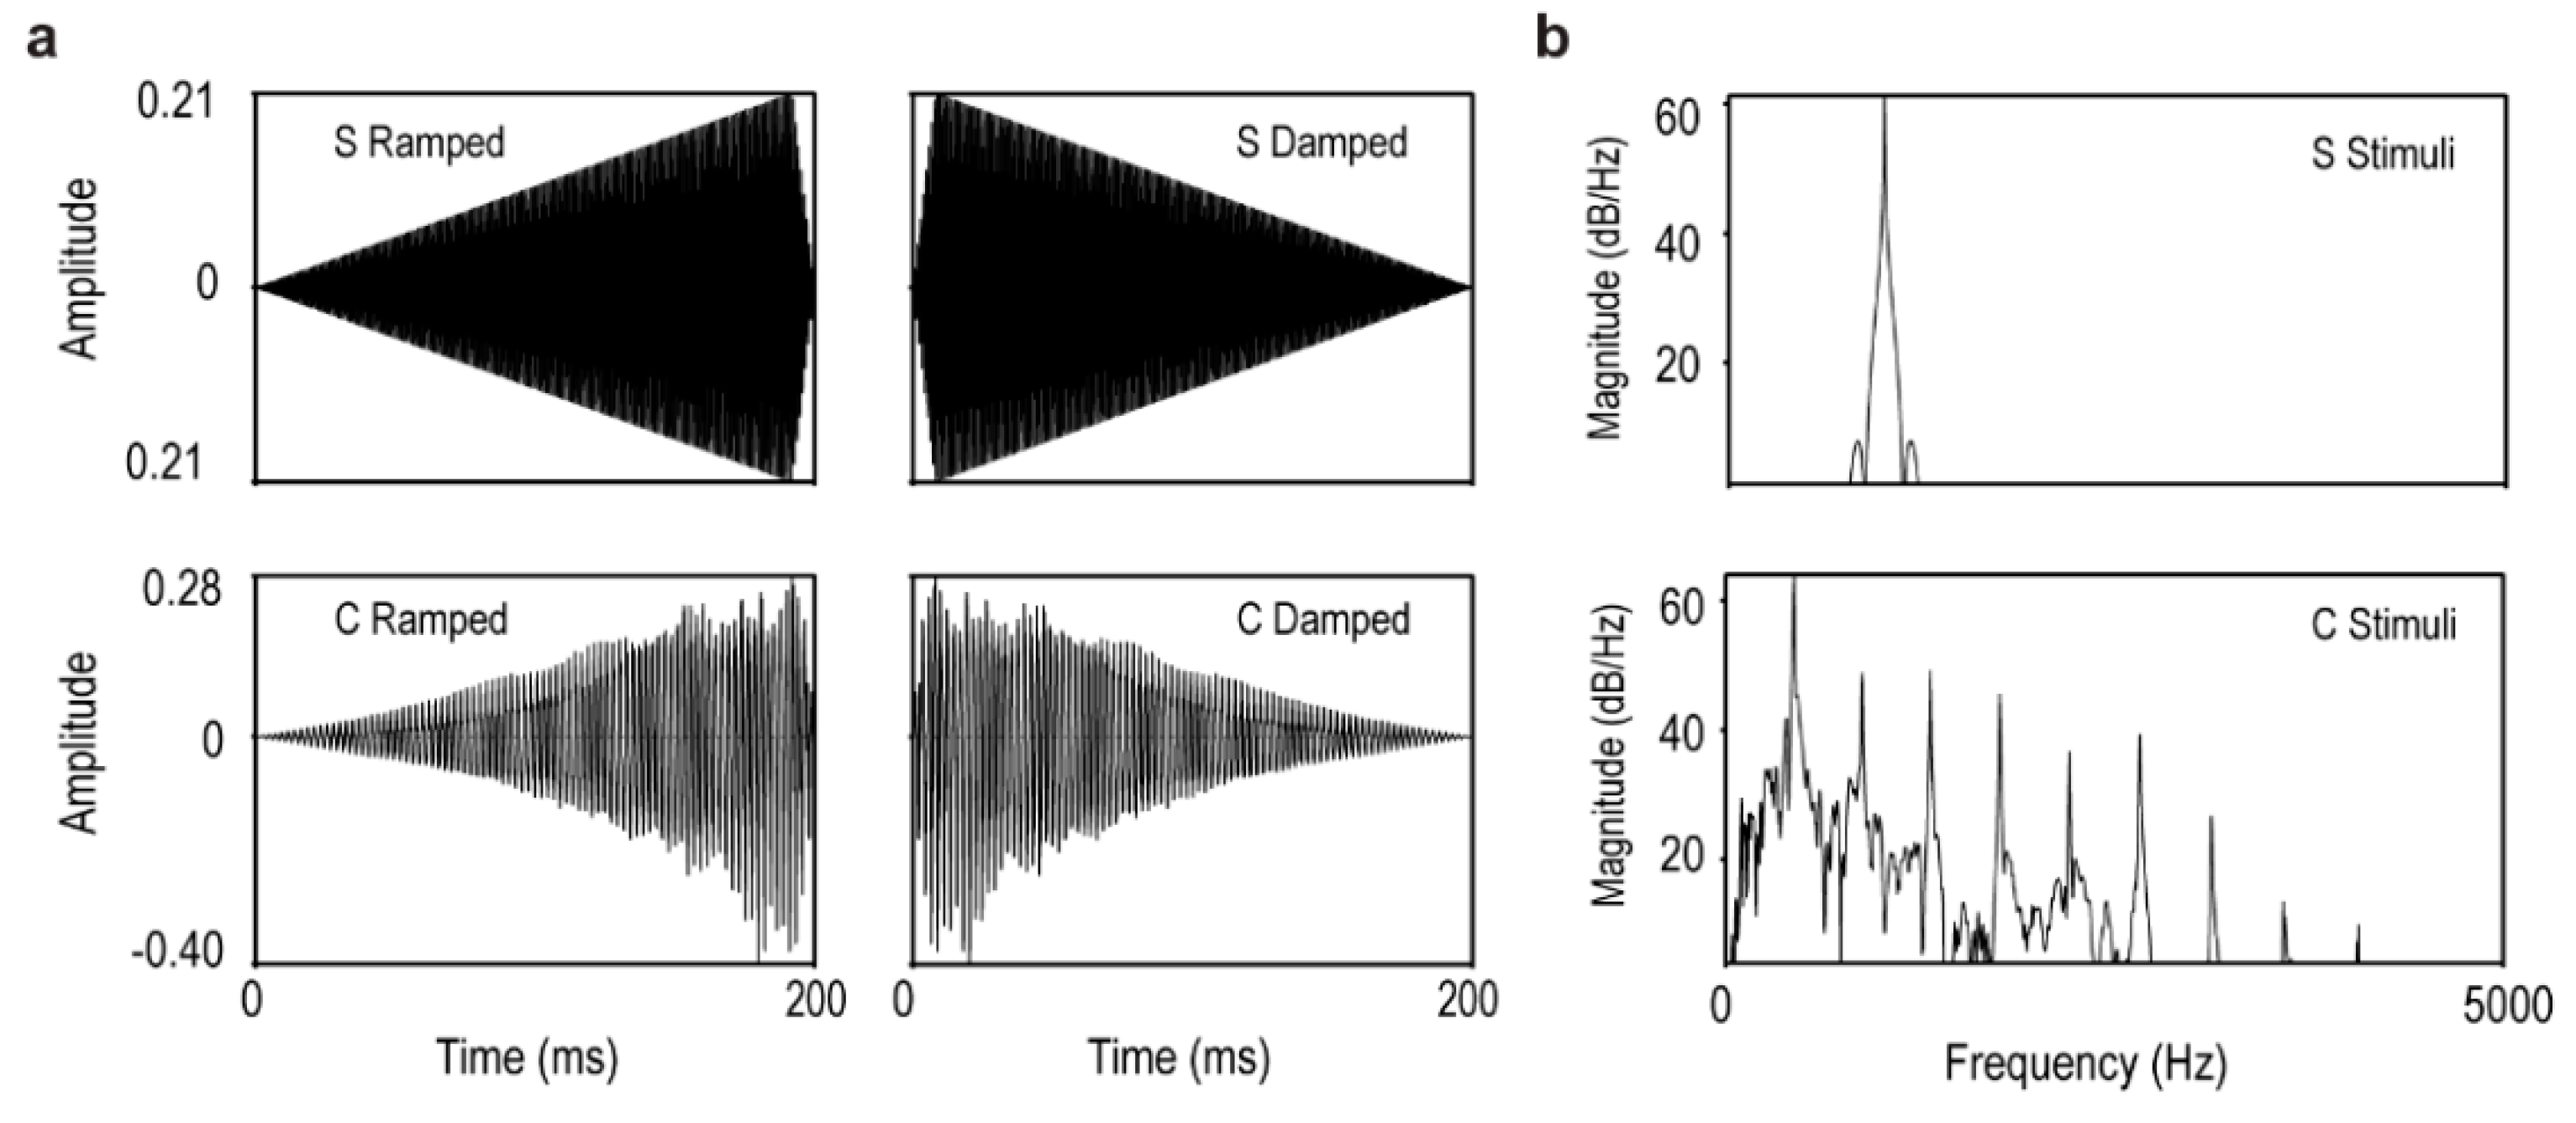
2.2. Stimuli
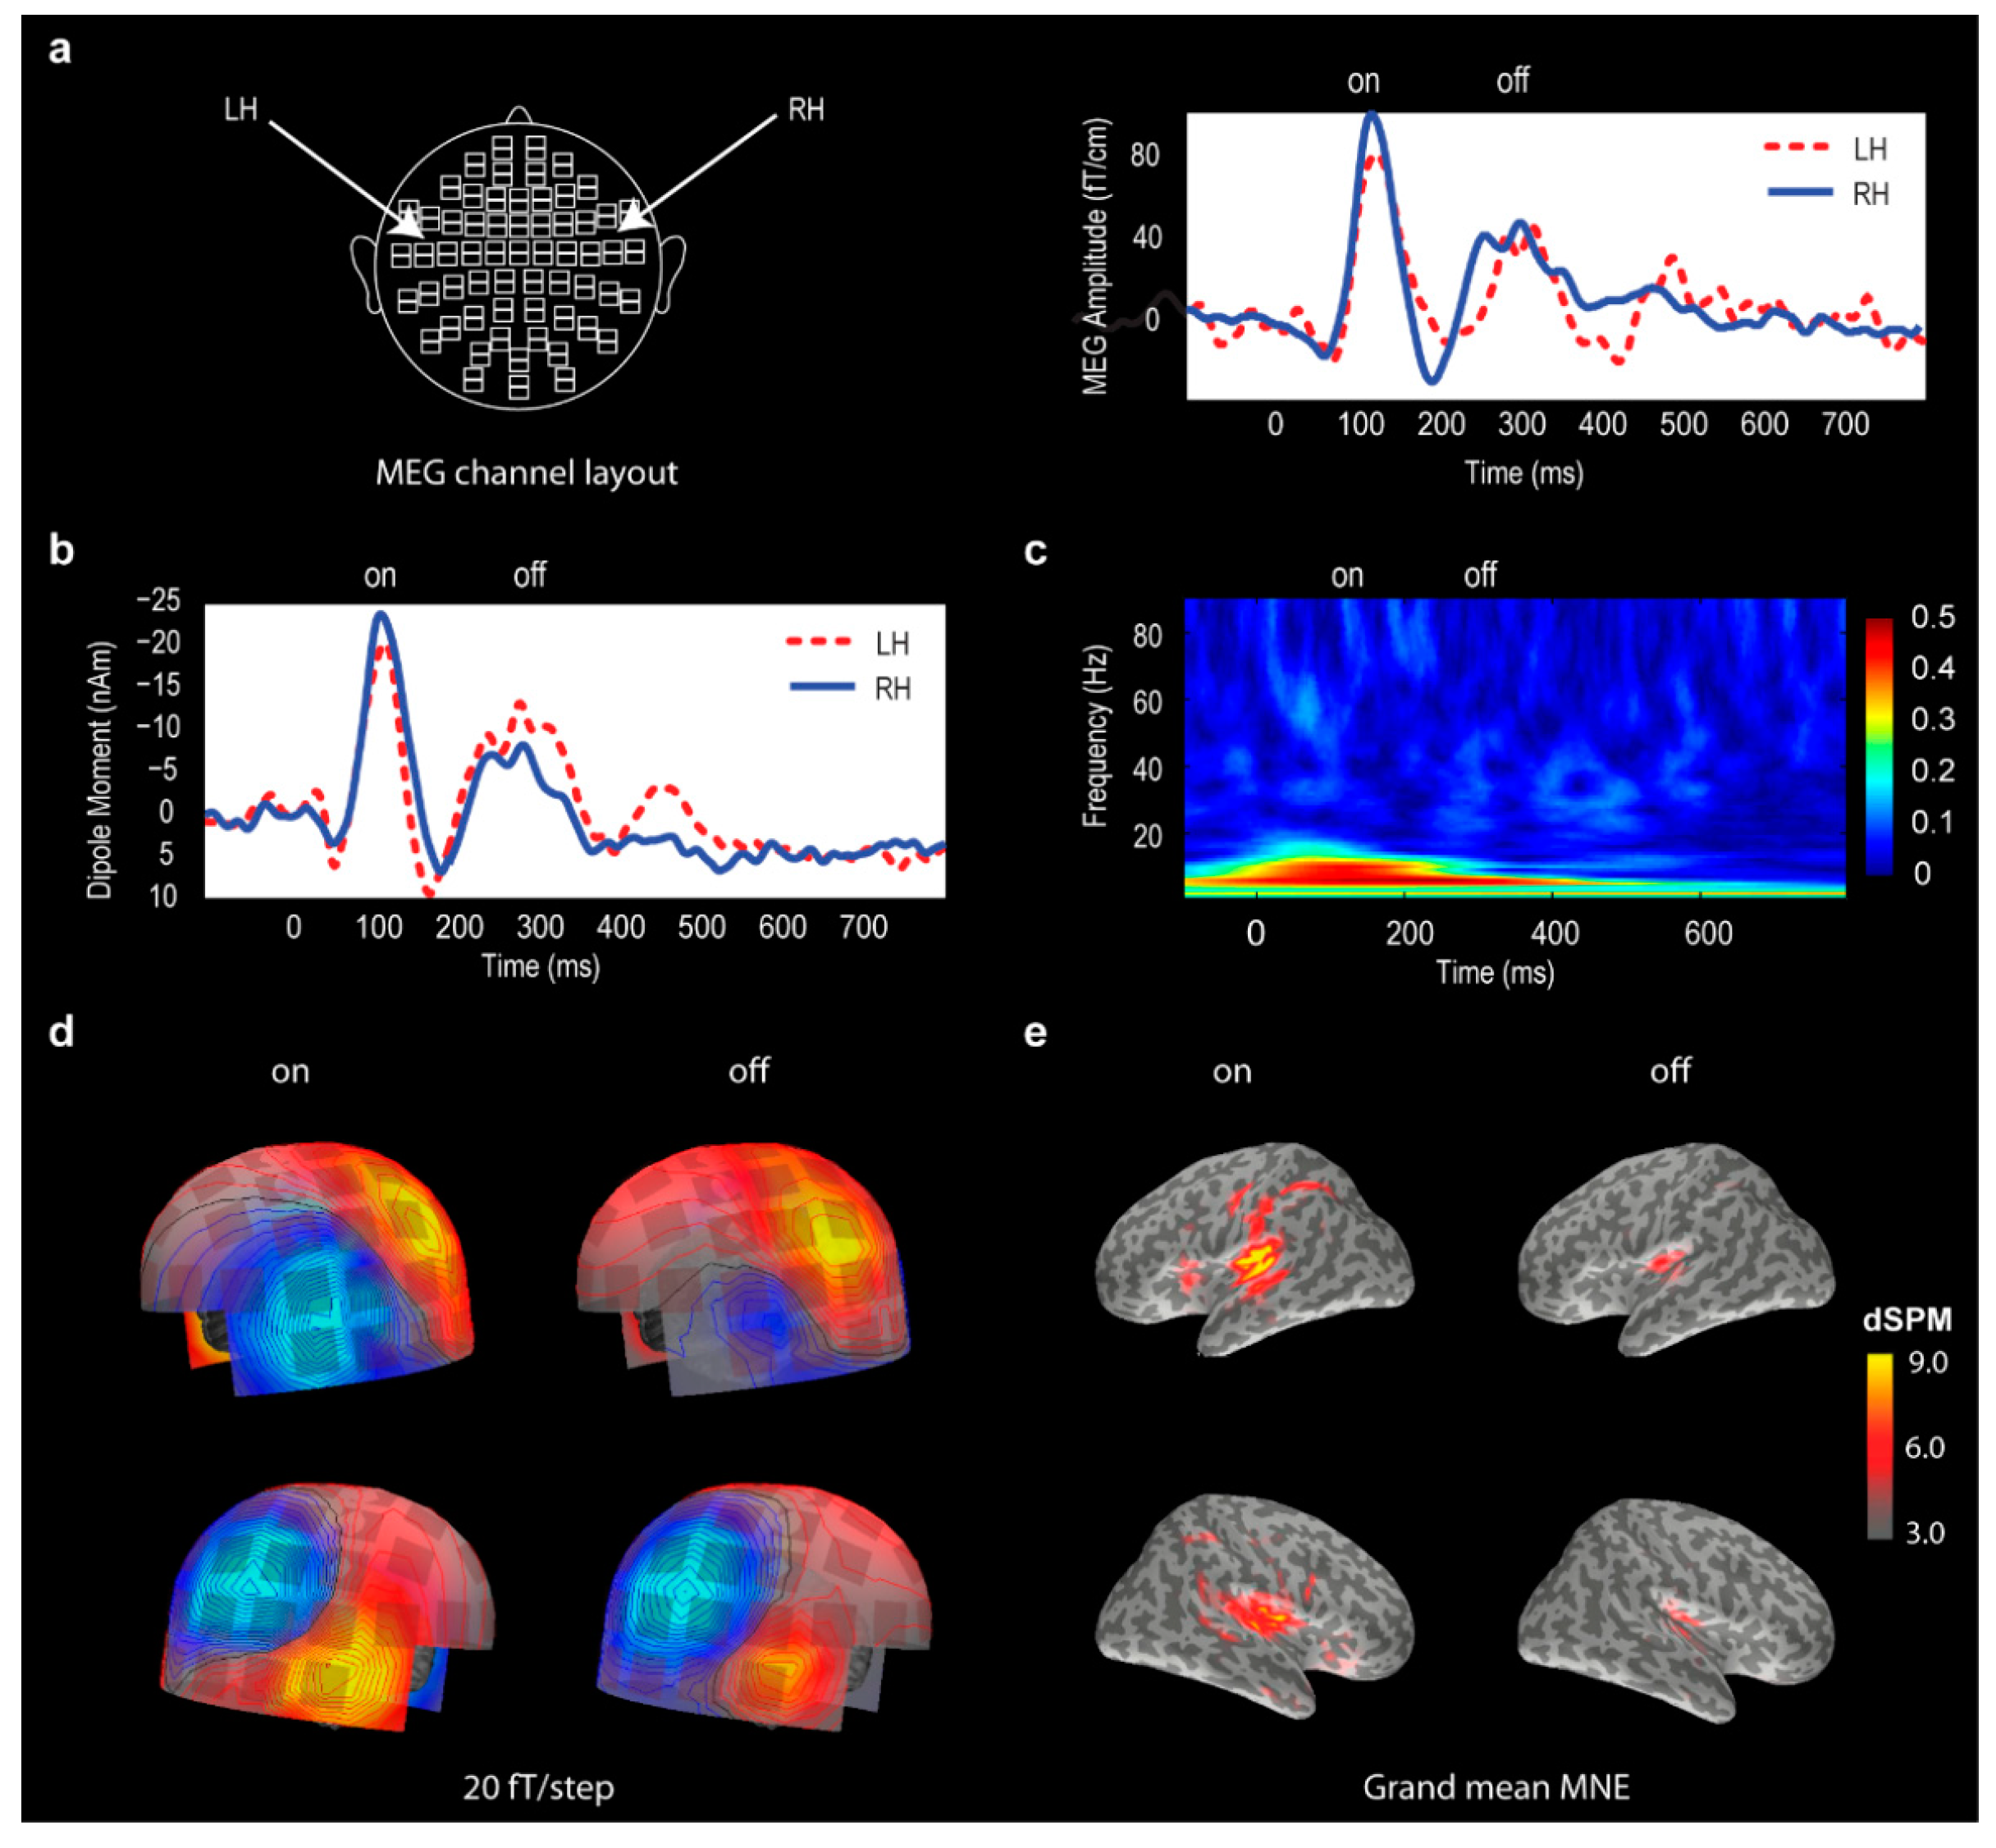
2.3. MEG Recording
2.4. Global Field Power Analysis
2.5. Source Localization Analysis
- (1)
- Head model preparation. The individual subject’s MRIs were converted and processed using the Freesurfer software to derive the boundary element models.
- (2)
- MRI-MEG co-registration. After stimulus set operations were performed for filtering, artifact rejection and averaging, the MEG waveform data were loaded for head position adjustment relative to each subject’s Head Position Indicator (HPI) data and the 3-D locations of the nasion, left and right preauricular points. We used four HPI coils in the experiment; two were positioned in the forehead, and the other two were right behind the two ears.
- (3)
- Standardized forward and inverse solution. Forward and inverse solutions were derived following the recommended settings in the MNE-Suite. Baseline noise covariance matrix was calculated for each averaged data set. To perform MNE averaging across subjects and regions of interest analysis, the individual MNE data were morphed to a standard brain model.
- (4)
- Regions of Interest (ROI) analysis. Based on the brain activation patterns, two ROIs in the standard brain space were chosen, namely, the superior temporal (ST) and inferior parietal (IP). The ROIs were anatomically defined and annotated with corresponding Talairach coordinates in the MNE-Suite. The individual MNE waveforms for each ROI were exported and further analyzed in Matlab.
- (5)
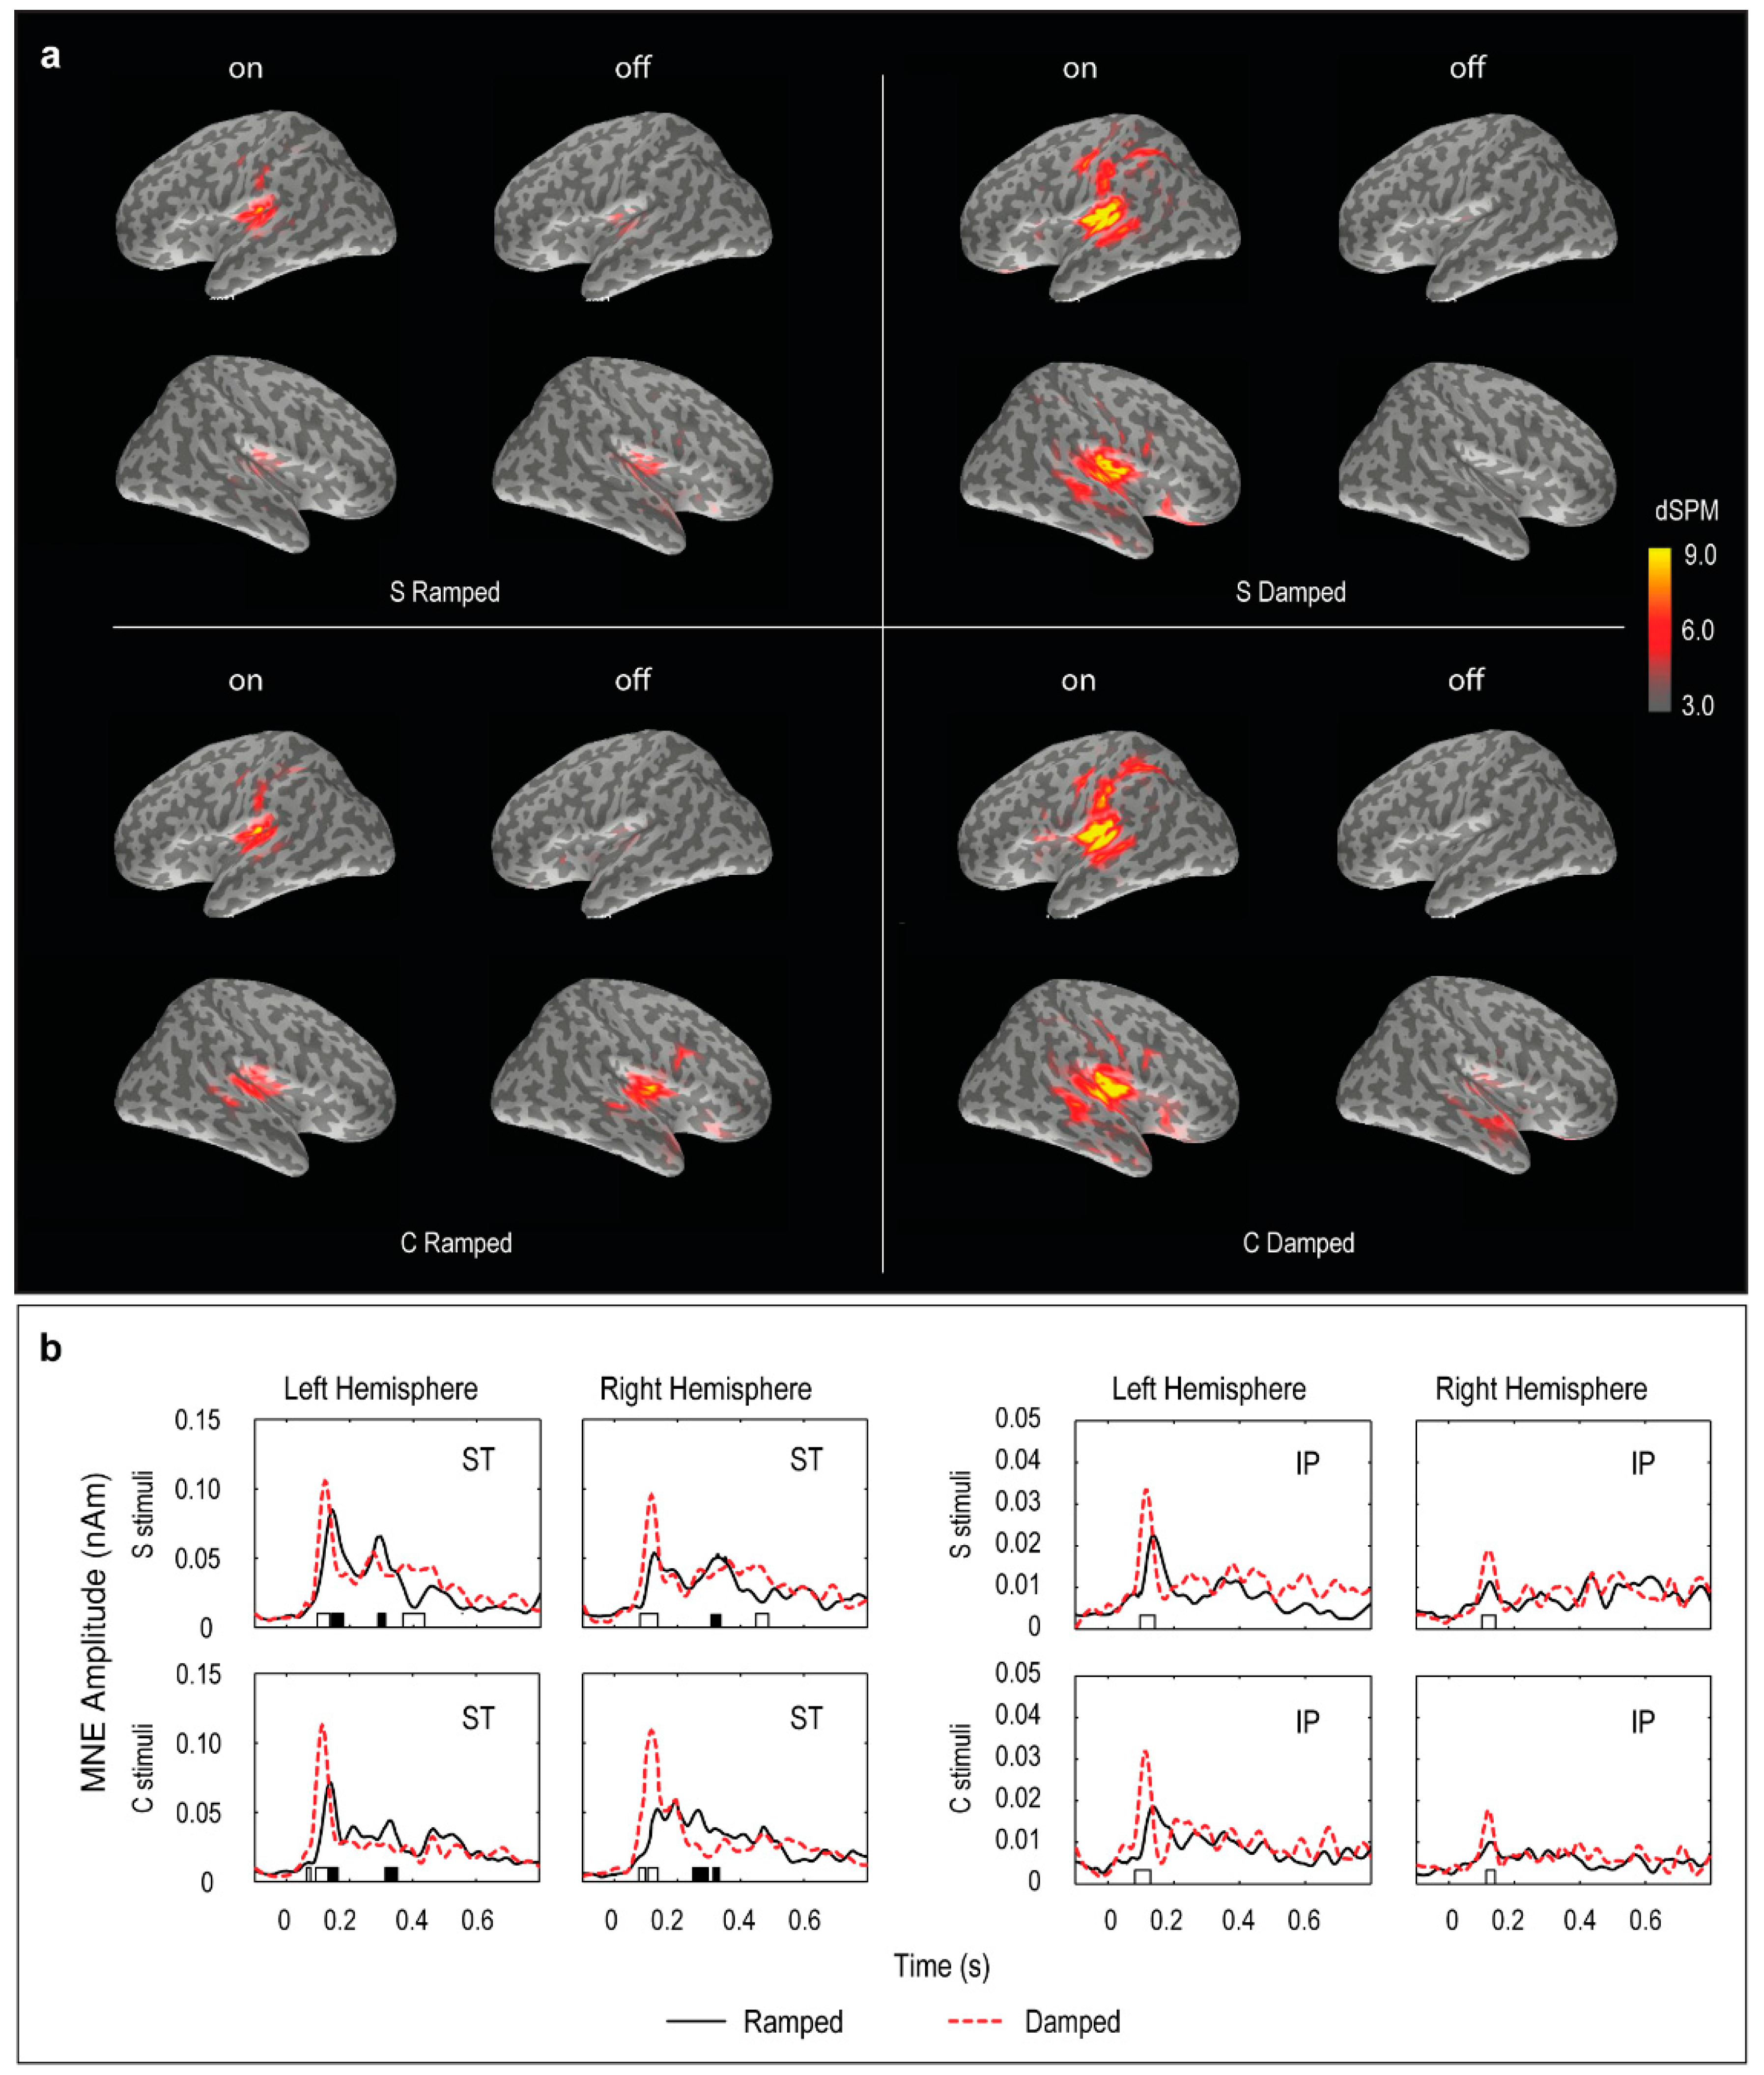
- MNE movie generation. For visualization purposes, the grand mean results for each stimulus were exported as movie files with MNE results expressed in dSPM (dynamic statistical parametric mapping) values integrated at every 10 ms [64,65]. The movie frames with peak activities were selected in the two post-stimulus windows, 70–150 ms and 250–350 ms, and plotted to illustrate the spatial localization of the ON and OFF responses.
2.6. Phase-Locking Factor Analysis
2.7. Behavioral Tests on Subjective Duration
2.8. Statistical Analysis
3. Results
3.1. Behavioral Data
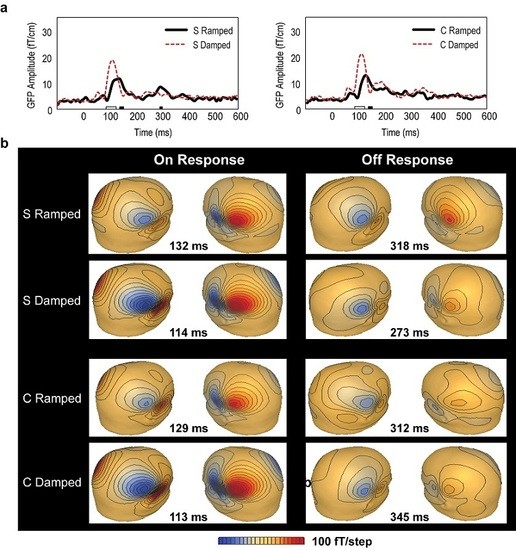
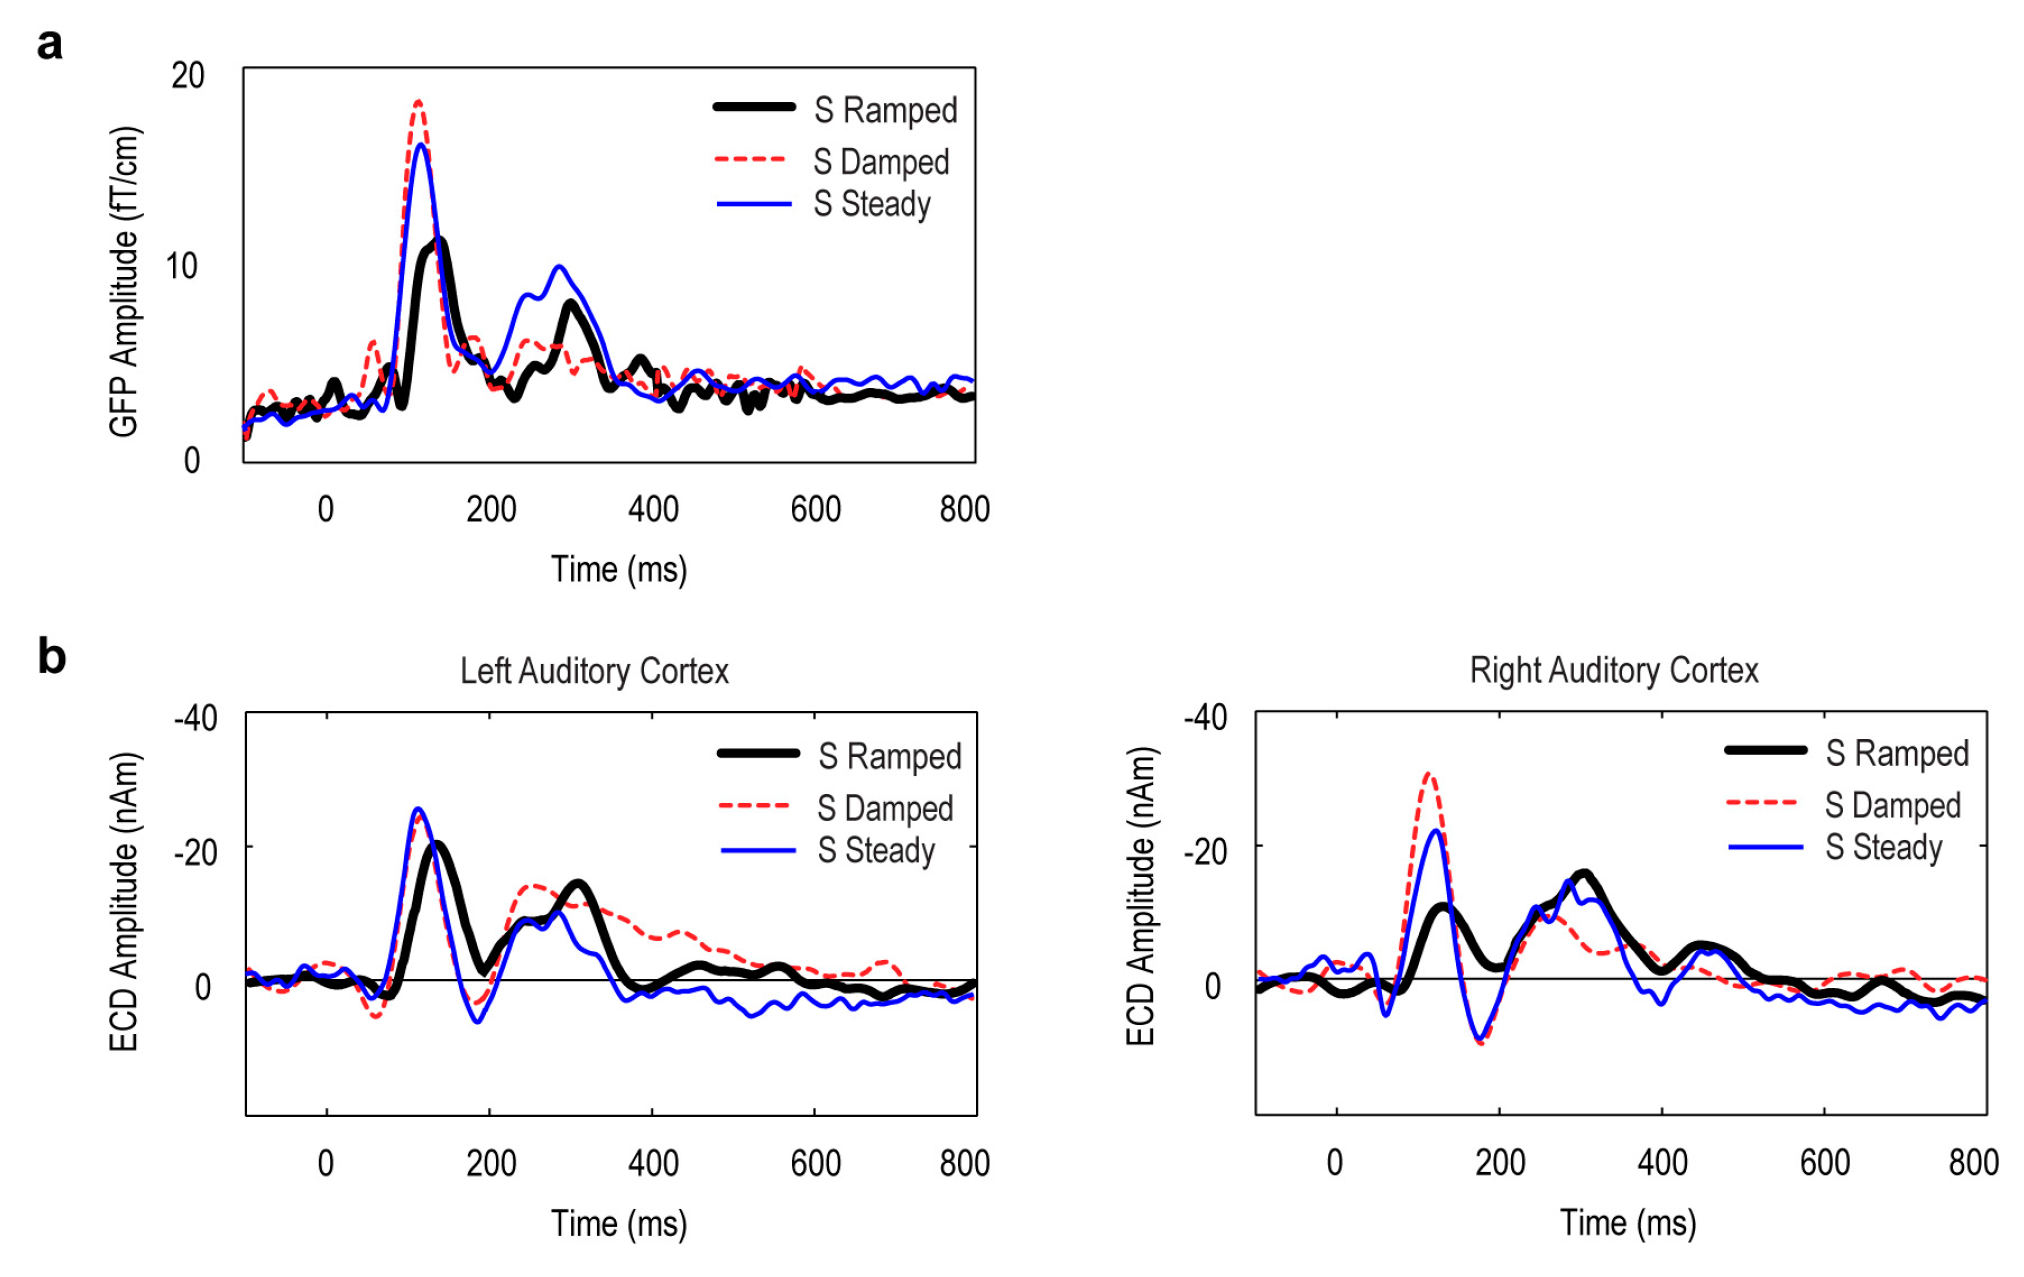
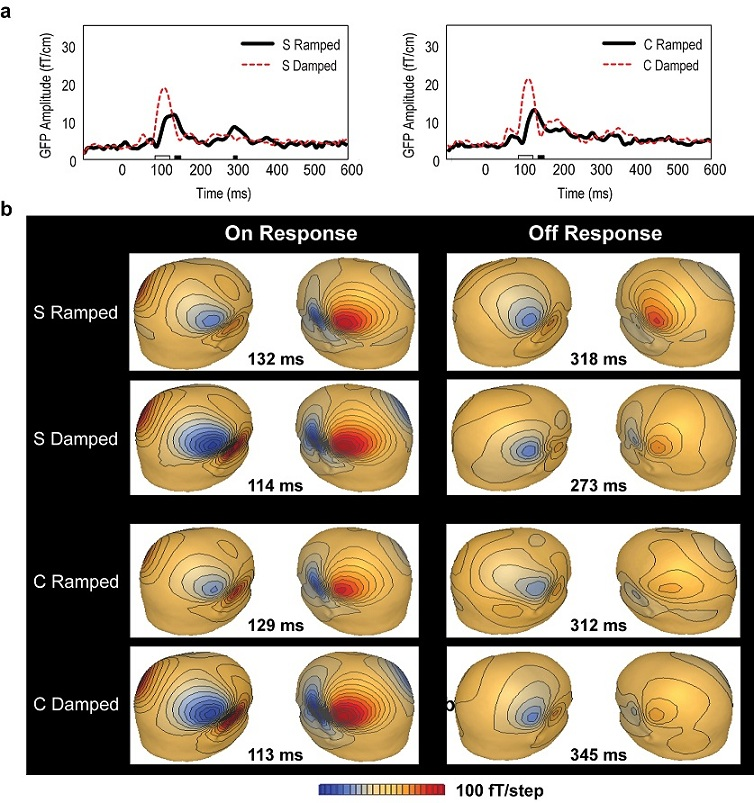
3.2. Global Field Power (GFP) Data
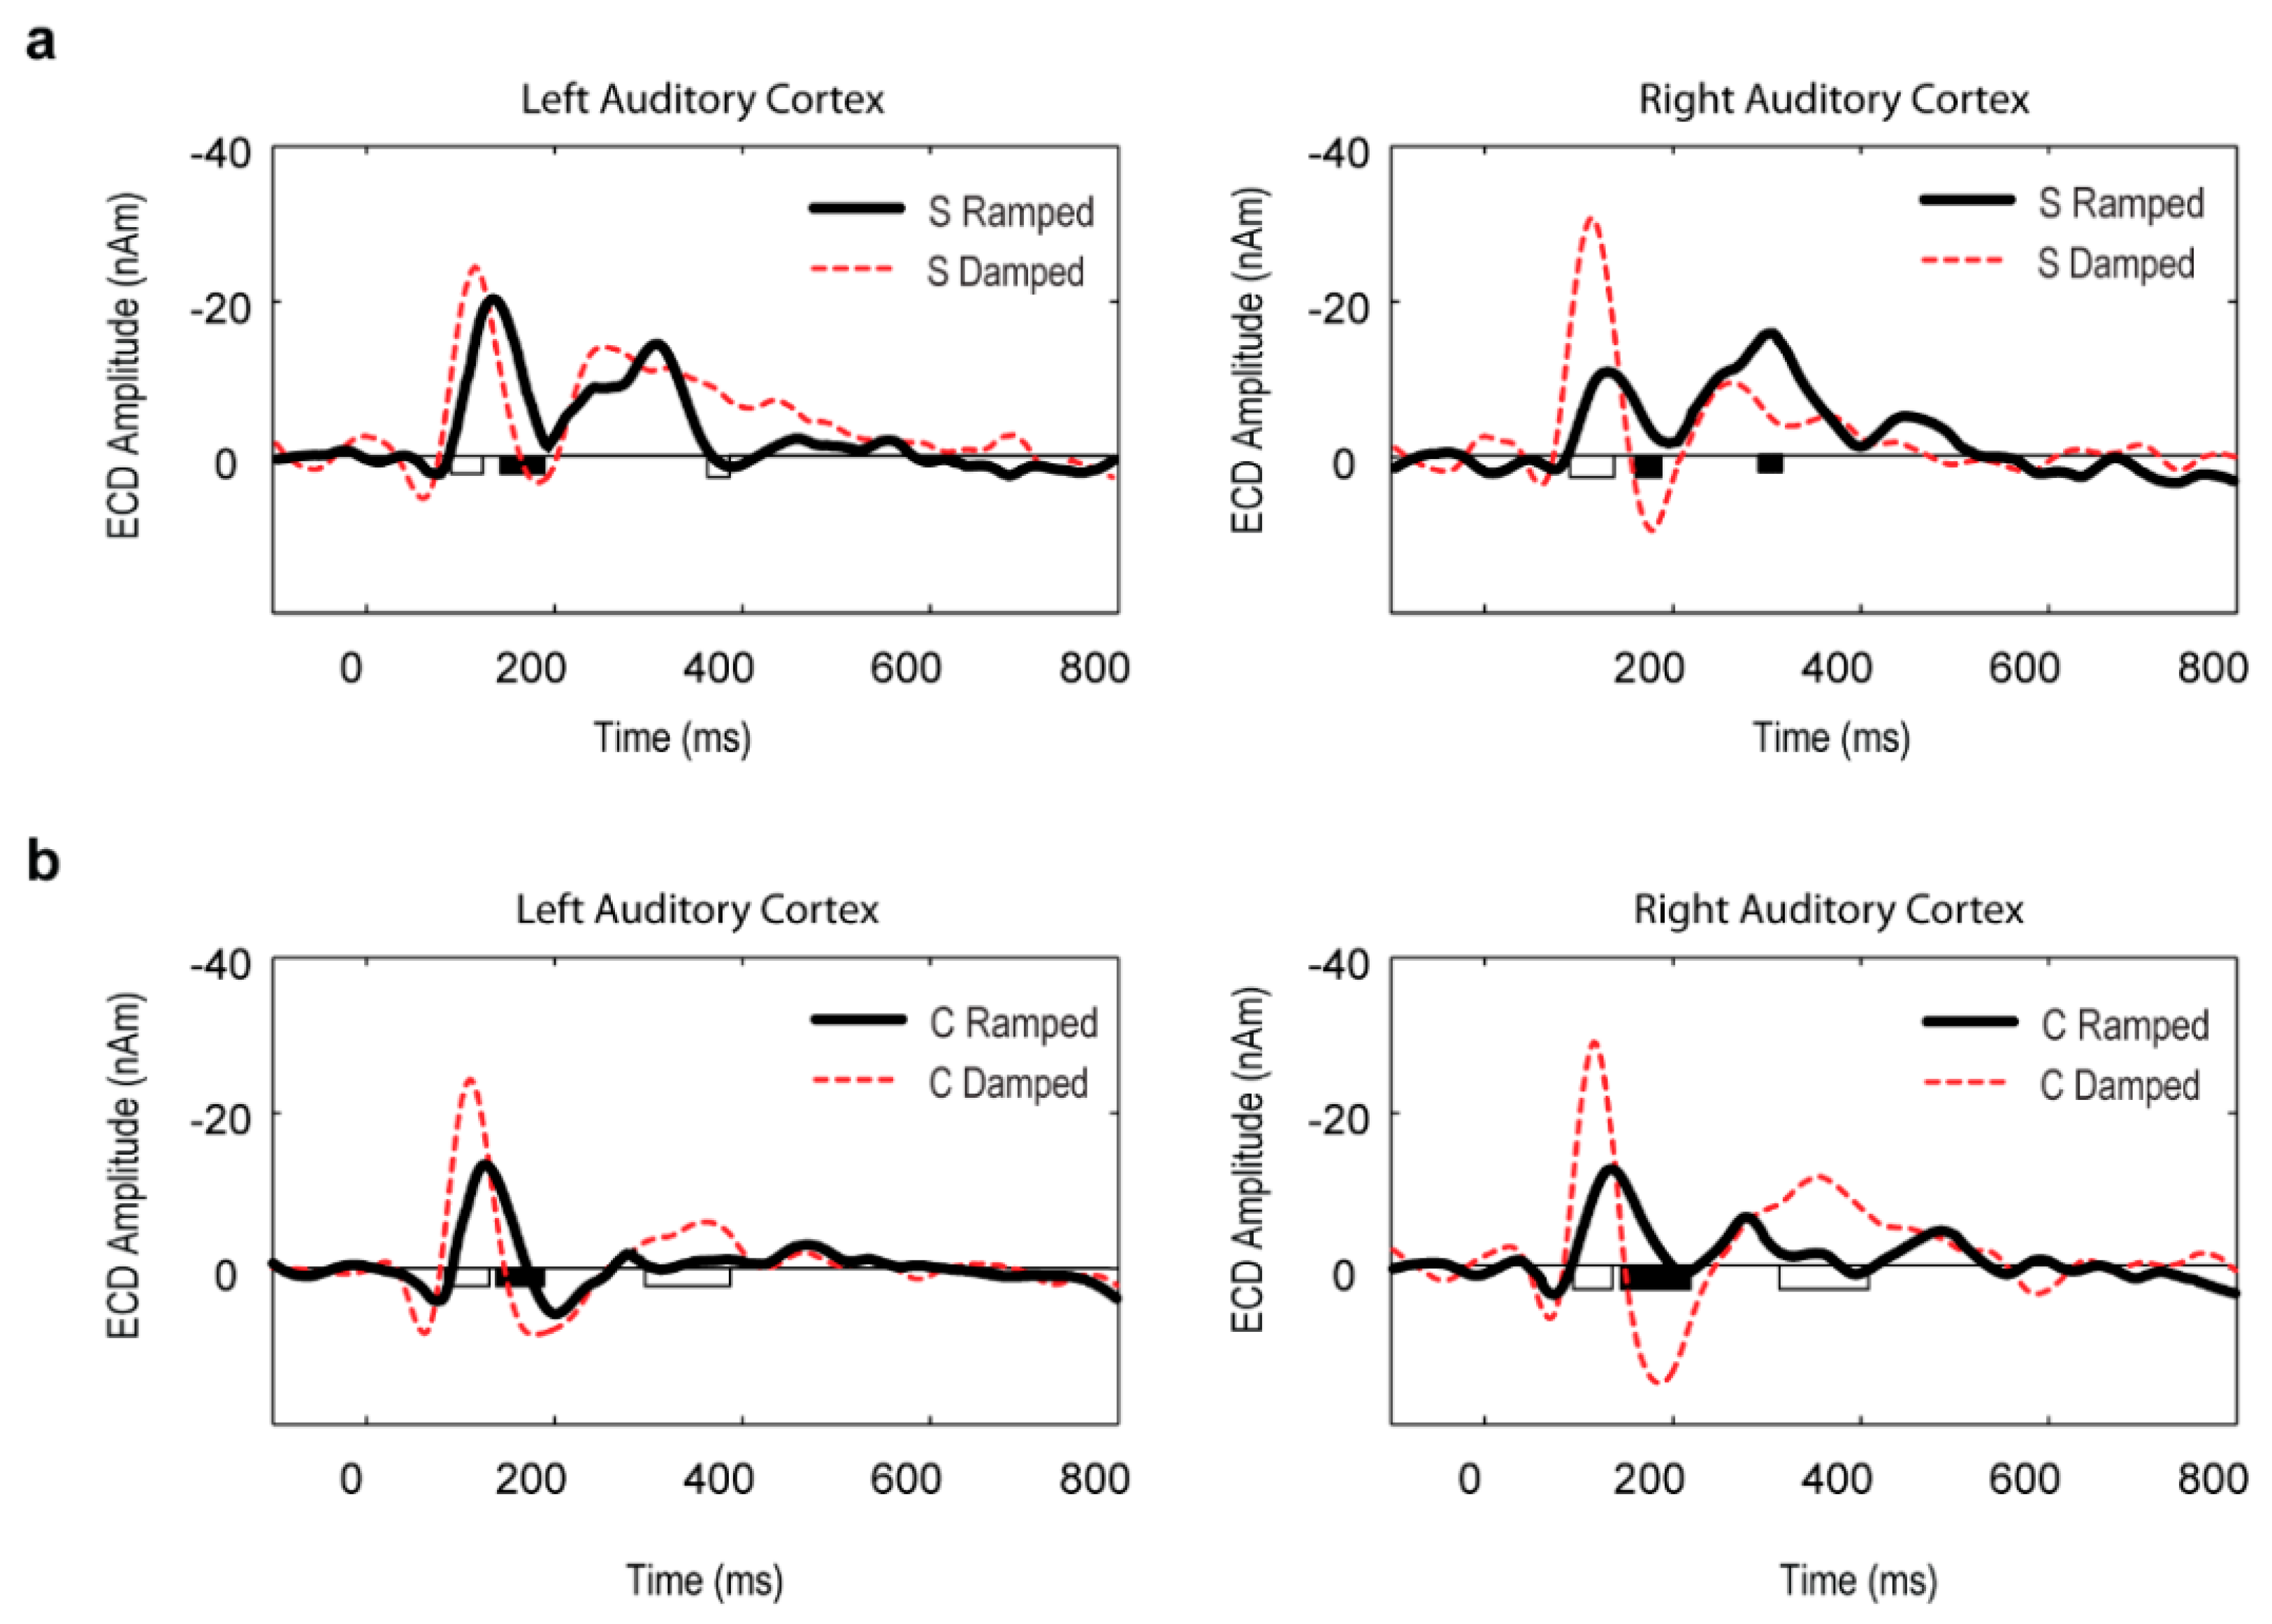
3.3. Point Source Modelling: Equivalent Current Dipole (ECD) Data
3.4. Distributed Source Modelling: Minimum Norm Estimation (MNE) Data
3.5. Percentage Differences in ON and OFF Latencies
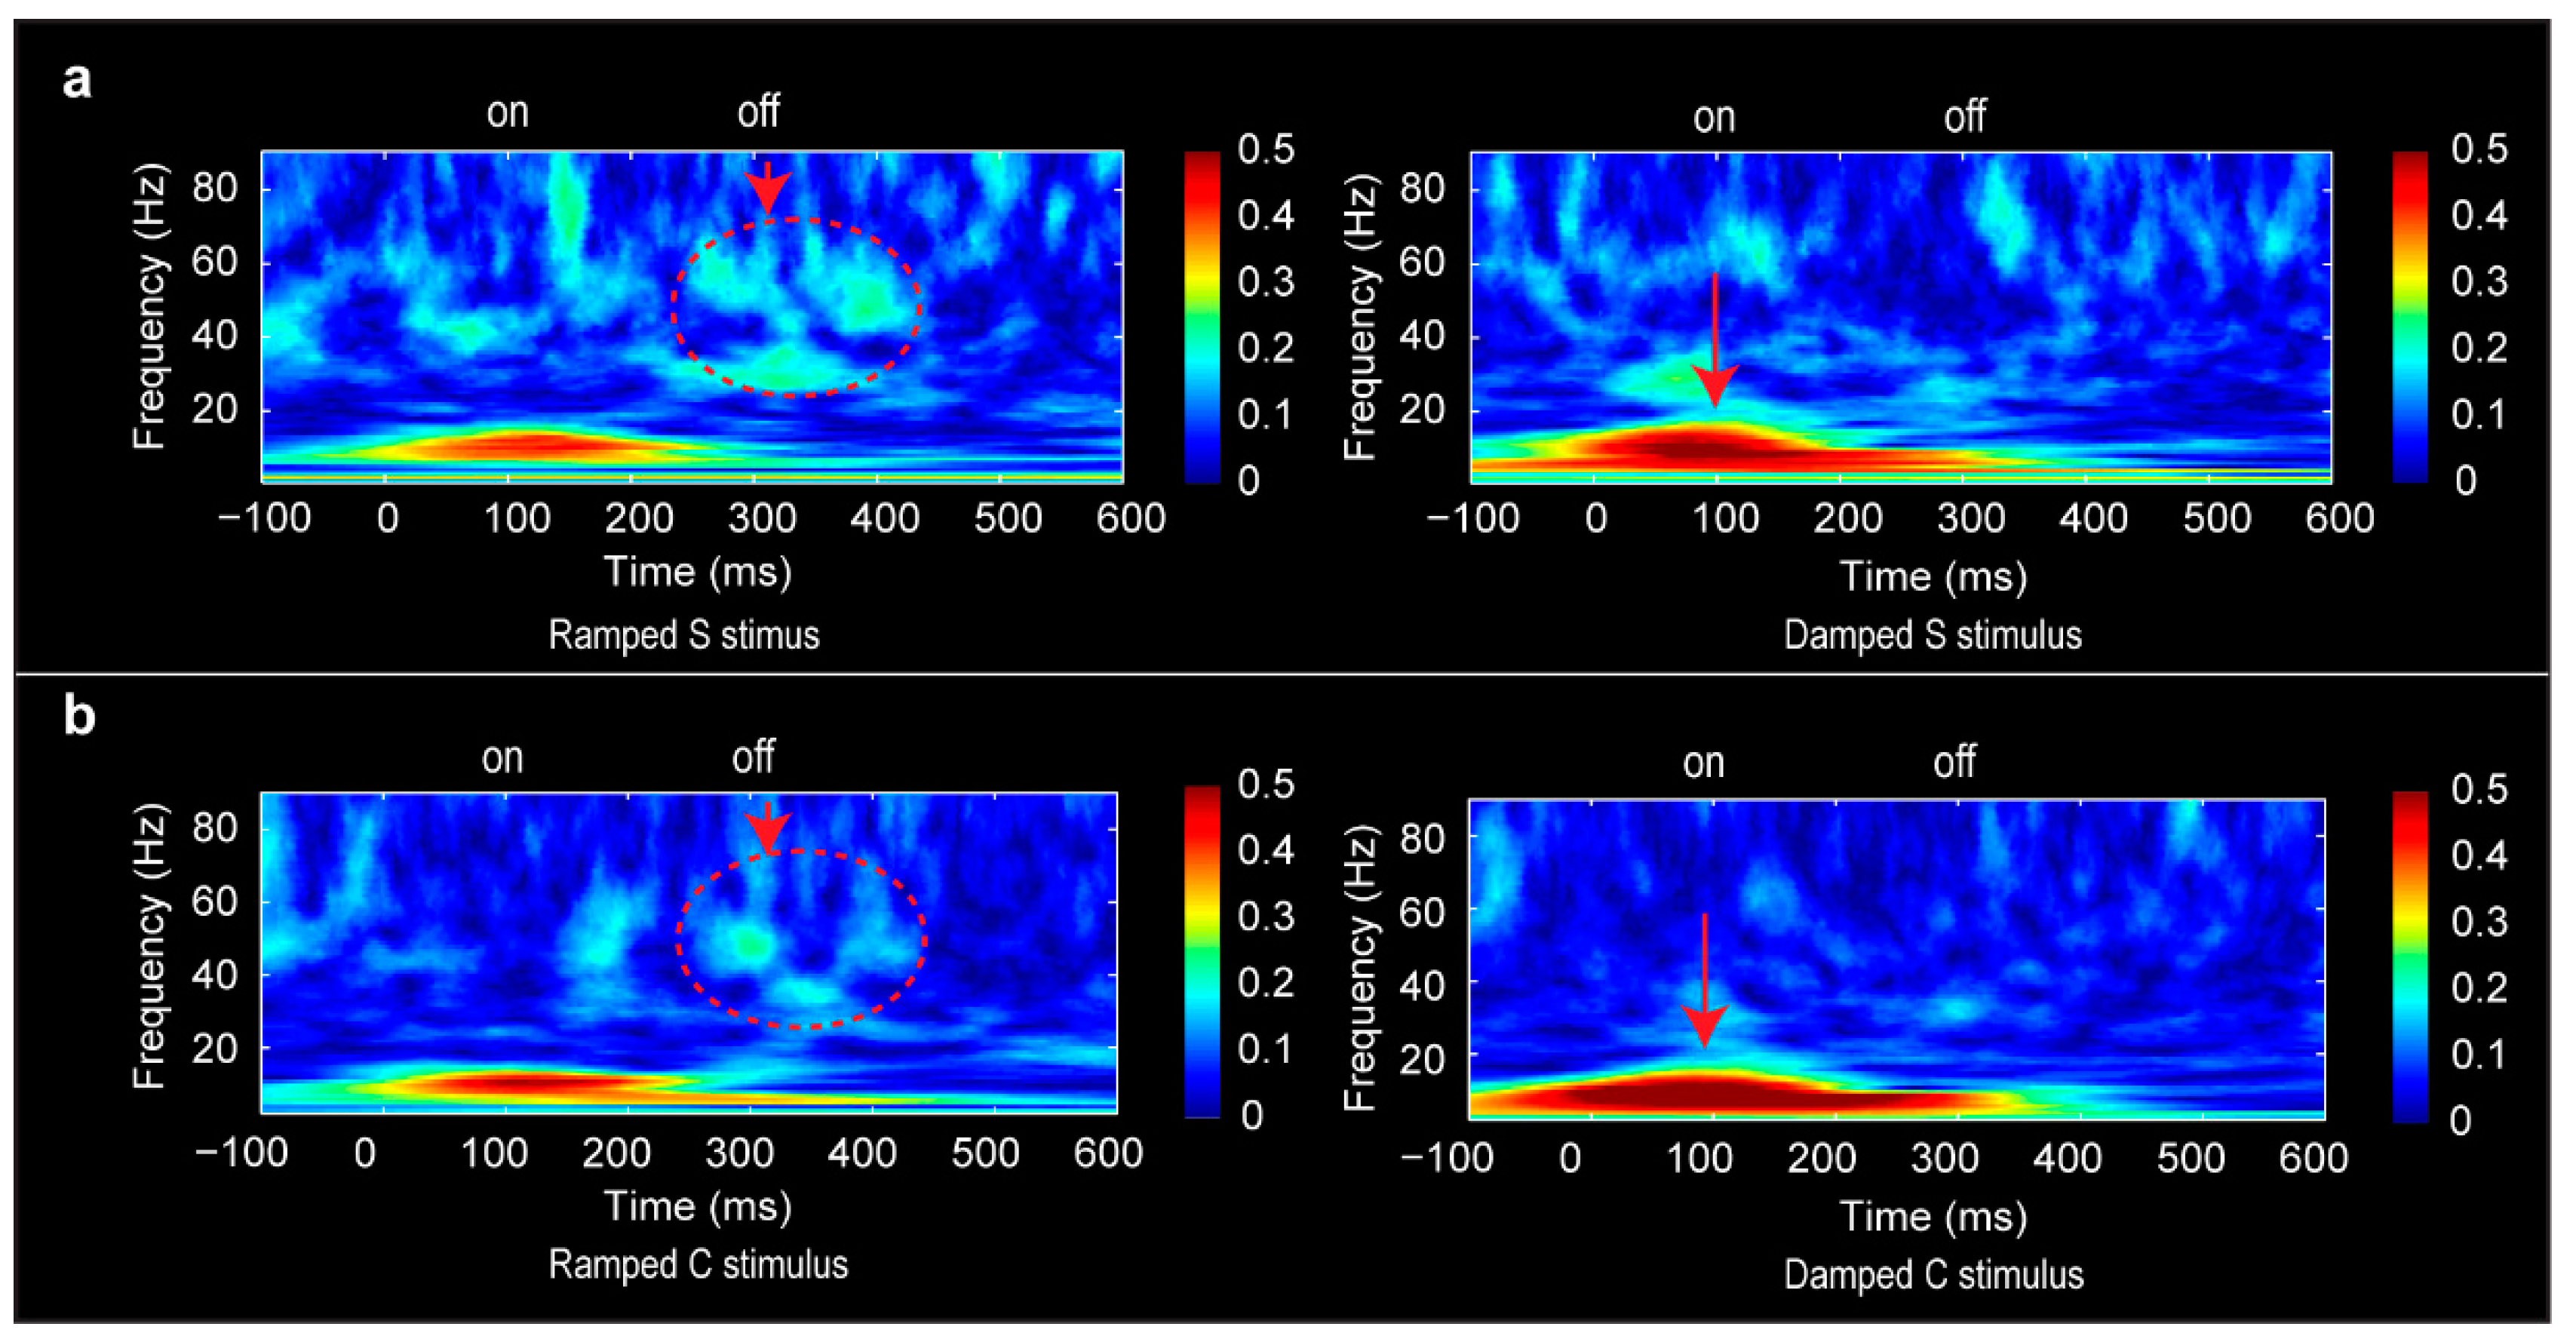
3.6. Phase-Locking Factor Data
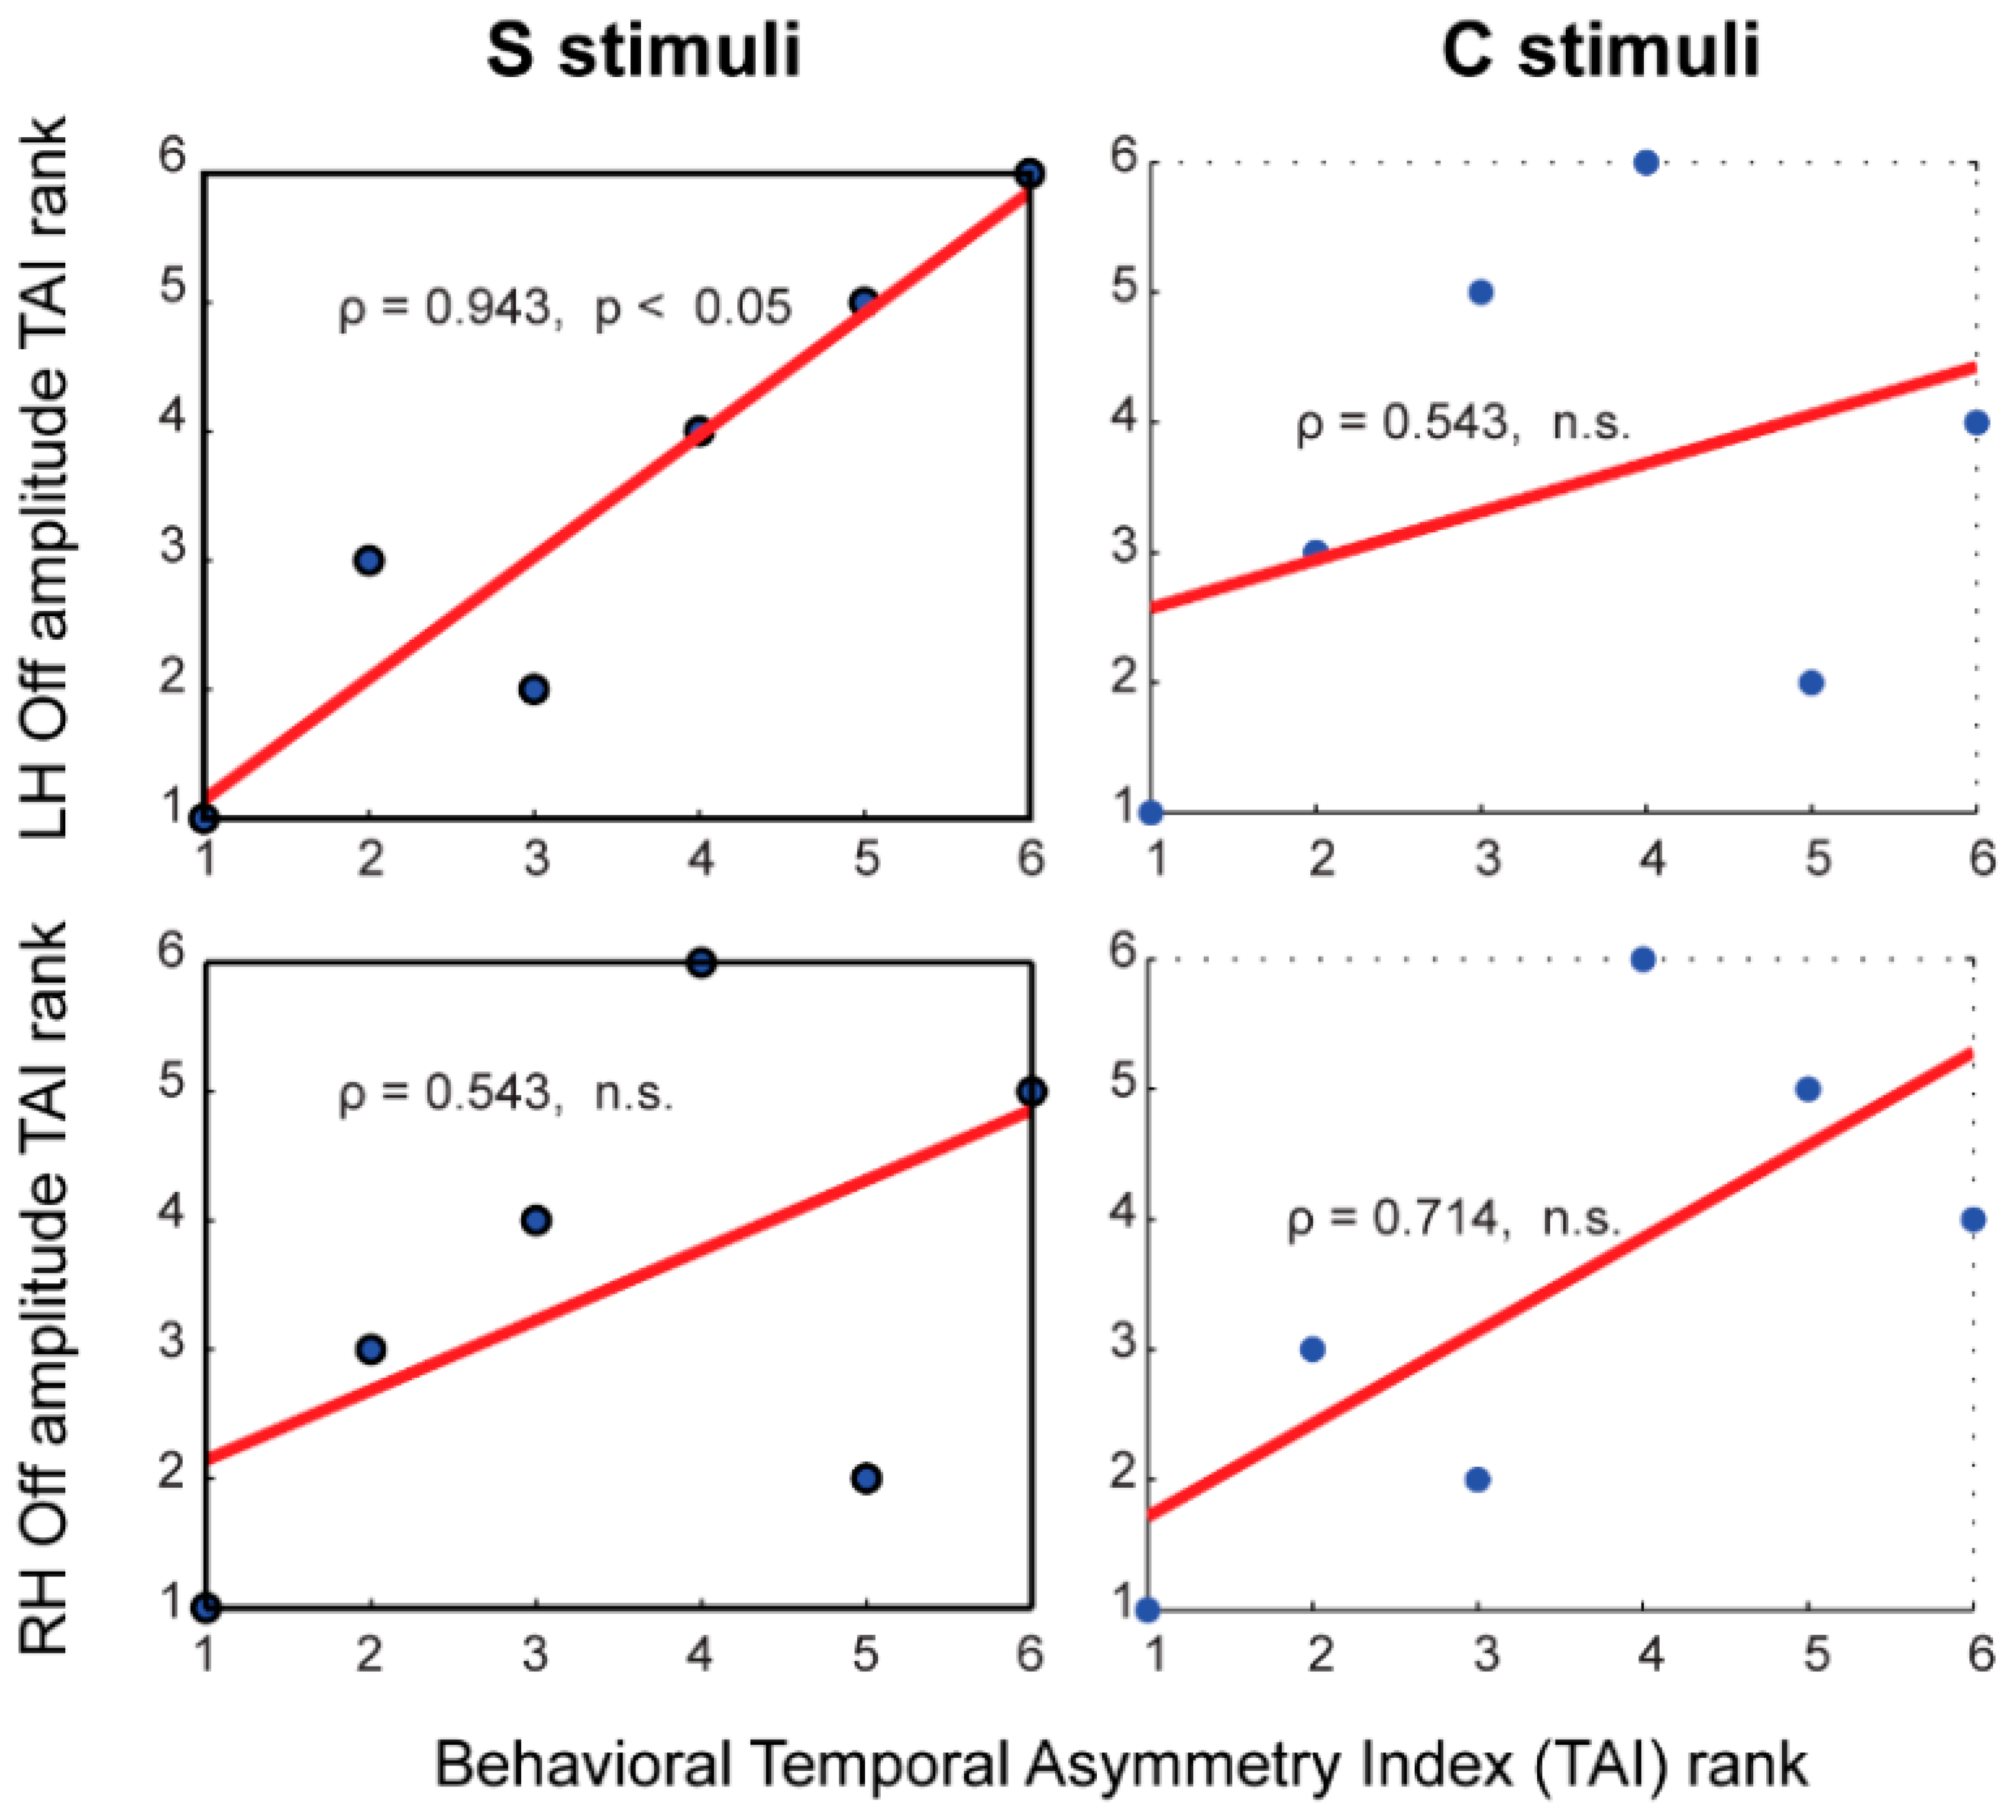
3.7. Brain-Behavior Correlates of Temporal Asymmetry
4. Discussion
4.1. Dominant Auditory ON Response in Favour of Falling Intensity
4.2. Limited Evidence for Dominant Auditory OFF Response in Favor of Rising Intensity
4.3. Source Localization for ON and OFF Responses
4.4. Distinct Neural Oscillations for Rising and Falling Intensities
4.5. Neural Correlates of the Perceptual Temporal Asymmetry
4.6. Limitations and Future Directions
5. Conclusions
Acknowledgments
Author Contributions
Conflicts of Interest
Abbreviations
| MEG: | Magnetoencephalography |
| EEG: | Electroencephalography |
| EOG: | Electro-oculogram |
| ECD: | Equivalent current dipole |
| MNE: | Minimum norm estimation |
| dSPM: | Dynamic Statistical Parametric Mapping |
| PLF: | Phase locking factor |
| LH: | Left hemisphere |
| RH: | Right hemisphere |
| ROI: | Region of interest |
| ST: | Superior temporal |
| IP: | Inferior parietal |
| RMS: | Root mean square |
| TAI: | Temporal asymmetry index |
| MRI: | Magnetic Resonance Imaging |
| fMRI: | Functional Magnetic Resonance Imaging |
| TR: | Repetition time |
| FA: | Flip angle |
| TE: | Echo time |
| NEX: | Number of excitations |
| HPI: | Head position indicator |
| ANOVA: | Analysis of Variance |
| FDR: | False discovery rate |
| ISI: | Inter-stimulus interval |
Appendix
References
- Akeroyd, M.A.; Patterson, R.D. Discrimination of wideband noises modulated by a temporally asymmetric function. J. Acoust. Soc. Am. 1995, 98, 2466–2474. [Google Scholar] [CrossRef]
- Akeroyd, M.A.; Patterson, R.D. A comparison of detection and discrimination of temporal asymmetry in amplitude modulation. J. Acoust. Soc. Am. 1997, 101, 430–439. [Google Scholar] [CrossRef] [PubMed]
- Schlauch, R.S.; Ries, D.T.; DiGiovanni, J.J. Duration discrimination and subjective duration for ramped and damped sounds. J. Acoust. Soc. Am. 2001, 109, 2880–2887. [Google Scholar] [CrossRef] [PubMed]
- Van Wassenhove, V.; Buonomano, D.V.; Shimojo, S.; Shams, L. Distortions of subjective time perception within and across senses. PLoS ONE 2008, 3, e1437. [Google Scholar] [CrossRef] [PubMed]
- Ries, D.T.; Schlauch, R.S.; DiGiovanni, J.J. The role of temporal-masking patterns in the determination of subjective duration and loudness for ramped and damped sounds. J. Acoust. Soc. Am. 2008, 124, 3772–3783. [Google Scholar] [CrossRef] [PubMed]
- Grassi, M.; Darwin, C.J. The subjective duration of ramped and damped sounds. Percept. Psychophys. 2006, 68, 1382–1392. [Google Scholar] [CrossRef] [PubMed]
- DiGiovanni, J.J.; Schlauch, R.S. Mechanisms responsible for differences in perceived duration for rising-intensity and falling-intensity sounds. Ecol. Psychol. 2007, 19, 239–264. [Google Scholar] [CrossRef]
- Stecker, G.C.; Hafter, E.R. An effect of temporal asymmetry on loudness. J. Acoust. Soc. Am. 2000, 107, 3358–3368. [Google Scholar] [CrossRef] [PubMed]
- Canevet, G.; Scharf, B. The loudness of sounds that increase and decrease continuously in level. J. Acoust. Soc. Am. 1990, 88, 2136–2142. [Google Scholar] [CrossRef] [PubMed]
- Neuhoff, J.G. Perceptual bias for rising tones. Nature 1998, 395, 123–124. [Google Scholar] [CrossRef] [PubMed]
- Teghtsoonian, R.; Teghtsoonian, M.; Canevet, G. Sweep-induced acceleration in loudness change and the “bias for rising intensities”. Percept. Psychophys. 2005, 67, 699–712. [Google Scholar] [CrossRef] [PubMed]
- Olsen, K.N.; Stevens, C.J.; Tardieu, J. Loudness change in response to dynamic acoustic intensity. J. Exp. Psychol. Hum. Percept. Perform. 2010, 36, 1631–1644. [Google Scholar] [CrossRef] [PubMed]
- Irino, T.; Patterson, R.D. Temporal asymmetry in the auditory system. J. Acoust. Soc. Am. 1996, 99, 2316–2331. [Google Scholar] [CrossRef] [PubMed]
- Neuhoff, J.G. An adaptive bias in the perception of looming auditory motion. Ecol. Psychol. 2001, 13, 87–110. [Google Scholar] [CrossRef]
- Rosenblum, L.D.; Wuestefeld, A.P.; Saldana, H.M. Auditory looming perception: Influences on anticipatory judgments. Perception 1993, 22, 1467–1482. [Google Scholar] [CrossRef] [PubMed]
- Bach, D.R.; Schachinger, H.; Neuhoff, J.G.; Esposito, F.; Di Salle, F.; Lehmann, C.; Herdener, M.; Scheffler, K.; Seifritz, E. Rising sound intensity: An intrinsic warning cue activating the amygdala. Cereb. Cortex 2008, 18, 145–150. [Google Scholar] [CrossRef] [PubMed]
- Lu, T.; Liang, L.; Wang, X.Q. Neural representations of temporally asymmetric stimuli in the auditory cortex of awake primates. J. Neurophysiol. 2001, 85, 2364–2380. [Google Scholar] [PubMed]
- Wang, X.; Lu, T.; Snider, R.K.; Liang, L. Sustained firing in auditory cortex evoked by preferred stimuli. Nature 2005, 435, 341–346. [Google Scholar] [CrossRef] [PubMed]
- Qin, L.; Chimoto, S.; Sakai, M.; Wang, J.; Sato, Y. Comparison between offset and onset responses of primary auditory cortex on-off neurons in awake aats. J. Neurophysiol. 2007, 97, 3421–3431. [Google Scholar] [CrossRef] [PubMed]
- Wang, J.; Qin, L.; Chimoto, S.; Tazunoki, S.; Sato, Y. Response characteristics of primary auditory cortex neurons underlying perceptual asymmetry of ramped and damped sounds. Neuroscience 2014, 256, 309–321. [Google Scholar] [CrossRef] [PubMed]
- Maier, J.X.; Ghazanfar, A.A. Looming biases in monkey auditory cortex. J. Neurosci. 2007, 27, 4093–4100. [Google Scholar] [CrossRef] [PubMed]
- Toronchuk, J.M.; Stumpf, E.; Cynader, M.S. Auditory cortex neurons sensitive to correlates of auditory motion: Underlying mechanisms. Exp. Brain Res. 1992, 88, 169–180. [Google Scholar] [CrossRef] [PubMed]
- Kuwada, S.; Batra, R. Coding of sound envelopes by inhibitory rebound in neurons of the superior olivary complex in the unanesthetized rabbit. J. Neurosci. 1999, 19, 2273–2287. [Google Scholar] [PubMed]
- Patterson, R.D.; Allerhand, M.H.; Giguere, C. Time-domain modeling of peripheral auditory processing: A modular architecture and a software platform. J. Acoust. Soc. Am. 1995, 98, 1890–1894. [Google Scholar] [CrossRef] [PubMed]
- Phillips, D.P.; Hall, S.E.; Boehnke, S.E. Central auditory onset responses, and temporal asymmetries in auditory perception. Hear. Res. 2002, 167, 192–205. [Google Scholar] [CrossRef]
- Pantev, C.; Eulitz, C.; Hampson, S.; Ross, B.; Roberts, L.E. The auditory evoked “off” response: Sources and comparison with the “on” and the “sustained” responses. Ear Hear. 1996, 17, 255–265. [Google Scholar] [CrossRef] [PubMed]
- Hari, R.; Pelizzone, M.; Makela, J.P.; Hallstrom, J.; Leinonen, L.; Lounasmaa, O.V. Neuromagnetic responses of the human auditory cortex to on- and offsets of noise bursts. Audiology 1987, 26, 31–43. [Google Scholar] [CrossRef] [PubMed]
- Yamashiro, K.; Inui, K.; Otsuru, N.; Kida, T.; Kakigi, R. Automatic auditory off-response in humans: An meg study. Eur. J. Neurosci. 2009, 30, 125–131. [Google Scholar] [CrossRef] [PubMed]
- Nishihara, M.; Inui, K.; Motomura, E.; Otsuru, N.; Ushida, T.; Kakigi, R. Auditory N1 as a change-related automatic response. Neurosci. Res. 2011, 71, 145–148. [Google Scholar] [CrossRef] [PubMed]
- Näätänen, R.; Picton, T. The N1 wave of the human electric and magnetic response to sound—A review and an analysis of the component structure. Psychophysiology 1987, 24, 375–425. [Google Scholar] [CrossRef] [PubMed]
- Hillyard, S.A.; Picton, T.W. On and off components in the auditory evoked potential. Percept. Psychophys. 1978, 24, 391–398. [Google Scholar] [CrossRef] [PubMed]
- Wakai, R.T.; Lutter, W.J.; Chen, M.; Maier, M.M. On and off magnetic auditory evoked responses in early infancy: A possible marker of brain immaturity. Clin. Neurophysiol. 2007, 118, 1480–1487. [Google Scholar] [CrossRef] [PubMed]
- Yamashiro, K.; Inui, K.; Otsuru, N.; Kakigi, R. Change-related responses in the human auditory cortex: An meg study. Psychophysiology 2011, 48, 23–30. [Google Scholar] [CrossRef] [PubMed]
- Hari, R.; Sams, M.; Järvilehto, T. Auditory evoked transient and sustained potentials in the human eeg: I. Effects of expectation of stimuli. Psychiatry Res. 1979, 1, 297–306. [Google Scholar] [CrossRef]
- Noda, K.; Tonoike, M.; Doi, K.; Koizuka, I.; Yamaguchi, M.; Seo, R.; Matsumoto, N.; Noiri, T.; Takeda, N.; Kubo, T. Auditory evoked off-response: Its source distribution is different from that of on-response. Neuroreport 1998, 9, 2621–2625. [Google Scholar] [CrossRef] [PubMed]
- Bendixen, A.; Grimm, S.; Schroger, E. The relation between onset, offset, and duration perception as examined by psychophysical data and event-related brain potentials. J. Psychophysiol. 2006, 20, 40–51. [Google Scholar] [CrossRef]
- Sanders, L.D.; Astheimer, L.B. Temporally selective attention modulates early perceptual processing: Event-related potential evidence. Percept. Psychophys. 2008, 70, 732–742. [Google Scholar] [CrossRef] [PubMed]
- Qin, L.; Liu, Y.C.; Wang, J.Y.; Li, S.N.; Sato, Y. Neural and behavioral discrimination of sound duration by cats. J. Neurosci. 2009, 29, 15650–15659. [Google Scholar] [CrossRef] [PubMed]
- Liegeois-Chauvel, C.; de Graaf, J.B.; Laguitton, V.; Chauvel, P. Specialization of left auditory cortex for speech perception in man depends on temporal coding. Cereb. Cortex 1999, 9, 484–496. [Google Scholar] [CrossRef] [PubMed]
- Kult, A. An Integrated Magnetoencephalographic and Functional Magnetic Resonance Imaging Study on Temporal Asymmetry Processing in the Human Auditory Cortex; The Ruperto-Carola University of Heidelberg: Heidelberg, Germany, 2006. [Google Scholar]
- Tabas, A.; Balaguer-Ballester, E.; Pressnitzer, D.; Siebert, A.; Rupp, A. Hierarchical processing of temporal asymmetry in human auditory cortex. Int. Workshop Pattern 2014, 1–4. [Google Scholar] [CrossRef]
- Tabas, A.; Siebert, A.; Supek, S.; Pressnitzer, D.; Balaguer-Ballester, E.; Rupp, A. Insights on the neuromagnetic representation of temporal asymmetry in human auditory cortex. PLoS ONE 2016, 11, e0153947. [Google Scholar] [CrossRef] [PubMed]
- Biermann, S.; Heil, P. Parallels between timing of onset responses of single neurons in cat and of evoked magnetic fields in human auditory cortex. J. Neurophysiol. 2000, 84, 2426–2439. [Google Scholar] [PubMed]
- Seither-Preisler, A.; Patterson, R.; Krumbholz, K.; Seither, S.; Lutkenhoner, B. Evidence of pitch processing in the N100m component of the auditory evoked field. Hear. Res. 2006, 213, 88–98. [Google Scholar] [CrossRef] [PubMed]
- Kaiser, J.; Ripper, B.; Birbaumer, N.; Lutzenberger, W. Dynamics of gamma-band activity in human magnetoencephalogram during auditory pattern working memory. Neuroimage 2003, 20, 816–827. [Google Scholar] [CrossRef]
- Pantev, C.; Makeig, S.; Hoke, M.; Galambos, R.; Hampson, S.; Gallen, C. Human auditory evoked gamma-band magnetic-fields. Proc. Natl. Acad. Sci. USA 1991, 88, 8996–9000. [Google Scholar] [CrossRef] [PubMed]
- Jensen, O.; Gelfand, J.; Kounios, J.; Lisman, J. Oscillations in the alpha band (9–12 Hz) increase with memory load during retention in a short-term memory task. Cereb. Cortex 2002, 12, 877–882. [Google Scholar] [CrossRef] [PubMed]
- Ahissar, E.; Nagarajan, S.; Ahissar, M.; Protopapas, A.; Mahncke, H.; Merzenich, M.M. Speech comprehension is correlated with temporal response patterns recorded from auditory cortex. Proc. Natl. Acad. Sci. USA 2001, 98, 13367–13372. [Google Scholar] [CrossRef] [PubMed]
- Luo, H.; Poeppel, D. Phase patterns of neuronal responses reliably discriminate speech in human auditory cortex. Neuron 2007, 54, 1001–1010. [Google Scholar] [CrossRef] [PubMed]
- Shahin, A.J.; Trainor, L.J.; Roberts, L.E.; Backer, K.C.; Miller, L.M. Development of auditory phase-locked activity for music sounds. J. Neurophysiol. 2010, 103, 218–229. [Google Scholar] [CrossRef] [PubMed]
- Koerner, T.K.; Zhang, Y. Effects of background noise on inter-trial phase coherence and auditory N1–P2 responses to speech stimuli. Hear. Res. 2015, 328, 113–119. [Google Scholar] [CrossRef] [PubMed]
- Zhang, Y.; Kuhl, P.K.; Imada, T.; Iverson, P.; Pruitt, J.; Stevens, E.; Kawakatsu, M.; Tohkura, Y.; Nemoto, I. Neural signatures of phonetic learning in adulthood: A magnetoencephalography study. Neuroimage 2009, 46, 226–240. [Google Scholar] [CrossRef] [PubMed]
- Zhang, Y.; Kuhl, P.K.; Imada, T.; Kotani, M.; Tohkura, Y. Effects of language experience: Neural commitment to language-specific auditory patterns. Neuroimage 2005, 26, 703–720. [Google Scholar] [CrossRef] [PubMed]
- Rao, A.; Zhang, Y.; Miller, S. Selective listening of concurrent auditory stimuli: An event-related potential study. Hear. Res. 2010, 268, 123–132. [Google Scholar] [CrossRef] [PubMed]
- Nie, Y.; Zhang, Y.; Nelson, P.B. Auditory stream segregation using bandpass noises: Evidence from event-related potentials. Front. Neurosci. 2014, 8, 277. [Google Scholar] [CrossRef] [PubMed]
- Obleser, J.; Scott, S.K.; Eulitz, C. Now you hear it, now you don’t: Transient traces of consonants and their nonspeech analogues in the human brain. Cereb. Cortex 2006, 16, 1069–1076. [Google Scholar] [CrossRef] [PubMed]
- Tervaniemi, M.; Rytkonen, M.; Schroger, E.; Ilmoniemi, R.J.; Näätänen, R. Superior formation of cortical memory traces for melodic patterns in musicians. Learn. Mem. 2001, 8, 295–300. [Google Scholar] [CrossRef] [PubMed]
- Zhang, Y.; Koerner, T.; Miller, S.; Grice-Patil, Z.; Svec, A.; Akbari, D.; Tusler, L.; Carney, E. Neural coding of formant-exaggerated speech in the infant brain. Dev. Sci. 2011, 14, 566–581. [Google Scholar] [CrossRef] [PubMed]
- Zhang, Y.; Zhang, W.; Reynoso Alcántara, V.; Silva-Pereyra, J. Magnetoencephalography: Mapping the spatiotemporal dynamics of neuronal activity. Suma Psicol. 2014, 21, 45–53. [Google Scholar] [CrossRef]
- Lehmann, D.; Skrandies, W. Spatial analysis of evoked potentials in man—A review. Prog. Neurobiol. 1984, 23, 227–250. [Google Scholar] [CrossRef]
- Yamasue, H.; Yamada, H.; Yumoto, M.; Kamio, S.; Kudo, N.; Uetsuki, M.; Abe, O.; Fukuda, R.; Aoki, S.; Ohtomo, K.; et al. Abnormal association between reduced magnetic mismatch field to speech sounds and smaller left planum temporale volume in schizophrenia. Neuroimage 2004, 22, 720–727. [Google Scholar] [CrossRef] [PubMed]
- Carbonell, F.; Galan, L.; Valdes, P.; Worsley, K.; Biscay, R.J.; Diaz-Comas, L.; Bobes, M.A.; Parra, M. Random field-union intersection tests for EEG/MEG imaging. Neuroimage 2004, 22, 268–276. [Google Scholar] [CrossRef] [PubMed]
- Hämäläinen, M.; Hari, R.; Ilmoniemi, R.J.; Knuutila, J.; Lounasmaa, O.V. Magnetoencephalography: Theory, instrumentation, and applications to noninvasive studies of the working human brain. Rev. Mod. Phys. 1993, 65, 413–497. [Google Scholar] [CrossRef]
- Lin, F.H.; Witzel, T.; Ahlfors, S.P.; Stufflebeam, S.M.; Belliveau, J.W.; Hämäläinen, M.S. Assessing and improving the spatial accuracy in MEG source localization by depth-weighted minimum-norm estimates. Neuroimage 2006, 31, 160–171. [Google Scholar] [CrossRef] [PubMed]
- Dale, A.M.; Liu, A.K.; Fischl, B.R.; Buckner, R.L.; Belliveau, J.W.; Lewine, J.D.; Halgren, E. Dynamic statistical parametric mapping: Combining fMRI and MEG for high-resolution imaging of cortical activity. Neuron 2000, 26, 55–67. [Google Scholar] [CrossRef]
- Giard, M.H.; Perrin, F.; Echallier, J.F.; Thevenet, M.; Froment, J.C.; Pernier, J. Dissociation of temporal and frontal components in the human auditory N1 wave—A scalp current-density and dipole model analysis. Electroen. Clin. Neuro. 1994, 92, 238–252. [Google Scholar] [CrossRef]
- Godey, B.; Schwartz, D.; de Graaf, J.B.; Chauvel, P.; Liegeois-Chauvel, C. Neuromagnetic source localization of auditory evoked fields and intracerebral evoked potentials: A comparison of data in the same patients. Clin. Neurophysiol. 2001, 112, 1850–1859. [Google Scholar] [CrossRef]
- Zouridakis, G.; Simos, P.G.; Papanicolaou, A.C. Multiple bilaterally asymmetric cortical sources account for the auditory N1m component. Brain Topogr. 1998, 10, 183–189. [Google Scholar] [CrossRef] [PubMed]
- Sinai, A.; Crone, N.E.; Wied, H.M.; Franaszczuk, P.J.; Miglioretti, D.; Boatman-Reich, D. Intracranial mapping of auditory perception: Event-related responses and electrocortical stimulation. Clin. Neurophysiol. Off. J. Int. Fed. Clin. Neurophysiol. 2009, 120, 140–149. [Google Scholar] [CrossRef] [PubMed]
- Jensen, O.; Hesse, C. Estimating distributed representation of evoked responses and oscillatory brain activity. In MEG: An Introduction to Methods; Hansen, P., Kringelbach, M., Salmelin, R., Eds.; Oxford University Press: New York, USA, 2010; pp. 156–185. [Google Scholar]
- Lachaux, J.P.; Rodriguez, E.; Martinerie, J.; Varela, F.J. Measuring phase synchrony in brain signals. Hum. Brain Mapp. 1999, 8, 194–208. [Google Scholar] [CrossRef]
- Tallon-Baudry, C.; Bertrand, O.; Delpuech, C.; Pernier, J. Stimulus specificity of phase-locked and non-phase-locked 40 Hz visual responses in humans. J. Neurosci. 1996, 16, 4240–4249. [Google Scholar] [PubMed]
- Macmillan, N.A.; Creelman, C.D. Detection Theory: A User’s Guide; Cambridge University Press: Cambridge, UK, 1991. [Google Scholar]
- Stoppel, C.M.; Boehler, C.N.; Strumpf, H.; Krebs, R.M.; Heinze, H.J.; Hopf, J.M.; Schoenfeld, M.A. Spatiotemporal dynamics of feature-based attention spread: Evidence from combined electroencephalographic and magnetoencephalographic recordings. J. Neurosci. 2012, 32, 9671–9676. [Google Scholar] [CrossRef] [PubMed]
- Guthrie, D.; Buchwald, J.S. Significance testing of difference potentials. Psychophysiology 1991, 28, 240–244. [Google Scholar] [CrossRef] [PubMed]
- Seghier, M.L. Laterality index in functional MRI: Methodological issues. Magn. Reson. Imaging 2008, 26, 594–601. [Google Scholar] [CrossRef] [PubMed]
- Rousselet, G.A.; Pernet, C.R. Improving standards in brain-behavior correlation analyses. Front. Hum. Neurosci. 2012, 6, 119. [Google Scholar] [CrossRef] [PubMed]
- Pernet, C.R.; Wilcox, R.R.; Rousselet, G.A. Robust correlation analyses: False positive and power validation using a new open source matlab toolbox. Front. Psychol. 2013, 3, 606. [Google Scholar] [CrossRef] [PubMed]
- Benjamini, Y.; Hochberg, Y. Controlling the false discovery rate—A practical and powerful approach to multiple testing. J. R. Stat. Soc. B 1995, 57, 289–300. [Google Scholar]
- Tiitinen, H.; Makinen, V.T.; Kicic, D.; May, P.J.C. Averaged and single-trial brain responses in the assessment of human sound detection. Neuroreport 2005, 16, 545–548. [Google Scholar] [CrossRef] [PubMed]
- Seifritz, E.; Neuhoff, J.G.; Bilecen, D.; Scheffler, K.; Mustovic, H.; Schächinger, H.; Elefante, R.; Di Salle, F. Neural processing of auditory looming in the human brain. Curr. Biol. 2002, 12, 2147–2151. [Google Scholar] [CrossRef]
- He, J. On and off pathways segregated at the auditory thalamus of the guinea pig. J. Neurosci. 2001, 21, 8672–8679. [Google Scholar] [PubMed]
- He, J. Corticofugal modulation on both on and off responses in the nonlemniscal auditory thalamus of the guinea pig. J. Neurophysiol. 2003, 89, 367–381. [Google Scholar] [CrossRef] [PubMed]
- Klimesch, W. Alpha-band oscillations, attention, and controlled access to stored information. Trends Cognit. Sci. 2012, 16, 606–617. [Google Scholar] [CrossRef] [PubMed]
- Scholl, B.; Gao, X.; Wehr, M. Nonoverlapping sets of synapses drive on responses and off responses in auditory cortex. Neuron 2010, 65, 412–421. [Google Scholar] [CrossRef] [PubMed]
- Swettenham, J.B.; Muthukumaraswamy, S.D.; Singh, K.D. Spectral properties of induced and evoked gamma oscillations in human early visual cortex to moving and stationary stimuli. J. Neurophysiol. 2009, 102, 1241–1253. [Google Scholar] [CrossRef] [PubMed]
- Fujioka, T.; Trainor, L.J.; Large, E.W.; Ross, B. Beta and gamma rhythms in human auditory cortex during musical beat processing. Ann. N. Y. Acad. Sci. 2009, 1169, 89–92. [Google Scholar] [CrossRef] [PubMed]
- Stefanics, G.; Hangya, B.; Hernadi, I.; Winkler, I.; Lakatos, P.; Ulbert, I. Phase entrainment of human delta oscillations can mediate the effects of expectation on reaction speed. J. Neurosci. 2010, 30, 13578–13585. [Google Scholar] [CrossRef] [PubMed]
- Molholm, S.; Martinez, A.; Ritter, W.; Javitt, D.C.; Foxe, J.J. The neural circuitry of pre-attentive auditory change-detection: An fMRI study of pitch and duration mismatch negativity generators. Cereb. Cortex 2005, 15, 545–551. [Google Scholar] [CrossRef] [PubMed]
- Kodera, K.; Hink, R.F.; Yamada, O.; Suzuki, J.I. Effects of rise time on simultaneously recorded auditory-evoked potentials from the early, middle and late ranges. Audiology 1979, 18, 395–402. [Google Scholar] [CrossRef] [PubMed]
- Thomson, J.M.; Goswami, U.; Badeweg, T. The ERP signature of sound rise time changes. Brain Res. 2009, 1254, 74–83. [Google Scholar] [CrossRef] [PubMed]
- Mantani, M.; Nakagawa, S.; Kotani, K.; Horii, K. Effects of rise-time of sound stimulus on auditory evoked magnetic fields. Trans. Jpn. Soc. Med. Biol. Eng. 2007, 45, 114–120. [Google Scholar]
- Rupp, A.; Spachmann, A.; Dettlaff, A.; Patterson, R.D. Cortical activity associated with the perception of temporal asymmetry in ramped and damped noises. In Basic Aspects of Hearing. Advances in Experimental Medicine and Biology; Moore, B.C.J., Patterson, R.D., Winter, I.M., Carlyon, R.P., Gockel, H.E., Eds.; Springer: New York, NY, USA, 2013; Volume 787, pp. 427–433. [Google Scholar]
- Escabi, M.A.; Miller, L.M.; Read, H.L.; Schreiner, C.E. Naturalistic auditory contrast improves spectrotemporal coding in the cat inferior colliculus. J. Neurosci. 2003, 23, 11489–11504. [Google Scholar] [PubMed]
- Baltzell, L.S.; Billings, C.J. Sensitivity of offset and onset cortical auditory evoked potentials to signals in noise. Clin. Neurophysiol. Off. J. Int. Fed. Clin. Neurophysiol. 2014, 125, 370–380. [Google Scholar] [CrossRef] [PubMed]
- Virtanen, J.; Ahveninen, J.; Ilmoniemi, R.J.; Naatanen, R.; Pekkonen, E. Replicability of MEG and EEG measures of the auditory N1/N1m-response. Electroencephalogr. Clin. Neurophysiol. 1998, 108, 291–298. [Google Scholar] [CrossRef]
- Näätänen, R. Selective attention and evoked potentials in humans—A critical review. Biol. Psychol. 1975, 2, 237–307. [Google Scholar] [CrossRef]
- Alho, K. Selective attention in auditory processing as reflected by event-related brain potentials. Psychophysiology 1992, 29, 247–263. [Google Scholar] [CrossRef] [PubMed]
- Maier, J.X.; Chandrasekaran, C.; Ghazanfar, A.A. Integration of bimodal looming signals through neuronal coherence in the temporal lobe. Curr. Biol. 2008, 18, 963–968. [Google Scholar] [CrossRef] [PubMed]
- Ghazanfar, A.A.; Neuhoff, J.G.; Logothetis, N.K. Auditory looming perception in rhesus monkeys. Proc. Natl. Acad. Sci. USA 2002, 99, 15755–15757. [Google Scholar] [CrossRef] [PubMed]
- Grassi, M. Sex difference in subjective duration of looming and receding sounds. Perception 2010, 39, 1424–1426. [Google Scholar] [CrossRef] [PubMed]
- Neuhoff, J.G.; Planisek, R.; Seifritz, E. Adaptive sex differences in auditory motion perception: Looming sounds are special. J. Exp. Psychol. Hum. 2009, 35, 225–234. [Google Scholar] [CrossRef] [PubMed]
- Bach, D.R.; Buxtorf, K.; Strik, W.K.; Neuhoff, J.G.; Seifritz, E. Evidence for impaired sound intensity processing in schizophrenia. Schizophr. Bull. 2011, 37, 426–431. [Google Scholar] [CrossRef] [PubMed]
- Hämäläinen, J.A.; Leppanen, P.H.T.; Guttorm, T.K.; Lyytinen, H. Event-related potentials to pitch and rise time change in children with reading disabilities and typically reading children. Clin. Neurophysiol. 2008, 119, 100–115. [Google Scholar] [CrossRef] [PubMed]
- Cheng, B.; Zhang, Y. Syllable structure universals and native language interference in second language perception and production: Positional asymmetry and perceptual links to accentedness. Front. Psychol. 2015, 6, 1801. [Google Scholar] [CrossRef] [PubMed]
- Schiff, W.; Caviness, J.A.; Gibson, J.J. Persistent fear responses in rhesus monkeys to the optical stimulus of “looming”. Science 1962, 136, 982–983. [Google Scholar] [CrossRef] [PubMed]
- Cappe, C.; Thut, G.; Romei, V.; Murray, M.M. Selective integration of auditory-visual looming cues by humans. Neuropsychologia 2009, 47, 1045–1052. [Google Scholar] [CrossRef] [PubMed]
- Romei, V.; Murray, M.M.; Cappe, C.; Thut, G. Preperceptual and stimulus-selective enhancement of low-level human visual cortex excitability by sounds. Curr. Biol. 2009, 19, 1799–1805. [Google Scholar] [CrossRef] [PubMed]


| Brain Measures | S Stimuli | C STIMULI | |||
|---|---|---|---|---|---|
| ON Response | OFF Response | ON Response | OFF Response | ||
| ECD | Amplitude (LH) | ρ = 0.429 | ρ = 0.943 * | ρ = 0.257 | ρ = 0.371 |
| Latency (LH) | ρ = −0.551 | ρ = 0.086 | ρ = 0.714 | ρ = −0.086 | |
| Amplitude (RH) | ρ = 0.143 | ρ = 0.543 | ρ = 0.371 | ρ = 0.714 | |
| Latency (RH) | ρ = −0.577 | ρ = −0.086 | ρ = 0.377 | ρ = −0.029 | |
| MNE | Amplitude (LH) | ρ = 0.257 | ρ = 0.829 * | ρ = 0.200 | ρ = 0.086 |
| Latency (LH) | ρ = 0.200 | ρ = 0.600 | ρ = 0.489 | ρ = 0.200 | |
| Amplitude (RH) | ρ = 0.657 | ρ = 0.714 | ρ = 0.257 | ρ = 0.486 | |
| Latency (RH) | ρ = 0.029 | ρ = 0.493 | ρ = 0.086 | ρ = 0.543 | |
© 2016 by the authors; licensee MDPI, Basel, Switzerland. This article is an open access article distributed under the terms and conditions of the Creative Commons Attribution (CC-BY) license (http://creativecommons.org/licenses/by/4.0/).
Share and Cite
Zhang, Y.; Cheng, B.; Koerner, T.K.; Schlauch, R.S.; Tanaka, K.; Kawakatsu, M.; Nemoto, I.; Imada, T. Perceptual Temporal Asymmetry Associated with Distinct ON and OFF Responses to Time-Varying Sounds with Rising versus Falling Intensity: A Magnetoencephalography Study. Brain Sci. 2016, 6, 27. https://doi.org/10.3390/brainsci6030027
Zhang Y, Cheng B, Koerner TK, Schlauch RS, Tanaka K, Kawakatsu M, Nemoto I, Imada T. Perceptual Temporal Asymmetry Associated with Distinct ON and OFF Responses to Time-Varying Sounds with Rising versus Falling Intensity: A Magnetoencephalography Study. Brain Sciences. 2016; 6(3):27. https://doi.org/10.3390/brainsci6030027
Chicago/Turabian StyleZhang, Yang, Bing Cheng, Tess K. Koerner, Robert S. Schlauch, Keita Tanaka, Masaki Kawakatsu, Iku Nemoto, and Toshiaki Imada. 2016. "Perceptual Temporal Asymmetry Associated with Distinct ON and OFF Responses to Time-Varying Sounds with Rising versus Falling Intensity: A Magnetoencephalography Study" Brain Sciences 6, no. 3: 27. https://doi.org/10.3390/brainsci6030027
APA StyleZhang, Y., Cheng, B., Koerner, T. K., Schlauch, R. S., Tanaka, K., Kawakatsu, M., Nemoto, I., & Imada, T. (2016). Perceptual Temporal Asymmetry Associated with Distinct ON and OFF Responses to Time-Varying Sounds with Rising versus Falling Intensity: A Magnetoencephalography Study. Brain Sciences, 6(3), 27. https://doi.org/10.3390/brainsci6030027