Automatic Association of Scents Based on Visual Content


1
Computer Science Department, King Abdulaziz University, Jeddah 21589, Saudi Arabia
2
Information Technology Department, King Abdulaziz University, Jeddah 21589, Saudi Arabia
*
Authors to whom correspondence should be addressed.
Appl. Sci. 2019, 9(8), 1697; https://doi.org/10.3390/app9081697
Submission received: 6 April 2019
/
Revised: 17 April 2019
/
Accepted: 19 April 2019
/
Published: 24 April 2019
(This article belongs to the Special Issue Augmented Reality: Current Trends, Challenges and Prospects)
Abstract
:Although olfaction can enhance the user’s experience in virtual environments, the approach is not widely utilized by virtual contents. This is because the olfaction displays are either not aware of the content in the virtual world or they are application specific. Enabling wide context awareness is possible through the use of image recognition via machine learning. Screenshots from the virtual worlds can be analyzed for the presence of virtual scent emitters, allowing the olfactory display to respond by generating the corresponding smells. The Convolutional Neural Network (CNN), using Inception Model for image recognition was used for training the system. To evaluate the performance of the accuracy of the model, we trained it on a computer game called Minecraft. The results and performance of the model was 97% accurate, while in some cases the accuracy reached 99%.
1. Introduction
Virtual environment is defined as the awareness of the environments’ contents by using synthetic sensory information as if they were not synthetic [1]. Feeling immersed in this type of environment requires the user to be in a psychological state that he/she feels included in the environment.
Many researchers aimed to enhance the immersive experience for the users of virtual environments by attempting to mimic the real environment. Since we perceive our surrounding by our senses in the real environment, the absence of any sense will affect our engagement in the environment. The same thing can be generalized in the virtual environment. A player’s presence will be increased by increasing the senses that will be active during the experiment [2]. Thus tactile, olfactory, audio and visual sensory cues will result in stimulating the senses from the real environment and also give the user a strong sense of presence in the virtual environment [3].
However, among the sensory cues, olfactory is the less used to enrich experience of the virtual environment for the users [4]. It is mainly due to the slow advancement especially in emitting the scents when needed, and hence failing to integrate the smells with many software applications [5]. Moreover, the absence of a simple and robust device that can emit the scents hinders using smell compared with the visual and auditory sensory modalities [6]. The device which is responsible for delivering the scents to the user during such experiments is called olfactory display. Olfactory devices are controlled by a computer that delivers odorants to the human olfactory organ [7]. Very few are commercial olfactory displays and are mainly used in cinema movies such as Olorama [8].
In literature, several olfactory displays were produced releasing scents in the set time. It is a method that works well if we know the type of scents the user will come across such as in the movies. One major issue of this approach is that in the virtual environment such as games or virtual reality applications, it is hard to predict where the player will decide to go or do next, hence what type of scent should be released. Nonetheless, it is possible to further improve the timing of the release of the scents by associating it with the contents of the virtual environment. To the best of our knowledge, no previous attempt or study has fully accomplished and implemented a content aware solution, that can be generalized. With this goal, the work seeks to develop an olfactory display with the use of Inception-V3 model as an approach used in deep learning for image recognition and to release the corresponding scents. The data used in the study is the Minecraft computer game [9].
The main objective of the study is to propose a new approach for associating scents with visual content of the virtual environment. The findings should make an important contribution in the field of virtual reality that can potentially offer a more immersive experience. Additionally, this work contributes to artificial intelligence by showing that the use of pre-trained model such as the Inception model can be used to solve such multilabel classification problems without the need to develop and train a new CNN from scratch.
This paper has been divided into four parts. The first part is a literature review to show different types of olfactory displays. The second part covers the methods and materials that describe the system design. The third part presents the result and discussion while the last part is the conclusion and future work.
2. Literature Review
According to the literature, there are two main types of olfactory displays: Wearable and devices placed in environment. The wearable devices are attached on the user’s body or head [10]. This type of displays ensures the delivery of scents to the user but it has the drawback that the user is aware of the device, which can cause discomfort and therefore, the experience may not be as immersed as it should be. On the other hand, utilizing olfactory displays that are placed in the environment is not disturbing the user, since the user does not have to wear any hardware. However, a key limitation in this type of olfactory devices is that the scent may not reach the user, especially if it is placed far from the user or due to the weakness of the scent resulting from the air movement.
Each type is subdivided into different categories. The external devices also known as “placed in environment” are divided based on the scent generation technique that is used in the air canon, natural vaporization and air flow. While the wearable devices are divided according to their placement on the user to either “body” or “head mounted”.
The paper in [11] introduces an olfactory display called inScent. A wearable device worn as necklace, it emits different scents upon receiving a mobile notification known as scentification in which scents are used for delivering information. The scents are emitted automatically based on different scenarios either through a predefined name or the contents of a message or may be based on the timing as in calendar events. Scents are chosen on behalf of the user’s preference, thus the cartridge can be exchanged. To generate and control the amount of scents to be produced, they use heating followed by fans’ air for delivering to the user. Heating of a wearable device can be risky and also the fan produces a loud sound that can cause discomfort for the user.
Recently, several researchers focused on designing a fashionable wearable device known as Essence [12]. They are developing a lightweight necklace-shape olfactory comfortable enough to be worn on a daily basis and controlled wirelessly via an Android application. The device can either release scent manually in which the user pulls down the string that will send data for the release of the scent or may be receiving some data from the Smartphone such as location and time. They also release the scent based on the heart rate, brain activity or electro dermal activity. The device can be controlled by someone to release the scent. However, the device can only release one scent thus it is not practical to have one scent that will be released according to the user’s circumstances.
Smelling Screen device in [13] can generate scent, based on the image shown in the Liquid Crystal Display (LCD), or by placing four fans on the corners of the screen indicating the image position in the screen resulting from the airflow of these fans. These devices did not operate with games, applications, or a movie but rather on random images which were shown on different corners of the screen.
An inexpensive olfactory display has been developed in [14]. The device uses the Arduino Uno microcontroller as it is economical and capable of controlling the olfactory display. They also used fans to generate the airflow for scent delivery. The device was tested in different experiments involving games, advertising and procedural memories. For gaming, they used the Unity-based Tuscany. They had to modify the environment by adding a bowl of oranges that released the scent once the player came near it. However, this approach is not generic as most games are not designed to support olfactory displays. The researchers also developed their own application, presented in [15].
Researchers in [16] present an olfactory display that is simple, economical and capable of releasing 8 scents based on timed events. The scent is generated by a heating process to vaporize the essential oils and water that is used to clean the air from the previous scents. Along with the olfactory display, they also created the software that will be used to select the list of scents, control the speed of the fans and the intensity of aromas. However, the heating process is time consuming until the scent is released based on their experiments. It takes 6 s thus it is not an instant release of the scents.
Olfactory displays were used in many studies regarding synchronizing movie with scents. The commercial olfactory display known as “The Vortex Active” was used in research [16] that aims to synchronize a movie clip with some specific scents. The synchronization based olfactory display releases scents on time. The device is installed in the environment and uses fans to deliver the scents for the users. The device is capable of releasing up to four scents at a time. It is connected to the computer via USB in order to set the timing of the scent releasing.
The study in [17] uses an olfactory display called Exhalia SBi4. The research used six scents based on the chosen movie clips and synchronized the scents with them. The device used fans to deliver the scents for the users and could release up to four scents at a given time.
Another work done in [5] was supposed to alter the contents of the film with the addition of the subtitle, which is a logo with different colors and was used to release the scents. The researchers made an olfactory display called Sub Smell. The system used different colors in every scene and when the movie was played, the machine identified the logo and analyzed the color with the release of the corresponding scent.
In [18], the authors developed a device for research purposes. The device is controlled by Arduino, and has three servo motors to press the jars of scents after sending the command through a wire connection from the Arduino. The advantage of this device is that due to its innovative design, each servo can press release two scents. Additionally, the device can be easily expanded. The device utilized fans to spread the scent but also to absorb when it should not be present. They developed two applications that use their device. One C# based application that utilizes timers to release scents and a unity Asset that allows games that use it to release scents when the player was in a certain area. Even though this device has the advantage of being low cost, like the other olfactory devices, the releasing of scents depends on the specific time or game, which is a problem we overcame with the proposed approach.
The literature shows that the existing olfactory displays are not used in the games or VR application due to difficulties in identifying the order of the scents. Few olfactory displays used in games depend on creating a game for the device and by setting the objects, a player might collide with and use them to release the scents. Table 1 below shows a comparison of the different olfactory displays covered in the literature.
3. Materials and Methods
3.1. System Description
A system consisting of electronic components and a custom C# Windows application was developed to control the unit. The electronic components consist of: Arduino Uno, fans, a Bluetooth module to connect the application with the device and servo motors to be used to press the scent jars causing the release of the scents.
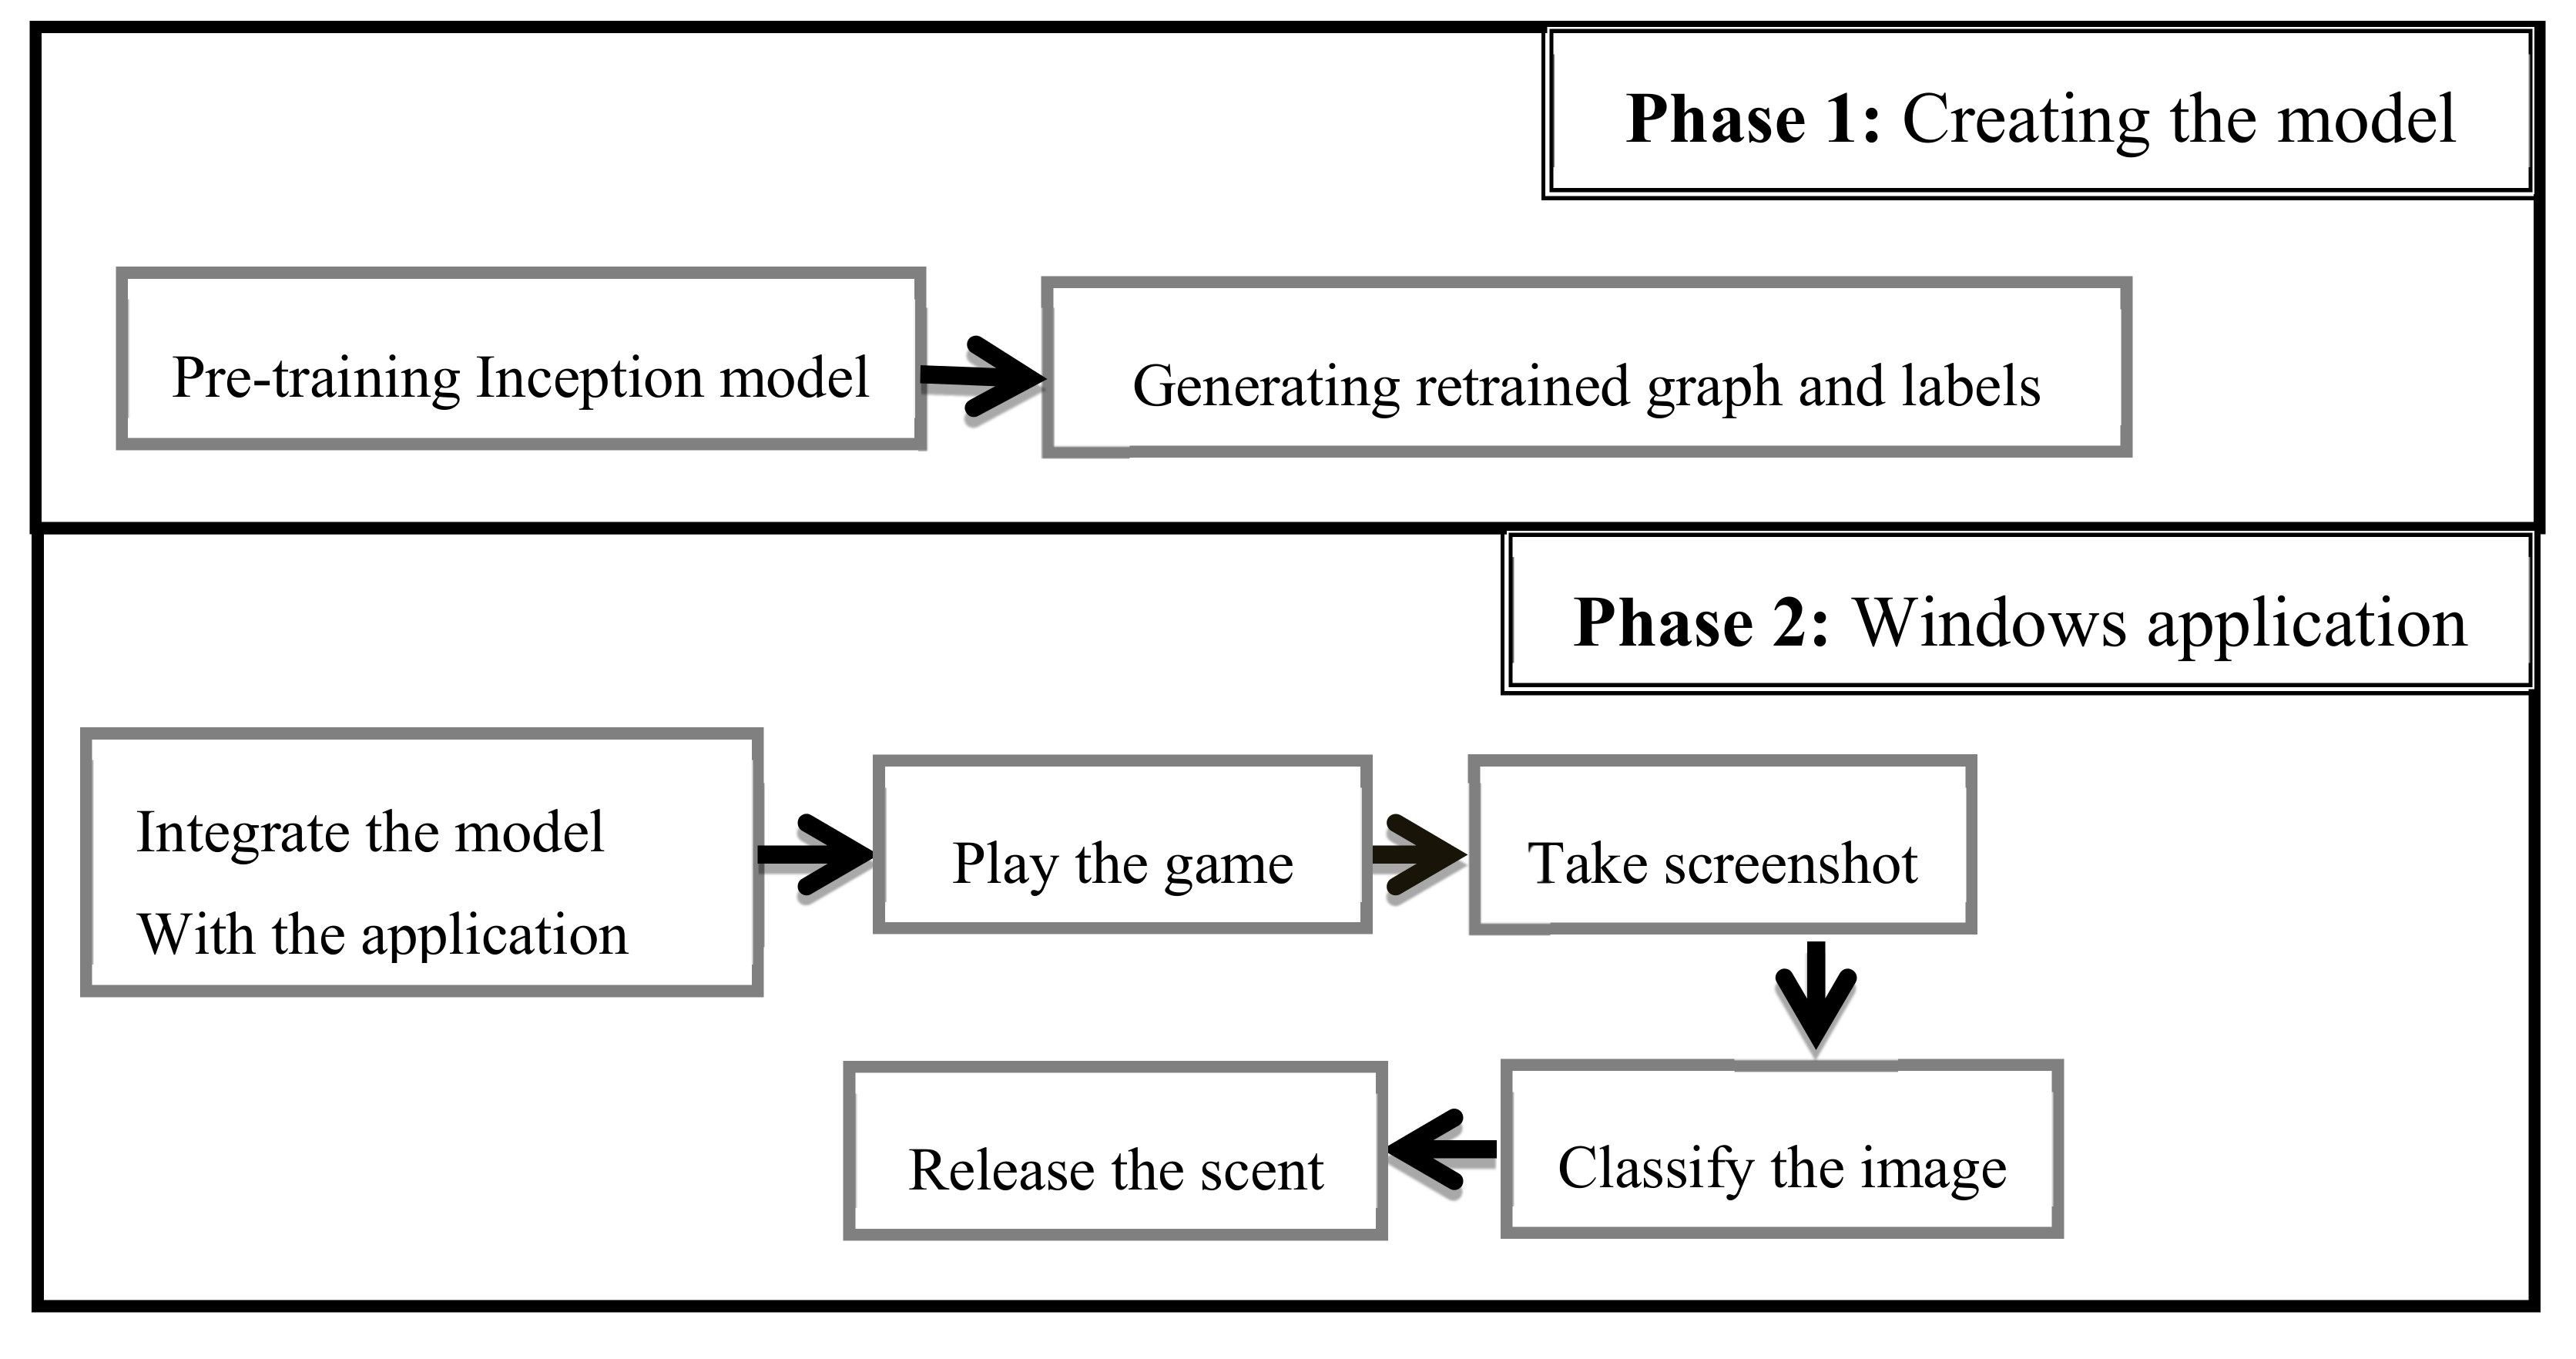
As for the C# Windows application, it was used to capture the images from the selected game. In this research we selected the Minecraft computer game. The user can control the time when the capturing occurs. The release of the scents took place after the image was classified by the Convolutional Neural Network (CNN) model. Figure 1 shows the framework of the system.
3.2. Olfactory Display
Arduino UNO boards were the core for many projects with good community support, multiple platforms support and easy to use software and hardware. The Arduino UNO has 14 digital input/output pins, USB connection and power jack [19].
In this project, we tried to develop a device similar to the olfactory display that was presented in [18] with a slight change by adding Bluetooth to transfer data instead of the wire connection. The device has several electronic components connected and controlled by the Arduino, like three servo motors of the MG996R type to press the jars. The servo motors are controlled from the Arduino. Each servo motor can control two jars. Therefore, there are six scent jars and by increasing the number of servo motors, we can control the number of scents the device releases. At the same time only two scents can be released and the scents are ocean, fire, snow, mildew, grass and dirt. This technical limitation can be easily taken care of, however, this device aims to serve as a proof of concept and not a commercial product. Figure 2 shows an overview of the device.
The Arduino is connected to DC driver 2 × 15 A which is used to control two fans. The fans assist in pushing away the scents in the environment after the release of the scents. To make the application communicate wirelessly with the device, HC-05 Bluetooth module has been used with Arduino. The whole system is used with the power of three Ampere phone chargers. System connections schematic is presented in Figure 3.
3.3. The Virtual Environment
The study uses the Minecraft game to associate scents with the contents of this virtual environment. Minecraft is a game in which the player can go for many adventures in generated worlds. They can build whatever they imagine by using the resources which are given to them. They can equally go to the “adventures” and “survival” modes where they have to defend themselves [20]. The game can be played on many platforms and has 74 million active players [21].
We have selected six scents that we associated with visual information from the game. The scents are grass, ocean, snow, dirt, fire, and mildew, which is used as an unpleasant scent to associate with zombies. The device will automatically release a scent based on the identified visual content.
3.4. Automatic Association
3.4.1. Inception Model
The automatic association depends on using image recognition. Our brain makes the process of associating the image to a class as an easy task to do, but it is still one of the hardest problems to organize by using a computer in which an image is simply a large grid of numbers. The advancement of technology in this field that uses deep convolutional neural networks made it possible and became state-of-art to solve these kinds of problems. It takes a lot of time to train the convolutional network from scratch, especially when it is hard to find large data sets that are sufficient enough to accomplish this task. The researchers made many models as in [22,23,24]. These models were trained on large data to classify them into many classes. Many researches used them to conduct their study as in Style Transfer [25] and Skin Cancer Detection [26].
Inception model is one of the CNN models used extensively in the transfer of learning. Normally, in the convolutional layer the designer must decide whether 1 × 1, 3 × 3 or 5 × 5 filter size is to be used followed by max pooling and then repeating this layer by stacking more layers with the hope to detect more details. However, this architecture is computationally expensive due to many operations occurring at every neuron, thus increasing the layers will result in more details. But in the Inception model, different architecture is used. Instead of choosing, we use them all on the same layer, concatenating them and sending them to the next layer. This architecture is complicated but it worked remarkably well and managed to give better performance results in terms of speed and accuracy.
In this study, we applied the transfer of learning by using Inception-v3 which is trained by Google to classify 1.28 million images from 1000 classes. The model was pre-trained on our image data and was supposed to do multi-label image classification in which multiple classes could be corrected to classify a single image with the help of TensorFlow [27], framework from Google to pre-train the Inception-v3.
3.4.2. Data Preparation
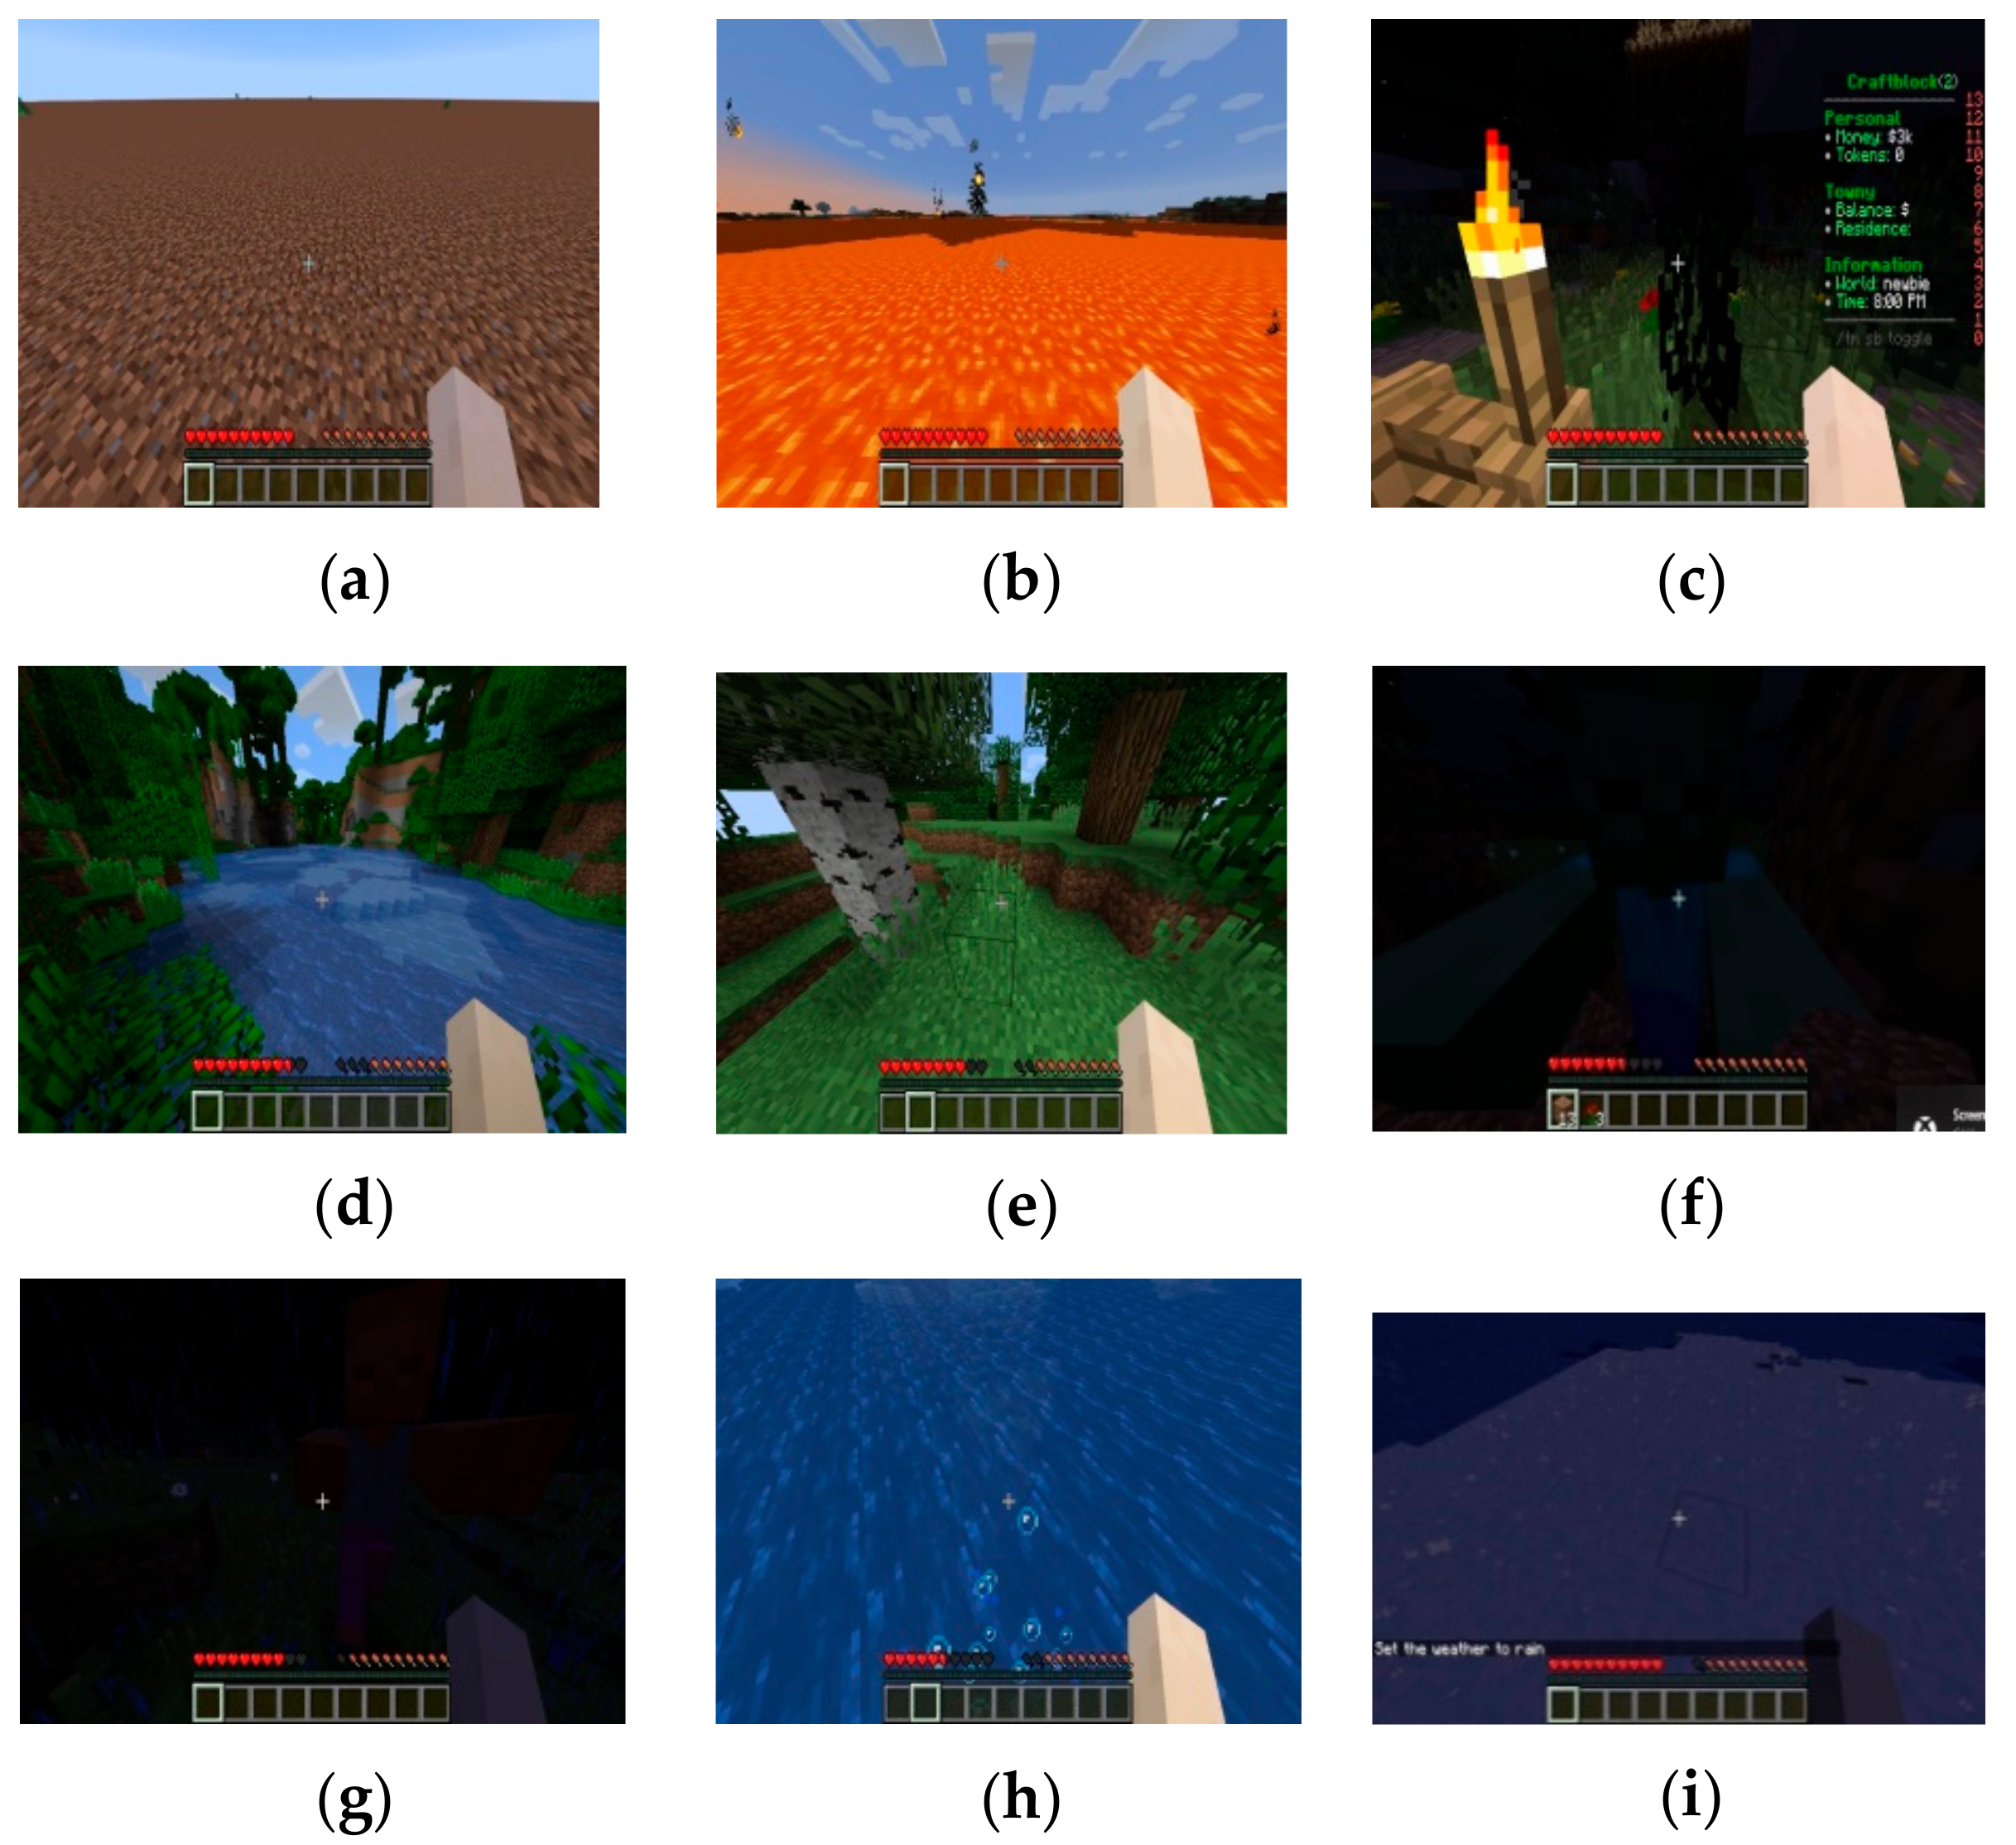
The first step was to collect data to train the inception model. We aimed to have 200 images for each class so manually we collected 100 screenshots from Minecraft game with the categories as grass, fire, dirt, snow, ocean, mildew (the unpleasant smell for zombies) and then we performed data augmentation on the previously collected data to get another 100 images for each class, thus we had a total 1800 images. The data augmentations were performed manually on some of the images; mainly they were rotation, scaling and changing of the color. Before data augmentation the accuracy was less than 30% making data augmentation a necessity. For testing, we used 10 images for each class, thus in total we had 60 images for testing. The testing and training datasets were different. Figure 4 illustrates some of the images used to train the model.
For each image we prepared a text file that had the label of the image as was proposed in [28] to classify multi-labels images. Labels were coded using the Sigmoid method so that one image could belong to multiple classes with different probabilities. In the study, we used two labels for each image that contained two of the scents we wanted to release. We covered only three cases which were: (1) If the image had both ocean and grass, (2) if the image had fire and grass, and (3) if the image had grass and mildew-zombie. All screenshots used for training and testing were manually collected.
3.4.3. Windows Application
For the controlling of the olfactory display, we developed an application that could communicate with the device through Bluetooth. It took screenshots of Minecraft game every 6 s, resulting in image recognition. The pre-training process of the Inception-V3 model resulted in creating two files which were: Trained graph and a text file containing the labels. The application read these files and tried to recognize the new images by using EmguTF, a .Net wrapper [29] to call Tensor Flow functions. After the classification of the screenshot the image was sent to the Arduino and the corresponding servo motor pressed the jar and the scent was released. The fans rotated, causing the spread of the scent. Figure 5 shows a screenshot of the application.
4. System Evaluation and Results
The retrained model was trained on Windows 10 PC with 8 GB RAM, Intel core i7 processor. We set the training steps to be 20,000 steps consuming an hour, based on default value. In order to retrain the model, we calculated the accuracy of new images from the Minecraft game that was not used for training before. There were 90 images in which each class comprised of 10 images. Also, we calculated the recall, precision and F-score.
4.1. Accuracy of Retrained Model
To evaluate the accuracy before integrating the model to our application, we provided the model with ten testing images for each class. Learning rate was set to 0.01 with batch size as 100. Table 2 shows the results we got for each testing image. For the dirt images, the accuracy differed nonetheless, the model gave correct prediction of the label. For the grass class and ocean, they gave the highest accuracy results compared to the rest of the classes. However, the ocean images with dark color—images that have been taken after setting the time to night—gave lower scores. For the fire images, even though we reached an accuracy score of 0.99 in a few testing images, most of them ranged between 0.7 and 0.6 and this, due to the difficulty in collecting data which had fire only from the game. Fire was usually found in images that had grass too. For images containing snow, the color of snow was similar to that of the ocean and sky in some weather conditions provided by the game, thus causing the accuracy to drop in many of the testing images. If more training images were fed to stimulate the model in all conditions, then the accuracy would be much higher. In fact, the increasing of training images in all classes would increase the overall accuracy of the whole model. The images that contained illustrations of zombies were associated with the scent of mildew to represent an unpleasant scent. In comparison to the other classes, the zombies had the lowest scores when it was tested on the application, mainly due to the difficulty in training the system on high resolution images that represent zombies alone.
In some cases, we wanted two scents to be released, therefore; we had 3 cases for training models to recognize them. We selected these three cases with a motive of how frequent they were shown in the game. Table 3 shows the results of these images. The first case is that, if the image has grass and ocean, then we wanted both of these classes to have high accuracy; we provided the model with 10 testing images similar to the previous cases. The model had higher accuracy for both classes of ocean and grass. However, in this data for the images that contained both grasses and ocean, we noticed that the grass class gave higher scores than the ocean’s class. This is similar with the image that contains either grass or ocean; the grass was correctly classified with high scores compared to the ocean class. In the second case, if we want both scents to be released when the image contains both grass and fire; only one image gave an accuracy of 0.99 for both fire and grass. Similar to the grass and ocean images, we got a higher accuracy score for the grass compared to the accuracy of the fire. This can be well seen if we compare the accuracy of the fire and grass alone. In many cases the grass had a much higher score than the fire. The last case was an image containing zombie–mildew and grass, the result showed high accuracy for the grass in all of the ten images compared with the mildew–zombie class. However, the mildew class got higher scores when combined with the grass in comparison with the classification of mildew class alone. For all these three cases during gameplay, both scents were released. Thus, it is important to have high accuracy for both of the classes in order to achieve this. Figure 6 shows samples of the images which were used for the testing of the accuracy of the model before integrating it with the Windows application.
4.2. Accuracy of the Model within the Application
After integrating the CNN model to the Windows application, we ran the application while playing the game and we calculated the time to recognize each captured image and its accuracy as illustrated in Table 4.
As the results show, the recognition of the image takes a few seconds, which makes the application running in almost real time. To release the scents, the accuracy was set to be at least 90% or higher.
4.3. Precision, Recall and F-Score
To compute the precision and recall, we had multiple confusion matrices, stated in Table 5, Table 6, Table 7, Table 8, Table 9 and Table 10, for each label; we accepted the score of the predication with threshold value 0.5. And then we applied micro-average method and macro-average method to get the model precision, recall and F-score performance evaluation metrics. Each label had 10 testing images.
For every class we have computed the precision and recall. The results in Table 11 have been produced by the following formulas:
Precision = True positive/true positive + false positive
Recall = True positive/true positive + false negative
Then we applied the micro-average method and macro-average method and we produced the results in Table 12.
The overall accuracy was 97% with individual accuracies reaching as high as 99%. This overall accuracy is satisfactory to the needs of the olfactory display. Furthermore, statistical results of Precision and Recall are also closer to 0.9 in most cases. Thus, validating the acceptance of this approach.
5. Conclusions and Future Work
The study presented an economical placed-in environment olfactory display, capable of releasing 6 scents which can easily be extended. The olfactory display can be used with movies but most importantly, it can be used with games and interactive content, where using time to decide when to release the scents is not possible. The device associates the scents with live images of the virtual environment by using Convolutional Neural Network for the image recognition. The study has shown how the process of automatic association of scents with content is possible and has solved the problems of releasing the scents in games when the player teleports from one place to another. The device is controlled by the Windows application that the user can connect via Bluetooth with the device and sets time to make sure how frequently the scents are released after the image is recognized.
The current version is not generic and requires the system to be trained for each target virtual artefact and for each title separately. Training the system for each game title is possible with a small team of experts and certainly is not a show stopper.
Further work needs to be done for the establishment of adding sound recognition along with the image recognition which could contribute best for the user’s experience. Also, a natural progression of this work will enhance the accuracy of the model by feeding the model with more training data. Finally, improving the design of the olfactory display is a possible future work.
Supplementary Files
Supplementary File 1Author Contributions
A.L. and G.T. jointly designed the experiment. A.L. executed the experiment. A.L. and S.M.B. analyzed the experiment. Technical paper organization was supervised by F.A. Responding to reviewer comments were handled by S.M.B. and G.T.
Funding
This research received no external funding.
Conflicts of Interest
The authors declare no conflict of interest.
References
- Blascovich, J.; Loomis, J.; Beall, A.C.; Swinth, K.R.; Hoyt, C.L.; Bailenson, J.N. TARGET ARTICLE: Immersive Virtual Environment Technology as a Methodological Tool for Social Psychology. Psychol. Inq. 2002, 13, 103–124. [Google Scholar] [CrossRef]
- Bouchard, S.; Côté, S.; St-Jacques, J.; Robillard, G.; Renaud, P. Effectiveness of virtual reality exposure in the treatment of arachnophobia using 3D games. Technol. Health Care 2006, 14, 19–27. [Google Scholar] [PubMed]
- Hendrix, C.M.; Barfield, W. Presence in virtual environments as a function of visual and auditory cues. In Proceedings of the Virtual Reality Annual International Symposium ’95, Research Triangle Park, NC, USA, 11–15 March 1995. [Google Scholar]
- Chen, Y. Olfactory Display: Development and Application in Virtual Reality Therapy. In Proceedings of the 16th International Conference on Artificial Reality and Telexistence—Workshops (ICAT’06), Hangzhou, China, 29 November–1 December 2006; pp. 580–584. [Google Scholar]
- Efe, A. Using Olfactory Displays as a Nontraditional Interface in Human Computer Interaction. J. Learn. Teach. Digit. Age (JOLTIDA) 2017, 2, 14–25. [Google Scholar]
- Covington, J.A.; Agbroko, S.O.; Tiele, A. Development of a Portable, Multichannel Olfactory Display Transducer. IEEE Sens. J. 2018, 18, 4969–4974. [Google Scholar] [CrossRef]
- Nakamoto, T. Odor sensing system and olfactory display. Yakugaku Zasshi J. Pharm. Soc. Jpn. 2014, 134, 333–338. [Google Scholar] [CrossRef]
- Olorama Technology. Available online: https://www.olorama.com/en/ (accessed on 3 July 2018).
- Minecraft. Available online: https://minecraft.net/en-us/?ref=m (accessed on 6 April 2018).
- Murray, N.; Lee, B.; Qiao, Y.; Muntean, G.-M. Olfaction-Enhanced Multimedia: A Survey of Application Domains, Displays, and Research Challenges. ACM Comput. Surv. 2016, 48. [Google Scholar] [CrossRef]
- Dobbelstein, D.; Herrdum, S.; Rukzio, E. inScent: A wearable olfactory display as an amplification for mobile notifications. In Proceedings of the 2017 ACM International Symposium on Wearable Computers, Maui, HI, USA, 11–15 September 2017. [Google Scholar]
- Amores, J.; Maes, P. Essence: Olfactory Interfaces for Unconscious Influence of Mood and Cognitive Performance. In Proceedings of the 2017 CHI Conference on Human Factors in Computing Systems, Denver, CO, USA, 6–11 May 2017. [Google Scholar]
- Matsukura, H.; Yoneda, T.; Ishida, H. Smelling Screen: Development and Evaluation of an Olfactory Display System for Presenting a Virtual Odor Source. IEEE Trans. Vis. Comput. Graph. 2013, 19, 606–615. [Google Scholar] [CrossRef] [PubMed]
- Howell, M.J.; Herrera, N.S.; Moore, A.G.; McMahan, R.P. A reproducible olfactory display for exploring olfaction in immersive media experiences. Multimed. Tools Appl. 2016, 75, 12311–12330. [Google Scholar] [CrossRef]
- Nakamoto, T.; Otaguro, S.; Kinoshita, M.; Nagahama, M.; Ohinishi, K.; Ishida, T. Cooking Up an Interactive Olfactory Game Display. IEEE Comput. Graph. Appl. 2008, 28, 75–78. [Google Scholar] [CrossRef] [PubMed]
- Ghinea, G.; Ademoye, O.A. Perceived Synchronization of Olfactory Multimedia. IEEE Trans. Syst. Man Cybern. Part A Syst. Hum. 2010, 40, 657–663. [Google Scholar] [CrossRef]
- Murray, N.; Qiao, Y.; Lee, B.; Muntean, G.-M.; Karunakar, A.K. Age and Gender Influence on Perceived Olfactory & Visual Media Synchronization. In Proceedings of the IEEE International Conference on Multimedia and Expo (ICME), San Jose, CA, USA, 15–19 July 2013. [Google Scholar]
- Michailidis, F.; Tsaramirsis, G.; AlMuhammadi, A. n-Dimensions: A General Purpose, Extendable Arduino based Olfactory Display. In Proceedings of the 2017 4th International Conference on Computing for Sustainable Global Development (INDIACom-2017), Delhi, India, 1–3 March 2017. IEEE Conference ID: 40353. [Google Scholar]
- Arduino. Available online: https://store.arduino.cc/usa/arduino-uno-rev3 (accessed on 7 March 2018).
- What is Minecraft. Available online: https://minecraft.net/en-us/what-is-minecraft/ (accessed on 6 April 2018).
- Minecraft Head Helen Chiang Reveals Minecraft Hit 74 Million Active Players. Available online: https://www.windowscentral.com/minecraft-74-million-players (accessed on 6 April 2018).
- Visual Geometry Group. Available online: http://www.robots.ox.ac.uk/~vgg/research/very_deep/ (accessed on 10 April 2018).
- He, K.; Zhang, X.; Ren, S.; Sun, J. Deep Residual Learning for Image Recognition. arXiv 2015, arXiv:1512.03385. [Google Scholar]
- Szegedy, C.; Vanhoucke, V.; Ioffe, S.; Shlens, J.; Wojna, Z. Rethinking the Inception Architecture for Computer Vision. In Proceedings of the 2016 IEEE Conference on Computer Vision and Pattern Recognition (CVPR), Las Vegas, NV, USA, 27–30 June 2016; pp. 2818–2826. [Google Scholar]
- Gatys, L.A.; Ecker, A.S.; Bethge, M. Image Style Transfer Using Convolutional Neural Networks. In Proceedings of the 2016 IEEE Conference on Computer Vision and Pattern Recognition (CVPR), Las Vegas, NV, USA, 27–30 June 2016; pp. 2414–2423. [Google Scholar]
- Deep Learning Algorithm Does as Well as Dermatologists in Identifying Skin Cancer. Available online: https://news.stanford.edu/2017/01/25/artificial-intelligence-used-identify-skin-cancer/ (accessed on 5 May 2018).
- TensorFlow. Available online: https://www.tensorflow.org/ (accessed on 10 March 2018).
- GitHub. Available online: https://github.com/BartyzalRadek/Multi-label-Inception-net (accessed on 1 March 2018).
- EmguTF. Available online: http://www.emgu.com/wiki/index.php/Emgu_TF (accessed on 10 March 2018).
Figure 1.
Framework of the system.

Figure 2.
Overview of the device.

Figure 3.
System connections schematic.

Figure 4.
A sample of the training data used to train the model. (a) Dirt data; (b) Fire data; (c) Fire and grass data; (d) Grass and ocean data; (e) Grass data; (f) Mildew(zombie) data; (g) Mildew and grass data; (h) Ocean data; (i) Snow data.
Figure 4.
A sample of the training data used to train the model. (a) Dirt data; (b) Fire data; (c) Fire and grass data; (d) Grass and ocean data; (e) Grass data; (f) Mildew(zombie) data; (g) Mildew and grass data; (h) Ocean data; (i) Snow data.

Figure 5.
Screenshot of Windows application.

Figure 6.
A sample of the testing images used to test the accuracy of the model in classifying new images. (a) Testing image for dirt class; (b) Testing image for fire class; (c) Testing image for grass and fire classes; (d) Testing image for grass and ocean class; (e) Testing image for grass class; (f) Testing image for mildew(zombie) class; (g) Testing image for mildew and grass classes; (h) Testing image for ocean class; (i) Testing image for snow.


Table 1.
Comparison between the olfactory displays.
| Device | Type | Application | Method of Releasing the Scent | Limitation |
|---|---|---|---|---|
| [11] | Wearable device | Mobile notification | Content of the message | Using heating |
| Name of sender | ||||
| Loud noise from the fans | ||||
| Timing | ||||
| [12] | Wearable device | Mobile notification | Manually | Releasing only one scent |
| Controlled by remote person. | ||||
| Time | ||||
| Heart rate | ||||
| Brain activity | ||||
| [13] | Placed in environment | Random images | Manually | The device didn’t operate based on application but random images shown on different corners on the screen. |
| [14] | Placed in environment | Gaming | Collide with the object in the game. | Modify the Unity game environment to add a bowl of oranges which will be used to release the scent |
| Advertising procedural memories | ||||
| [6] | Placed in the environment | Different images | Time | Heating takes time, it takes 6 s before the scent is released |
| [16] | Placed in the environment | Movies | Time | Applied to a movie which is easy to predict the next scent to be released by time. |
| [17] | Placed in the environment | Movies | Time | Used only in movies, and can only release four scents. |
| [5] | Placed in the environment | Movies | Subtitle identification | Time consuming in analyzing each logo with each scene to detect the scent associated with it. |
| [18] | Placed in the environment | Games | Time | Used in games but we must know the order of scents |
Table 2.
Model predications for 10 testing images of single label.
| Image | Model Predication |
|---|---|
| Dirt |
|
| Grass |
|
| Ocean |
|
| Snow |
|
| Zombies (mildew) |
|
| Fire |
|
Table 3.
Model predications for 10 testing images of Multi-label.
| Image | Model Predication |
|---|---|
| Grass and ocean |
|
| Grass and Fire |
|
| Zombie (mildew) and grass |
|
Table 4.
Performance of the model within the application.
| Image | Recognition Time | Class and Accuracy | Total Time to Recognize the Image and Release the Scent |
|---|---|---|---|
 | 2073 ms | Grass with 99.99% | 123 ms |
| Ocean with 99.98% | |||
 | 1793 ms | Grass with 99.99% | 2 ms |
 | 1560 ms | Ocean with 97.76% | 63 ms |
 | 1839 ms | Dirt with 98.74% | 81 ms |
 | 1823 ms | Grass with 99.99% | 28 ms |
| Fire with 97.42% | |||
 | 1529 ms | Fire with 99.58% | 67 ms |
 | 1369 ms | Grass with 99.73% | 84 ms |
| Mildew with 96.76% | |||
 | 1439 ms | Snow with 98.84% | 65 ms |
Table 5.
Confusion matrix of grass class.
| Predicated NO | Predicated Yes | |
|---|---|---|
| Actual No | TN = 0 | FP = 1 |
| Actual Yes | FN = 0 | TP = 10 |
Table 6.
Confusion matrix of ocean class.
| Predicated NO | Predicated Yes | |
|---|---|---|
| Actual No | TN = 0 | FP = 1 |
| Actual Yes | FN = 0 | TP = 9 |
Table 7.
Confusion matrix of mildew (zombie) class.
| Predicated NO | Predicated Yes | |
|---|---|---|
| Actual No | TN = 0 | FP = 1 |
| Actual Yes | FN = 0 | TP = 9 |
Table 8.
Confusion matrix of fire class.
| Predicated NO | Predicated Yes | |
|---|---|---|
| Actual No | TN = 0 | FP = 0 |
| Actual Yes | FN = 0 | TP = 10 |
Table 9.
Confusion matrix of snow class.
| Predicated NO | Predicated Yes | |
|---|---|---|
| Actual No | TN = 0 | FP = 3 |
| Actual Yes | FN = 0 | TP = 7 |
Table 10.
Confusion matrix of dirt class.
| Predicated NO | Predicated Yes | |
|---|---|---|
| Actual No | TN = 0 | FP = 0 |
| Actual Yes | FN = 0 | TP = 10 |
Table 11.
Precision and recall for each class.
| Class Name | Precision | Recall |
|---|---|---|
| Grass | 1 | 1 |
| Ocean | 0.9 | 1 |
| Mildew(zombie) | 0.9 | 1 |
| Fire | 1 | 1 |
| Snow | 0.7 | 1 |
| Dirt | 1 | 1 |
Table 12.
Performance evaluation of the system based on Micro-average method and Macro-average method.
Table 12.
Performance evaluation of the system based on Micro-average method and Macro-average method.
| Micro-Average of Precision | Micro-Average of Recall | Micro-Average of F-Score | Macro-Average of Precision | Macro-Average of Recall | Macro-Average of F-Score |
|---|---|---|---|---|---|
| 0.92 | 1 | 0.96 | 0.92 | 1 | 0.96 |
© 2019 by the authors. Licensee MDPI, Basel, Switzerland. This article is an open access article distributed under the terms and conditions of the Creative Commons Attribution (CC BY) license (http://creativecommons.org/licenses/by/4.0/).
Share and Cite
MDPI and ACS Style
Al Luhaybi, A.; Alqurashi, F.; Tsaramirsis, G.; Buhari, S.M. Automatic Association of Scents Based on Visual Content. Appl. Sci. 2019, 9, 1697. https://doi.org/10.3390/app9081697
AMA Style
Al Luhaybi A, Alqurashi F, Tsaramirsis G, Buhari SM. Automatic Association of Scents Based on Visual Content. Applied Sciences. 2019; 9(8):1697. https://doi.org/10.3390/app9081697
Chicago/Turabian StyleAl Luhaybi, Amany, Fahad Alqurashi, Georgios Tsaramirsis, and Seyed M. Buhari. 2019. "Automatic Association of Scents Based on Visual Content" Applied Sciences 9, no. 8: 1697. https://doi.org/10.3390/app9081697
Note that from the first issue of 2016, this journal uses article numbers instead of page numbers. See further details here.