Article

Time-Varying IIR Notch Filter with Reduced Transient Response Based on the Bézier Curve Pole Radius Variability

by
Sławomir Kocoń
*,† and
Jacek Piskorowski
Faculty of Electrical Engineering, West Pomeranian University of Technology, Szczecin 70-310, Poland
*
Author to whom correspondence should be addressed.
These authors contributed equally to this work.
Appl. Sci. 2019, 9(7), 1309; https://doi.org/10.3390/app9071309
Submission received: 20 February 2019 / Revised: 15 March 2019 / Accepted: 25 March 2019 / Published: 29 March 2019
(This article belongs to the Section Electrical, Electronics and Communications Engineering)

Abstract

:

Featured Application

The presented filter structure is intended to be implemented in a portable medical devices in order to improve measurement efficiency.

Abstract

In this paper a concept of the second order digital infinite impulse response narrow band-reject filter with reduced transient response is proposed. In order to suppress the transient response of the considered infinite impulse response (IIR) notch filter its pole radius is temporarily varied in time using the Bézier parametric curve. Computer simulations verifying the effectiveness of the proposed pole-radius-varying notch filter are presented and compared to the performance of the traditional time-invariant filter using ECG signals distorted by unwanted powerline interference.

1. Introduction

Estimation, detection and filtering of narrowband signals in the presence of unwanted noise represent some of the important applications of signal processing techniques. In most of these applications it is often desired to suppress narrowband signals while leaving the broad band energy without changes. This can be achieved by passing the signals through a band reject filter whose notches are centered on the narrowband signals. Typical application areas include for example biomedical engineering and communications [1,2]. Removing powerline interferences from ECG, EEG, and EMG recordings [3], filtering of humming GSM mobile telephone noise [4], and estimation of power system frequency [5] are specific examples of using notch filters. The design procedure of notch filters is usually a difficult task, particularly when the signals on a very narrow frequency band must be suppressed and those in the immediate neighborhood should be maintained without distortions. From the measurement point of view one of the most important problems of the signal processing path is the transient response of filters. The duration of the transient state depends mainly on the filter order and the filter selectivity [6]. Long-lasting transients cause huge problems, particularly when short-time signals are filtered or when the initial phase of a processed signal is of great importance [7,8,9]. In such cases a useful signal can be considerably distorted due to the presence of the filter transient response or the signal can be entirely lost in the transient. In many measurement-signal processing systems it is required to use notch filters which possess at the same time a very selective magnitude response and a short duration of the transient response. In the design of filters, however, the selective magnitude response and the transient response of short duration are design specifications which are contradictory to each other and, therefore, are very difficult to tune in a simultaneous way.
The trade off between the duration of the transient response and the selectivity of notch filters has been examined in a few works. In [10,11] the authors introduce non-zero initial conditions to the output of notch filters. As a result, the transient response of these filters is considerably suppressed. On the other hand, in [12], the notch filters with a time-varying quality factor and time-varying pole radius are proposed. The proposed time-varying notch filters are characterized by exponential variability of their parameters. By introducing time-varying parameters to the filter structure the authors attain a significant reduction of the duration of the transient response of notch filters. The results they obtained clearly show that the proposed methods are effective at filtering ECG signals.
In this paper, the second order digital infinite impulse response notch filter with reduced transient response is proposed. In order to suppress the transient response of the considered infinite impulse response (IIR) notch filter its pole radius is temporarily varied in time using the Bézier parametric curve. Computer simulations verifying the effectiveness of the proposed strategy clearly show that the Bézier curve is definitely more effective in reducing the duration of the transient response if compared to previously used exponential functions [12,13]. The rest of this paper is organized as follows: in Section 2, digital IIR notch filters are discussed in more detail. The idea of the IIR notch filter with a time-varying pole radius is presented in Section 3. In Section 4, examples of using the proposed pole-radius-varying notch filter to filtering ECG signals distorted by powerline interference are provided. Finally, some concluding remarks are given in Section 5.

2. Digital IIR Notch Filter Specification

The magnitude response of ideal IIR filter can be written as:
| H ( e j ω ) | = 0 for ω = ω 0 1 otherwise , ,
where ω = 2 π f f s is the normalized frequency, f s is the sampling frequency, and ω 0 is the notch frequency. The notch effect of the IIR filter can be obtained by placing a pair of complex conjugate zeros at e ± j ω 0 . The frequency response in the passband is close to unity by placing a pair of conjugate poles at r e ± j ω 0 . The value of r must be positive and less than unity. The transfer function of the second order IIR notch filter can be written as:
H 0 ( z ) = K 0 ( z e j ω 0 ) ( z e j ω 0 ) ( z r e j ω 0 ) ( z r e j ω 0 ) ,
where K 0 is the gain factor of the filter, ω 0 = 2 π f 0 f s , f 0 is the frequency that has to be removed from a signal, and r is the radius of a pair of complex conjugate poles placed at the angle ω 0 , the same angle as the zeros of the designed filter. In this design, the bandwidth B W ¯ of the filter can be controlled through the value of r, being narrower as the pole radius goes closer to the unit circle. The Equation (2) can be rewritten in the following form:
H 0 ( z ) = K 0 1 2 cos ω 0 z 1 + z 2 1 2 r cos ω 0 z 1 + r 2 z 2 .
The bandwidth of the obtained notch filter can be calculated using following equation:
B W ¯ = 1 r π f s .
To improve the selectivity of the presented filter structure, the pole radius r needs to be as close to unity as possible. On the other hand, the settling time of the filter depends on the bandwidth as presented in [13]. The settling time considered in this paper should be interpreted as the time it takes for y ( n ) y f to fall below 2 % of its peak value, where y ( n ) is the filter response at time n and y f is the filter steady-state response. The dependence of the transient duration on the pole radius r is given by the following equation:
y ( n ) = A δ ( n ) + 2 | B | r n cos ( n ω 0 + ϕ ) + s ¯ ( n ) ,
where n is the time index, A and B are constants, δ ( n ) is the Kronecker delta, and ϕ is the resultant phase. The first and the second term of Equation (5) correspond to the transient response [13]. Due to the Kronecker delta δ ( n ) , the first term only affects the first sample of the output signal. When the pole radius is closer to unity the component r n in the second term of Equation (5) causes a longer settling time, and therefore a longer transient response. The last term of Equation (5) contains only the filtered useful signal. As one can see, the value of the pole radius r of the considered second order IIR notch filter controls the duration of the settling time and thus the duration of the transient state. In Table 1 settling times and rejection bandwidths of the second order IIR notch filter with f 0 = 50 Hz and f s = 500 Hz are presented. Both parameters are calculated for various values of the pole radius. As one can see, the closer the pole radius approaches the unit circle, the higher the selectivity of the filter, and the longer the settling time of the output signal.

3. Time-Varying Pole Radius of the Filter

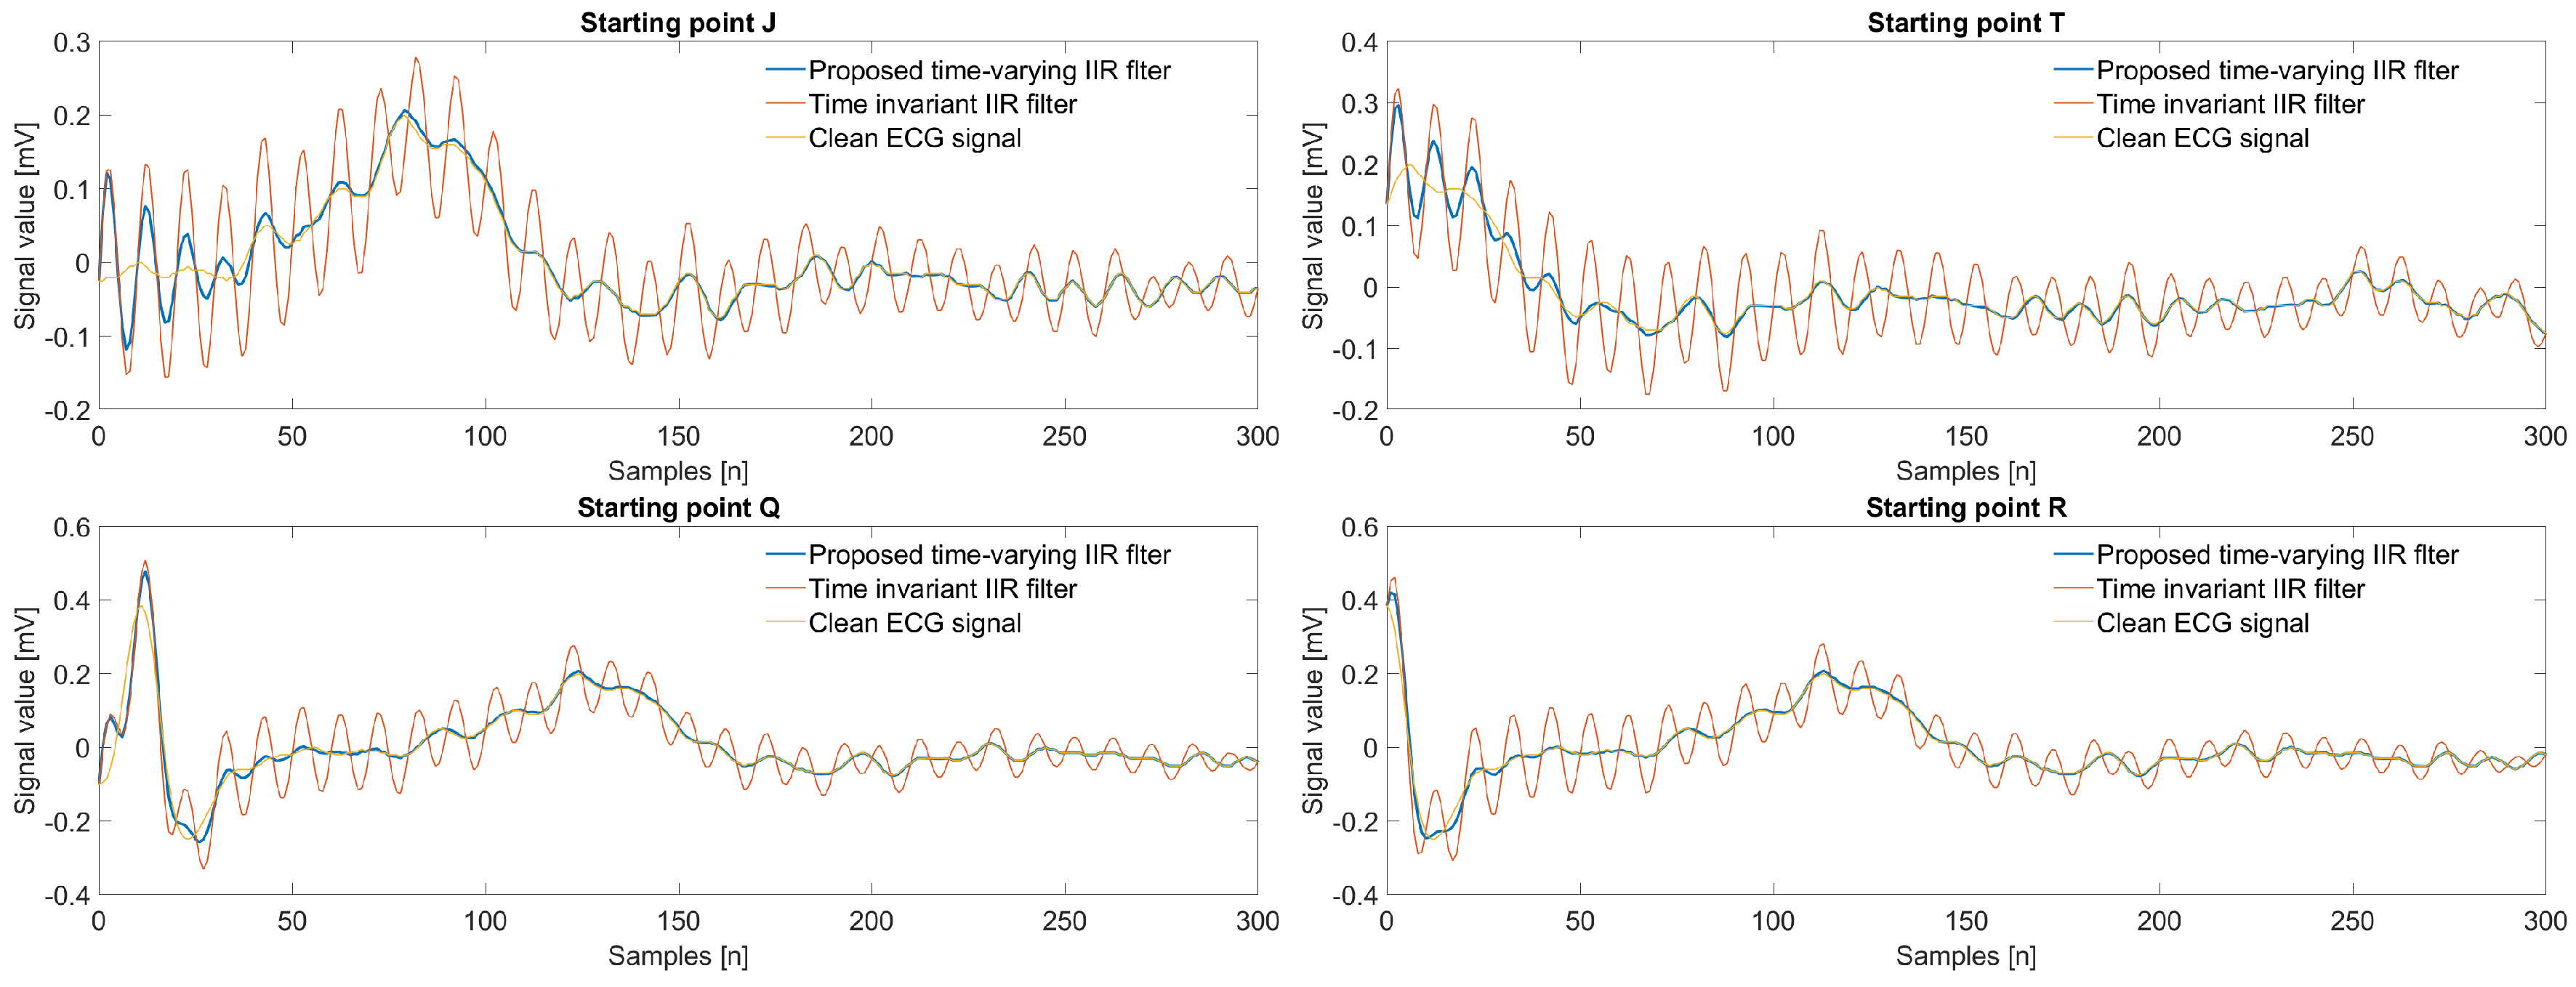
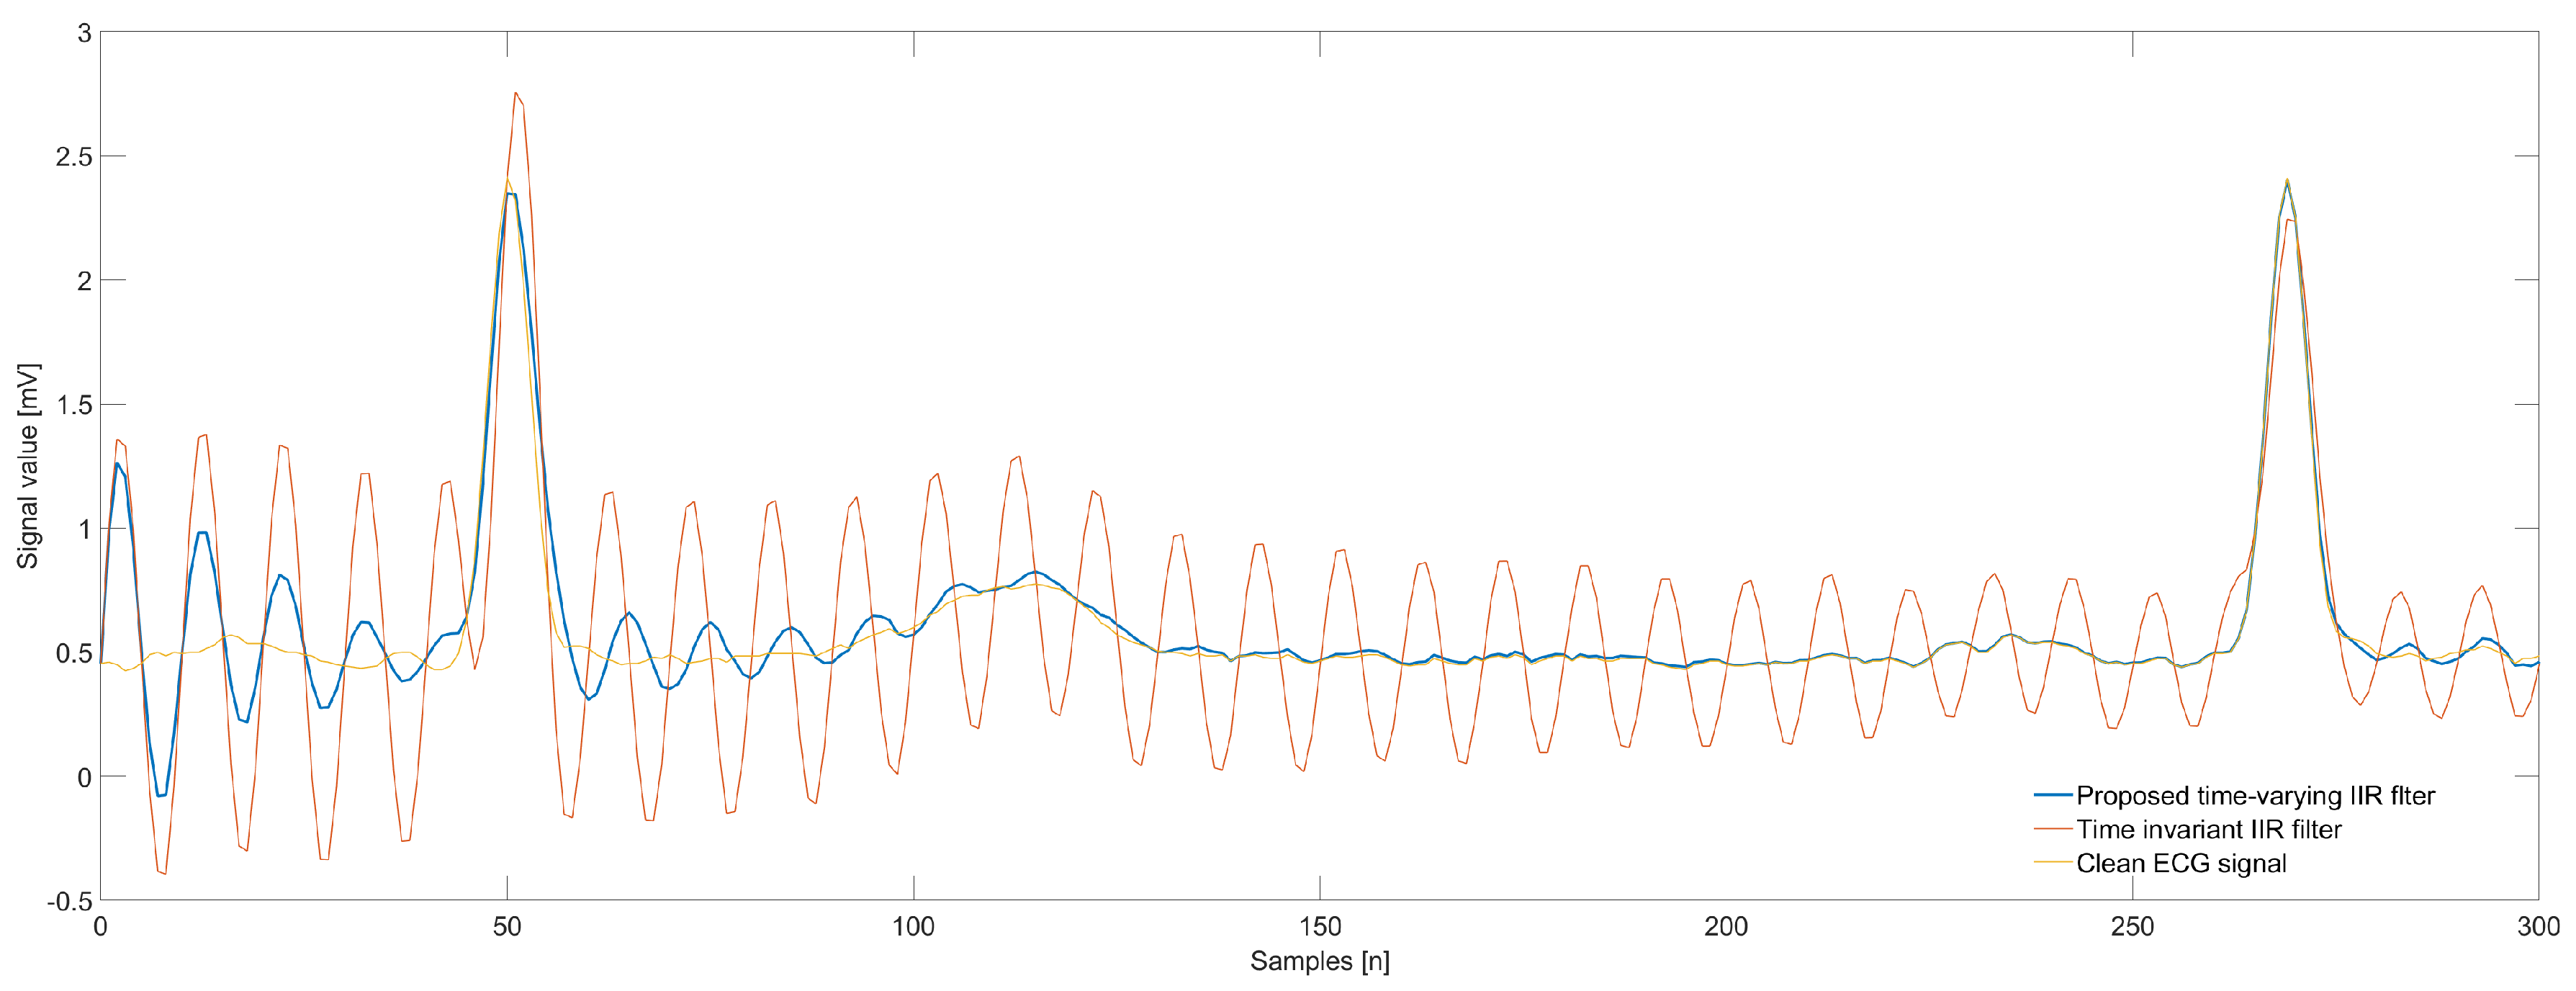
In order to suppress the transient response of the considered second order IIR notch filter it was assumed that the value of the pole radius 
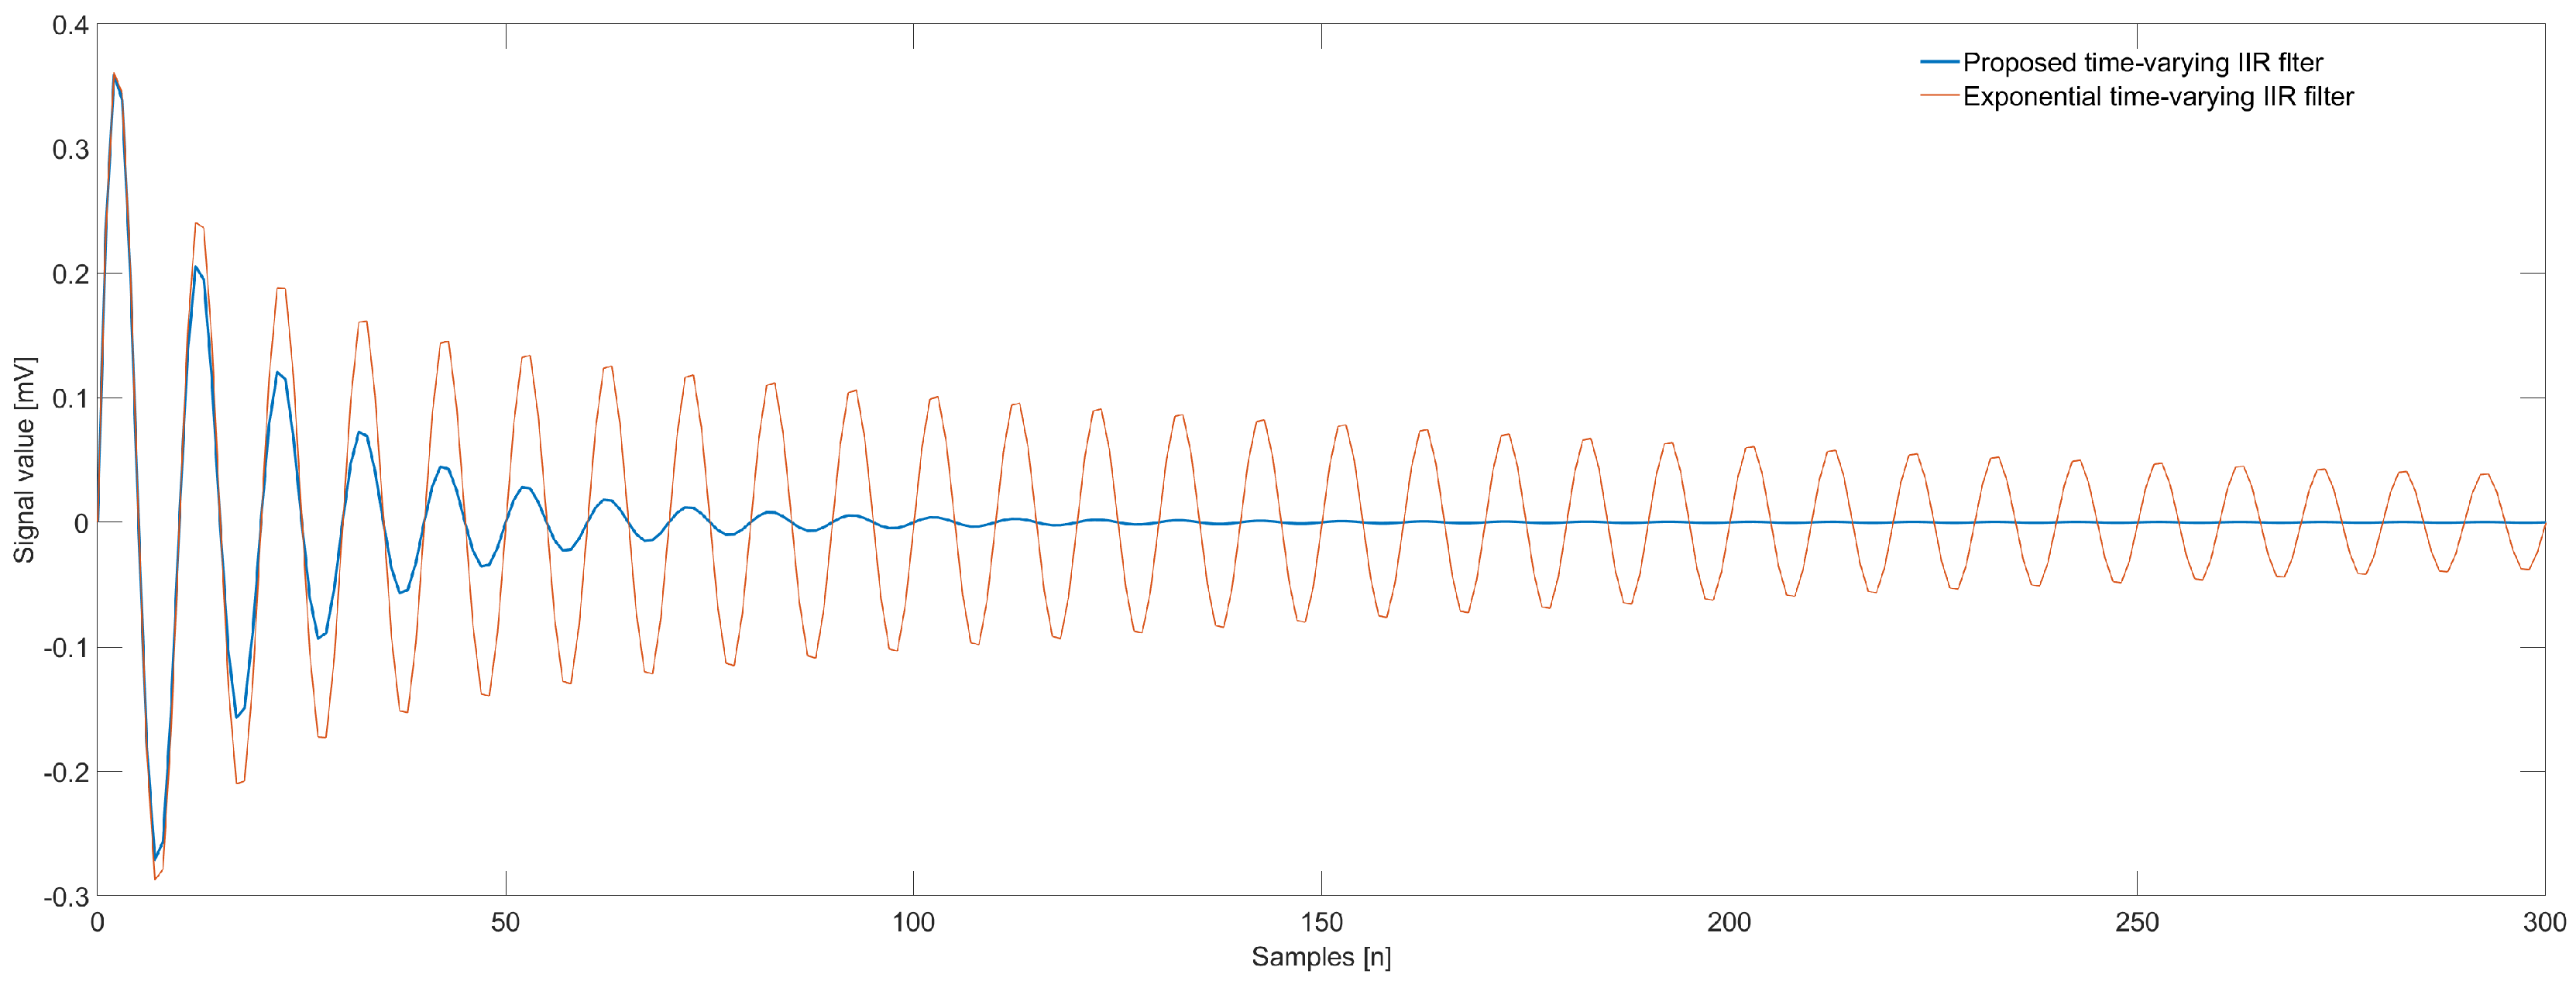
r is temporarily varied in time. The proposed method gives the possibility to maintain the frequency specification and, at the same time, to improve the time-domain behaviour of the filter. The main assumption of the proposed idea is to change the pole radius from some set value to a value that is very close to unity. The proposed method allows us to obtain the notch filter with both a suppressed transient response and a narrow bandwidth. The transfer function of the second time-varying IIR notch filter can be expressed in the discrete time domain by the following difference equation:
y ( n ) = x ( n ) + b 1 x ( n 1 ) + x ( n 2 ) a 1 ( n 1 ) y ( n 1 ) a 2 ( n 2 ) y ( n 2 ) ,
where y ( n ) and x ( n ) are the filter output and the input signal, respectively. The coefficient b 1 is equal to 2 cos ( ω 0 ) , a 1 ( n ) = 2 r ( n ) cos ( ω 0 ) , and a 2 ( n ) = r 2 ( n ) . In order to control the time variation of the pole radius r ( n ) the 3rd order Bézier curve is used. We have used the Bézier curve because this kind of function can be easily and freely shaped by means of predefined control points. Thanks to the Bézier curve we are able to generate the function that changes the pole radius in a more flexible manner if compared to the exponential function. The proposed parametric curve can be expressed in the following form:
B k = B 1 1 k 3 + 3 B 2 k 1 k 2 + 3 B 3 k 2 1 k + B 4 k 3 ,
where the Cartesian coordinates of the Bézier curve control points are given as: B 1 = x 1 , y 1 , B 2 = x 2 , y 2 , B 3 = x 3 , y 3 , B 4 = x 4 , y 4 . The control points B 1 and B 4 determines respectively the starting and the ending point of the considered curve. The control points B 2 and B 3 deliver directional information. The distance between these control points specifies how the parametric curve moves towards the point B 2 before turning towards point B 3 . The coordinates of point B 1 includes the starting point of the time-varying formula x 1 = 0 and the starting pole radius y 1 = r s t a r t . On the other hand, the coordinates of B 4 determine the length of the variability time horizon x 4 = M and the final value of the pole radius y 4 = r f i n a l . In order to find the coordinates of the control points B 2 and B 3 the simulated annealing algorithm is used. The main aim of the annealing algorithm is to find B 2 and B 3 whose coordinates minimize the mean square error defined as:
M S E t v = 1 K n = 1 K y ( n ) s ( n ) 2 ,
where K is the duration of the input signal, y ( n ) is the output of the signal, and s ( n ) is the clean original signal. Equation (7) can be reformulated to the following form:
B x k = x 1 1 k 3 + 3 x 2 k 1 k 2 + 3 x 3 k 2 1 k + x 4 k 3 ,
B y k = y 1 1 k 3 + 3 y 2 k 1 k 2 + 3 y 3 k 2 1 k + y 4 k 3 .
To find the values of the function B x = F B y k at query points for each sample of the filter transient response the interpolation procedure has been used. If the value of x 1 is equal to unity, the variation of the filter pole radius starts at the beginning of the filtering process. The coordinate x 4 = M should be interpreted as the time horizon of the pole radius variability. In Figure 1 the Béizer parametric curve that illustrates the variability of the pole radius of the considered notch filter is presented. In this figure all the control points are also indicated.
The values of r f i n a l depend on the notch filter frequency specification. In this paper it is assumed that the value of r f i n a l is equal to 0.995 . Such a value of the pole radius assures the bandwidth B W ¯ = 0.7957 Hz in the time-invariant case (for n > M ). The notch frequency of the proposed filter is set to f 0 = 50 Hz and the sampling frequency is f s = 500 Hz.

3.1. Starting Pole Radius

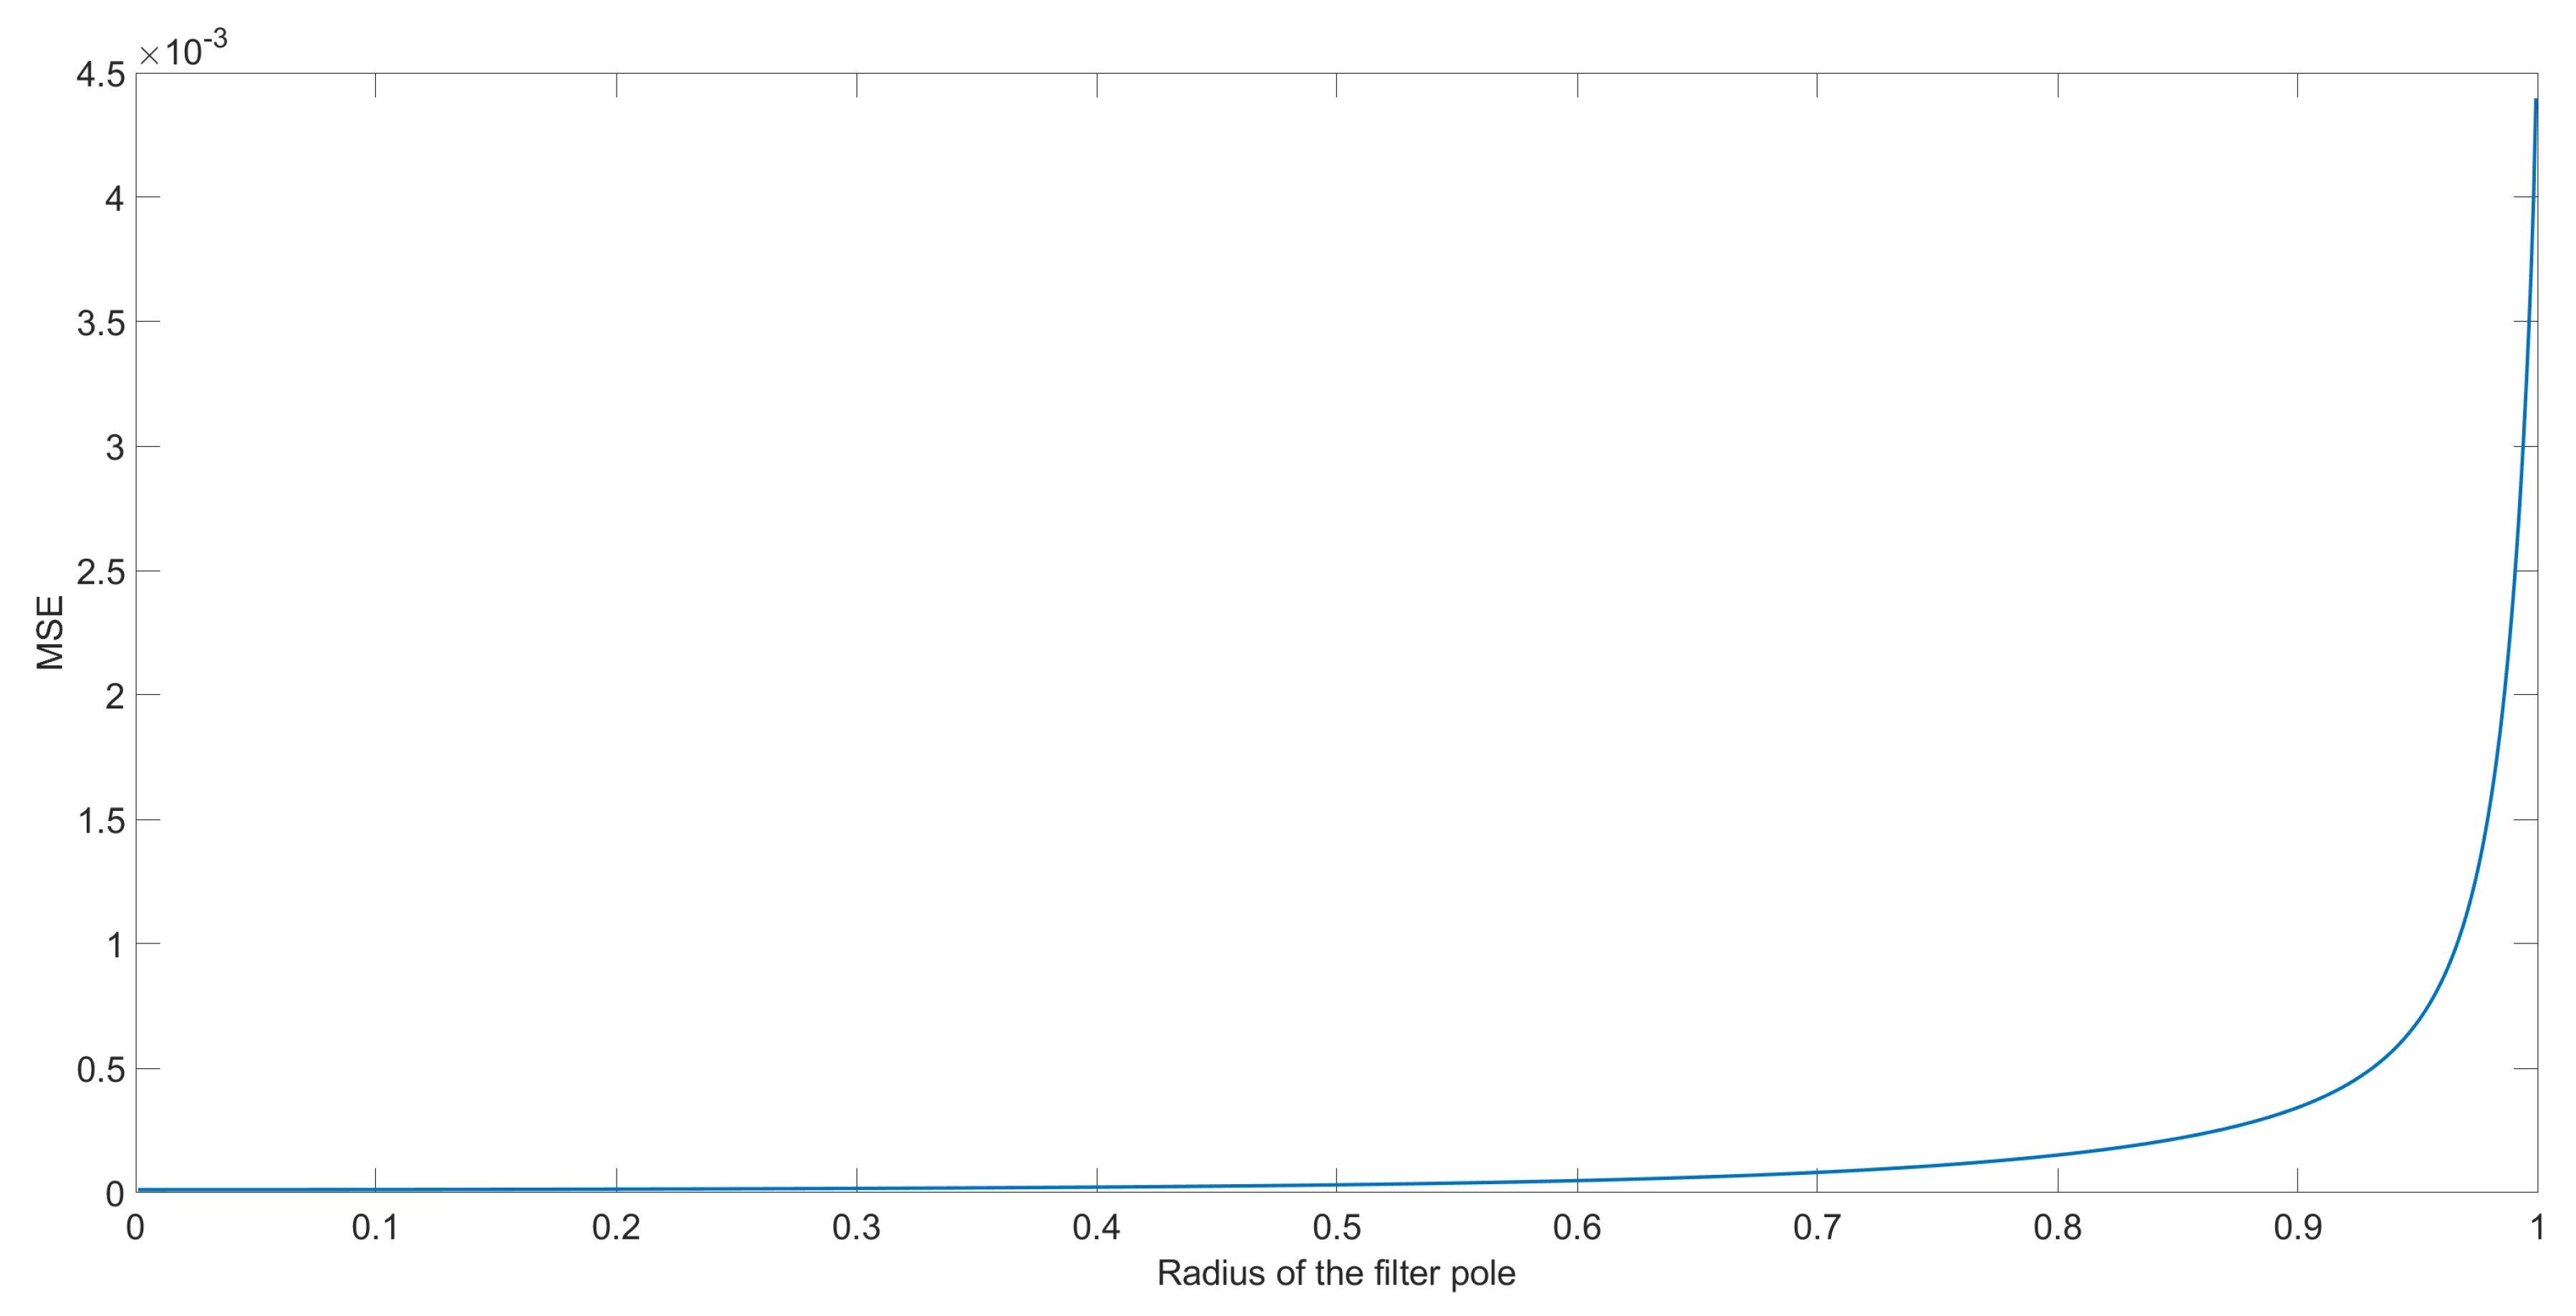
In this subsection, a method for selecting the value of r s t a r t is proposed. In order to select the starting value of the filter pole radius the mean square error for the time-invariant IIR notch filter with various pole radii has been calculated using the following formula:
M S E t i ( r ) = 1 K n = 1 K y ( n ) 2 ,
where K is the duration of the input signal and y ( n ) is the output of the filter. The useful signal s ( n ) used in the procedure for determining the value of the starting pole radius is equal to zero. Therefore, this signal has been omitted in Equation (10). In the considered procedure the 50 Hz sine wave signal is used as an input signal. The values of M S E t i ( r ) have been determined based on filtering the notch frequency sinusoidal signal using filters with pole radii from 0.01 to 0.999. The relationship between M S E t i ( r ) and the value of the pole radius is presented in Figure 2.
As one can notice, M S E t i ( r ) grows rapidly for r ( 0.9 , 1 ) 
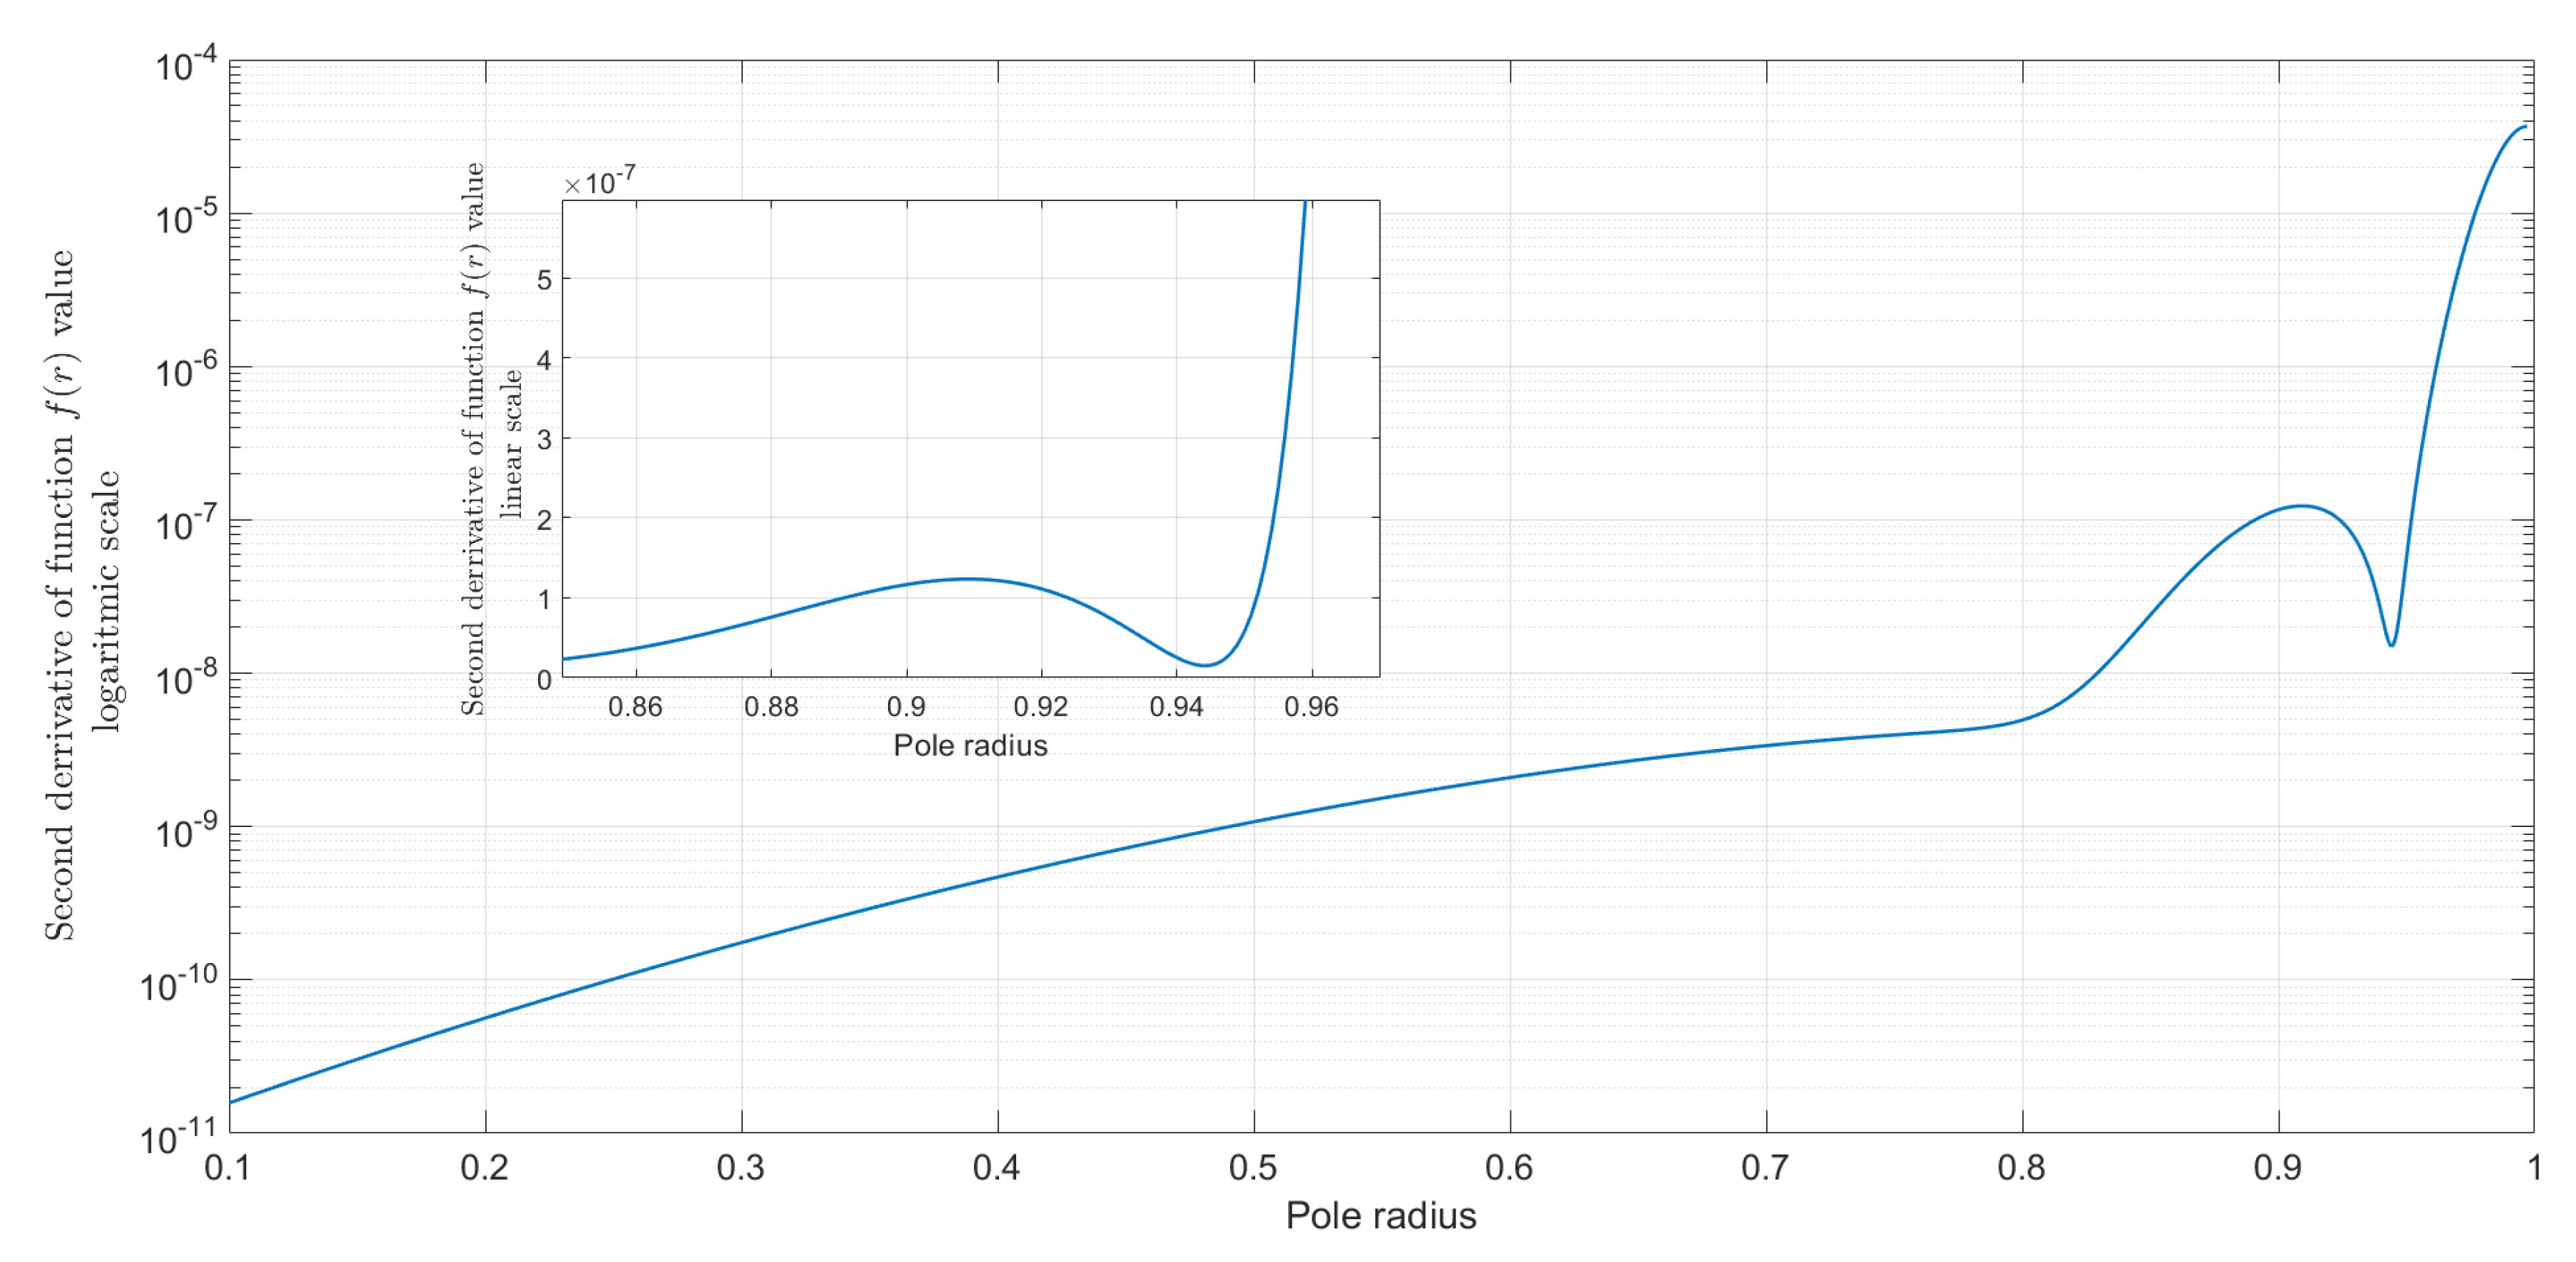
. In order to find a strategic value of the pole radius the second derivative of M S E t i ( r ) has been used. For this purpose a function that approximates the obtained M S E t i ( r ) has been derived. The proposed function is a sum of three exponential base functions, and has the following form:
f ( r ) = a · e r b c 2 + d · e r e f 2 + g · e r h i 2 ,
where a = 0.02678 , b = 928.9 , c = 25.43 , d = 0.0005132 , e = 886.1 , f = 61.95 , g = 0.0008081 , h = 1230 , and i = 402.6 . The second derivative of f ( r ) given by Equation (11) can be written as:
d 2 f ( r ) d r 2 = 2 a · e r b c 2 c 2 2 d · e r e f 2 f 2 2 g · e r h i 2 i 2 +
a · e r b c 2 ( 2 b 2 r ) 2 c 4 + d · e r e f 2 ( 2 e 2 r ) 2 f 4 + g · e r h i 2 ( 2 h 2 r ) 2 i 4 .
In Figure 3 the second derivative of f ( r ) on the interval between r = 0.1 and r = 0.999 is depicted. The value of r s t a r t has been chosen as the pole radius for which the function given by Equation (12) approaches the local minimum. All important parameters of the proposed notch filter with time-varying pole radius are presented in Table 2.

3.2. Quality Indices of Filtering

For the purpose of the qualitative evaluation of the presented filtering algorithm, the following performance indices were taken into account:
  • SNR improvement [14,15]
    S N R i = 10 · log 10 i = 1 K ( x ( i ) s ( i ) ) 2 i = 1 K ( y ( i ) s ( i ) ) 2 ,
  • cross-correlation coefficient related to the original and filtered signal
    ρ = i = 1 K ( y ( i ) · s ( i ) ) i = 1 K y ( i ) 2 · i = 1 K s ( i ) 2 ,
  • percentage root mean square difference
    P R D = i = 1 K ( s ( i ) y ( i ) ) 2 i = 1 K s ( i ) 2 .
  • mean square error defined by Equation (8).
In the above defined indices, K is the number of signal samples of the filter input signal under consideration, x ( n ) is the input signal to be filtered, y ( n ) is the filter output signal, and s ( n ) denotes the original input signal without disturbances.

4. Results

Computer simulations of the proposed second order notch IIR filter with time-varying pole radius have been made using the Mathworks Matlab 2018b. The considered notch filter with reduced transient response has been tested using ECG signals uploaded from the MIT–BIH database (Massachusetts Institute of Technology–Beth Israel Hospital). The proposed notch filter with time-varying pole radius has been used to remove the 50 Hz powerline interference from above mentioned ECG signals. The sampling rate of the processed signal was equal to 500 Hz.

4.1. ECG Filtering

In the first step, the evaluation and quantitative comparison of the performance of ECG denoising processes for three various ECG signals were carried out. The results are presented in Table 3. For each signal four simulations have been done. The ECGs start at a different signal feature point in each simulation. The main aim of the proposed filtering algorithm is to work out the denoised ECG signal as fast as possible. The portion of the ECG signal lost on the transient response may impede appropriate measures.
As one can notice, the proposed IIR notch filter with time-varying pole radius outperformed the traditional time-invariant filter structure in all considered cases. The value of index SNR i m p for the proposed time-varying filter was greater for each simulation than in the time-invariant filter case. Moreover, the values of the cross-correlation coefficient ρ , percentage root mean square difference index, and mean square error index show that the proposed parameter-varying notch filter is definitely better if compared to the traditional filter with time-invariant pole radius. In Figure 4, Figure 5 and Figure 6 the results of simulations are presented.

4.2. Bézier Function vs. Exponential Function

In the present subsection a comparison between the pole radius variation procedures based on Bézier parametric curve and exponential function is presented. The exponential function of the pole radius proposed in [12] is defined in the following form:
r ( n ) = r f i n a l 1 + r s t a r t r f i n a l 1 e n v f s ,
where v denotes the exponential variation of r ( n ) . In the first phase of the comparative analysis all the filters are tested using the 50 Hz notch frequency sinusoidal signal. Table 4 presents the comparison of the efficiency indices of the time-invariant notch filter and time-varying filters based on the Bézier parametric curve and exponential function. Figure 7 and Figure 8 present output signals of the considered filters.
In the second phase of the comparative analysis all the considered filters are tested using the ECG signal distorted by the 50 Hz powerline interference. In Figure 9 and Figure 10 the results of filtering are presented. As one can notice, the proposed notch filter based on the Bézier parametric curve is characterized by a much shorter transient response if compared to the filter based on the exponential pole radius variability. The advantages of the filter based on the Bézier curve are also reflected in all quality indices listed in Table 5.

4.3. Signal to Noise Ratio Analysis

In this subsection the influence of the signal to noise ratio with regard to the filtering efficiency is analyzed. During the tests the ECG signal was distorted by the 50 Hz powerline interference of various strengths. The signal to noise ratio (SNR) is defined as follows:
S N R = 10 log 10 i = 1 N x ( i ) 2 i = 1 N d ( i ) 2 ,
where N denotes the signal length, x ( i ) is the input noised signal, and d ( i ) denotes the sinusoidal interference given by the following equation:
d ( n ) = A sin ( ω n + ϕ ) ,
where A is the ampliude of the intereference, ω denotes the frequency of the interference, and ϕ is the phase shift. In Table 6 the values of the mean square error for all tested SNRs are presented. Small value of the MSE means that the notch filter output y ( n ) is close to the original ECG signal s ( n ) .
In Table 7 values of the percentage root mean square difference for all tested SNRs are presented.
Table 8 presents cross-correlation coefficients for tested cases. The closer the ρ index is to unity, the stronger the correlation between the filter output signal and the original ECG signal. The filter based on Bézier curve pole radius variability achieves the highest values of the cross-correlation coefficient if compared to the traditional time-invariant filter and the time-varying filter based on exponential function proposed in [12].
Table 9 presents the SNR improvement indices for all cases. The SNR improvement index can be interpreted as a comparison of the level of a desired signal and the background noise. A larger value of the S N R i implies a smaller level of the noise.

5. Conclusions

In the paper, a concept of the second order time-varying IIR notch filter with reduced transient response based on the Bézier curve pole radius variability is presented. Thanks to the Bézier curve we are able to generate the function that changes the pole radius in a more flexible manner if compared to the exponential function. The proposed filtering algorithm is able to suppress the transient response much better than the traditional time-invariant filter and the filter based on the exponential pole radius variability. The proposed filter with suppressed transient response is able to process input signals faster than traditional solutions. As an example, the proposed notch filter has been successfully used to suppress the powerline interference from ECG signals. The performance of the considered filter structure has been evaluated using four different indices. Future works will be devoted to the implementation of the proposed filter structure. For example we are going to use the concept of coupled form second order sections [16,17,18] in our analysis and implementation works, in particular in case of using short word-length fixed-point binary arithmetic.

Author Contributions

Conceptualization, J.P. and S.K.; methodology, J.P. and S.K.; software, S.K.; validation, J.P., and S.K.; formal analysis, J.P.; investigation, S.K.; resources, S.K.; data curation, S.K.; writing—original draft preparation, S.K.; writing—review and editing, J.P.; visualization, S.K.; supervision, J.P.

Funding

This research received no external funding.

Acknowledgments

The paper is dedicated to the memory of Professor Roman Kaszyński, who was one of the pioneers of the theory of time-varying filters.

Conflicts of Interest

The authors declare no conflict of interest.

Abbreviations

The following abbreviations are used in this manuscript:
ECGelectrocardiogram
EEGelectroencephalogram
EMGelectromyogram
GSMglobal system for mobile communications
IIRinfinite impulse response
MSEmean square error

References

  1. Hunek, W.P.; Majewski, P. Perfect reconstruction of signal—A new polynomial matrix inverse approach. EURASIP J. Wirel. Commun. Netw. 2018, 2018, 107. [Google Scholar] [CrossRef]
  2. Izydorczyk, J. An algorithm for optimal terms allocation for fixed point coefficients of FIR filter. In Proceedings of the 2006 IEEE International Symposium on Circuits and Systems, Island of Kos, Greece, 21–24 May 2006; pp. 609–612. [Google Scholar]
  3. Sodhro, A.H.; Sangaiah, A.K.; Sodhro, G.H.; Lohano, S.; Pirbhulal, S. An Energy-Efficient Algorithm for Wearable Electrocardiogram Signal Processing in Ubiquitous Healthcare Applications. Sensors 2018, 18, 923. [Google Scholar] [CrossRef] [PubMed]
  4. Claesson, I.; Rossholm, A. Notch Filtering of humming GSM mobile telephone noise. In Proceedings of the 5th International Conference on Information Communications & Signal Processing, Bangkok, Thailand, 6–9 December 2005; pp. 1320–1323. [Google Scholar]
  5. Pang, B.; He, Y.; Tang, G.; Zhou, C.; Tian, T. Rolling Bearing Fault Diagnosis Based on Optimal Notch Filter and Enhanced Singular Value Decomposition. Entropy 2018, 20, 482. [Google Scholar] [CrossRef]
  6. Zucker, H. Time domain analysis and synthesis of notch filters. Bell Syst. Tech. J. 1974, 53, 283–304. [Google Scholar]
  7. Jaskula, M.; Kaszynski, R. Using the parametric time-varying analog filter to average-evoked potential signals. IEEE Trans. Instrum. Meas. 2004, 53, 709–715. [Google Scholar] [CrossRef]
  8. Gutierrez de Anda, M.A.; Meza Dector, I. A Second-Order Lowpass Parameter-Varying Filter Based on the Interconnection of First-Order Stages. IEEE Trans. Circuits Syst. I Reg. Pap. 2011, 58, 1840–1853. [Google Scholar] [CrossRef]
  9. Toledo de la Garza, K.; Torres Gómez, J.; de Lamare, R.C.; Fernández-Getino García, M.J. A Variational Approach for Designing Infinite Impulse Response Filters With Time-Varying Parameters. IEEE Trans. Circuits Syst. I Reg. Pap. 2018, 65, 1303–1313. [Google Scholar] [CrossRef]
  10. Kocon, S.; Piskorowski, J. Digital Finite Impulse Response Notch Filter with Non-Zero Initial Conditions, Based on an Infinite Impulse Response Prototype Filter. Metrol. Meas. Syst. 2012, XIX, 767–776. [Google Scholar] [CrossRef]
  11. Pei, S.-C.; Tseng, C.-C. Elimination of AC interference in electrocardiogram using IIR notch filter with transient suppression. IEEE Trans. Biomed. Eng. 1995, 42, 1128–1132. [Google Scholar]
  12. Piskorowski, J. Digital Q-Varying Notch IIR Filter with Transient Suppression. IEEE Trans. Instrum. Meas. 2010, 59, 866–872. [Google Scholar] [CrossRef]
  13. Tan, L.; Jiang, J.; Wang, L. Pole-Radius-Varying IIR Notch Filter with Transient Suppression. IEEE Trans. Instrum. Meas. 2012, 61, 1684–1691. [Google Scholar] [CrossRef]
  14. Kabir, M.A.; Shahnaz, C. Denoising of ECG signals based on noise reduction algorithms in EMD and wavelet domains. Biomed. Signal Process. Control 2012, 7, 481–489. [Google Scholar] [CrossRef]
  15. Gupta, R.; Mitra, M.; Bera, J. ECG Acquisition and Automated Remote Processing; Springer: New Delhi, India, 2014. [Google Scholar]
  16. Erickson, K.T.; Michel, A.N. Stability Analysis of Fixed-Point Digital Filters Using Computer Generated Lyapunov Functions-Part I: Direct Form and Coupled Form Filters. IEEE Trans. Circuits Syst. 1985, CAS-32, 132–142. [Google Scholar] [CrossRef]
  17. Sarcinelli-Filho, M.; Mota, F.C. On the Stability of Coupled-Form State-Space Digital Filters with Quantization before Summation. In Proceedings of the IEEE 43rd Midwest Symposium on Circuits and Systems, Lansing, MI, USA, 8–11 August 2000; Volume 3, pp. 1202–1205. [Google Scholar]
  18. Lyons, R. Improved narrowband low-pass IIR filters in fixed-point systems [DSP Tips & Tricks]. IEEE Signal Process. Mag. 2009, 26, 128–132. [Google Scholar]
Figure 1. The Béizer curve and control points for the pole radius variability.
Applsci 09 01309 g001
Figure 2. Mean square error with various filter pole radius.
Applsci 09 01309 g002
Figure 3. The second derivative of the approximation function f ( r ) .
Applsci 09 01309 g003
Figure 4. Comparison between time-invariant infinite impulse response (IIR) notch filter and the proposed time-varying filter. Testing signal ECG 1 starts at various featured points.
Applsci 09 01309 g004
Figure 5. Comparison between time-invariant IIR notch filter and the proposed time-varying filter. Testing signal ECG 2 starts at various featured points.
Applsci 09 01309 g005
Figure 6. Comparison between time-invariant IIR notch filter and the proposed time-varying filter. Testing signal ECG 3 starts at various featured points.
Applsci 09 01309 g006
Figure 7. Comparison of the time-invariant IIR filter and the proposed time-varying filter based on Bézier curve.
Applsci 09 01309 g007
Figure 8. Comparison of the time-varying filters based on the Bézier parametric curve and exponential function.
Applsci 09 01309 g008
Figure 9. Comparison of the time-invariant IIR filter and the proposed time-varying filter based on Bézier curve.
Applsci 09 01309 g009
Figure 10. Comparison of the time-varying filters based on the Bézier parametric curve and exponential function.
Applsci 09 01309 g010
Table 1. Settling time and bandwidth in the function of the pole radius.
Pole RadiusSettling Time [s]Bandwidth [Hz]
0.20000.0080127.3239
0.40000.010095.4929
0.50000.016079.5774
0.60000.018063.6619
0.70000.026047.7464
0.80000.038031.8309
0.90000.076015.9154
0.99000.77601.59154
0.99907.82600.1591
0.999978.23600.0159
Table 2. Parameters of the proposed notch filter with time-varying pole radius.
ParameterValue
Sampling frequency f s 500 Hz
Notch frequency f 0 50 Hz
Starting pole radius r s t a r t 0.944
Final pole radius r f i n a l 0.995
Starting bandwidth B W ¯ s t a r t 8.9127 Hz
Final bandwidth B W ¯ f i n a l 0.7958 Hz
Variation horizon M200 samples
Bézier curve control points
B 1 (0, r s t a r t )
B 2 (0.9770, 132.6)
B 3 (0.9776, 198.1)
B 4 (M, r f i n a l )
Table 3. Results of numerical experiments for various ECG signals.
ECG SignalSNR imp Time InvariantSNR imp Time Varying ρ Time Invariant ρ Time VaryingPRD Time InvariantPRD Time VaryingMSE Time InvariantMSE Time Varying
ECG 1, Q point start3.14194.19370.98880.99120.15200.13460.02310.0181
ECG 1, R point start3.32754.52260.98930.99190.14790.12880.02190.0166
ECG 1, J point start3.70475.23970.99170.99420.12960.10860.01680.0118
ECG 1, T point start3.63945.10260.99130.99380.13170.11130.01730.0124
ECG 2, Q point start2.66363.45530.99450.99540.10480.09560.01100.0091
ECG 2, R point start2.82503.71450.99480.99570.10210.09220.01040.0085
ECG 2, J point start3.20234.36830.99580.99680.09260.08090.00860.0065
ECG 2, T point start2.95353.93700.99520.99620.09890.08840.00980.0078
ECG 3, Q point start3.35714.54310.97840.98350.20860.18200.04350.0331
ECG 3, R point start3.63335.05390.97980.98540.20040.17020.04020.0290
ECG 3, J point start3.92325.65270.98490.99000.17300.14180.02990.0201
ECG 3, T point start3.79675.37770.98410.98900.17750.14800.03150.0219
Table 4. Comparison of the efficiency of the time-invariant notch filter and time-varying filters based on the Bézier parametric curve and exponential function in case of sinusoidal input signal.
Filter StructureSNR imp ρ PRDMSE
Time-invariant filter12.97790.99800.06350.0040
Time-varying filter based on exponential function15.57730.99890.04710.0022
Proposed time-varying filter based on Bézier curve22.97250.99980.02010.0004
Table 5. Comparison of the efficiency of the time-invariant notch filter and time-varying filters based on the Bézier parametric curve and exponential function in case of distorted ECG input signal.
Filter StructureSNR imp ρ PRDMSE
Time-invariant IIR filter12.97790.99800.06350.0040
Time-varying filter based on exponential function3.23900.98540.63090.3981
Proposed time-varying filter based on Bézier curve22.97250.99980.02010.0004
Table 6. Comparison of the MSE for the time-invariant notch filter and time-varying filters based on the Bézier parametric curve and exponential function for various values of the signal to noise ratio (SNR).
SNR RatioTime-Invariant FilterTime-Varying Filter Based on Exponential FunctionProposed Time-Varying Filter Based on Bézier Curve
−4063.686639.429414.2554
−306.38083.95621.4377
−200.65070.40860.1564
−100.07780.05370.0284
−50.03430.02680.0187
00.02060.01820.0157
50.01630.01550.0147
100.01490.01470.0144
200.01430.01430.0143
Table 7. Comparison of the percentage root mean square difference for the time-invariant notch filter and time-varying filters based on the Bézier parametric curve and exponential function for various values of the SNR.
SNR RatioTime-Invariant FilterTime-Varying Filter Based on Exponential FunctionProposed Time-Varying Filter Based on Bézier Curve
−407.98046.27933.7756
−302.52601.98901.1990
−200.80670.63920.3955
−100.27900.23180.1686
−50.18530.16360.1368
00.14350.13500.1252
50.12750.12460.1213
100.12200.12110.1200
200.11970.11960.1195
Table 8. Comparison of the ρ index for the time-invariant notch filter and time-varying filters based on the Bézier parametric curve and exponential function for various values of the SNR.
SNR RatioTime-Invariant FilterTime-Varying Filter Based on Exponential FunctionProposed Time-Varying Filter Based on Bézier Curve
−400.12740.16120.2622
−300.37080.45230.6438
−200.77930.84340.9303
−100.96330.97420.9861
−50.98330.98690.9908
00.98990.99100.9923
50.99200.99230.9927
100.99260.99280.9929
200.99290.99290.9929
Table 9. Comparison of the SNR improvement index for the time-invariant notch filter and time-varying filters based on the Bézier parametric curve and exponential function for various values of the SNR.
SNR RatioTime-Invariant FilterTime-Varying Filter Based on Exponential FunctionProposed Time-Varying Filter Based on Bézier Curve
−4016.956619.038923.4573
−3016.948419.024423.4205
−2016.865018.886123.0565
−1016.104017.713320.4802
−514.698715.782117.3341
012.047012.578913.2365
58.45808.65968.8949
104.86984.93605.0142
200.81360.81900.8265

