Article

Building Damage Detection from Post-Event Aerial Imagery Using Single Shot Multibox Detector

School of Information Science and Technology, North China University of Technology, Beijing 100144, China
*
Author to whom correspondence should be addressed.
Appl. Sci. 2019, 9(6), 1128; https://doi.org/10.3390/app9061128
Submission received: 22 January 2019 / Revised: 5 March 2019 / Accepted: 13 March 2019 / Published: 18 March 2019
(This article belongs to the Section Computing and Artificial Intelligence)

Abstract

:
Using aerial cameras, satellite remote sensing or unmanned aerial vehicles (UAV) equipped with cameras can facilitate search and rescue tasks after disasters. The traditional manual interpretation of huge aerial images is inefficient and could be replaced by machine learning-based methods combined with image processing techniques. Given the development of machine learning, researchers find that convolutional neural networks can effectively extract features from images. Some target detection methods based on deep learning, such as the single-shot multibox detector (SSD) algorithm, can achieve better results than traditional methods. However, the impressive performance of machine learning-based methods results from the numerous labeled samples. Given the complexity of post-disaster scenarios, obtaining many samples in the aftermath of disasters is difficult. To address this issue, a damaged building assessment method using SSD with pretraining and data augmentation is proposed in the current study and highlights the following aspects. (1) Objects can be detected and classified into undamaged buildings, damaged buildings, and ruins. (2) A convolution auto-encoder (CAE) that consists of VGG16 is constructed and trained using unlabeled post-disaster images. As a transfer learning strategy, the weights of the SSD model are initialized using the weights of the CAE counterpart. (3) Data augmentation strategies, such as image mirroring, rotation, Gaussian blur, and Gaussian noise processing, are utilized to augment the training data set. As a case study, aerial images of Hurricane Sandy in 2012 were maximized to validate the proposed method’s effectiveness. Experiments show that the pretraining strategy can improve of 10% in terms of overall accuracy compared with the SSD trained from scratch. These experiments also demonstrate that using data augmentation strategies can improve mAP and mF1 by 72% and 20%, respectively. Finally, the experiment is further verified by another dataset of Hurricane Irma, and it is concluded that the paper method is feasible.

1. Introduction

The rapid identification of the location of damaged buildings after disasters occur is crucial to search and damage relief. The images of aerial photography using drones have become increasingly stable and clear with the rapid development of unmanned aerial vehicle (UAV) and remote sensing technologies [1]. Aerial images have wider fields of view than ground search and rescue and can avoid the risk in ground search and rescue. If a manually evaluated image is used to evaluate a damaged area, large false and missed detections could occur owing to the influence of subjective human factors. Therefore, the processing of aerial images to identify and assess the extent of damage in an area is a challenging task.
Aerial photography obtains huge amounts of information and image segmentation technology must be applied for small object detection. The majority of the existing object detection methods applied to aerial images are implemented to distinguish objects from the background at a large scale, such as ships at sea [2], aircrafts at airports [3], and cars on highways [4]. Traditional machine vision methods, such as HOG [5], SIFT [6], and Haar [7], can achieve good results in such situations. Given the development of machine learning, researchers have combined traditional machine vision-based methods with shallow machine learning methods, such as support vector machines (SVM) [8]. However, the result of this method is extremely dependent on the effect of feature extraction. In addition, the post-disaster scenario is considerably complex, while key goals are difficult to extract using traditional machine vision methods. Target detection methods-based convolutional neural networks (CNNs), such as R-CNN [9], YOLO [10], and single-shot multibox detector (SSD) [11], have been dominantly used recently to address the aforementioned shortcomings by extracting deep features of images.
A good training model is primarily required because of the need for many labeled training samples. However, sufficient labeled samples are difficult to obtain immediately after a disaster, thereby resulting in the slow deployment of machine learning target detectors. Therefore, this study solves the problem of extremely few training samples and improves the accuracy of target recognition in post-disaster areas.
This research proposes the following method. (1) The SSD algorithm training model is used to detect and classify objects in images. (2) The VGG16 [12] convolution auto-encoder is constructed and trained to initialize the weights in SSD using the weight of the training. (3) Image mirroring, rotation, Gaussian noise, and Gaussian blur are applied to expand the training set.
The remainder of this paper is organized as follows. Section 2 discusses the recent related research. Section 3 describes the study area. Section 4 presents methods for pre-training weights and data expansion. Section 5 compares and discusses the results.

2. Relate Research

One of the main methods for detecting post-disaster damage using non-machine learning is damage detection based on synthetic aperture radar (SAR) [13]. Brunner et al. comprehensively used pre-disaster very high-resolution (VHR) optical and post-disaster SAR images to conduct a comparative test of determining whether a building is damaged [14]. Given the development of machine learning, some methods of shallow learning structure have been proposed. James Bialas et al. used a systematic approach to evaluate object-based image segmentation and machine learning algorithms for the classification of earthquake damage in remotely sensed imagery [15]. In addition, other machine learning methods, such as SVM, K-nearest neighbor, random forest, AdaBoost, and Naive Bayes, combine texture and geometric information to evaluate damages to buildings [16,17,18,19].
Compared with the traditional feature extraction method, CNN [20] does not need to extract specific manual features from the image for a specific task but simulate the human visual system to perform hierarchical abstraction processing on the original image to generate classification results. CNN has the advantages of strong applicability, simultaneous feature extraction and classification, strong generalization ability, and few global optimization training parameters [21]. Research has shown that the accuracy of classification can be improved by changing the network structure of CNN [22]. The scenario after a disaster is extremely confusing and has more complex features than normal scenarios [23]. Therefore, improving the classification accuracy is the key to obtaining the ideal detection accuracy. Quoc Dung Cao and Youngjun Choe used a CNN model to classify the post-disaster scene of Hurricane Harvey in 2017 and achieved good results [24].
However, the samples for training may be insufficient because a post-disaster image is difficult to obtain. Inoue and Hiroshi synthesized a new sample from one image by overlaying another image that was randomly chosen from the training data [25]. Pre-training a model is also a good method of improving the effect [26]. The model pre-trained by Mengyue Geng et al. on the ImageNet database has good generalization ability [27]. To obtain an improved model, this method inspired us to pre-train our own models.
The current study uses the SSD algorithms to identify and evaluate post-disaster buildings. The data augmentation method is adopted for solving the problem of having only a few training samples. The VGG16 convolutional encoder is trained to replace the trained weights with the VGG16 structure in SSD.

3. Materials and Methods

3.1. Study Areas

Hurricane Sandy is the second most costly hurricane in US history and resulted in nearly $70 billion in losses [28]. A total of 24 states were affected by this disaster. At least 650,000 houses were damaged or destroyed, with a total damage of approximately $50 billion [29].
In this study, a team from Drexel University used an aerial RGB camera to investigate the images of the New Jersey coastline. The resolution of the image is 1920 × 1080. The survey area was approximately 7.8 square kilometers. The survey area coverage was from the Seaside Height on the New Jersey coastline to the borough of Mantoloking. Figure 1 presents an aerial RGB image showing some debris (red circles) and partially damaged (yellow circle) buildings.
Hurricane Irma hit the US East Coast in September 2017. The NOAA remote sensing department collected images of the area [30]. The size of the Irma image is 18681 × 18681. The disaster scene caused by Hurricane Irma is shown in the Figure 2.
The Hurricane Sandy dataset was used for the next major work. The Hurricane Irma dataset was used to validate the proposed method at the end of the experiment.

3.2. Methodology

This study aims to improve the metrics of the target detection algorithm under a limited set of labels. The specific implementation is as follows.

3.2.1. Data Preparation

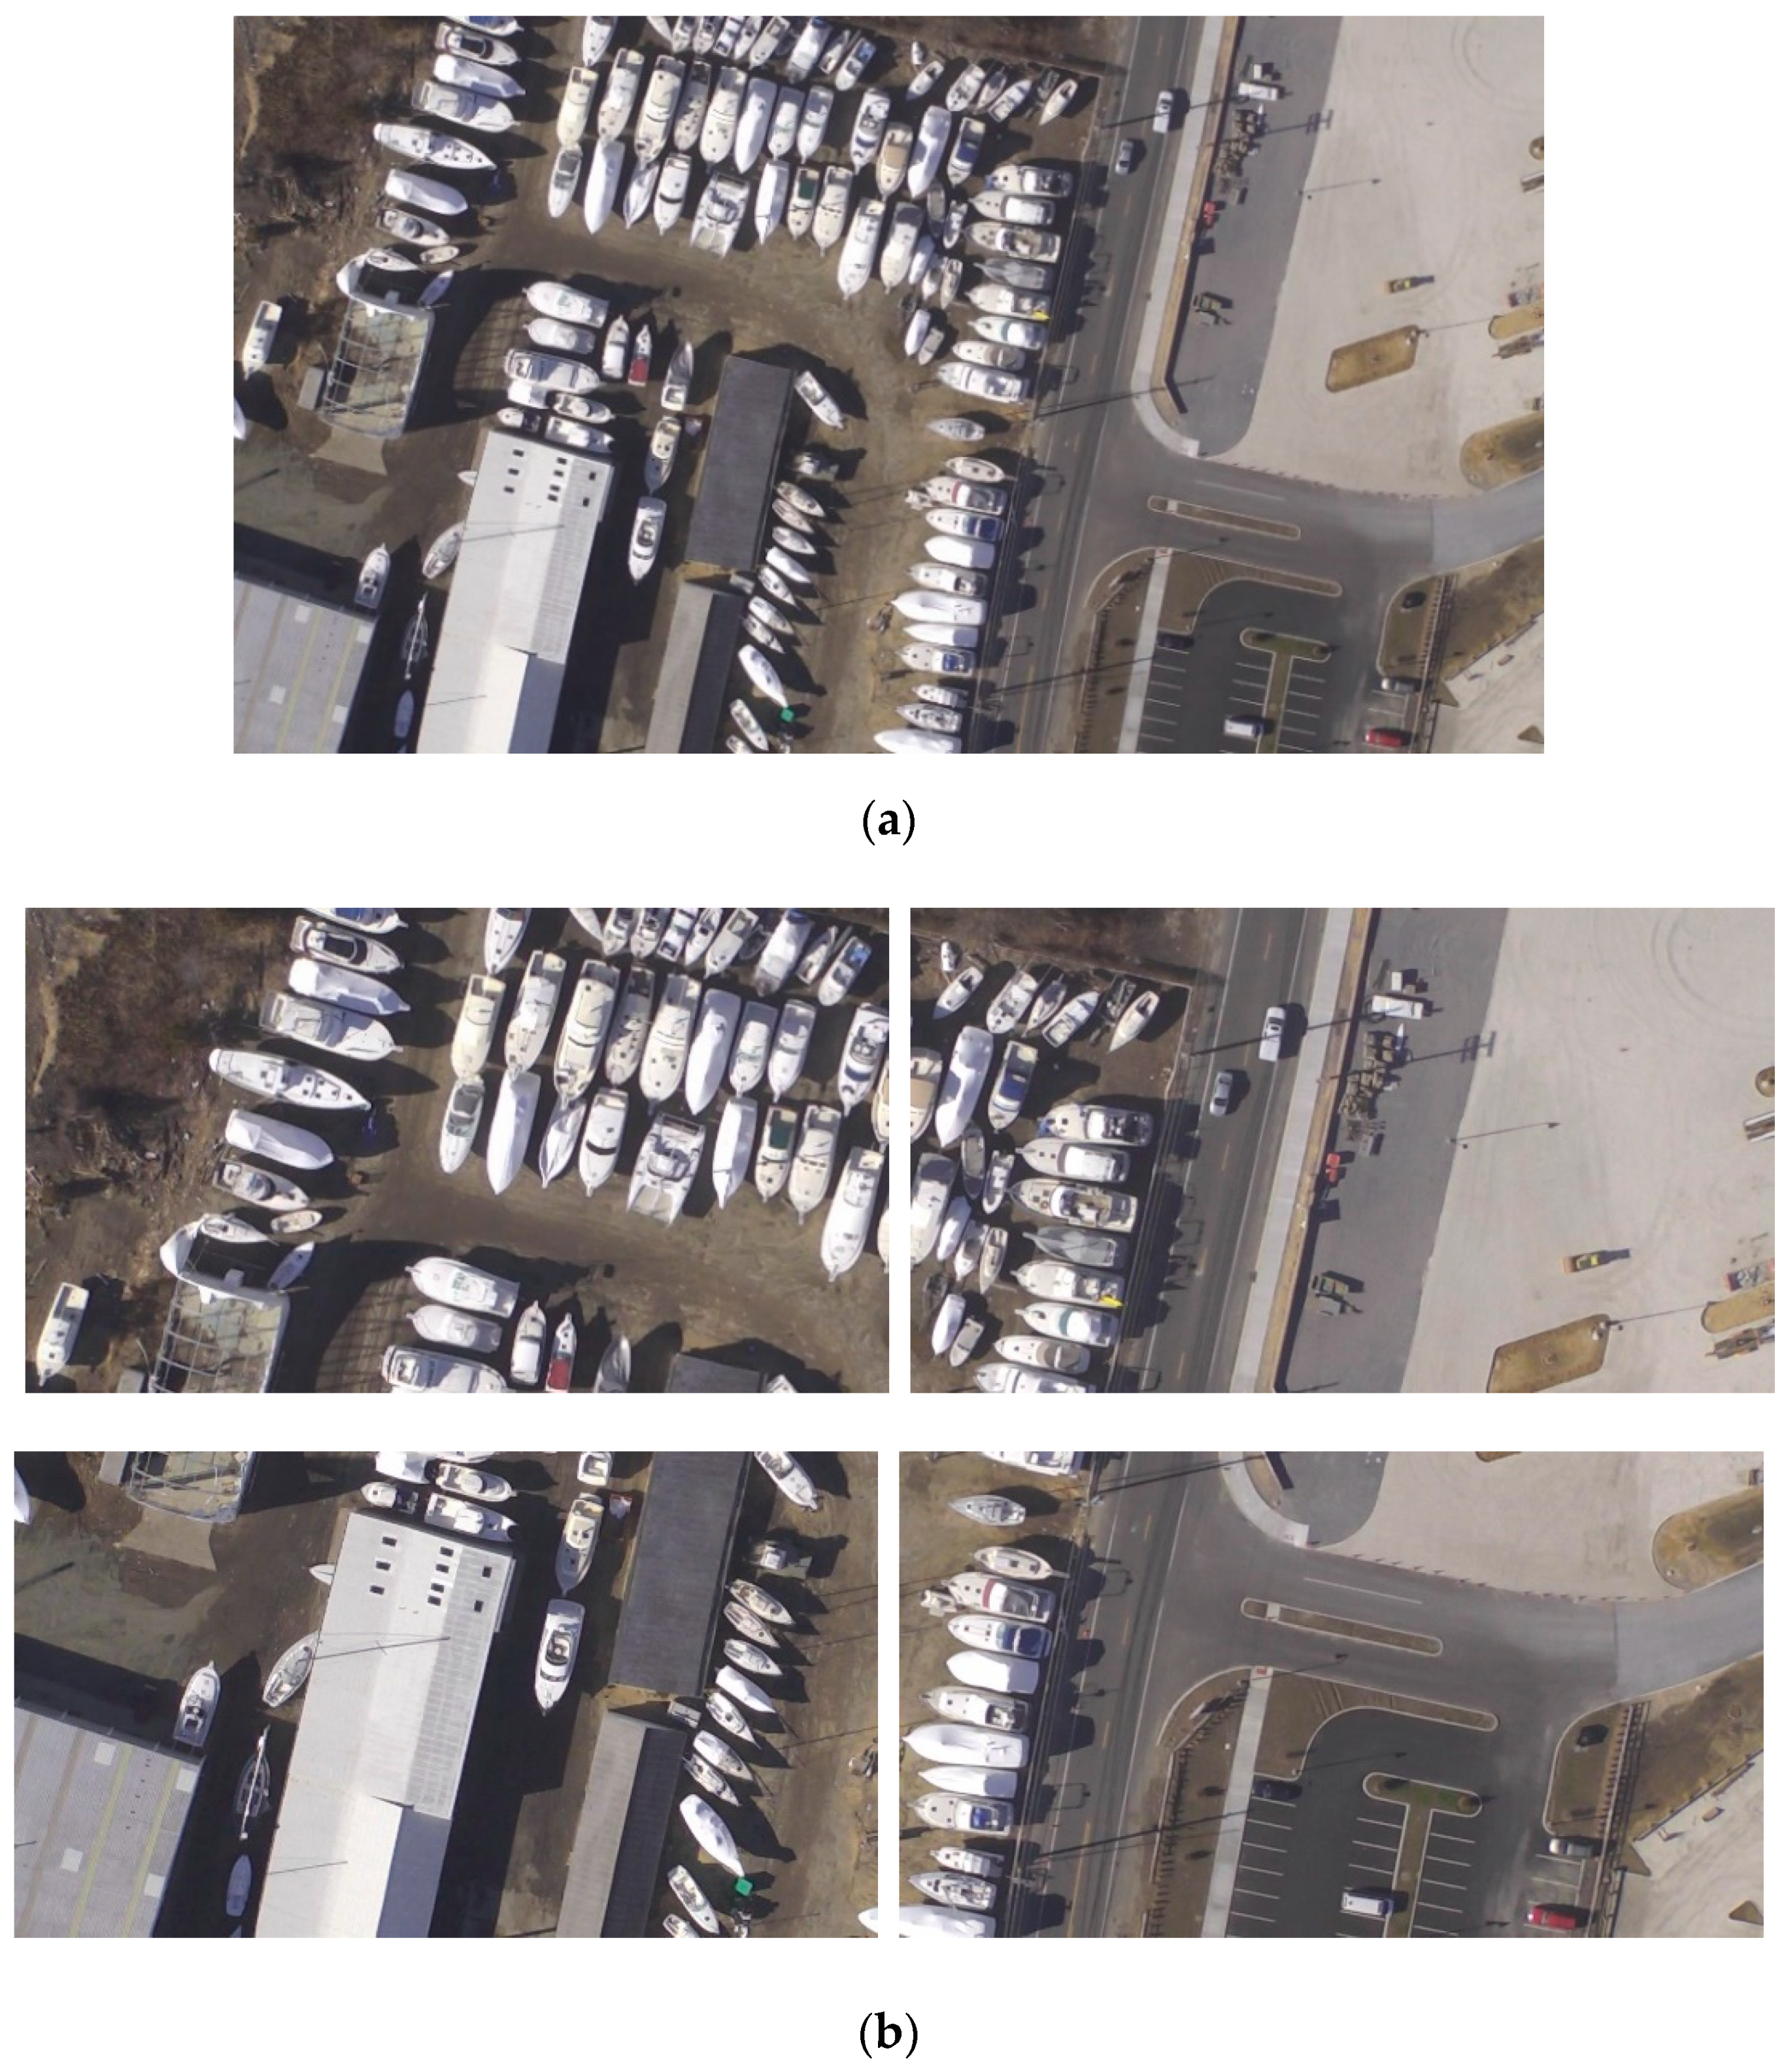
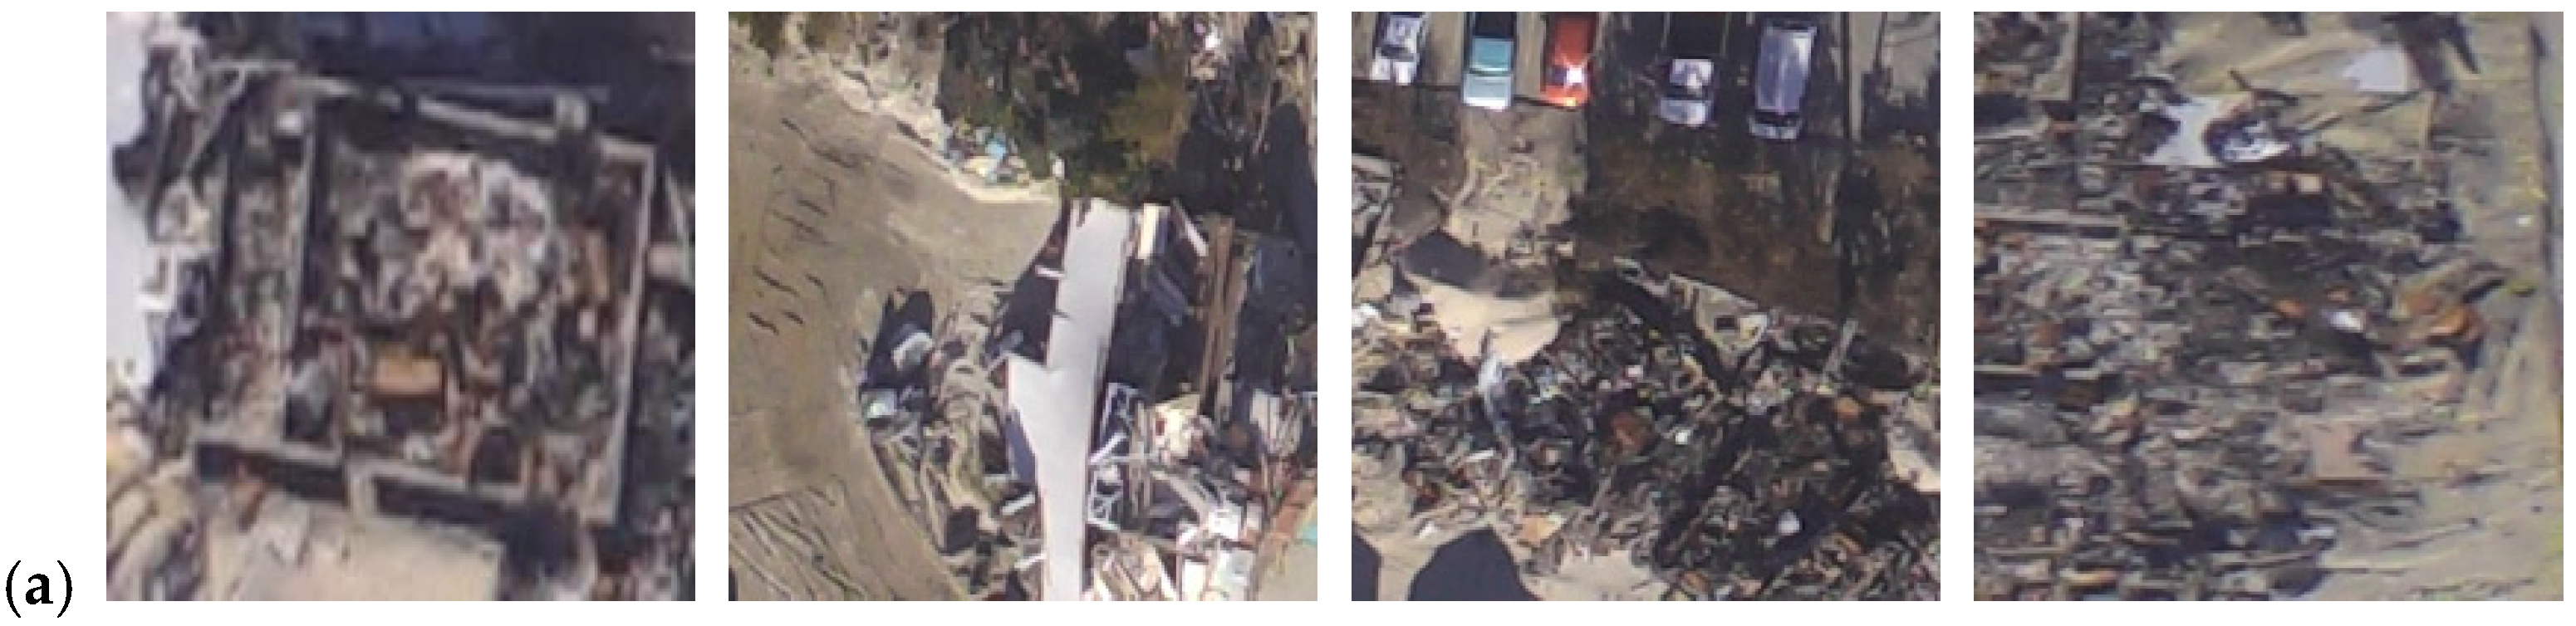
The raw data obtained consisted of 5041 aerial images with a resolution of 1920 × 1080 (see Figure 3a). Given that the original image had much information, each one is split into four equal parts and the resolution of each picture is 960 × 520 (see Figure 3b).
Approximately 20,000 images were obtained after splitting all the original images. Given that not all images contained information on damaged buildings or ruins, and some were irrelevant to this study, such as images of seas and beaches, these images were initially screened out manually. Lastly, approximately 500 images containing objects to be identified are obtained. Thereafter, 70% of the total number of images were selected as part of the training data set, while the remaining 30% were included in the test data set.
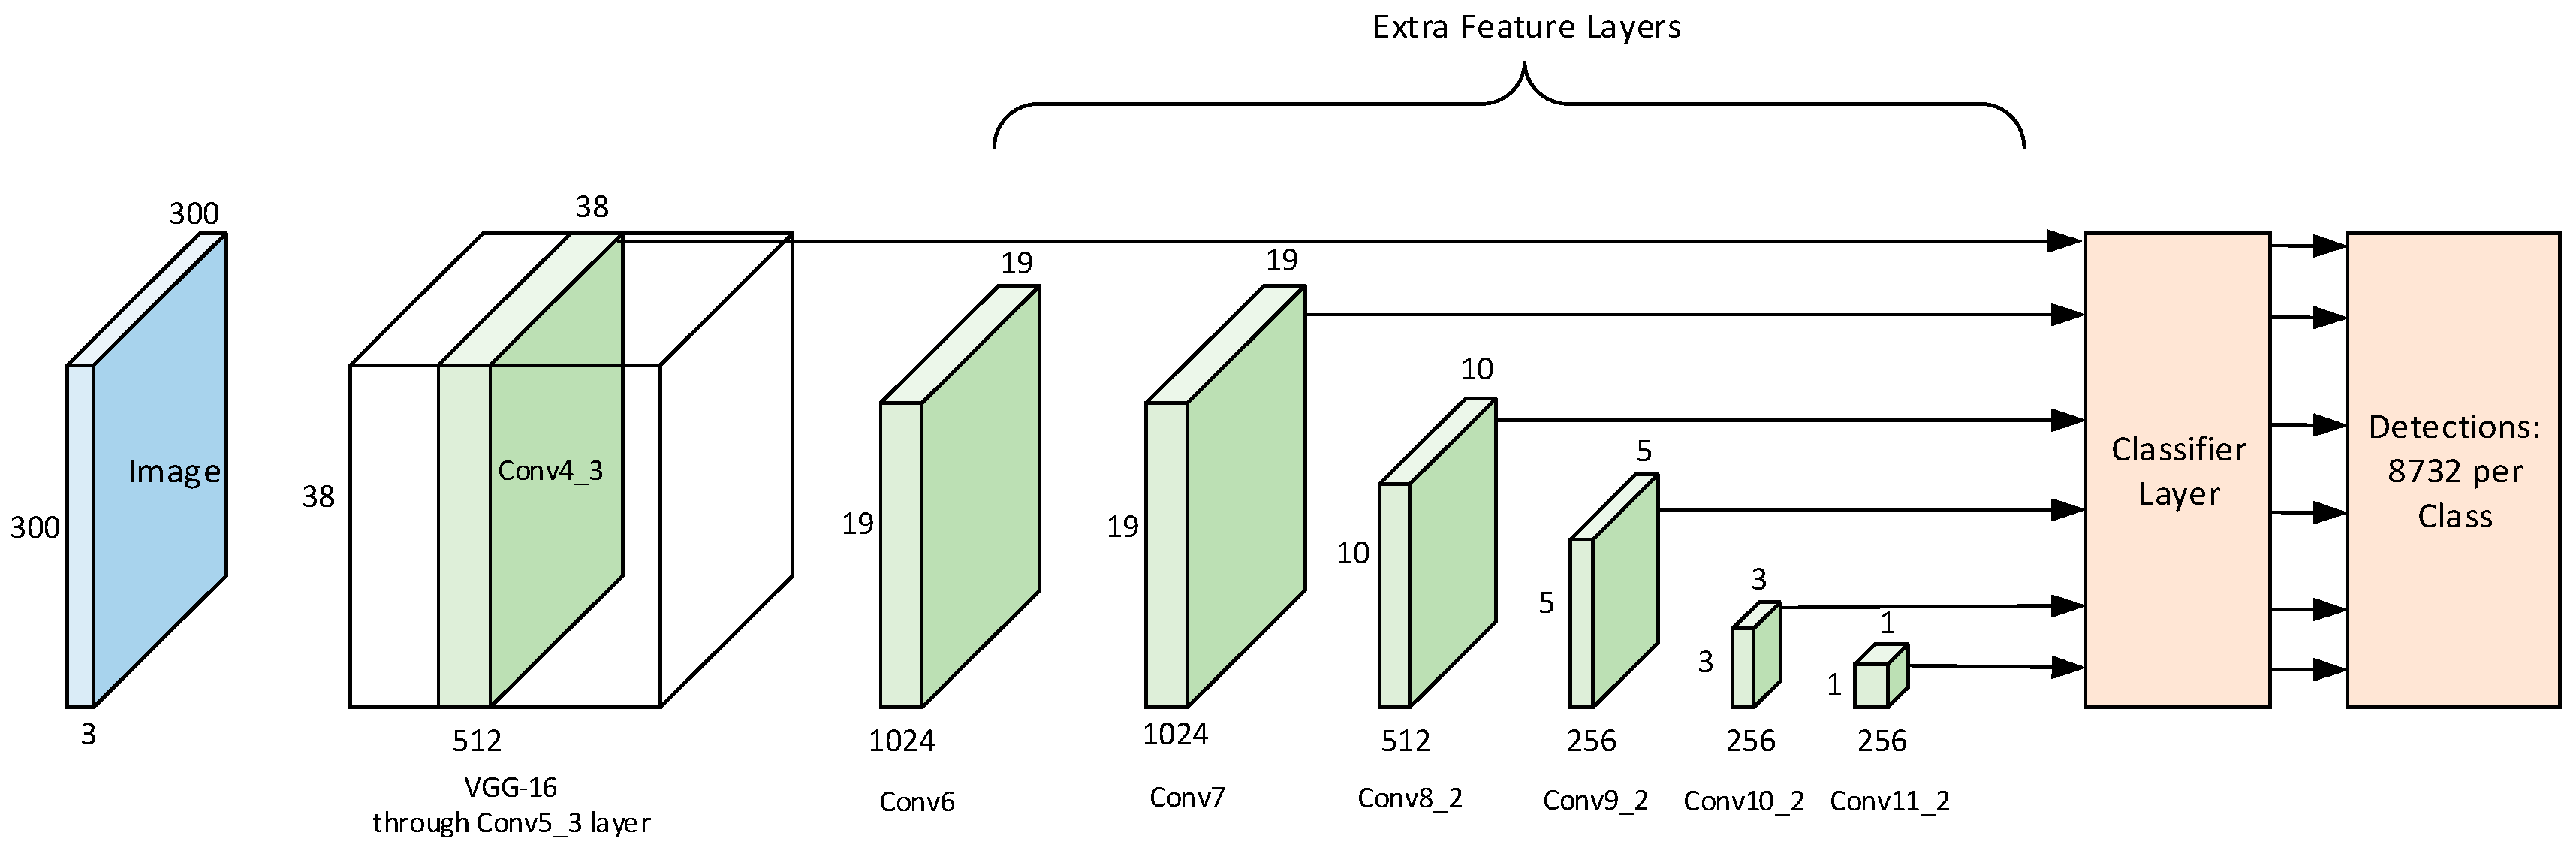
3.2.2. SSD Model

The core of the SSD method is the use of a small convolution filter to predict the class score and position offset of a fixed set of default bounding boxes on the feature map and clearly separate the prediction using the aspect ratio. Figure 4 shows the network model [11].
VGG-16 was used as the basic network to extract the feature information of the image, connecting multiple auxiliary convolution layers of decreasing size after VGG16 network. In order to obtain multi-scale detection prediction values, SSD selected six extra feature maps for detection, namely Conv4_3, Conv7, Conv8_2, Conv8_2, Conv9_2, Conv10_2, and Conv11_2. This way, we reduced the computational and memory requirements and the translation and scale invariance of the feature map on a certain scale. The specific position of the SSD design feature map is responsible for a specific area in the image and a specific object size. If we use m feature maps to make predictions, then the default box size in each feature map is calculated as follows:
S k = S m i n + S m a x S m i n m 1 ( k 1 )     k [ 1 , m ] ,
where S m i n   = 0.2 and S m a x   = 0.95, thereby representing the lowest and highest layer scales of 0.2 and 0.95, respectively.
If r = { 1 , 2 , 3 , 1 2 , 1 3 } represents the different aspect ratios of the default boxes, then the width and height of each default box are as follows:
W k a = S k a r ,
H k a = S k / a r .
The SSD network was based on the previously feed forward neural network (FFNN). It is capable of generating a set of fixed-size target location sets and target category scores for objects that exist in those target frames, and then using non-maximum suppression to produce the final results. In addition to the VGG16 base layer network, each additional feature layer used a set of convolution filters to obtain a fixed set of results. These convolution kernels either generated a score for a class or an offset from the object’s default frame position coordinates.

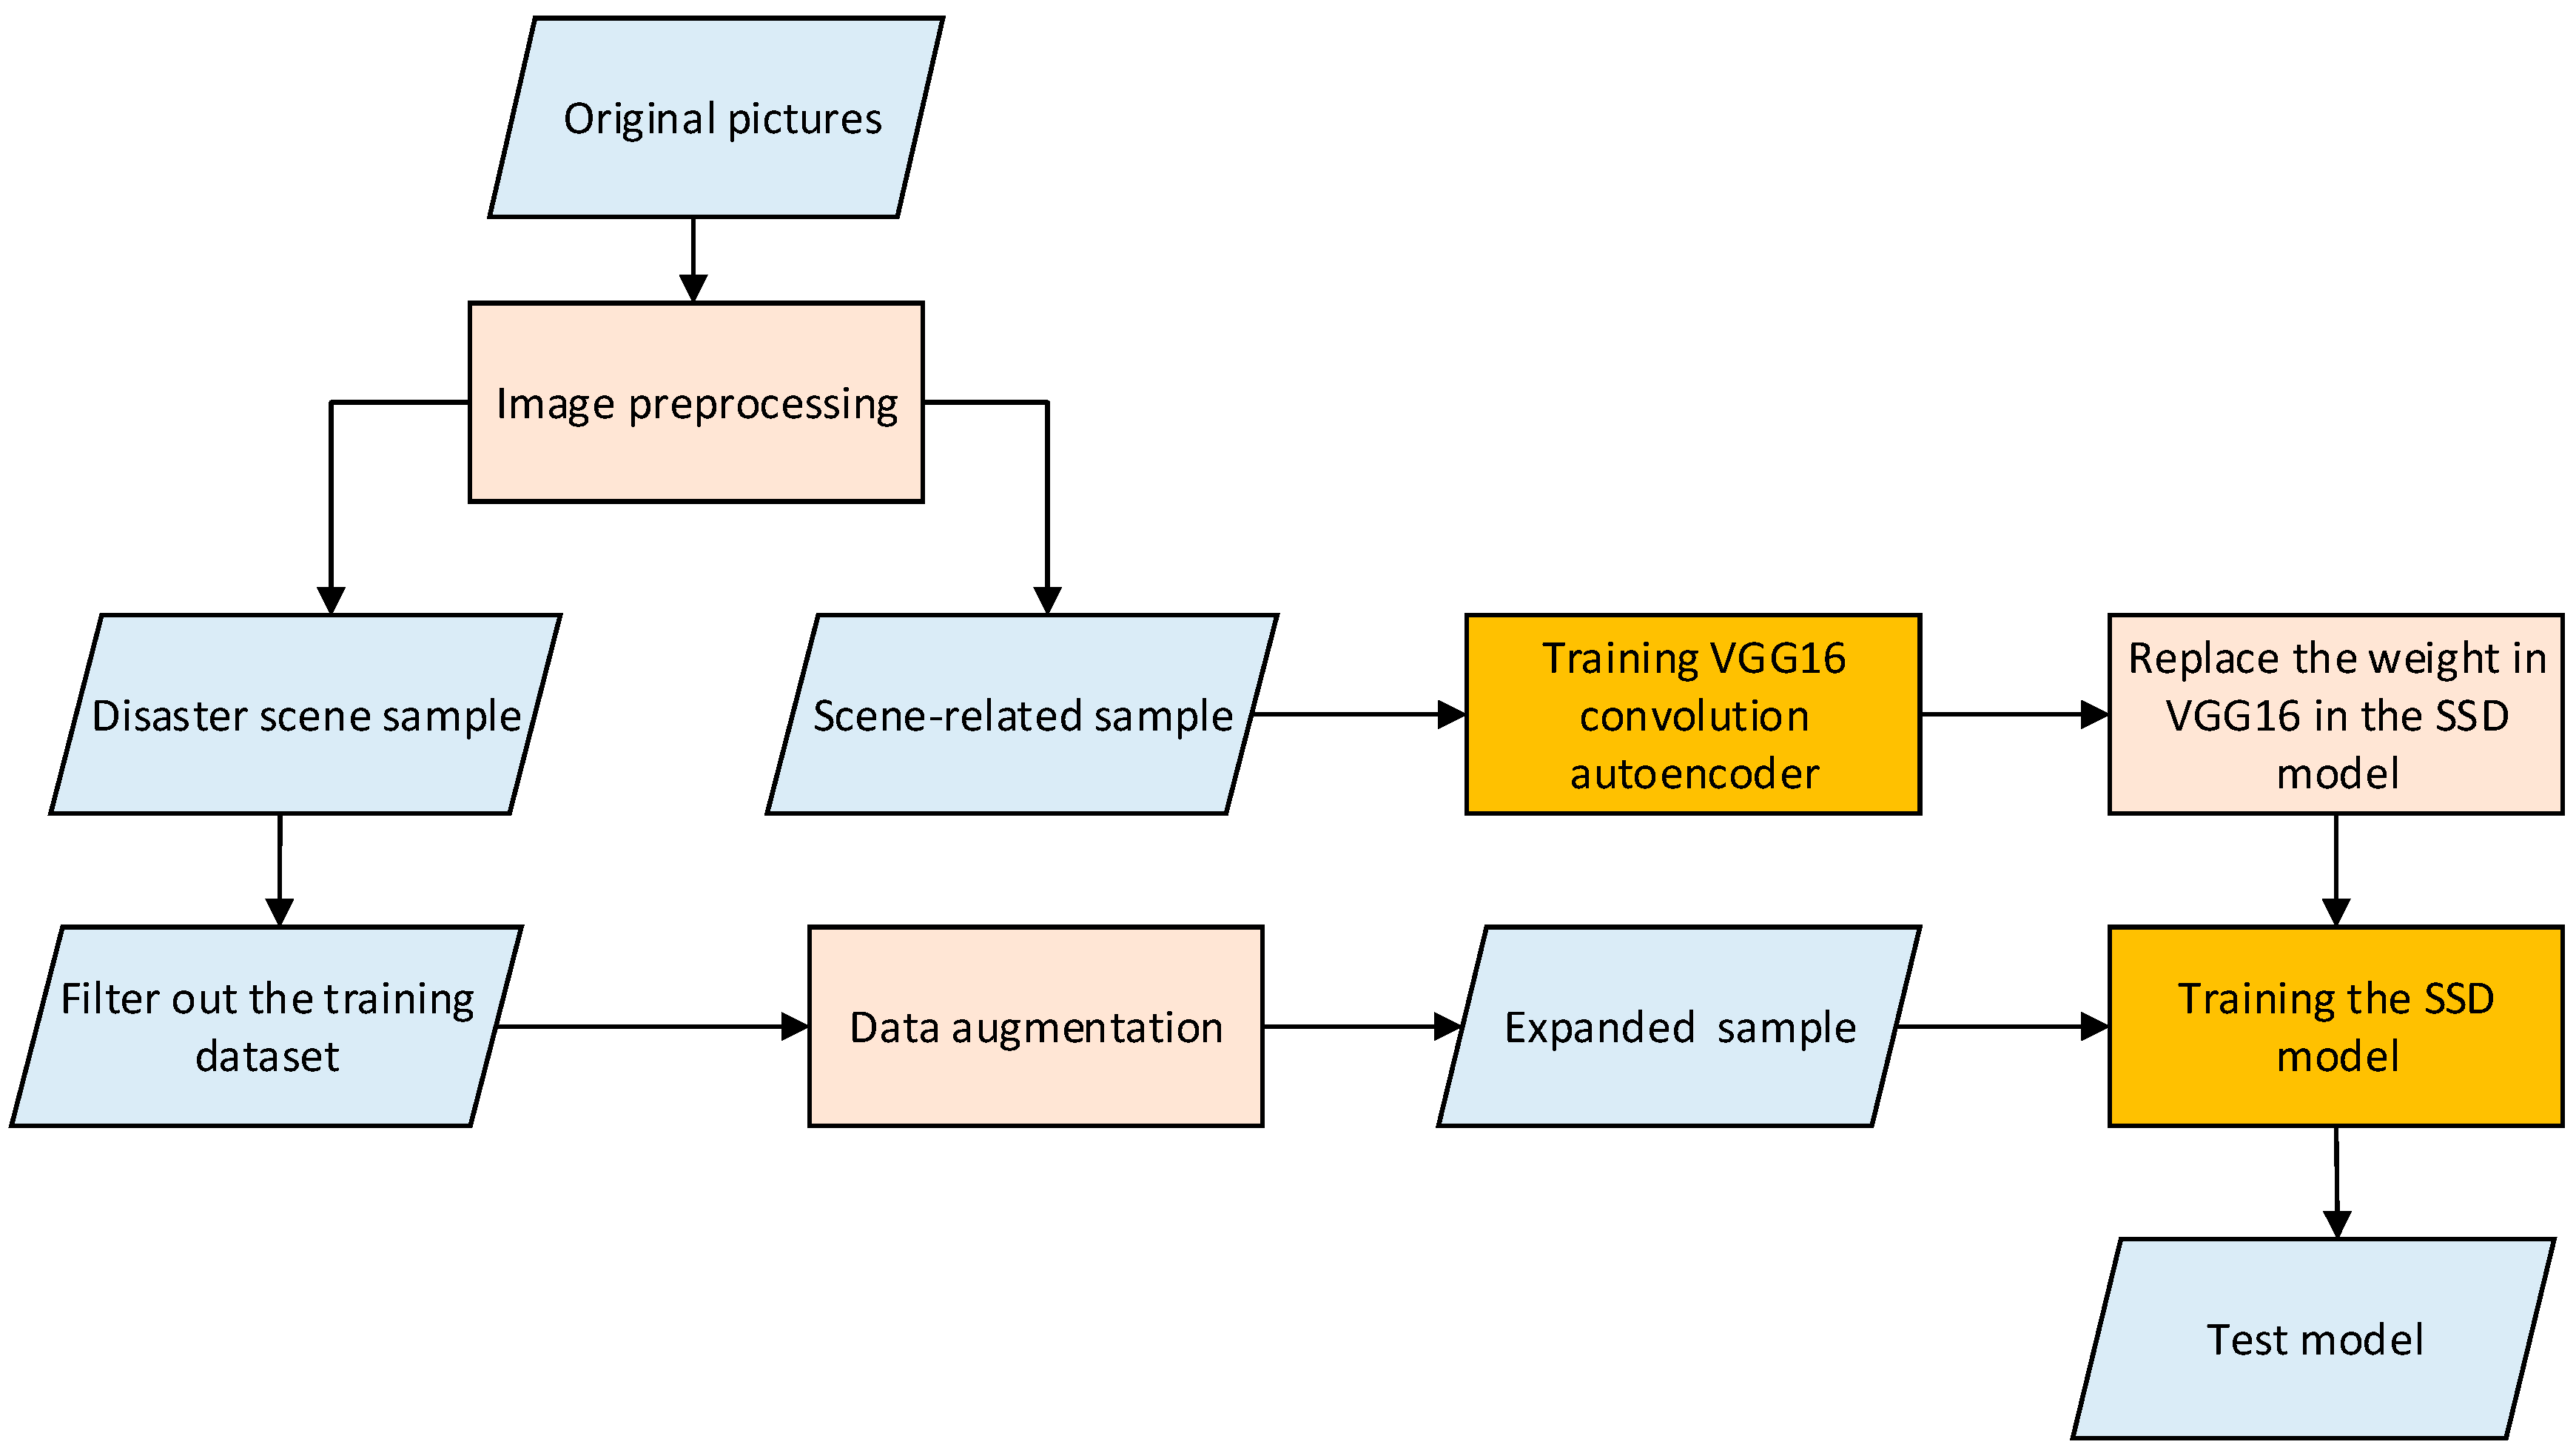
3.2.3. Proposed Method

After data pre-processing, we only obtained approximately 500 images containing valid labels. Accordingly, this total was insufficient to train the deep networks. This study proposed two strategies to address this limitation. (1) In pretraining, a convolutional auto-encoder (CAE) that consists of an encoder and a decoder was built. The encoder part was the same as the VGG16 network, while the decoder part was symmetrical to the encoder part. The CAE model was trained using many unlabeled samples that are easily obtained. Approximately 15,000 scene-related unlabeled samples were used in this study to train the VGG16 convolutional autoencoder. After training, the parameters of the encoder part are transferred to the counterpart of the proposed SSD model. (2) In data augmentation, the labeled training images were expanded to 5000 images via rotating, mirroring, Gaussian noise, and Gaussian blur, among others. Figure 5 shows the framework of the proposed method.
The purpose of convolution autoencoder creation was to use the convolution and pooling operations of CNNs to achieve the unsupervised feature invariant extraction. The use of the convolution auto-encoder to extract the feature weight of the background image related to the target detection to replace the weight of VGG16 in the pre-training SSD can make the trained model considerably convergent.
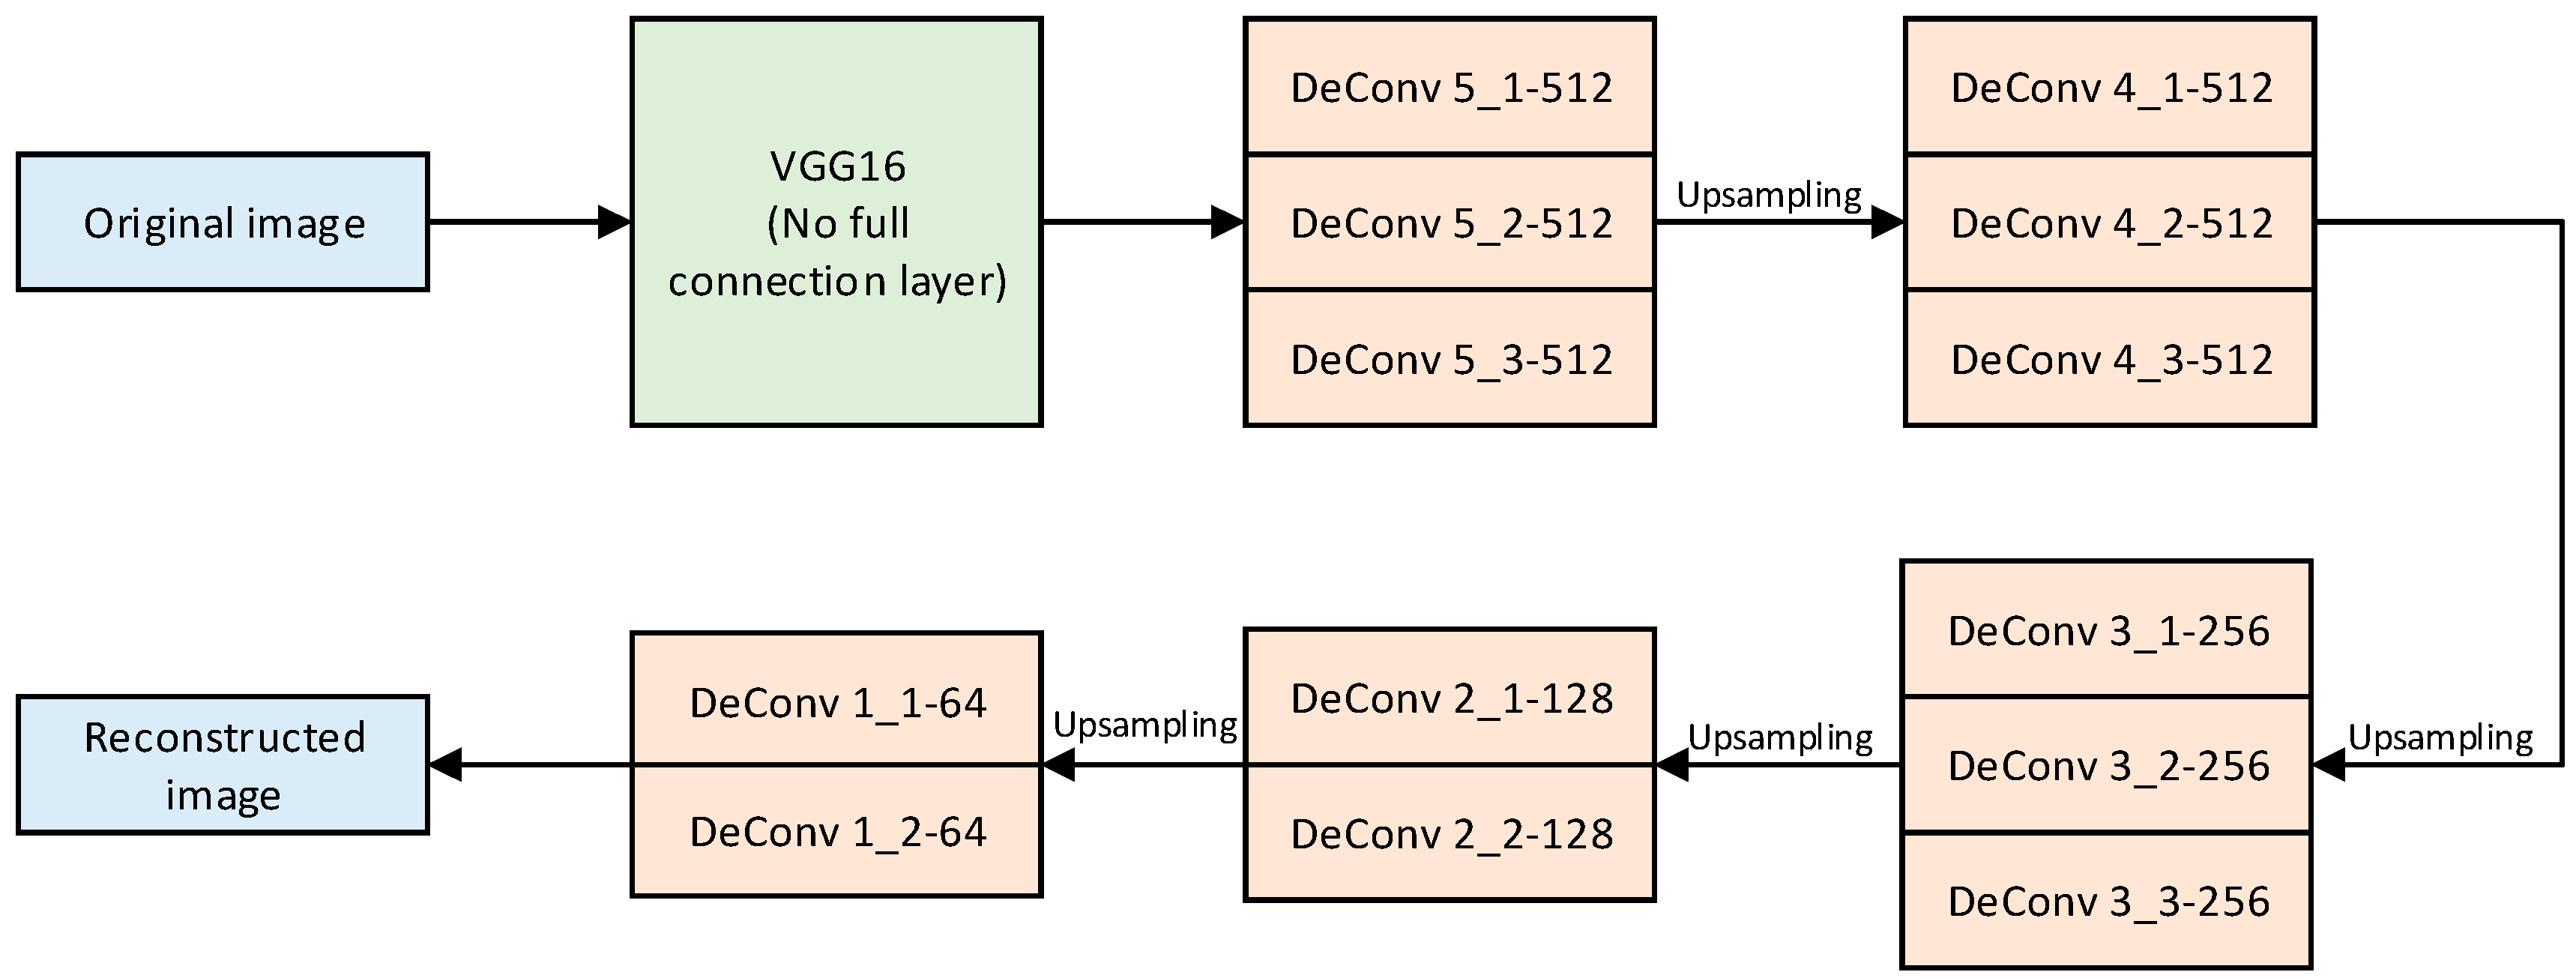
In the SSD paper, there were two sizes of pictures of 300 × 300 and 512 × 512 input into the model, although the research shows that the accuracy of SSD_512 is a little higher than the accuracy of SSD_300. However, combined with the need to quickly deploy rescue after the disaster and SSD512 detection speed was significantly lower than the SSD_300, we chose to convert the size of the picture to 300 × 300 as training data. A convolutional autoencoder was constructed on the basis of the VGG16 layer of SSD (see Figure 4). Given that the SSD model will resize the input image to 300 × 300, the input of the convolution autoencoder is also changed to 300 × 300 to maintain consistency. Figure 6 shows the specific structure.
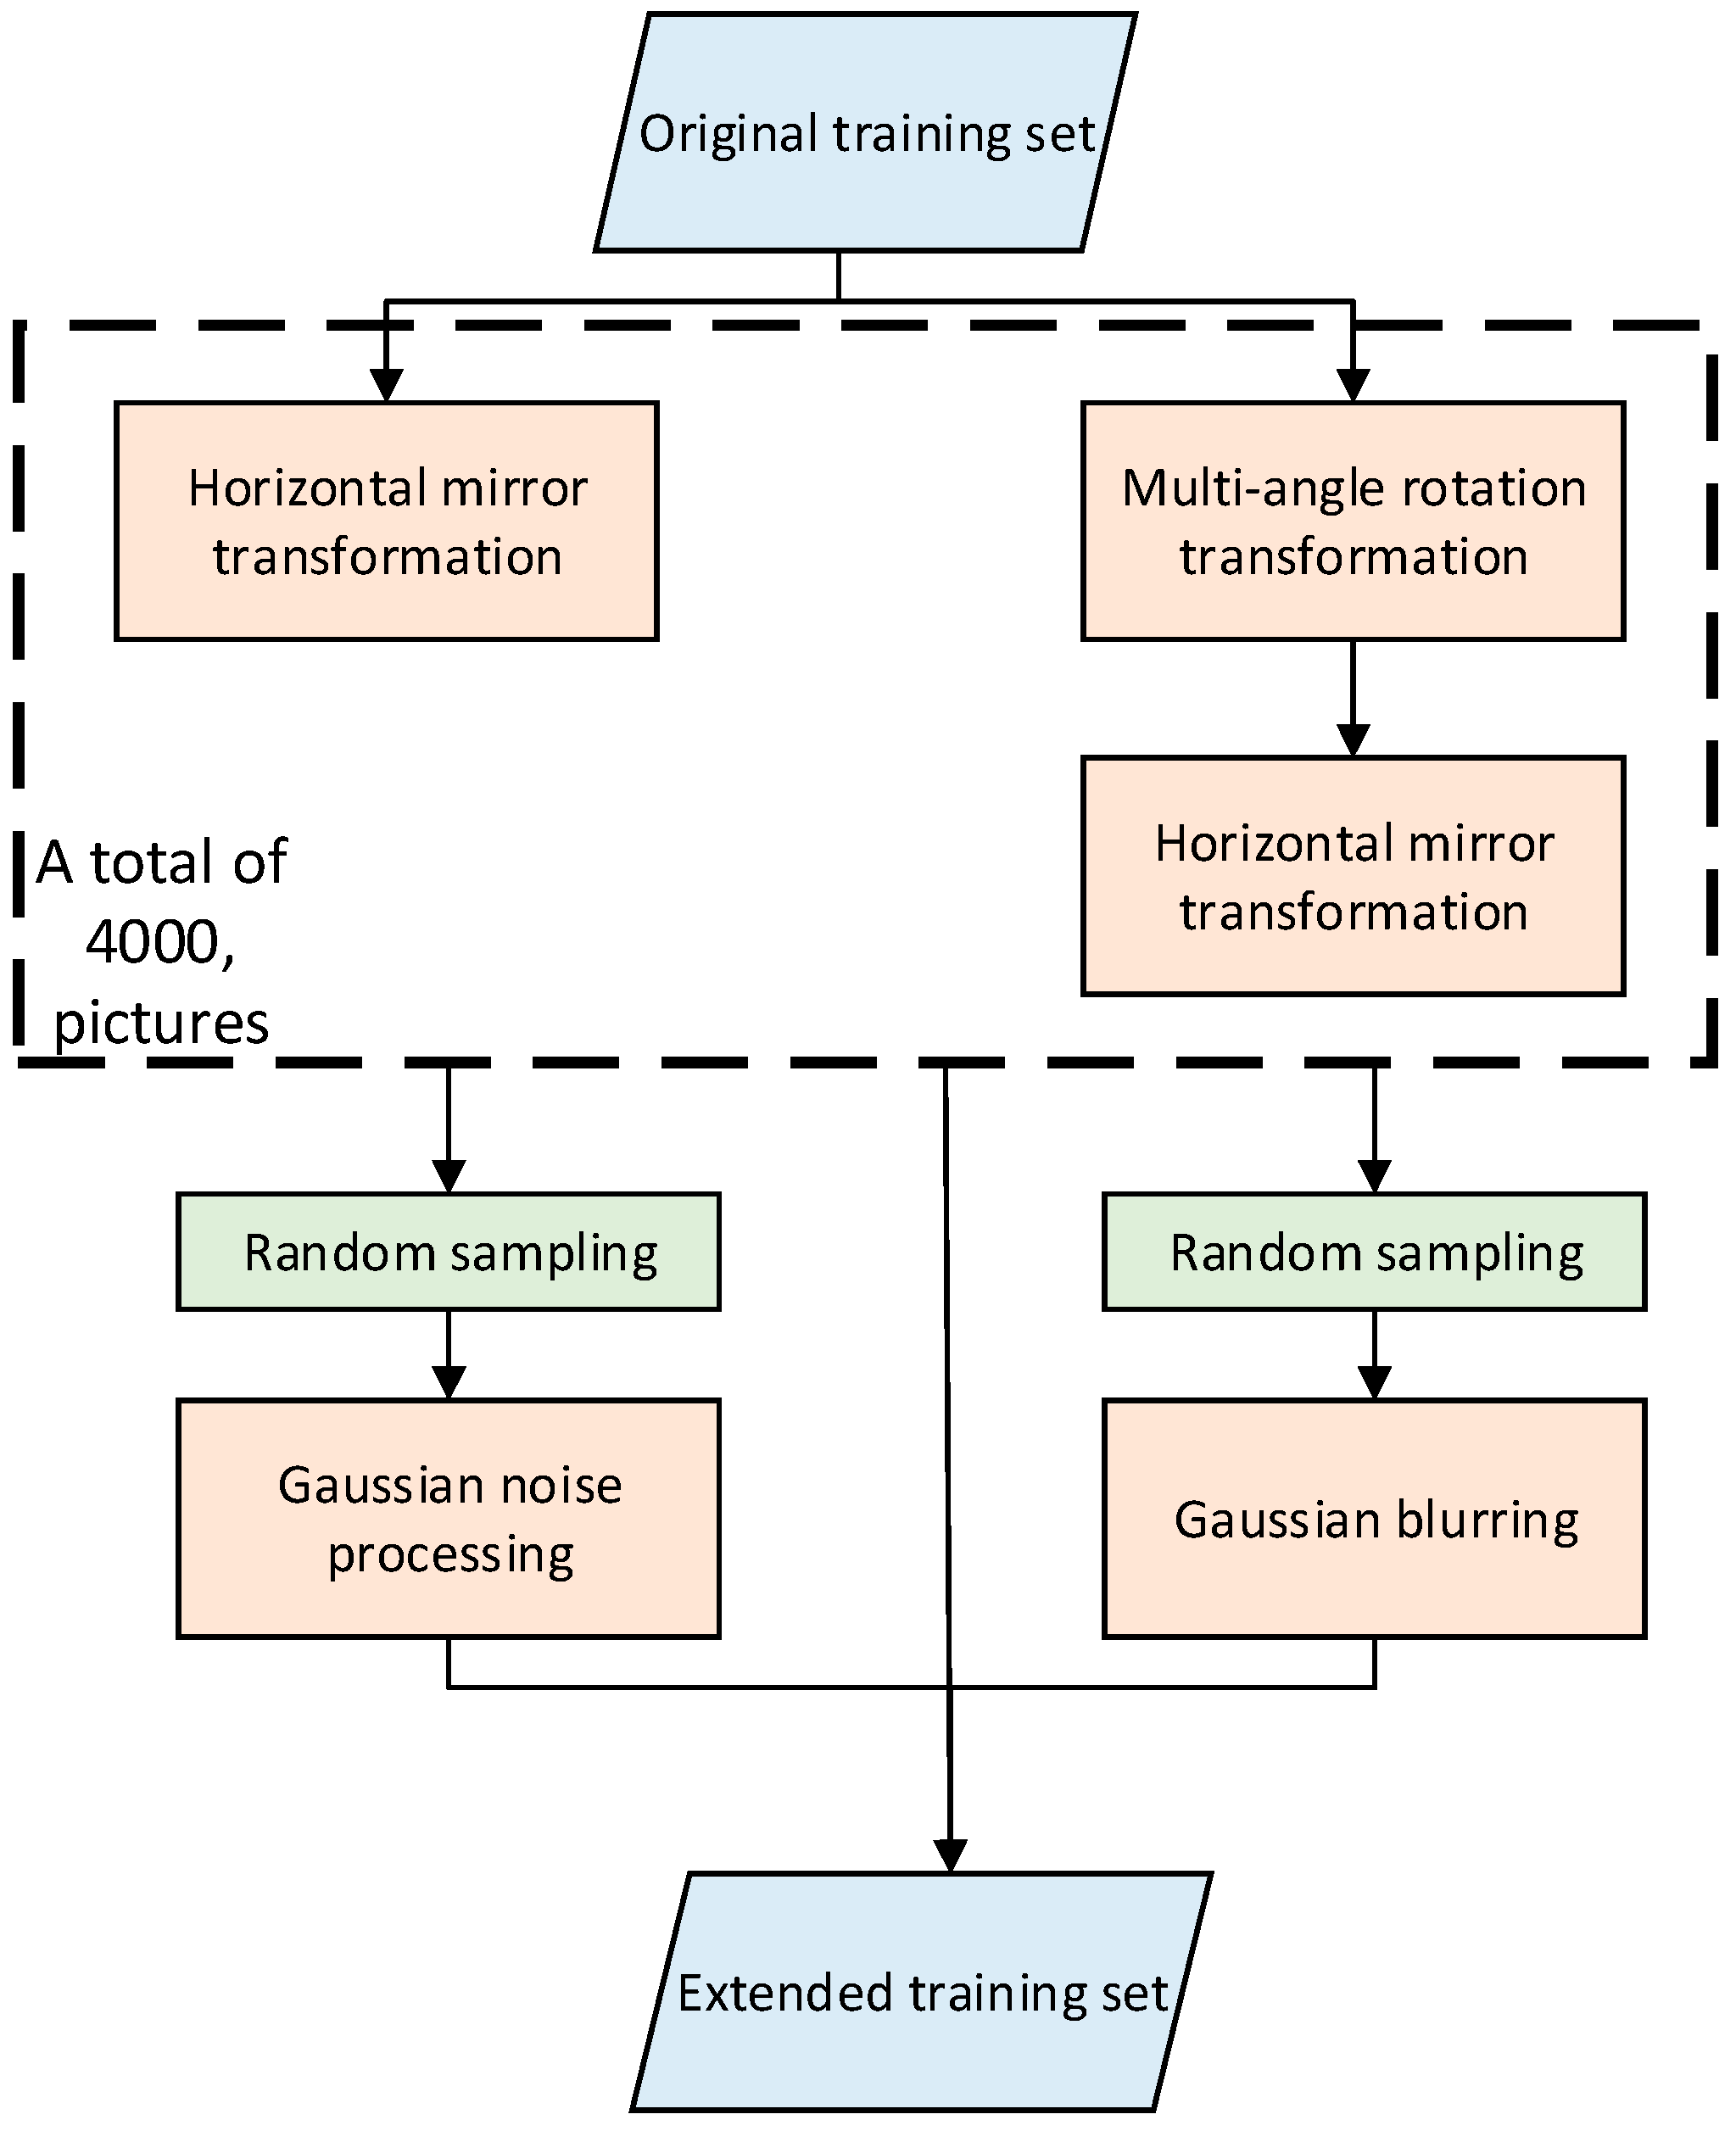
The data set is likewise augmented. First, 500 images with considerably prominent features are manually selected from the training data as the original data to be processed. Thereafter, 500 original images are horizontally mirrored and 90-, 180-, and 270-degrees rotated. This way, we obtain an additional four sets of 500 extended images. The next step is to mirror the images of the last three groups. The three processed sets of images plus 4000 images of the previously processed image and the original image are used. Lastly, 1000 images randomly sampled from these images are divided into two parts for the Gaussian noise processing and Gaussian blur processing. We eventually obtain 5000 training pictures. Figure 7 shows the flow chart.
A total of 5000 images are labeled as the training set. The data without data augmentation processed were divided into test dataset and verification dataset. When training the model, the verification set is used to find the optimal model, while the test set is used in testing.
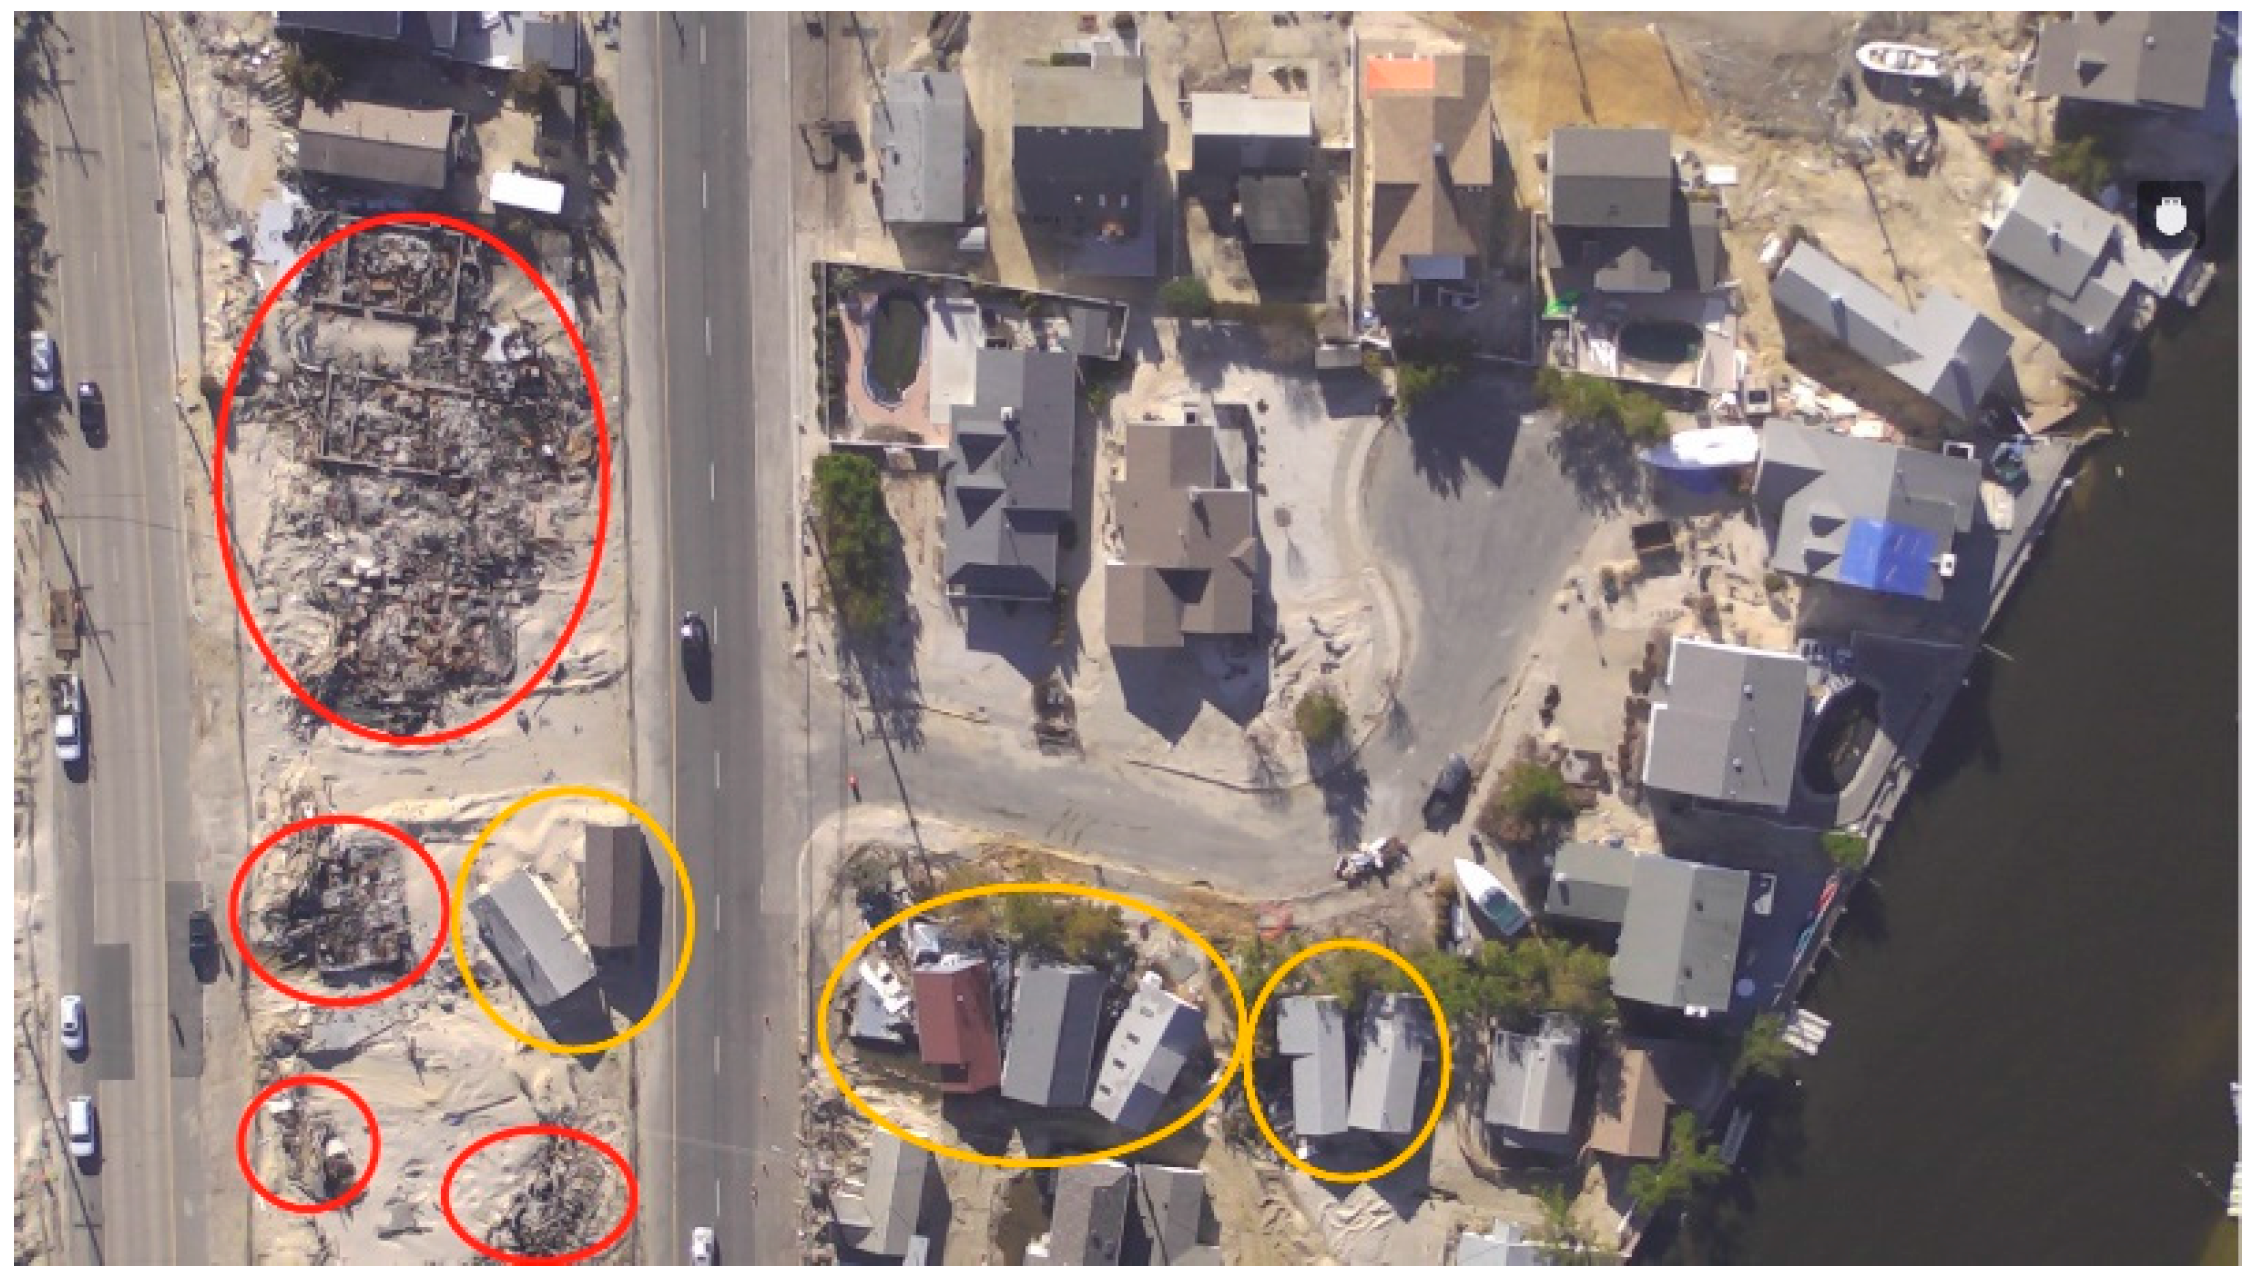
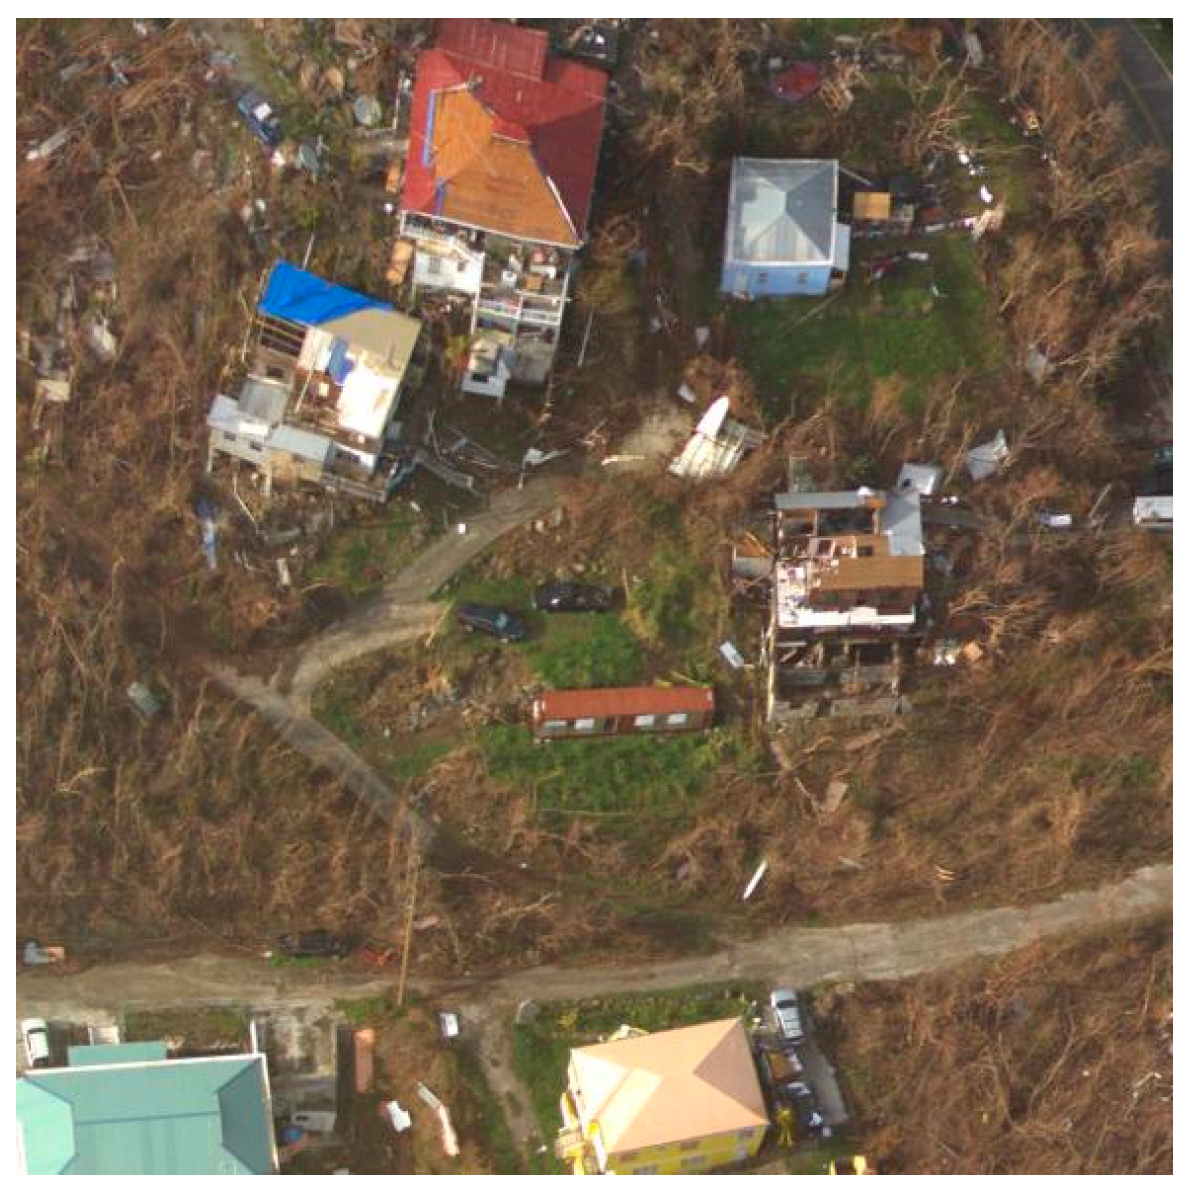
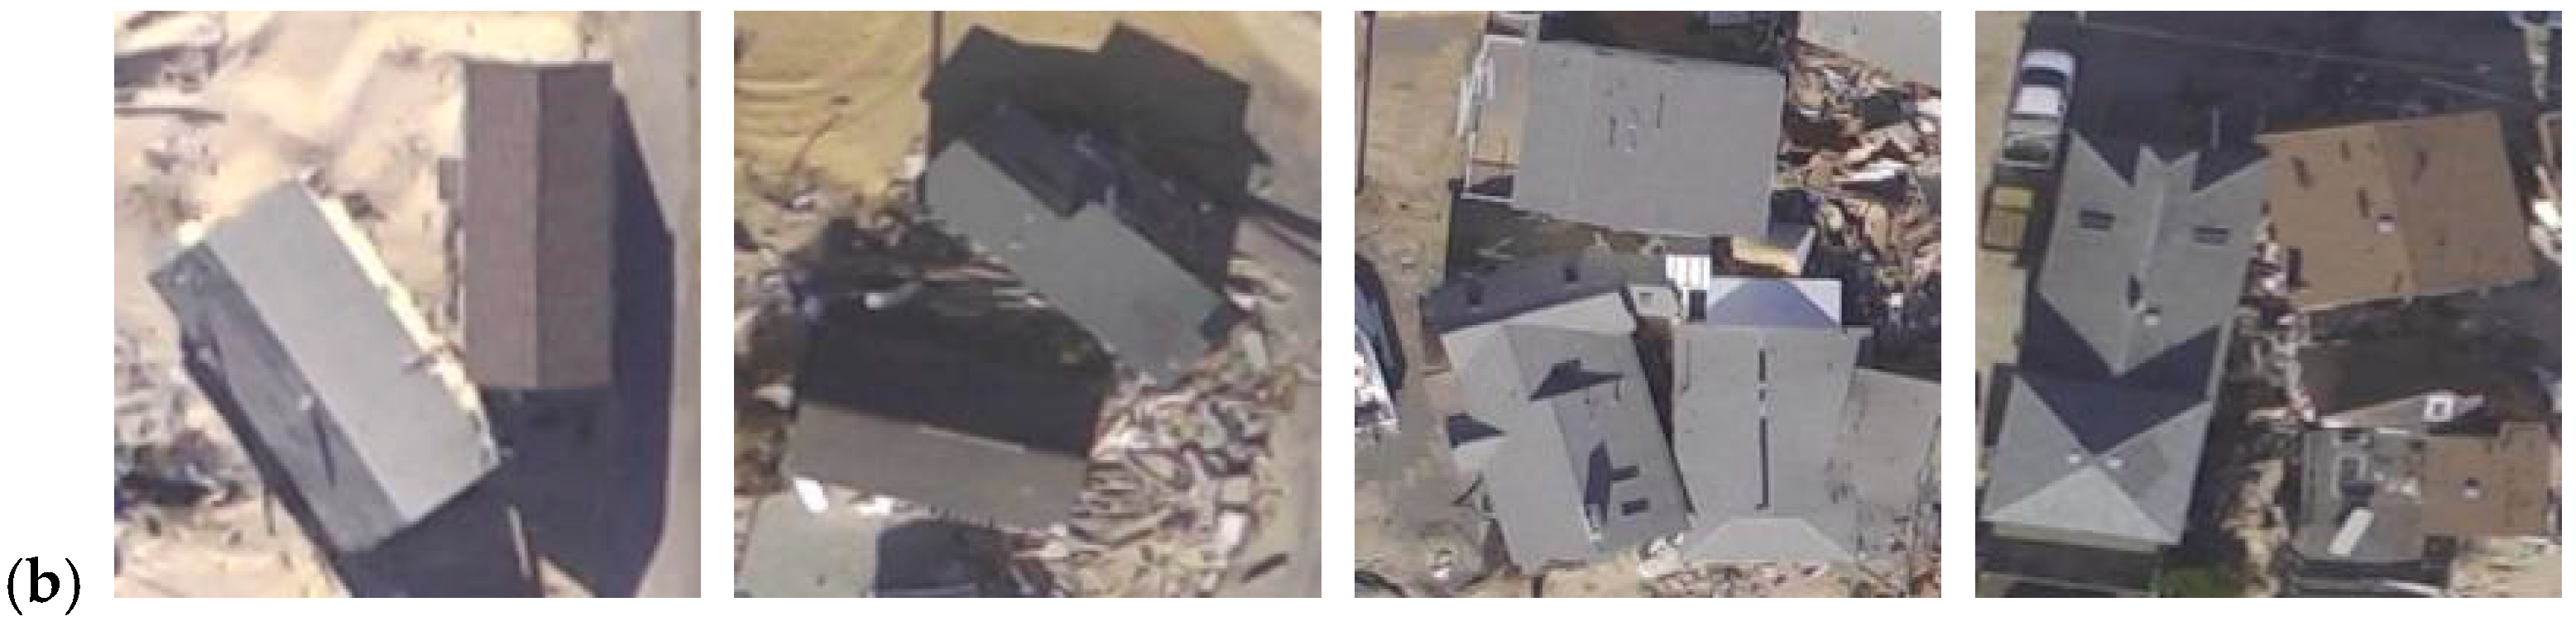
The objects to be identified in this research are categorized into two classes, namely, damaged buildings and debris. Damaged buildings in the current research refer to mildly damaged buildings. That is, the buildings are damaged but still standing. Meanwhile, debris refers to buildings destroyed and in ruins. Figure 8 shows a few examples.
To make the target of the data to be detected prominently, the training data should be pre-processed before training the model. The brightness, contrast, hue, and saturation of the image must be randomly adjusted. The appropriate optical noise must be added to the image. Thereafter, the image was randomly cropped to substantially train the data of the small target. The SDD model was trained using the Windows platform. The loss function setting is as discussed in reference [11]. The optimizer and hyperparameters that need to be set before training are shown in Table 1.
After 80 k iterations, the learning rate dropped to 1 × 10⁻⁴, and after 100 k iterations to 1 × 10⁻⁴. The learning rate decay ensures that the model does not fluctuate substantially in the latter stages of training, thereby approximating the optimal solution.

4. Results and Discussion

This study proposes a building damage detection method, which is referred to as SSD_CAE, using SSD with the pretraining and data augmentation strategies. We implemented the proposed method under the framework of Pytorch (version 0.3.1) (Facebook, Inc., Menlo Park, CA, USA) [31]. A GPU (GTX1080 8G, NVIDIA Corporation, Santa Clara, CA, USA) processor was used to accelerate the calculation.
To validate the effectiveness of the proposed SSD_CAE method, the traditional SSD method was utilized as the baseline for comparison. Some metrics, such as recall, precision, mF1, and average precision (AP), are used to compare the performance. Precision and recall are popular measures for the classification task. However, the comprehensive performance is difficult to evaluate by evaluating precision and recall separately. Accordingly, mF1 was adopted for comparison. The F-measure is the weighted harmonic average of precision and recall as follows:
F = ( α 2 + 1 ) P R α 2 ( P + R ) ,
In general, α is equal to unity:
F 1 = 2 P R P + R ,
where mF1 is the mean of F1 for all classes.
Average precision (AP) aims to evaluate the ability of the model to detect a class. A set of recall thresholds [0, 0.1, 0.2, …, 1] was provided. Thereafter, the value of each recall threshold ranged from small to large, while the maximum precision corresponding to the recall threshold is calculated. Subsequently, we calculated 11 precisions. AP is the average of these 11 precisions. The mAP is the mean of AP for all classes.

4.1. Experiment 1: Impact of Pretraining on Performance

4.1.1. Comparison Results

In the proposed method, a VGG16 convolution autoencoder was first constructed and trained using the unlabeled samples from the same domain of the test data. Thereafter, the weights of the VGG16 part in the SSD_CAE method were initialized with the weights of the counterpart of the VGG16 convolution autoencoder. Compared with the traditional SSD method, this strategy could enhance the adaptation of the classifier to the unseen test data. Table 2 and Table 3 show the results of the SSD and SSD_CAE models, respectively, on the test set. Table 4 shows the overall performance of the two models.
In this experiment, only the original 350 samples are used to train the SSD and SSD_CAE models.

4.1.2. Discussion

The comparison of Table 2 and Table 3 indicates that the indicators were improved in the case of the extremely scarce training sets, except for the slight decrease in the precision rate of “mild”. The recall rate of “debris” was increased by approximately 10%. Table 4 also shows that mF1 and mAP are increased by approximately 10%. The overall performance of the model is generally improved.
The recall rate of the “debris” class can be greatly improved because the features of the ruins are simple, and the features can be extracted well by the CNN. However, the characteristics of the “mild” class are complex, and the structure, position, and angle of the house are all factors that affect feature extraction. Therefore, many samples are needed to improve this situation.

4.2. Experiment 2: Impact of Data Augmentation on the Performance

4.2.1. Comparison Results

The weight of the coded portion of the VGG16 convolution autoencoder was replaced by the initial weight of VGG16 in the SSD model before training, while the model trained with the proposed method was tested under the same test set as the previous section. To analyze the effect of data expansion, SSD_CAE was selected for comparison with this method. Table 5 shows the statistics of the data augmentation method under the test set. Table 6 shows the evaluation results of the two models.
In this experiment, the data set for training SSD_CAE in Experiment 1 was named the original data set. The data set of 5000 samples obtained using data augmentation was used to train the SSD_CAE networks.
The trained model is applied to the Hurricane Sandy scenario to detect and evaluate disasters. Figure 9 shows the result.

4.2.2. Discussion

The comparison of Table 3 and Table 5 clearly indicates that all indices are improved. The number of additional tests is substantially reduced, thereby increasing the overall detection accuracy. For example, in the second set of test data in Figure 8, “mild: 0.59” in the model of the original data training is an additional test building. In addition, the comparison of the damaged houses detected in the Figure 9 indicates that the confidence level of the proposed detection method is evidently higher than that of the original method.
The data of the first, third, and fourth groups in Figure 9 show the ruin missed by the detection in the complex scene. The proposed method can effectively detect the debris in the shadow and near the house and sand and stone.
Humans may subjectively believe that the image processing method is used to rotate or mirror an image, while each generated image must be detected with the same target. However, for a machine a new feature is considered as long as the coordinates and direction of the training data are different from the original image. Data augmentation does not cause over-fitting when training the model. To increase the adaptability of the model to complex scenes, Gaussian blur and Gaussian filtering are appropriately added in the training set. We validated the above viewpoints using the dataset of Hurricane Irma, and the results are shown in Table 7. From this result, it can be seen that data augmentation is an effective way to improve the effect of the model.

5. Conclusions

This study proposes a data expansion SSD algorithm for a small data set of Hurricane Sandy. Given the use of the hurricane scenario to train the VGG16 convolution autoencoder, the weight of the coding part replaces the weight of the VGG16 network in the SSD model. The experiment proves that the pre-training method can effectively increase various indicators of the model by approximately 10%. Through data expansion, the detection accuracy can be effectively increased and mF1 and mAP increased by approximately 20% and 72% percent, respectively. The rate of false detections is also reduced. The introduction of the Gaussian noise and Gaussian blur can effectively improve the adaptability of the model in complex scenes. In addition, we used the dataset of Hurricane Irma to verify the method proposed in this paper, and also achieved good performance. This makes our conclusions more objective.
This study is based on Hurricane Sandy’s post-disaster building damage detection. In the future, data from other post-disaster scenarios can be collected for training, while the generalization ability of the model can be increased. Through research, the algorithm can also be installed on the camera of UAVs for real-time detection, thereby effectively aiding the rescue staff in search and rescue to reduce casualties.

Author Contributions

Y.L. raised this idea. W.H., H.D. and X.Z. verified the idea through experiments and completed the first draft of the paper. After Y.L. proofreads the paper and improved the experiment, the final paper was completed.

Funding

This research was funded by the Beijing Natural Science Foundation (No. 4182020) and National Key RD Program of China (No. 2017YFB1201104).

Acknowledgments

The authors would like to thank Ivan Bartoli of Drexel University to provide us with the aerial images of Hurricane Sandy.

Conflicts of Interest

The authors declare no conflict of interest.

References

  1. Rango, A.; Laliberte, A.; Herrick, J.E.; Winters, C.; Havstad, K.; Steele, C.; Browning, D. Unmanned aerial vehicle-based remote sensing for rangeland assessment, monitoring, and management. Chin. Hydraul. Pneum. 2009, 3, 033542. [Google Scholar]
  2. Schwegmann, C.P.; Kleynhans, W.; Salmon, B.P. Synthetic Aperture Radar Ship Detection Using Haar-Like Features. IEEE Geosci. Remote Sens. Lett. 2017, 14, 154–158. [Google Scholar] [CrossRef] [Green Version]
  3. Xu, T.B.; Cheng, G.L.; Yang, J.; Liu, C.L. Fast Aircraft Detection Using End-to-End Fully Convolutional Network. In Proceedings of the 2016 IEEE International Conference on Digital Signal Processing (DSP), Beijing, China, 16–18 October 2016. [Google Scholar]
  4. Chern, M.Y.; Hou, P.C. The lane recognition and vehicle detection at night for a camera-assisted car on highway. In Proceedings of the 2003 IEEE International Conference on Robotics and Automation (Cat. No.03CH37422), Taipei, Taiwan, 14–19 September 2003. [Google Scholar]
  5. Dalal, N.; Triggs, B. Histograms of Oriented Gradients for Human Detection. In Proceedings of the International Conference on Computer Vision & Pattern Recognition (CVPR’05), San Diego, CA, USA, 20–26 June 2005; IEEE Computer Society: Washington, DC, USA, 2005. [Google Scholar]
  6. Lowe, D.G. Distinctive Image Features from Scale-Invariant Keypoints. Int. J. Comput. Vis. 2004, 60, 91–110. [Google Scholar] [CrossRef] [Green Version]
  7. Viola, P.; Jones, M. Rapid Object Detection using a Boosted Cascade of Simple Features. In Proceedings of the 2001 IEEE Computer Society Conference on Computer Vision and Pattern Recognition. CVPR 2001, Kauai, HI, USA, 8–14 December 2001; IEEE Computer Society: Washington, DC, USA, 2001. [Google Scholar]
  8. Ho, W.T.; Hao, W.L.; Yong, H.T. Two-Stage License Plate Detection Using Gentle Adaboost and SIFT-SVM. In Proceedings of the 2009 First Asian Conference on Intelligent Information and Database Systems, Dong Hoi, Vietnam, 1–3 April 2009. [Google Scholar]
  9. Girshick, R.; Donahue, J.; Darrell, T.; Malik, J. Rich Feature Hierarchies for Accurate Object Detection and Semantic Segmentation. In Proceedings of the 2014 IEEE Conference on Computer Vision & Pattern Recognition, Columbus, OH, USA, 23–28 June 2014. [Google Scholar]
  10. Redmon, J.; Divvala, S.; Girshick, R.; Farhadi, A. You Only Look Once: Unified, Real-Time Object Detection. In Proceedings of the 2016 IEEE Conference on Computer Vision and Pattern Recognition (CVPR), Las Vegas, NV, USA, 27–30 June 2016. [Google Scholar]
  11. Liu, W.; Anguelov, D.; Erhan, D.; Szegedy, C.; Reed, S.; Fu, C.Y.; Berg, A.C. SSD: Single Shot MultiBox Detector. In Proceedings of the the 14th European Conference on Computer Vision, Amsterdam, The Netherlands, 11–14 October 2016; pp. 21–37. [Google Scholar]
  12. Simonyan, K.; Zisserman, A. Very Deep Convolutional Networks for Large-Scale Image Recognition. arXiv, 2014; arXiv:1409.1556v6. [Google Scholar]
  13. Axel, C.; Aardt, J.A.N.V. Building damage assessment using airborne lidar. J. Appl. Remote Sens. 2017, 11, 046024. [Google Scholar] [CrossRef]
  14. Brunner, D.; Lemoine, G.; Bruzzone, L. Earthquake Damage Assessment of Buildings Using VHR Optical and SAR Imagery. IEEE Trans. Geosci. Remote Sens. 2010, 48, 2403–2420. [Google Scholar] [CrossRef] [Green Version]
  15. Bialas, J.; Oommen, T.; Rebbapragada, U.; Levin, E. Object-based classification of earthquake damage from high-resolution optical imagery using machine learning. J. Appl. Remote Sens. 2016, 10, 036025. [Google Scholar] [CrossRef]
  16. LeCun, Y.; Bottou, L.; Bengio, Y.; Haffner, P. Gradient-based learning applied to document recognition. Proc. IEEE 1998, 86, 2278–2324. [Google Scholar] [CrossRef] [Green Version]
  17. Krizhevsky, A.; Sutskever, I.; Hinton, G.E. ImageNet Classification with Deep Convolutional Neural Networks. In International Conference on Neural Information Processing Systems; Curran Associates Inc.: Red Hook, NY, USA, 2012. [Google Scholar]
  18. Lowe, D.G. Object recognition from local scale-invariant features. In Proceedings of the Seventh IEEE International Conference on Computer Vision, Kerkyra, Greece, 20–27 September 1999. [Google Scholar]
  19. Kakooei, M.; Baleghi, Y. Fusion of satellite, aircraft, and UAV data for automatic disaster damage assessment. Int. J. Remote Sens. 2017, 38, 24. [Google Scholar] [CrossRef]
  20. He, K.; Zhang, X.; Ren, S.; Sun, J. Spatial Pyramid Pooling in Deep Convolutional Networks for Visual Recognition. IEEE Trans. Pattern Anal. Mach. Intell. 2014, 37, 1904–1916. [Google Scholar] [CrossRef] [PubMed]
  21. Donahue, J.; Jia, Y.; Vinyals, O.; Hoffman, J.; Zhang, N.; Tzeng, E.; Darrell, T. DeCAF: A Deep Convolutional Activation Feature for Generic Visual Recognition. arXiv. 2013. Available online: https://arxiv.org/pdf/1310.1531.pdf (accessed on 7 September 2018).
  22. Howard, A.G. Some Improvements on Deep Convolutional Neural Network Based Image Classification. arXiv, 2013; arXiv:1312.5402. [Google Scholar]
  23. Zhou, Z.; Gong, J. Automated residential building detection from airborne LiDAR data with deep neural networks. Adv. Eng. Inform. 2018, 36, 229–241. [Google Scholar] [CrossRef]
  24. Cao, Q.D.; Choe, Y. Detecting Damaged Buildings on Post-Hurricane Satellite Imagery Based on Customized Convolutional Neural Networks. arXiv, 2018; arXiv:1807.01688. [Google Scholar]
  25. Inoue, H. Data Augmentation by Pairing Samples for Images Classification. arXiv, 2018; arXiv:1801.02929. [Google Scholar]
  26. Erhan, D.; Bengio, Y.; Courville, A.; Manzagol, P.A.; Vincent, P.; Bengio, S. Why Does Unsupervised Pre-training Help Deep Learning? J. Mach. Learn. Res. 2010, 11, 625–660. [Google Scholar]
  27. Geng, M.; Wang, Y.; Xiang, T.; Tian, Y. Deep Transfer Learning for Person Re-identification. arXiv, 2016; arXiv:1611.05244. [Google Scholar]
  28. Sheppard, K. Report Warns That Superstorm Sandy Was Not ‘The Big One’. Huffington Post, 6 December 2017. [Google Scholar]
  29. Li, Y.; Ye, S.; Bartoli, I. Semi-supervised classification of hurricane damage from post-event aerial imagery using deep learning. J. Appl. Remote Sens. 2018, 12, 045008. [Google Scholar] [CrossRef]
  30. Hurricane Irma data. Available online: https://storms.ngs.noaa.gov/storms/irma/index.html#6/26.697/-78.794 (accessed on 7 September 2018).
  31. Pytorch. Available online: https://pytorch.org/ (accessed on 7 September 2018).
Figure 1. Damage examples. An example aerial image of an aerial image of the impacted area. The red circles highlight the ruins of destroyed houses, and the yellow circles highlight the houses that were displaced or slightly damaged by the hurricane.
Applsci 09 01128 g001
Figure 2. Post-disaster scene map of Hurricane Irma. Show the details in the satellite image because the large size of original remote sensing satellite image.
Applsci 09 01128 g002
Figure 3. Examples of image pre-processing. (a) The raw data with resolution of 1920 × 1080 has many information; (b) The raw data is split into four parts.
Applsci 09 01128 g003
Figure 4. Single-shot multibox detector (SSD) network structure.
Applsci 09 01128 g004
Figure 5. Scheme for model training with few training sets. Train the VGG16 convolution autoencoder was done with data related to the scene. The weight of its training was to initialize the VGG16 part of the SSD. Finally, the training dataset trained the SSD model after data augmentation processing.
Applsci 09 01128 g005
Figure 6. Structure and parameters of the convolution autoencoder based on VGG16.
Applsci 09 01128 g006
Figure 7. Flowchart of data augmentation.
Applsci 09 01128 g007
Figure 8. (a) The “debris” label represents ruins and destroyed buildings; (b) The “mild” label represents damaged buildings.
Applsci 09 01128 g008aApplsci 09 01128 g008b
Figure 9. Object test results for both models; (a) is the result of the data augmentation method; (b) is the result of the original dataset method.
Applsci 09 01128 g009aApplsci 09 01128 g009b
Table 1. Optimizer and hyperparameter settings before training.
OptimizerMomentumWeight DecayLearning Rate
Stochastic gradient descent (SGD)0.95 × 10−41 × 10−3
Table 2. The results of the single-shot multibox detector (SSD) method in the test dataset.
LabelDebrisMildMissTotalRecall
Debris60255413943.165%
Mild3142158847.727%
False detection54- -
Total9671 -
Precision62.500%59.155%---
Table 3. The results of the SSD-convolution auto-encoder (CAE) method in the test dataset.
LabelDebrisMildMissTotalRecall
Debris74283713953.237%
Mild2843178848.863%
False detection103- -
Total11274 -
Precision66.071%58.108%---
Table 4. Performance comparison of the SSD and SSD_CAE methods.
MethodmF1mAP
SSD51.9539.01
SSD_CAE56.02544.83
Table 5. The results of the data augmentation method in the test dataset.
LabelDebrisMildMissTotalRecall
Debris85233113961.151%
Mild2156118863.636%
False detection11- -
Total10780 -
Precision79.439%70.000%---
Table 6. Impact of data augmentation using the SSD_CAE method.
MethodmF1mAP
Original data set56.0344.83
Data augmentation67.8977.27
Table 7. Verification result of using Hurricane Irma dataset.
MethodmF1mAP
Original dataset40.3934.19
Data augmentation56.9951.59

