Pore Solution Chemistry of Calcium Sulfoaluminate Cement and Its Effects on Steel Passivation


College of Civil Engineering and Architecture, Zhejiang University, 866 Yuhangtang Road, Hangzhou 310000, Zhejiang, China
*
Author to whom correspondence should be addressed.
Appl. Sci. 2019, 9(6), 1092; https://doi.org/10.3390/app9061092
Submission received: 26 December 2018
/
Revised: 28 February 2019
/
Accepted: 12 March 2019
/
Published: 15 March 2019
(This article belongs to the Section Chemical and Molecular Sciences)
Abstract
:Calcium sulfoaluminate cement (CSA) is a type of low-CO2 binder which has been widely applied in the production of concrete. To investigate the protection capability offered by CSA to keep steel from corrosion, the pore solution chemistry of CSA on steel passivation was investigated in this study. The pore solution of CSA pastes, extracted by an ex situ leaching method, was studied and compared with ordinary Portland cement (OPC). The results show that the alkalinity of the CSA pore solution is not only much lower than that of OPC, but also that a new type of ion, Al(OH)4−, and high concentration of SO42− were detected in the liquid phase of CSA. Based on pore solution chemistry analysis, a simulated pore solution (SPS) system was designed to assess the comprehensive impact of alkalinity and ion composition, featured as properties of CSA, on steel passivation. The results of the corrosion potential evolution highlight the importance of alkalinity in passivation. SO42− can cause depassivation when there is not enough hydroxyl, but Al(OH)4− is able to maintain the alkalinity of the system, enhancing the stability of the passive film.
Keywords:
calcium sulphoaluminate cement; passivation; pore solution; alkalinity; sulfate; aluminate1. Introduction
Calcium sulfoaluminate cement (CSA) is an environmentally friendly material providing rapid hardening and excellent mechanical performance. In recent years, it has been increasingly applied as an alternative binder for concrete production. Compared with Portland cement (PC), CSA generates different hydration products, which may give rise to the issues related to the durability of reinforced concrete structures.
Steel corrosion is a crucial factor in concrete durability. Generally, the high alkalinity of PC-based concrete can protect steel from corrosion by forming a stable passive film. The application of new cement, however, changes the internal environment of concrete, which may influence the properties of the passive film [1,2]. Currently, only a few experiments on steel passivation have been conducted in relation to CSA; therefore, the condition of steel embedded in CSA-based materials is not yet fully understood [3,4,5,6]. As an important part of the concrete internal environment, pore solution plays a significant role in preventing or accelerating steel corrosion. According to experiments by Poursaee [5] and Ghods [7], the time it takes to form a stable passive film decreases in solutions with higher pH values. Furthermore, if the solution alkalinity drops under 11.5 [8], the rebar is not passivate. The influence of ion composition has also been observed in previous works. Alhozaimy [9] reported that, with the addition of Ca(OH)2 in a solution of 0.1 M NaOH and 0.175 M KOH, the constitution of passive film changed, and the charge transfer resistance also increased noticeably. Additionally, SO42− may also affect the condition of the steel bar, as indicated by Abd El Hallem and Premlall [10,11], who claimed that SO42− can cause more severe corrosion than Cl−. However, this conclusion was not supported by some other researchers [12,13,14]. Some other ions such as cation types, carbonate and sulfur species have also been investigated, and the results indicated the importance of ion composition in steel passivation [2,13,14,15].
However, current studies on the effects of pore solution chemistry on passivation are concentrated on PC. Considering the different hydration mechanism of CSA [16,17,18,19], there is a lack of knowledge about the passivation behavior in this special environment. The pore solution of PC-based materials, with a pH value fluctuating around 13.5, comprises Na+, K+ as well as a small amount of SO42− and Ca2+ [20,21,22]. Nevertheless, the pH value of the CSA pore solution varies from 12.5–12.9 [17,22,23], and in some cases, values under 11.3 have also been recorded, i.e., much lower than that of PC. Andac [23] has confirmed that Na, K, Al, S were the four principle elements in the liquid phase of CSA-based material. It should be noted that Al and S are nearly undetectable in OPC concrete. Winnefeld [17] speculated that S was SO42− from gypsum contained in the cement clinker, but currently no experimental evidence supports this point. As for element Al, few studies have been conducted to discover the ions it represents and its function on passivation. From the review of past research work, it may be concluded that the pore solution of CSA, compared with that of OPC, features a lower pH and a completely different chemical composition. It is necessary to discover the mechanism of how the chemistry of the CSA pore solution affects passivation, the results of which can offer a better understanding to the steel passivation in CSA-based materials and support the service life prediction of structure constructed with CSA.
This work firstly aims to investigate the alkalinity and ion composition of CSA pore solution, establishing the basis of preparing simulated pore solution of CSA. Secondly, the impact of pore solution chemistry on passivation was studied by monitoring the corrosion potential evolution of steel electrodes in SPSs covering various combinations of alkalinity and ion composition. The mechanism by which CSA pore solution influences passivation is then discussed.
2. Materials and Methods
2.1. Materials and Sample Preparation
The present study was performed using OPC and CSA with chemical compositions, as shown in Table 1. The commercial CSA cement was produced by Lu Cheng Cement Co., Ltd. (Shandong, China). OPC designated P.O. 42.5 following Chinese standard GB175-2007 was treated as the reference material. Steel samples for corrosion tests were cut from a ribbed steel bar designated HRB 400 following the GB/T 1499.2-2018 standard. The chemical composition determined by energy-dispersive X-ray (EDX) is C 0.23, Si 0.53, Mn 1.49, P 0.02 and S 0.03 balanced with Fe (in wt%).
2.2. Pore Solution Analysis
2.2.1. Extraction of Pore Solution
Pore water expression (PWE), described by Barneyback [24] in detail, is the most commonly employed method to acquire the pore solution. However, the disadvantage of this technique is that a special instrument is required to acquire the pore solution, and PWE is not suitable to older or dense samples with a low water-to-binder ratio (w/b) due to the low amount of free water available. An alternative way to analyze the pore solution is the ex situ leaching (ESL) method. Pavlík [25] and Li [26] applied this method to study the chemical composition of pore solution. They considered that ESL can provide valuable information about the hydroxide and other ions. Plusquellec [22] also recommend ESL as an effective way of studying pore solution chemistry after comparing the main techniques used for extracting pore solution.
ESL was chosen in this study. The leaching process followed the instruction described in Plusquellec’s work [22]. A series of 4 4 16 cm prismatic cement pastes were cast with w/b equal to 0.5. The CSA and OPC specimens were demolded after 3 and 24 h respectively. Then, they were sealed in plastic bags, and kept in the curing room (T = 20 °C, RH ≥ 95%) until the testing dates. Before extraction, the prismatic samples were broken up and ground with a mortar into a fine powder. The powder was then dried in an oven at 60 °C. The drying temperature is the result of a compromise between the time needed for drying and the risk of ettringite decomposition at high temperature [17,27,28]. Then, after passing the powder through an 80 sieve, it was mixed with deionized water at a mass ratio of 1:1. After stirring for 5 min, the solution was processed using a centrifuge machine to acquire the leaching solution. In order to determine the pore solution at early stage, the liquid phase of fresh pastes was achieved directly by centrifuging the slurry after mixing 5 min.
2.2.2. Chemistry Analysis of Leaching Solution
The analysis of the leaching solution included two parts: pH measurement and ion composition tests. The pH of the leaching solution was directly measured by a pH meter. Before performing the measurement, the apparatus was calibrated by standard buffer solutions. For the ion composition test, 5 mL leaching solution firstly was diluted to 25 mL using HNO3 (6.5%) to prevent the precipitation of metal ions, after which 10 mL diluted solution was analyzed by ion chromatography (IC; AQUION) to determine the total concentrations of the main ions. It should be noted that it is difficult to detect the original ions containing aluminum directly, and all these ions have been transformed to Al3+ in the process of dilution by HNO3 solution. Since Al3+ was not suitable for testing by IC, another 10 mL diluted solution was taken to measure the concentration of the ions containing aluminum, using inductively coupled plasma mass spectrometry (ICP-MS; NexION 300XX) to detect the concentration of the element of aluminum.
It was hypothesized that the ion containing aluminum was Al(OH)4−, because aluminum mainly exists in the form of Al(OH)4− at high pHs. To prove this deduction, the leaching solution was also investigated using Raman spectra with a LabRAM HR evolution spectrometer equipped with a laser supplying 532 nm excitation. A contrastive solution containing 0.1 M NaOH and 0.15 M NaAlO2 was also prepared for Raman spectra. All solutions were stored in 10 mm path-length fused quartz cells. The sample focused through a 50× microscope was studied with a holographic grating of 1800 g/mm and a confocal slit hole fixed at 200 . The acquisition time was 30 s and the exposure time was 1 min with triple accumulations.
2.2.3. Chemistry of Pore Solution
It is obvious that the addition of extra water in ESL dilutes the solution obtained, resulting in an underestimation of the ion concentration. To obtain the composition of the pore solution from the results of ESL, a calculation process was conduct by considering the free water content in a paste sample and the water added during leaching [22,25]. The calculation method comprised the following steps.
(1) Measurement of free water content
When the prismatic paste was broken up for the leaching test, one part of the prism was taken for the measurement of free water content. The weight of the sample was recorded as W1, and then it was dried in an oven at 60 °C. The weight after drying was recorded as W2, so the free water content Wb is equal to (W1 − W2)/W1 × 100%.
(2) Conversion from leaching solution to pore solution
The conversion is based on the assumption that in one part of cement, the sum of the soluble ions in leaching solution and pore solution is identical, namely
where and stand for the ion concentration and volume of pore solution respectively; and stand for the ion concentration and volume of leaching solution respectively. Considering the free water content, the calculation formula for the ion concentration of pore solution finally can be written as
(3) Data correction by PHREEQC
Basically, the data conversion from leaching solution to pore solution is a process of concentration, in which precipitation may occur due to ion saturation or compatibility. A geochemical software PHREEQC (Version 3.4.0.12927, database wateq4f) was introduced to simulate the equilibrium reaction after conversion. The model was built by using three modules: SOLUTION, REACTION and EQUILIBRIUM PHASES. Firstly, the initial condition, including the pH and the concentration of every component measured in leaching solution, was set in the module of SOLUTION. Secondly, conversion was accomplished in the module of REACTION by removing water from the chemical system. Water can be specified as an irreversible reactant with a relative stoichiometry of “−1”. The reaction amounts can be determined based on the difference of Na+ between and . Finally, EQUILIBRIUM PHASES was applied to reach the equilibrium state of the chemical system after removing water. For OPC system, Ca(OH)2 was considered as the equilibrium phase, while in CSA system, Al(OH)3, CaSO4 and Ca(OH)2 were considered. The saturation index (SI) was set as “0”, which means the solution was saturated (in equilibrium).
2.2.4. Characterization of Hydration Products
The dried powder samples same as what used in leaching test were measured by X-ray diffraction (XRD) to study the hydration products. XRD analyses were performed by a Panalytical Empyrean 200895 diffractometer with CuKα12 radiation generated at 40 kV and 40 mA. The step size was 0.02° in the range of 10° to 60° 2θ.
2.3. Corrosion Potential in Simulated Pore Solutions
Based on the solution analysis, a series of SPSs was designed in consideration of the coupling effects of three variables: alkalinity, sulfate and aluminate concentration. The constitution of each solution is shown in Table 2. All the solutions were prepared using deionized water and analytical grade reagents. The effects of the pore solution on steel passivation were studied by monitoring the corrosion potential of steel in different SPSs. 10 × 10 × 2 mm steel plates working as electrodes were cut from HRB 400 steel rods. A copper wire, protected by a Teflon tube, was soldered on the surface of each plate. Then, every plate was mounted into epoxy resin such that one end of the plate was open to the solution. The exposed area was 1 cm2, and the surface was polished by emery papers of progressively increasing grit sizes, followed by a burnish with a 0.5 diamond polishing agent. This gave the sample a mirror finish with no noticeable scratches. The plates were finally rinsed with alcohol and deionized water, then stored in a desiccator after drying.
Corrosion potential monitoring was performed in a sealed glass container with a calomel reference electrode. A volt meter was applied to measure the corrosion potential of the steel electrodes. After finishing the tests, the steel electrodes were taken out and investigated by a magnifying glass, avoiding mistakes caused by crevice corrosion.
3. Results and Discussion
3.1. Pore Solution Analysis
3.1.1. Pore Solution Chemistry
The ion concentrations detected in the leaching solution are shown in Table 3. The main ions in OPC and CSA are similar, including Na+, K+, Ca2+, SO42−, and OH−. However, it should be noted that a type of ion containing the element of aluminum was detected in CSA. The ion was identified as Al(OH)4−. Details on this ion will be discussed in Section 3.1.3. The ion concentration of these two cements are totally different. The contents of alkalis are similar, but the concentration of OH− leached from CSA was much lower than that of OPC, which leads to the low alkalinity in CSA. Both cements had a high initial concentration of SO42−, but OPC showed a rapid depletion of sulfate. After one day, the concentrations of SO42− were negligible. In the case of CSA, the amount of SO42− decreased initially from 5 min to 1 d, then the content rose again. Finally, the value stayed at 8.09 mmol/L at day 28. Al(OH)4− plays a significant role in the CSA leaching solution, with the second highest concentration. There is a potential relationship between Al(OH)4− and the solution alkalinity. When the concentration of Al(OH)4− increased after 3 h, the concentration of hydroxide also significantly higher. This kind of relationship was also found in previous research works [17,23].
The free water contents of the paste samples are listed in Table 4. After the rapid hardening of CSA, the free water content consumed in the hydration process decreased quickly during the first day. However, the rate of water depletion in OPC stayed relatively constant. According to Equation (2), the results of the pore solution concentration are shown in Table 5 after amendment and verification by PHREEQC.
Comparing the results of OPC and CSA, the most noteworthy point is the low alkalinity of CSA. According to the pH value development plotted in Figure 1, the initial pH of CSA is quite low, but it quickly increases to 12.41 after 3 h, and eventually climbs to 12.74. However, the hydroxyl concentration corresponding to the highest pH is only about one eighth of that in OPC. With such a low alkaline nature, CSA can hardly offer effective protection for steel against corrosion.
As for other ion species, the differences between cation concentrations were not obvious, but the results of the anions (Al(OH)4− and SO42−) varied greatly. The most prominent feature of CSA is the exclusive ion, Al(OH)4−, which has never before been detected in any Portland cement based materials. Its concentration can be higher than 0.15 M. For a new type of ion with such a high concentration, it is necessary to study its effect on steel passivation. Secondly, the concentration of SO42− in CSA was extremely high. At the beginning of hydration (5 min), the value was lower than that in OPC, but the value kept stable at about 0.05 M. In contrast, SO42− was nearly negligible in OPC after a certain time. A large number of studies have shown that SO42− can cause steel corrosion, but the mechanism of corrosion is still under debate. The influence of solution chemistry on passivation will be discussed in a following section.
3.1.2. Determination of Aluminate Ion
Al(OH)4− was identified in a CSA pore solution for the first time. In this study, this ion was not detected together with the concentration measurement due to the lack of effective techniques. Alternatively, all the ions containing aluminum were converted to Al3+ in the dilution process and its content was then tested by ICP-MS. To uncover the ion-containing aluminum, a simulation was carried out in PHREEQC using the information from the ion concentration measurement, which found that Al(OH)4− was the main ion corresponding to aluminum. The species distributions produced by PHREEQC are partly demonstrated in Table 6. Andac [23] also mentioned the existence of Al(OH)4−, but no evidence was provided.
To verify the existence of Al(OH)4−, Raman spectra was conducted for the leaching solution (CSA-5min) and a standard solution consisting of 0.1 M NaOH and 0.15 M NaAlO2 were measured to justify this deduction. The results of this are shown in Figure 2. The Raman spectra of alkaline aluminate solution is well established with the main signals in the range of 500–700 cm−1 [29]. Thus, the scanning range in this study was set as 500–750 cm−1. For the standard solution, Figure 2a illustrates that it has a classic Raman spectrum showing only one significant band, centered at approximately 620 cm−1. This band is considered as the symmetric -AlO4 stretching of Al(OH)4− when the concentration of aluminate ion is lower than 0.5 M [30,31,32]. As for the leaching solution, since the concentration is much lower, the signal intensity recedes and the noise becomes stronger. However, the shape of the band, as the curve indicates, which also centered at approximately 620 cm−1, is distinct in Figure 2b. No other prominent bands are found, which means that the ions containing aluminum that exist in the CSA pore solution are mainly in the form of Al(OH)4−, and their concentration can be considered equal to that of Al3+.
3.1.3. Comparison with PWE
The chemical composition of the pore solution was compared with the data from literature to evaluate the validity of the method applied. To enhance the effectiveness of comparison, the pore solution for published data should be extracted from pastes produced by cements with similar chemical composition and w/b ratio. It is difficult to find cases in which the contents of all oxides are similar, so the contents of Na2O and K2O are set as the index, because their contents are the result of cement alkalinity, and the alkalis elements are the main components in the pore solution. The chemical compositions of the pore solutions are summarized in Table 7. Despite the differences between the figures of ESL and PWE from literature, the results acquired by ESL, allowing for the slightly different composition in cement, are acceptable. Additionally, Vollpracht [33] has concluded the variation range of sodium and potassium in pore solution as a function of alkali content. When Na2O (wt%) = 0.20–0.31%, the Na concentration is in the range of 120–180 mmol/L. When K2O (wt%) = 0.20–0.47%, the K concentration is in the range of 180–340 mmol/L. It is clear that the concentrations of Na and K in this work belong to these ranges. Thus, the ESL method employed in this study is capable of providing valid data.
Table 8 lists chemical compositions of pore solutions for CSA. Since few experiments were conducted to analyze the pore solution of CSA, the examples were chosen despite of different cement types and w/b ratios. The differences between the ion concentrations obtained by ESL and the published data are significant, as illustrated in Table 8. All the ions, other than hydroxide, are the result of ESL show higher values. Based on the comparison of OPC systems in Table 7, the ESL should be a reliable method to study the pore solution. The significant differences in Table 8 may be attributed to the different cement type and w/b applied in every case. The hydration of CSA requires higher amount of water than OPC [35]. When the w/b is low, e.g. 0.5, the cement cannot completely hydrate, so there are more ions present in the pore solution.
3.2. Hydration Products
To better understand the pore solution chemistry, the hydration products of OPC and CSA were also studied. Figure 3 illustrates the XRD patterns of hydration products at different times. In the diagram of OPC, the peaks standing for Ca(OH)2 are distinct. The presence of portlandite releases enough hydroxide into the pore solution and offers a buffering capacity to maintain the alkaline environment in OPC. It is known that the CSA clinker contains a certain amount of C2S which can hydrate to form Ca(OH)2. However, in the XRD patterns of CSA in Figure 3b, there are no signals of portlandite. The main hydration product is ettringite with clear peaks even at 1 day, while the other peaks stand for the substances from the clinker, namely unhydrated C4A3 (yeelimite), CaSO4 (Gypsum) and some CaCO3 (carbonate), same as the result of He [19]. The Ca(OH)2 generated by C2S has been completely depleted in the reaction with abundant yeelimite following Equation (3). The lack of Ca(OH)2 reasonably corresponds to the low alkalinity of CSA pore solution.
Another difference between these two cements is that the peaks of CaSO4 were identified in all samples of CSA. This shows that there is redundant CaSO4 during the hydration process, which supports the variation pattern of sulfate content discovered in pore solution chemistry analysis. Evidently, the change in SO42− concentration is due to the combined effect of the depletion of SO42− and the dissolution of CaSO4. According to the water content in Table 4, the hydration of CSA mainly proceeds before the age of three days, during which more sulfate ions are needed as the reactants than what can be dissolved from CaSO4. After that, the hydration is nearly finished, but CaSO4 can still dissolve until the equilibrium is reached. Hence, the SO42− concentration of CSA pore solution stays at a relatively low level at the very early stage, but the value eventually increases again to reach a stable condition of about 50 mmol/L. The existence of CaSO4 also explains the reason for the monosulfoaluminate (AFm) absence. Theoretically, the main hydration products of CSA include both AFt and AFm, as described in Equations (4) and (5). Nevertheless, AFm forms only until all CaSO4 is totally depleted. In this study, the clinker contained enough gypsum, so no AFm was detected in the XRD patterns. Al(OH)3 is also an important hydration product of CSA. However, it cannot be characterized by the peaks because it exists in the form of gel.
3.3. Factors Influencing Steel Passivation
3.3.1. Simulated Pore Solution System
Variation in the water-cement ratio, clinker constitution, hydration time, temperature or other factors may cause the ion composition to change greatly. Thus, it would not be suitable to adopt an SPS of a certain composition to simulate the pore solution of CSA. A SPS system covering the chemical composition of most cases is required. Considering the values listed in Table 5, as well as the information from literature review, the variation ranges of the main anions were set as follows: SO42− (0–0.05 M), OH− (0.001–0.1 M), and Al(OH)4− at (0–0.2 M). In this study, Al(OH)4− was produced by AlO2−. Given that the hydrolysis of Al(OH)4− will release OH−, the maximum dosage was limited to control the increase of pH within 0.1. For convenience, both Na+ and K+ were represented by Na+. Hence, the SPSs were prepared with NaOH, NaAlO2, and Na2SO4 following the compositions shown in Table 2. All the solutions were measured using a pH meter to ensure that the pH deviations of the solutions with the same NaOH concentration were kept within 0.1.
3.3.2. Effect of Alkalinity
Figure 4 displays the evolution of the open circuit potential (OCP) with three levels of alkalinity. The curves related to 0.1 M and 0.01 M OH− are similar, starting from a value of about −150 mv and stabilizing at −75 mv after three days, which is analogous to the result of Poursaee [5]. However, when the hydroxyl concentration was reduced to 0.001 M, the corrosion potential only increased during the first three days, then dropped rapidly. After six days, the potential was as low as −675 mv, indicating the depassivation of the steel electrode. The development of the corrosion potential reveals that the hydroxyl concentration is significant to passivation. Being exposed to an environment of low alkalinity increases vulnerability to depassivation.
3.3.3. Effect of Sulfate Ion
Figure 5 shows the effect of SO42− on the corrosion potential under different levels of alkalinity. It can be seen in Figure 5a that although the potentials of all samples stabilize within the range of passivation after four days, the potentials decrease after the addition of Na2SO4. However, there is no clear correlation between the extent of potential reduction and the SO42− concentration. When the OH− concentration drops to 0.01 M, the samples will depassivate as long as the SPSs contain a thimbleful of sulfate, and the time necessary for depassivation negtively correlates to the concentrations of sulfate. Once NaOH reduces to 0.001 M, as shown in Figure 5c, all samples are not able to passivate, despite of the SO42− concentration.
Several papers have been published on the effects of SO42−, but they neglect the influence of hydroxyl concentrations [10,11,12,13,14]. From the evolution of the corrosion potential in Figure 5, it is evident that the depassivation caused by SO42− is sensitive to alkalinity. When the concentration of hydroxyl is lower than 0.01 M, the destruction of passive film will be obvious. The underlying mechanism is probably related to the way that the sulfate ion damages passive film. Regarding the depassivation triggered by chloride ions, an adsorption mechanism is applied, i.e., Cl− competes with OH− at the steel surface, thereby gradually destroying the passive film [36]. The potential generally decreases with the increase of chloride concentrations, while the sulfate ion plays a totally different role. It directly participates in the passivation process to generate a film with a structure of inferior quality [10,37]. This theory agrees with the experimental results. The decline of the potentials displayed in Figure 5a after adding sulfate implies that the tendency of depassivation increases, which means the stability of the passive film weakens. However, since the alkalinity is high enough, passivation can still be maintained, and the drop in potential is not affected by the increase of sulfate concentrations. When the concentration of hydroxyl decreases, the unstable passive film can no longer be maintained. Therefore, depassivation happens to all the steel samples in the manner of the potential development depicted in in Figure 5b,c.
3.3.4. Effect of Aluminate Ion
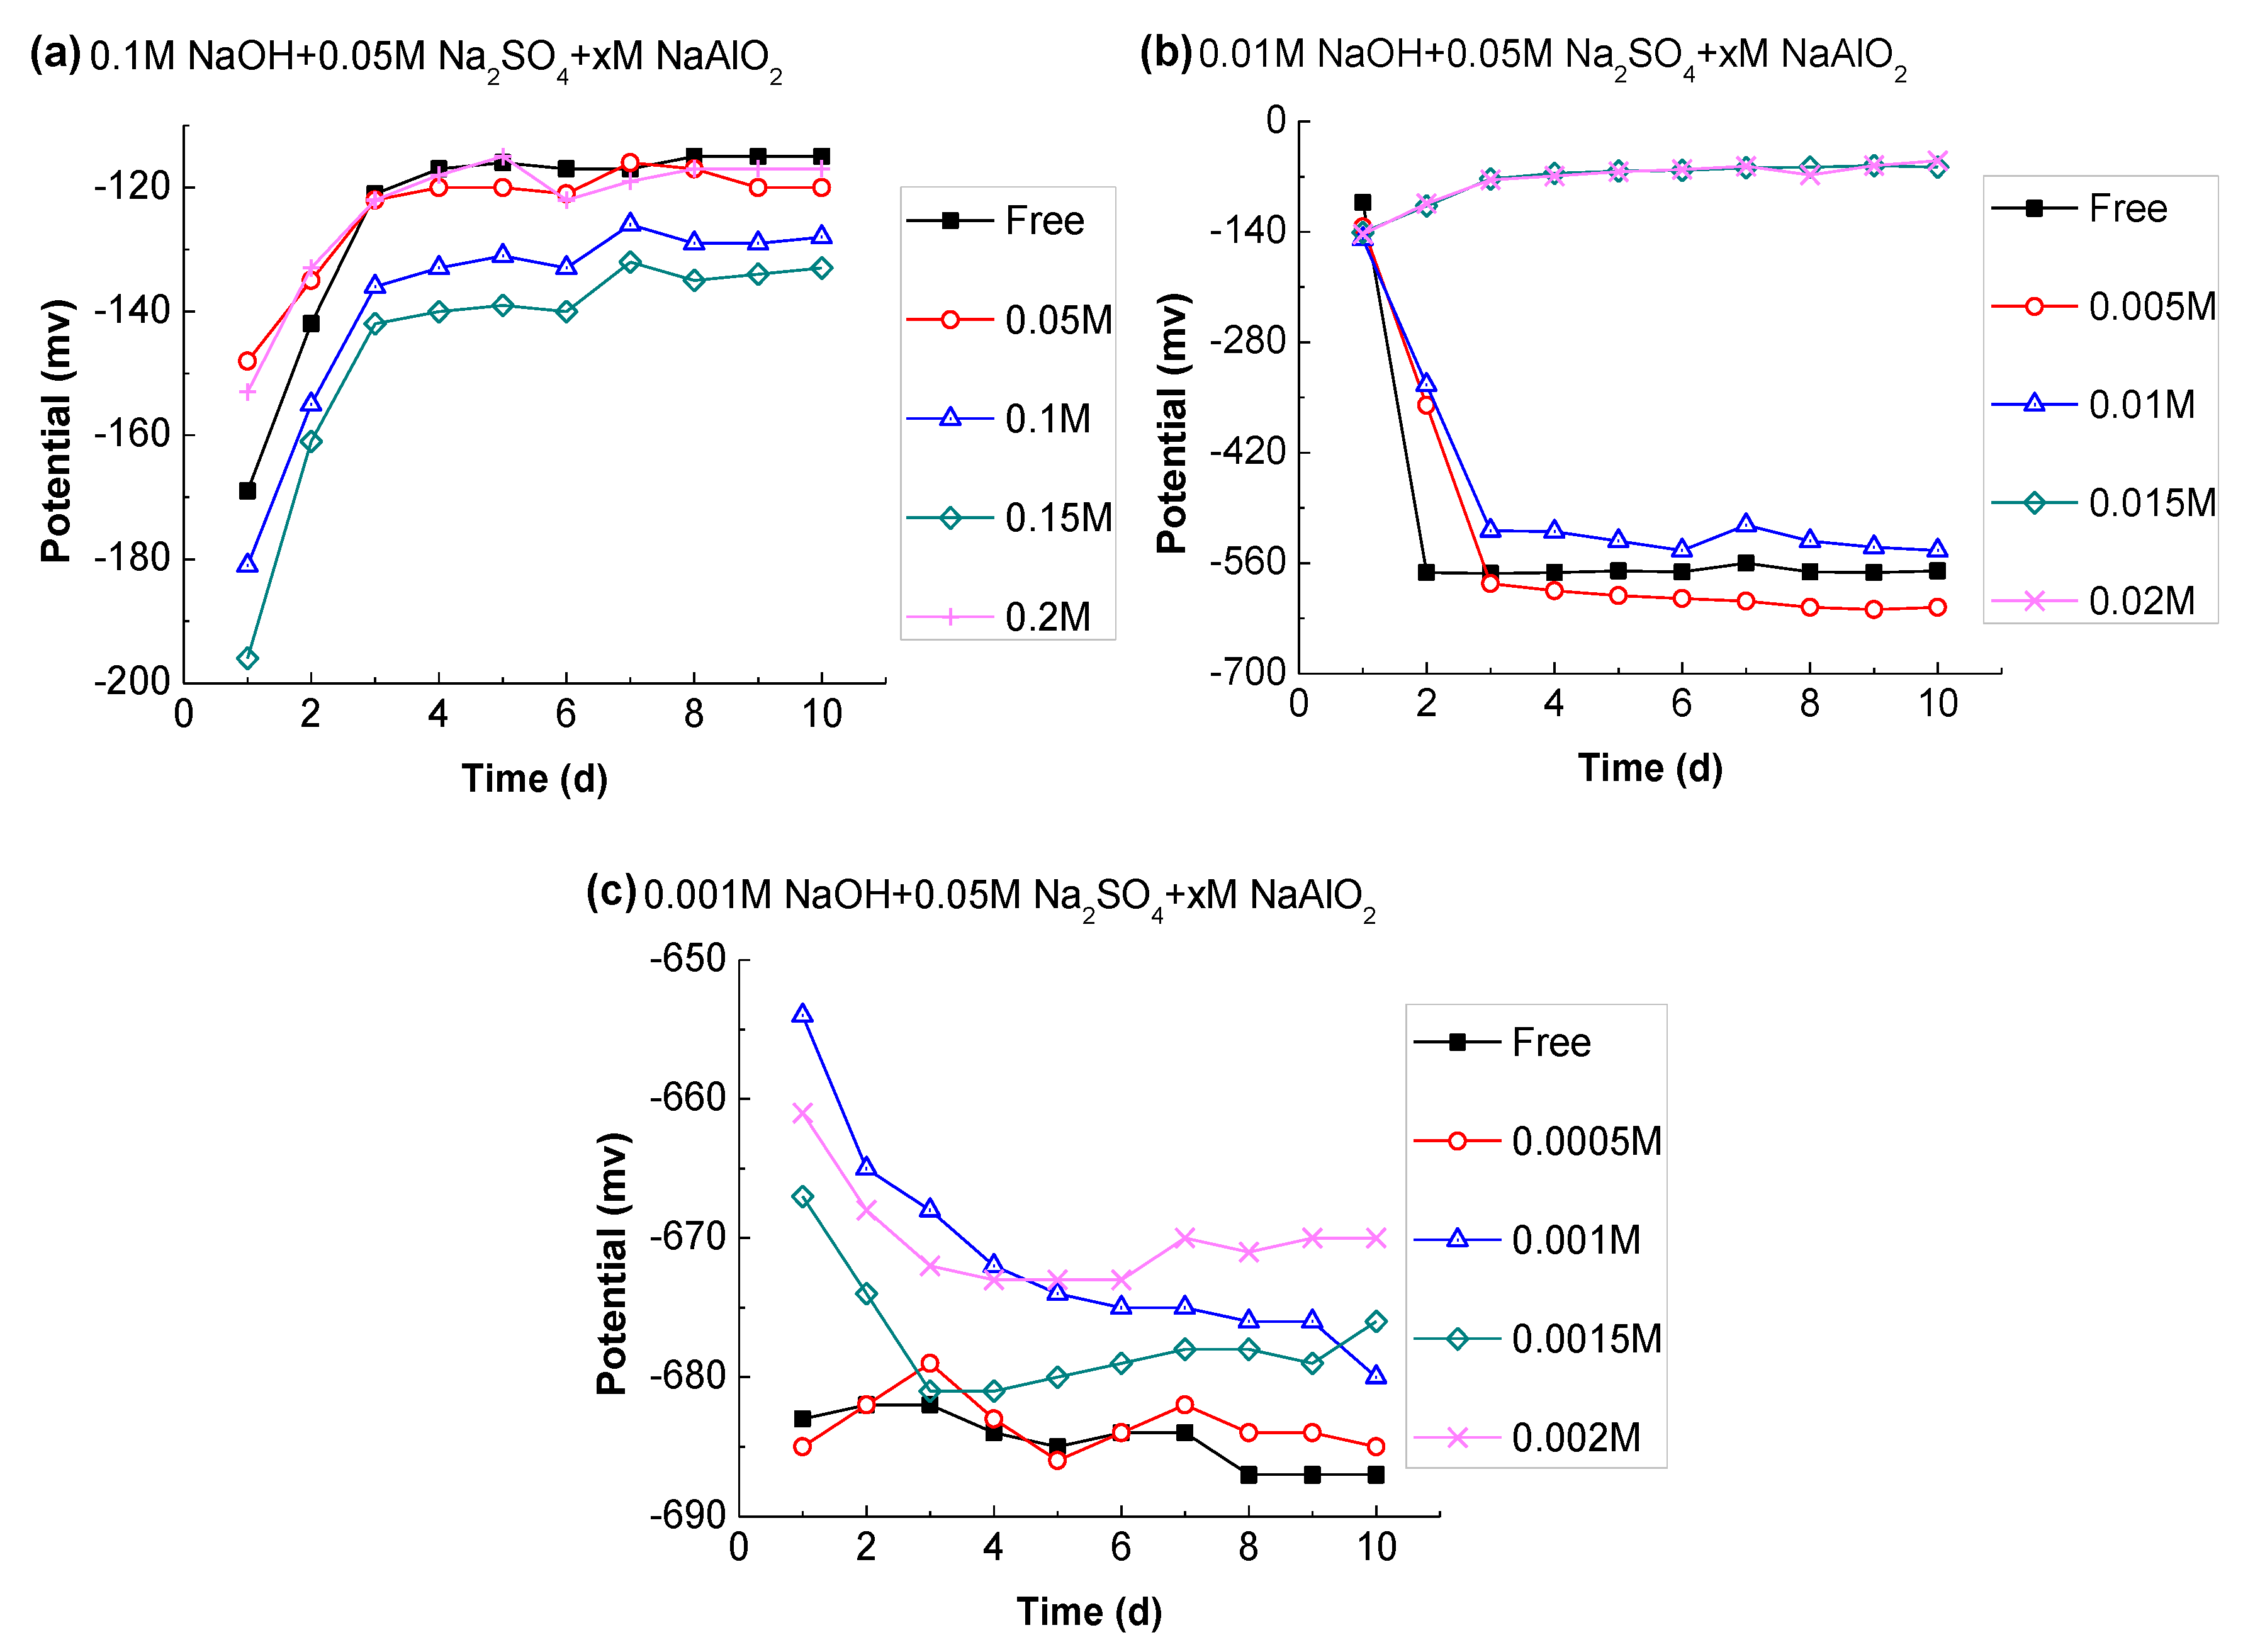
The effect of Al(OH)4− on the corrosion potentials of steel samples in SPSs containing 0.05 M Na2SO4 is shown in Figure 6. In Figure 6a, the high concentration of OH− can keep all samples well passivated, so the association between Al(OH)4− and passivation is not obvious. When the concentration of hydroxyl reduced to 0.01 M, the potential developments change significantly. In cases of SPSs containing NaAlO2 concentrations lower than 0.015 M, all the steel electrodes corrode, while the other two samples mixed with higher amounts of aluminate are able to passivate, exhibiting potentials higher than −140 mv. However, if the alkalinity further decreases to 0.001 M as shown in Figure 6c, the potentials of all samples drop under −670 mv. By sorting the potentials according to their values, an interesting point is noted that the tendency to corrode, expressed by potential values, negatively correlates to the concentration of aluminate. Hence, it can be inferred that Al(OH)4− is beneficial to the passive film’s stability.
The protection provided by Al(OH)4− is attributed to its ability to release hydroxyl. In the corrosion process, localized acidification occurs in the active point because of the hydrolysis of metal ion [38,39,40], as explained by Equation (6). If there is no immediate additional supplement of OH− from the adjoining solution, this active point will not be repaired (repassivation) and corrosion occurs. With the addition of NaAlO2, the resultant Al(OH)4− can release OH− to buffer the acidification effect, as shown in Equation (7). Furthermore, if the NaAlO2 concentration is sufficient, OH− is constantly replenished, so the steel can always be passivated.
3.4. Corrosion Behavior of Steel in CSA Based Materials
Currently, research concerned with the corrosion behavior of steel in CSA-based materials is limited in scope. The passivation state of the steel is still in dispute. It has been reported that the steel mesh in a concrete pipe exposed to seawater was uncorroded after 14 years in service. But the chemical composition of the cement used, the mix design of the concrete and the pH of pore solution were unknown [35]. Janotka [3] claimed that the passive film on steel in CSA mortar was not stable due to the pore solution of low alkalinity. The pH value of CSA leaching solution was 11.32, lower than the critical value (11.5) for passivation. This justification is not suitable. It can be easily understood that the reported pH value only stands for the leachate, but not the pore solution of mortar. The true pH value of the pore solution should be over 12, which would be able to passivate the steel. Hence, the deterioration of passive film was probably caused by other reasons. According to the research results in this work, the pore solution of CSA always contains a significant amount of sulfate ion, and Figure 5 shows that sulfate ion is able to depassivate steel, even when pH is 12. So, in Janotka’s work, not only the relatively low alkalinity, but also the sulfate ion present in pore solution were important factors which contributed to depassivation. Cai [6] noticed that tiny corrosion on steel bars may occur, but the development of corrosion can be controlled, because concrete will become more compactness due to the hydration of CSA. Based on the development of the pore solution chemistry studied in Section 3.1, the tiny corrosion at initial stage was probably caused by sulfate ion in the pore solution of low alkalinity. This kind of corrosion behavior is consistent with the mechanism that how sulfate ion affects passivation. On the other hand, the effect of Al(OH)4− was not clear in the cases available, and further studies are necessary to verify the function of Al(OH)4− in CSA mortar or concrete.
4. Conclusions
The chemistry of pore solutions is an important factor in influencing steel passivation in concrete. The experiments included in this research reveal the differences between OPC and CSA with regards to pore solution composition, based on which an SPS system was designed to study the effect of CSA pore solution chemistry on steel passivation. The conclusions can be summarized as follows:
- The cations in CSA and OPC are similar, both mainly containing Na+, K+, and little Ca2+. However, the composition of anions varies greatly.
- The concentration of OH− in the CSA pore solution is only 55.34 mmol/L at 28 days, while the value of OPC is 451.3 mmol/L. The corrosion potential development in SPSs indicates that alkalinity is the most significant factor for steel passivation. When the OH− is below 0.001 M, the steel cannot passivate in any situations. Thus, the steel passive film formed in the environment of CSA is less stable than that in OPC.
- A high concentration of Al(OH)4− was detected in CSA pore solution, and its effect on steel passivation was studied. High content of Al(OH)4− can release enough OH− to offer a buffering capacity for the solution alkalinity, hence improving the stability of the passive film.
- The sulfate ions in CSA can remain at a level of about 50 mmol/L, while their concentration in the OPC was negligible after one day of hydration. According to its potential evolution, it was concluded that SO42− is adverse to the stability of passive film, but the effect was only obvious in the case of low alkalinity (C(OH) ≤ 0.01 M), and the negative impact can be reduced with Al(OH)4−.
Author Contributions
Conceptualization, L.W. and S.Z.; methodology, L.W.; software, L.W.; validation, L.W., S.Z. and X.T.; formal analysis, L.W.; investigation, L.W. and X.T; resources, Q.X. and K.Q.; data curation, L.W.; writing—original draft preparation, L.W.; writing—review and editing, L.W. and S.Z.; visualization, L.W.; supervision, S.Z.; project administration, L.W.; funding acquisition, S.Z.
Funding
This research was funded by National Key R&D Program of China, grant number 2016YFB0303505-04.
Conflicts of Interest
The authors declare no conflict of interest.
References
- Montemor, M.F.; Simões, A.M.P.; Ferreira, M.G.S. Chloride-Induced Corrosion on Reinforcing Steel: From the Fundamentals to the Monitoring Techniques. Cem. Concr. Compos. 2003, 25, 491–502. [Google Scholar] [CrossRef]
- Scott, A.; Alexander, M.G. Effect of Supplementary Cementitious Materials (Binder Type) on the Pore Solution Chemistry and the Corrosion of Steel in Alkaline Environments. Cem. Concr. Res. 2016, 89, 45–55. [Google Scholar] [CrossRef]
- Janotka, I.; Krajči, L. An Experimental Study on the Upgrade of Sulfoaluminate—Belite Cement Systems by Blending with Portland Cement. Adv. Cem. Res. 1999, 11, 35–41. [Google Scholar] [CrossRef]
- Kalogridis, D.; Kostogloudis, G.C.; Ftikos, C.; Malami, C. Quantitative Study of the Influence of Non-Expansive Sulfoaluminate Cement on the Corrosion of Steel Reinforcement. Cem. Concr. Res. 2000, 30, 1731–1740. [Google Scholar] [CrossRef]
- Poursaee, A.; Hansson, C.M. Reinforcing Steel Passivation in Mortar and Pore Solution. Cem. Concr. Res. 2007, 37, 1127–1133. [Google Scholar] [CrossRef]
- Cai, G.; Zhao, J. Application of Sulphoaluminate Cement to Repair Deteriorated Concrete Members in Chloride Ion Rich Environment—A Basic Experimental Investigation of Durability Properties. KSCE J. Civ. Eng. 2016, 20, 2832–2841. [Google Scholar] [CrossRef]
- Ghods, P.; Isgor, O.B.; McRae, G.; Miller, T. The Effect of Concrete Pore Solution Composition on the Quality of Passive Oxide Films on Black Steel Reinforcement. Cem. Concr. Compos. 2009, 31, 2–11. [Google Scholar] [CrossRef]
- Page, C.L. Initiation of Chloride-Induced Corrosion of Steel in Concrete: Role of the Interfacial Zone. Mater. Corros. 2009, 60, 586–592. [Google Scholar] [CrossRef]
- Alhozaimy, A.; Hussain, R.R.; Al-Negheimish, A.; Al-Zaid, R.; Singh, D.D.N. Effect of Simulated Concrete Pore Solution Chemistry, Chloride Ions, and Temperature on Passive Layer Formed on Steel Reinforcement. ACI Mater. J. 2014, 111, 411–421. [Google Scholar] [CrossRef]
- Abd El Haleem, S.M.; Abd El Wanees, S.; Bahgat, A. Environmental Factors Affecting the Corrosion Behaviour of Reinforcing Steel. V. Role of Chloride and Sulphate Ions in the Corrosion of Reinforcing Steel in Saturated Ca(OH)2 solutions. Corros. Sci. 2013, 75, 1–15. [Google Scholar] [CrossRef]
- Premlall, K.; Potgieter, J.H.; Potgieter-Vermaak, S. Laser Surface Treatment to Inhibit Observed Corrosion of Reinforcing Steel in Sulphate: Alkaline Media. Anti-Corrosion Methods Mater. 2011, 58, 267–284. [Google Scholar] [CrossRef]
- Williamson, J.; Isgor, O.B. The Effect of Simulated Concrete Pore Solution Composition and Chlorides on the Electronic Properties of Passive Films on Carbon Steel Rebar. Corros. Sci. 2016, 106, 82–95. [Google Scholar]
- Shaheen, F.; Pradhan, B. Influence of Sulfate Ion and Associated Cation Type on Steel Reinforcement Corrosion in Concrete Powder Aqueous Solution in the Presence of Chloride Ions. Cem. Concr. Res. 2017, 91, 73–86. [Google Scholar] [CrossRef]
- Mammoliti, L.; Hansson, C.M. Influence of Cation on Corrosion Behavior of Reinforcing Steel in High-PH Sulfate Solutions. ACI Mater. J. 2005, 102, 279–285. [Google Scholar]
- Shang, B.; Ma, Y.; Meng, M.; Li, Y. The Roles Carbonate and Bicarbonate Ions Play on Pre-Passive HRB400 Rebars in Simulated Pore Solutions of Deteriorating Concrete. Mater. Corros. 2018, 29, 1800–1810. [Google Scholar] [CrossRef]
- Kasselouri, V.; Tsakiridis, P.; Malami, C.; Georgali, B.; Alexandridou, C. A Study on the Hydration Products of a Non-Expansive Sulfoaluminate Cement. Cem. Concr. Res. 1995, 25, 1726–1736. [Google Scholar]
- Winnefeld, F.; Lothenbach, B. Hydration of Calcium Sulfoaluminate Cements—Experimental Findings and Thermodynamic Modelling. Cem. Concr. Res. 2010, 40, 1239–1247. [Google Scholar]
- Telesca, A.; Marroccoli, M.; Pace, M.L.; Tomasulo, M.; Valenti, G.L.; Monteiro, P.J.M. A Hydration Study of Various Calcium Sulfoaluminate Cements. Cem. Concr. Compos. 2014, 53, 224–232. [Google Scholar] [CrossRef]
- He, Z.; Yang, H.; Liu, M. Hydration Mechanism of Sulphoaluminate Cement. J. Wuhan Univ. Technol. Mater. Sci. Ed. 2014, 29, 70–74. [Google Scholar] [CrossRef]
- Andersson, K.; Allard, B.; Bengtsson, M.; Magnusson, B. Chemical Composition of Cement Pore Solutions. Cem. Concr. Res. 1989, 19, 327–332. [Google Scholar] [CrossRef]
- Moragues, A.; Macias, A.; Andrade, C.; Poursaee, A.; Hansson, C.M.; Moragues, A.; Macias, A.; Andrade, C.; Blanco, G.; Bautista, A.; et al. Equilibria of the Chemical Composition of the Concrete Pore. Cem. Concr. Res. 1987, 17, 173–182. [Google Scholar] [CrossRef]
- Plusquellec, G.; Geiker, M.R.; Lindgård, J.; Duchesne, J.; Fournier, B.; De Weerdt, K. Determination of the PH and the Free Alkali Metal Content in the Pore Solution of Concrete: Review and Experimental Comparison. Cem. Concr. Res. 2017, 96, 13–26. [Google Scholar] [CrossRef]
- Andac, M.; Glasser, F.P. Pore Solution Composition of Calcium Sulfoaluminate Cement. Adv. Cem. Res. 1999, 11, 23–26. [Google Scholar] [CrossRef]
- Barneyback, R.S.; Diamond, S. Expression and Analysis of Pore Fluids from Hardened Cement Pastes and Mortars. Cem. Concr. Res. 1981, 11, 279–285. [Google Scholar] [CrossRef]
- Pavlík, V. Water Extraction of Chloride, Hydroxide and Other Ions from Hardened Cement Pastes. Cem. Concr. Res. 2000, 30, 895–906. [Google Scholar] [CrossRef]
- Li, L.; Nam, J.; Hartt, W.H. Ex Situ Leaching Measurement of Concrete Alkalinity. Cem. Concr. Res. 2005, 35, 277–283. [Google Scholar] [CrossRef]
- Brown, P.W.; Bothe, J.V. The Stability of Ettringite. Adv. Cem. Res. 1993, 5, 47–63. [Google Scholar] [CrossRef]
- Berger, S.; Aouad, G.; Cau Dit Coumes, C.; Le Bescop, P.; Damidot, D. Leaching of Calcium Sulfoaluminate Cement Pastes by Water at Regulated PH and Temperature: Experimental Investigation and Modeling. Cem. Concr. Res. 2013, 53, 211–220. [Google Scholar] [CrossRef]
- Sipos, P. The Structure of Al(III) in Strongly Alkaline Aluminate Solutions—A Review. J. Mol. Liq. 2009, 146, 1–14. [Google Scholar] [CrossRef]
- Watling, H. Spectroscopy of Concentrated Sodium Aluminate Solutions. Appl. Spectrosc. 1998, 52, 250–258. [Google Scholar] [CrossRef]
- Johnston, C.T.; Agnew, S.F.; Schoonover, J.R.; Kenney, J.W.; Page, B.; Osborn, J.; Corbin, R. Raman Study of Aluminum Speciation in Simulated Alkaline Nuclear Waste. Environ. Sci. Technol. 2002, 36, 2451–2458. [Google Scholar] [CrossRef]
- Sipos, P.; Hefter, G.; May, P.M. 27Al NMR and Raman Spectroscopic Studies of Alkaline Aluminate Solutions with Extremely High Caustic Content—Does the Octahedral Species Al(OH) 63—Exist in Solution? Talanta 2006, 70, 761–765. [Google Scholar] [CrossRef]
- Vollpracht, A.; Lothenbach, B.; Snellings, R.; Haufe, J. The Pore Solution of Blended Cements: A Review. Mater. Struct. Constr. 2016, 49, 3341–3367. [Google Scholar] [CrossRef]
- Diamond, S. Effects of Microsilica (Silica Fume) on Pore-Solution Chemistry of Cement Pastes. J. Am. Ceram. Soc. 1983, 66, C82–C84. [Google Scholar] [CrossRef]
- Glasser, F.P.; Zhang, L. High-Performance Cement Matrices Based on Calcium Sulfoaluminate-Belite Compositions. Cem. Concr. Res. 2001, 31, 1881–1886. [Google Scholar] [CrossRef]
- Abd El Haleem, S.M.; Abd El Wanees, S.; Abd El Aal, E.E.; Diab, A. Environmental Factors Affecting the Corrosion Behavior of Reinforcing Steel II. Role of Some Anions in the Initiation and Inhibition of Pitting Corrosion of Steel in Ca(OH)2 solutions. Corros. Sci. 2010, 52, 292–302. [Google Scholar] [CrossRef]
- Al-Tayyib, A.J.; Somuah, S.K.; Boah, J.K.; Leblanc, P.; Al-Mana, A.I. Laboratory Study on the Effect of Sulfate Ions on Rebar Corrosion. Cem. Concr. Res. 1988, 18, 774–782. [Google Scholar] [CrossRef]
- Huet, B.; L’Hostis, V.; Tricheux, L.; Idrissi, H. Influence of Alkali, Silicate, and Sulfate Content of Carbonated Concrete Pore Solution on Mild Steel Corrosion Behavior. Mater. Corros. 2010, 61, 111–124. [Google Scholar] [CrossRef]
- Soltis, J. Passivity Breakdown, Pit Initiation and Propagation of Pits in Metallic Materials—Review. Corros. Sci. 2015, 90, 5–22. [Google Scholar] [CrossRef]
- Glass, G.K.; Buenfeld, N.R. Chloride-Induced Corrosion of Steel in Concrete. Prog. Struct. Engng. Mater. 2000, 2, 448–458. [Google Scholar] [CrossRef]
Figure 1.
Pore solution pH development for CSA and OPC.
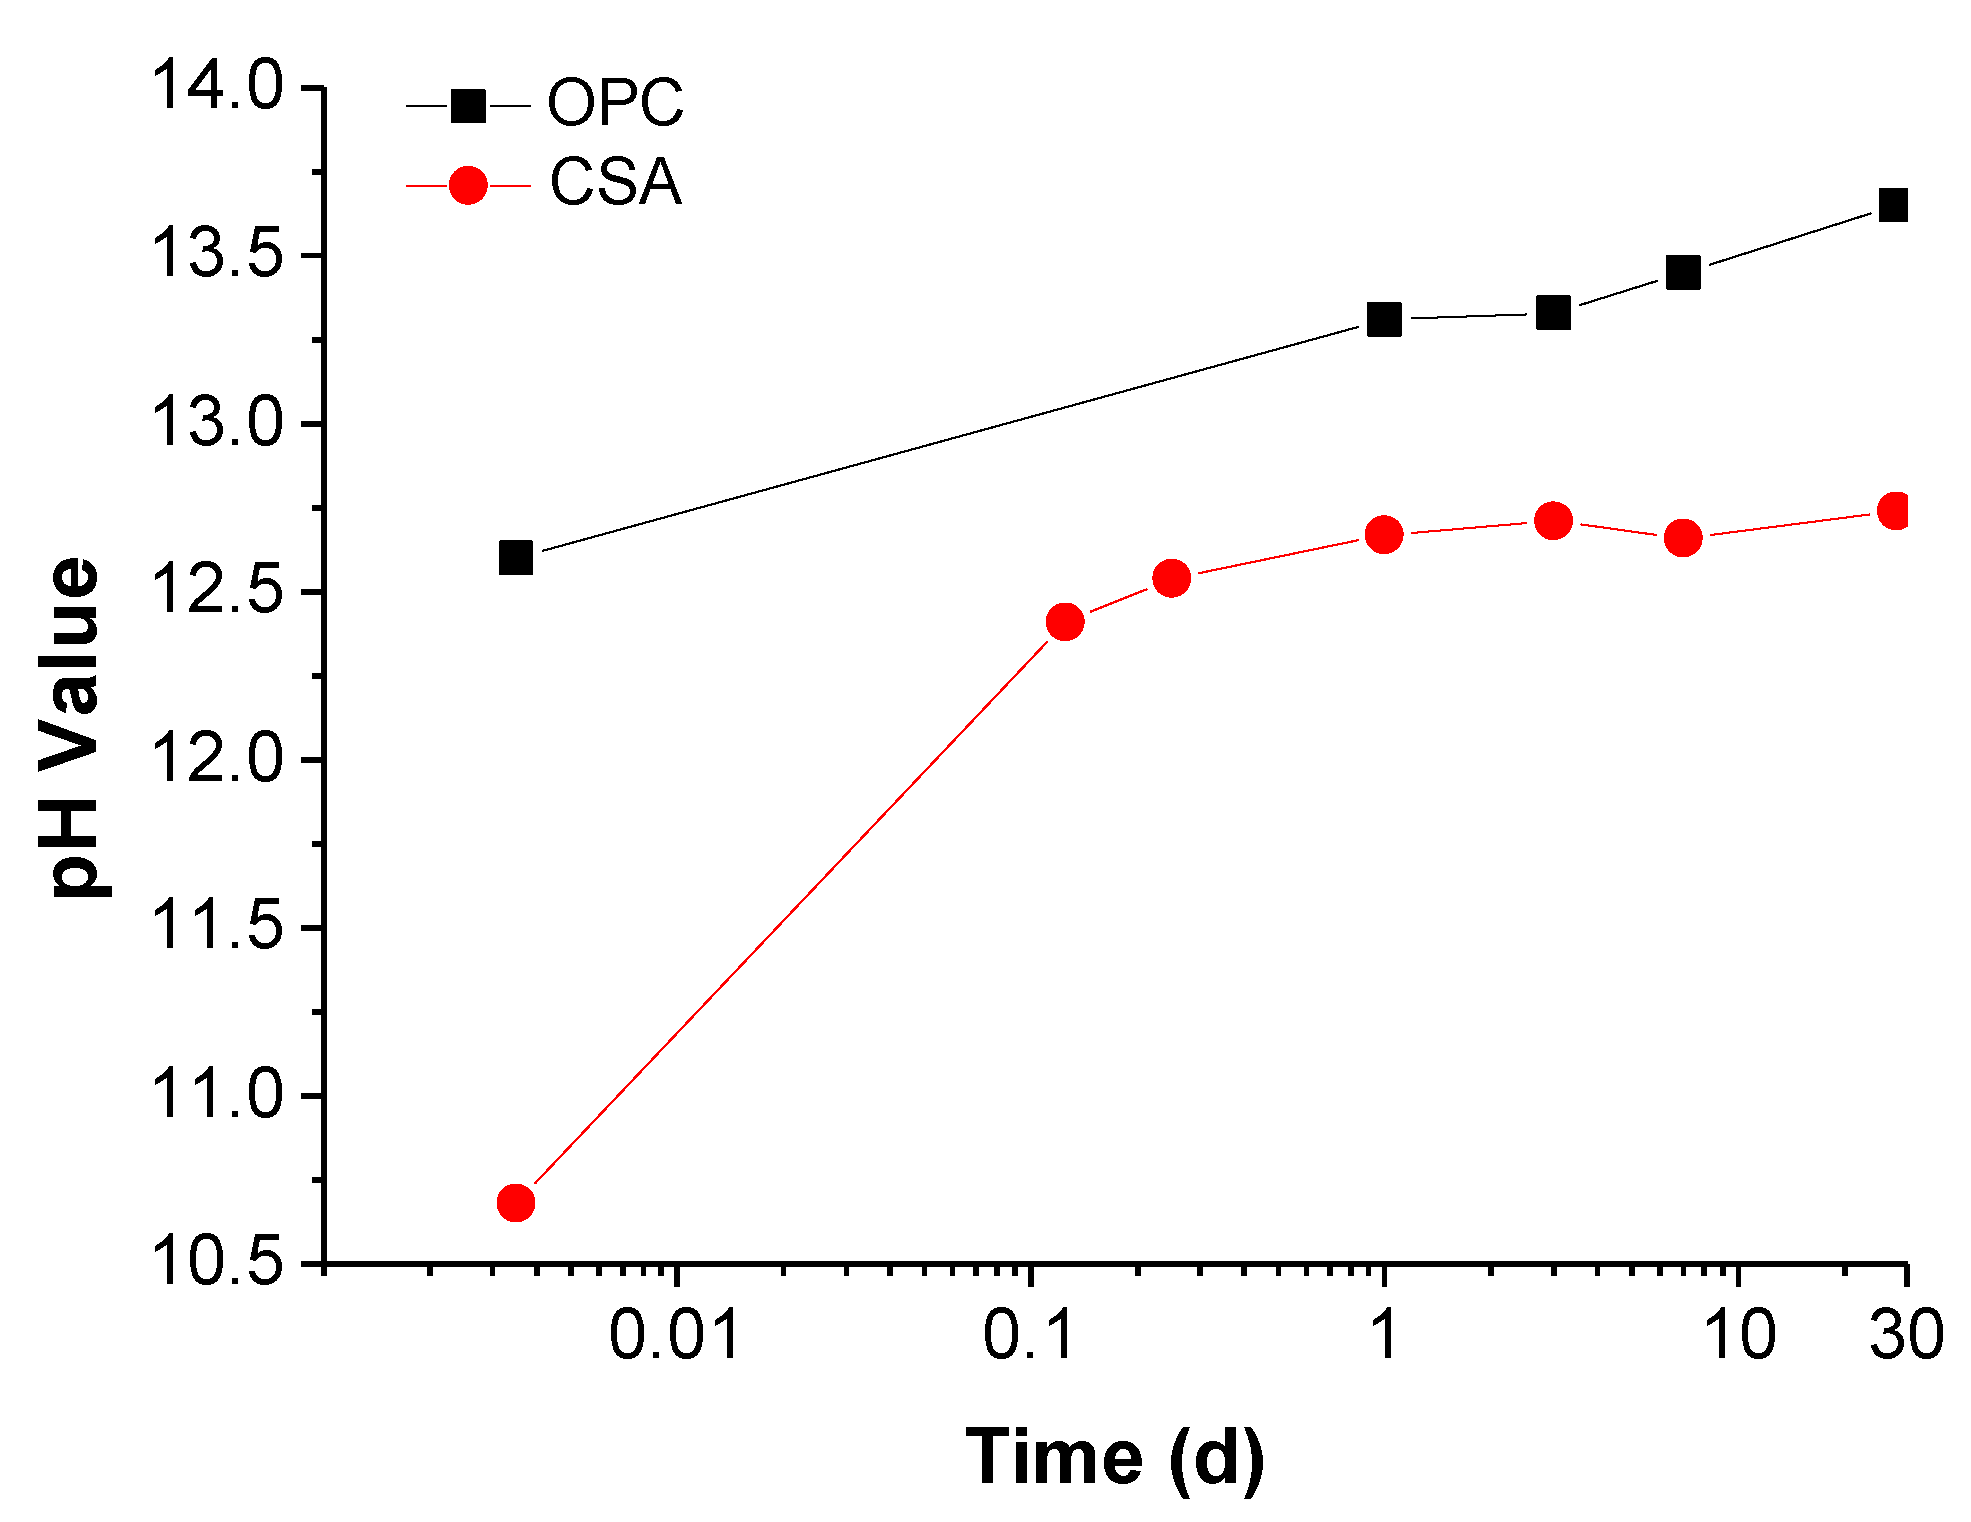
Figure 2.
Raman spectrum of a standard solution and the leaching solution. (a) standard solution, (b) leaching solution.
Figure 2.
Raman spectrum of a standard solution and the leaching solution. (a) standard solution, (b) leaching solution.
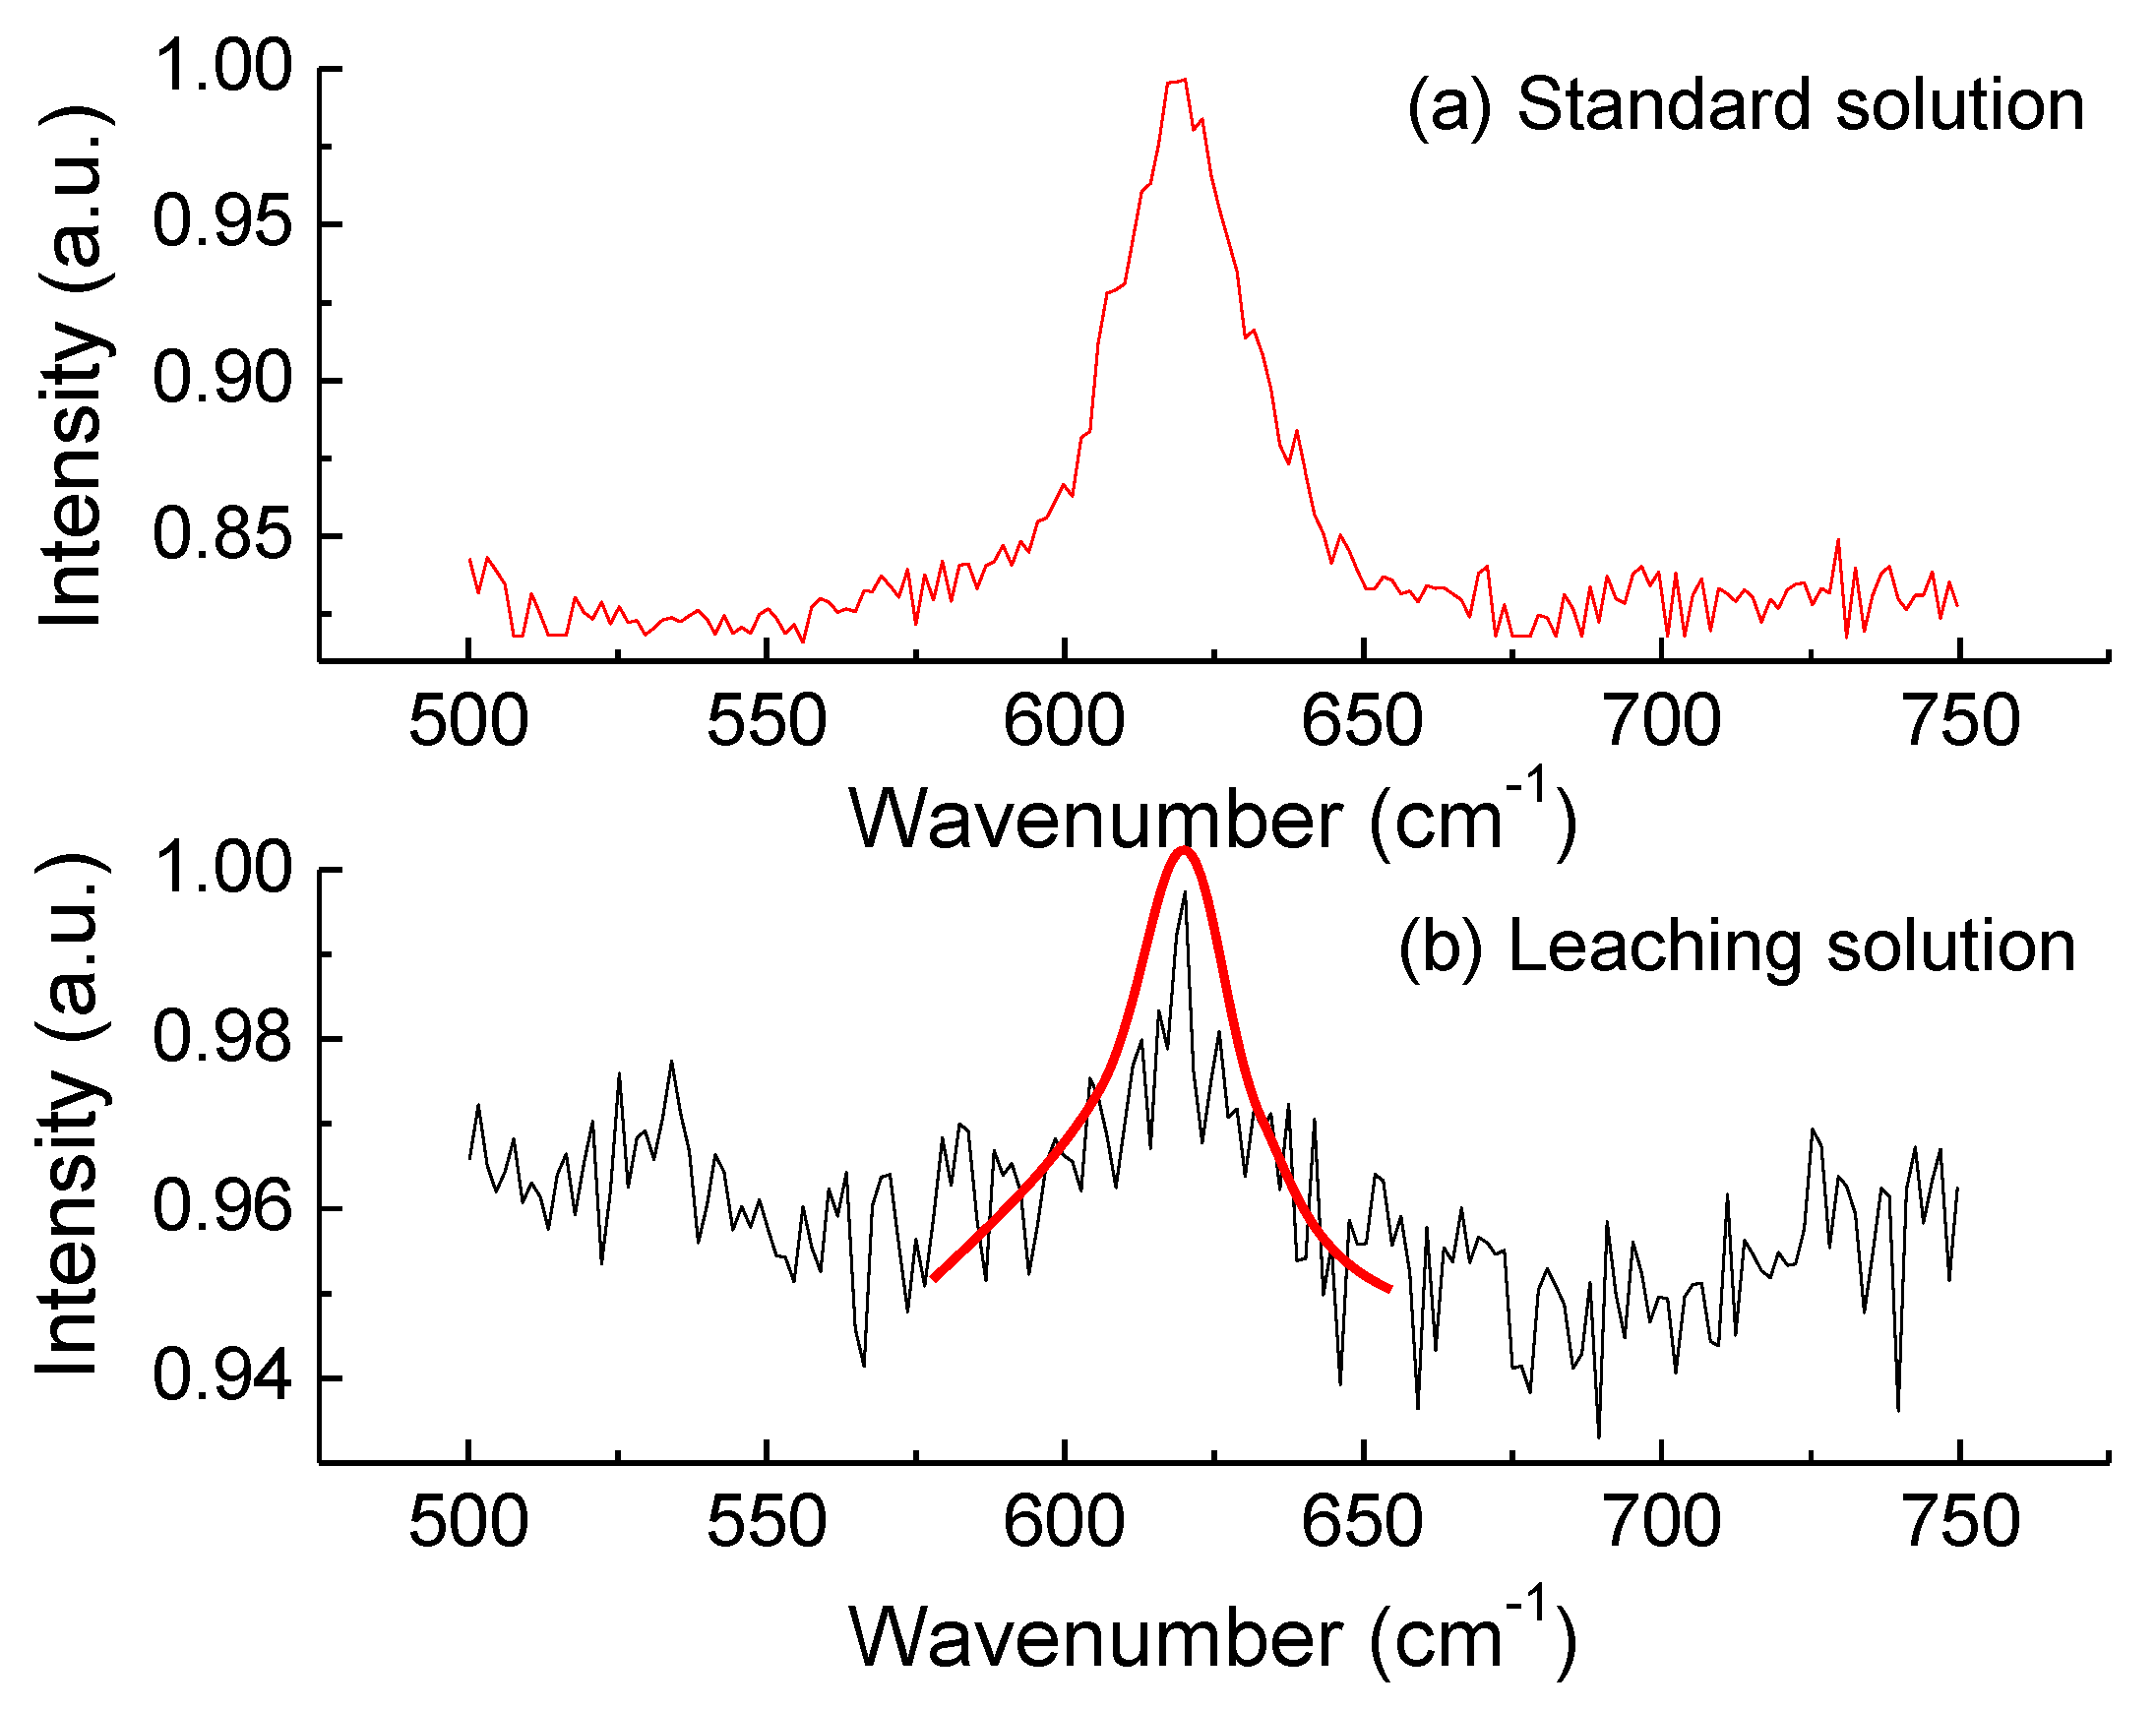
Figure 3.
X-ray diffraction patterns of (a) OPC and (b) CSA. (C: carbonate, E: ettringite, G: gypsum, H: C-S-H, P: portlandite, Y: yeelimite).
Figure 3.
X-ray diffraction patterns of (a) OPC and (b) CSA. (C: carbonate, E: ettringite, G: gypsum, H: C-S-H, P: portlandite, Y: yeelimite).
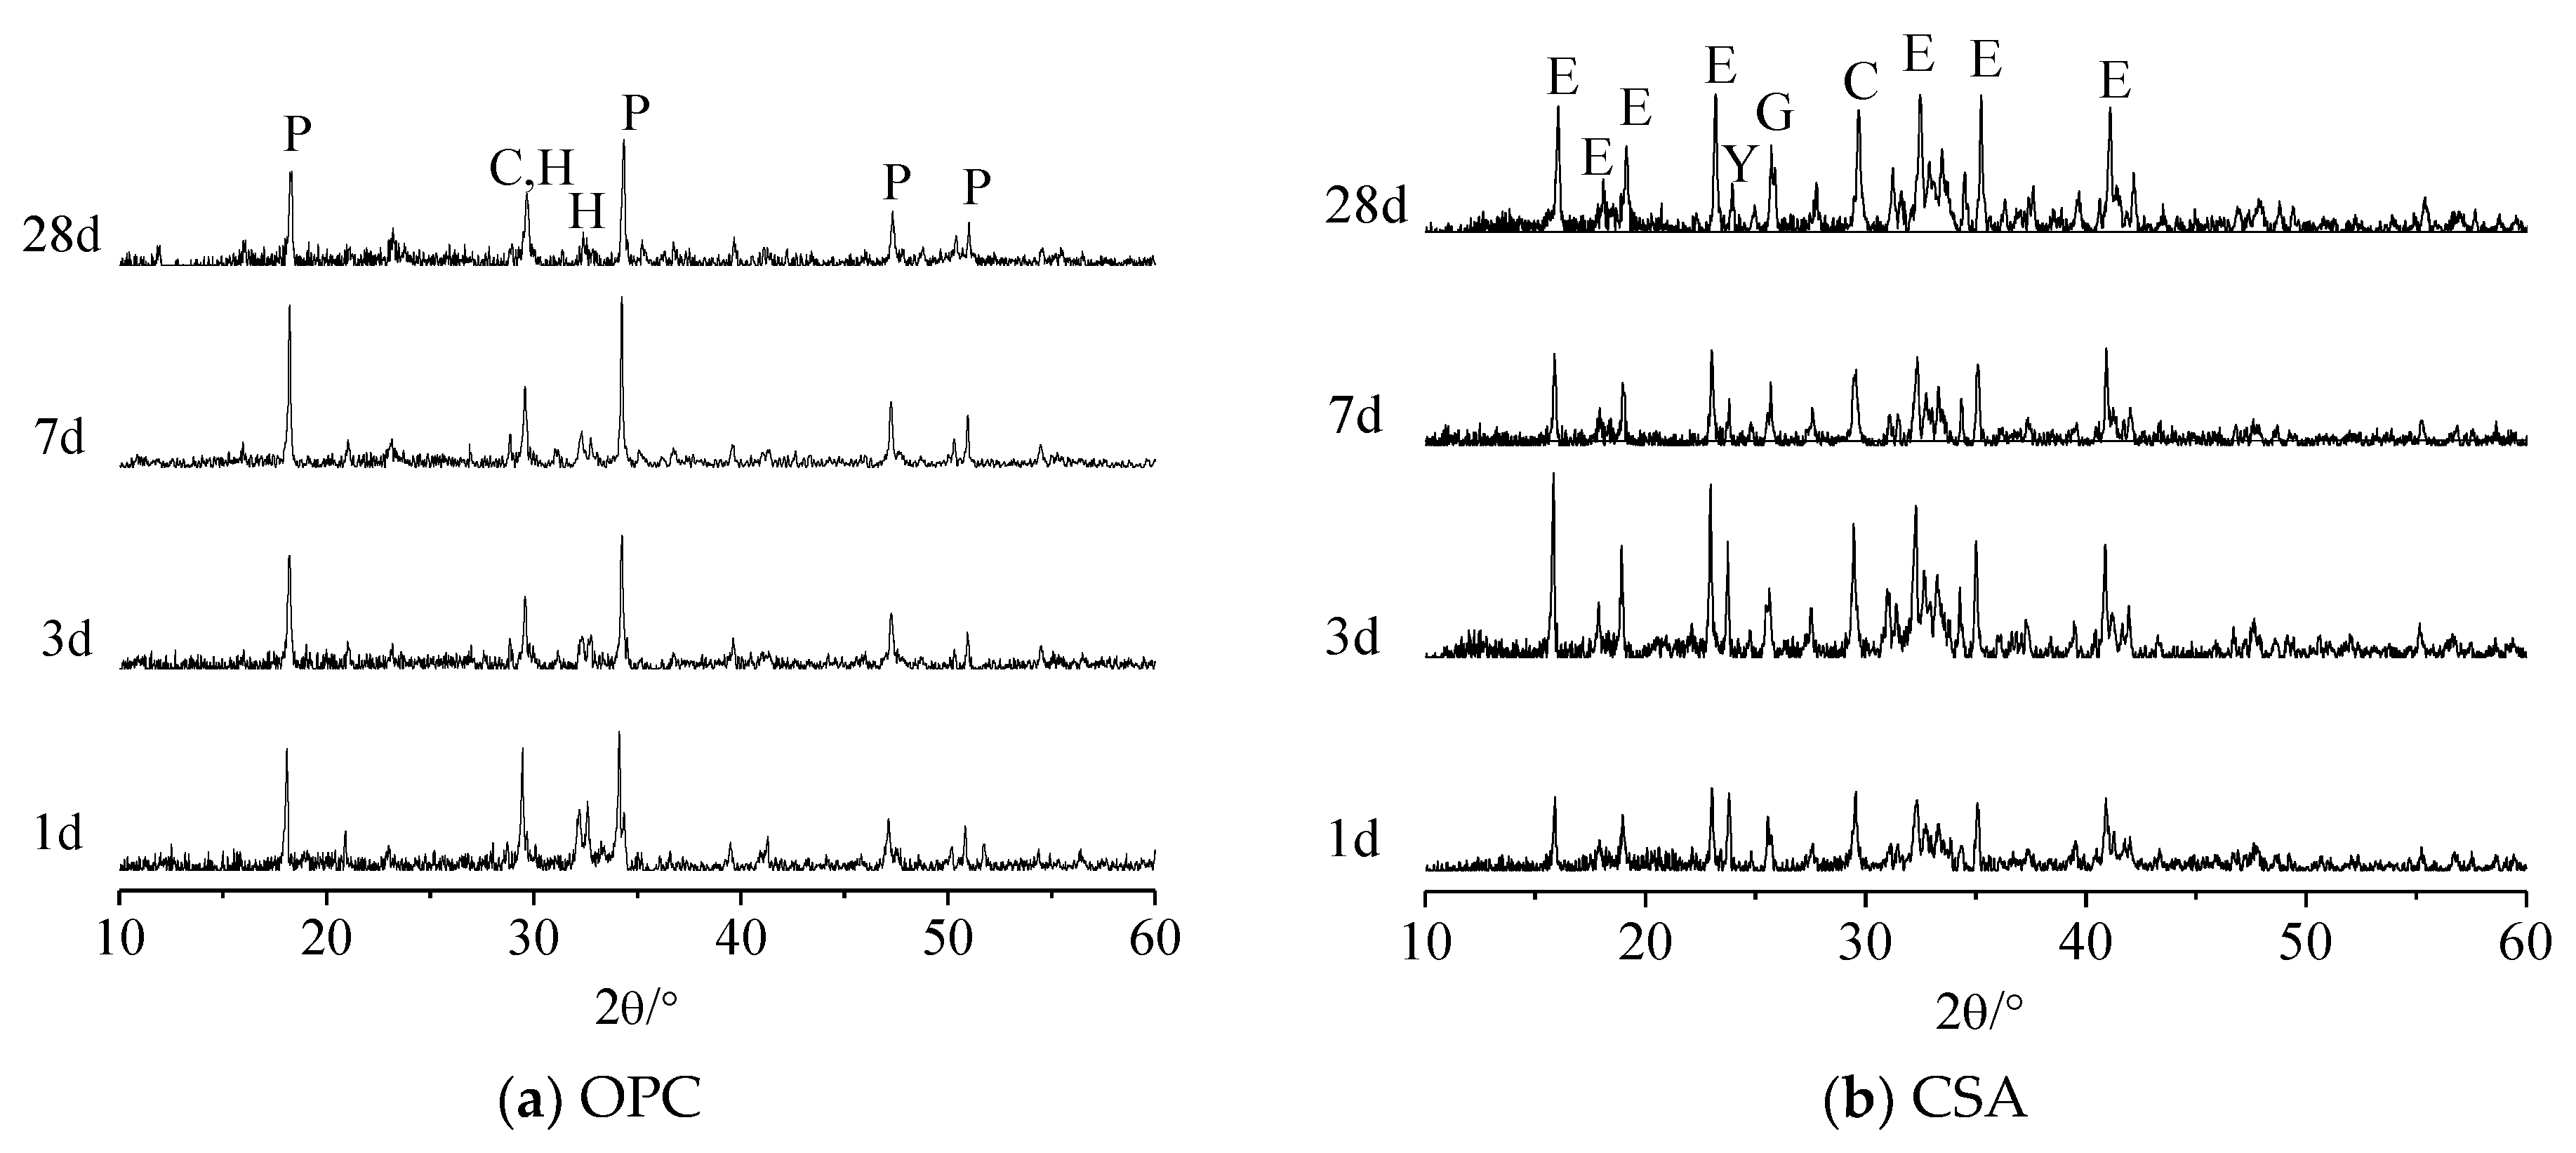
Figure 4.
Effect of OH− concentration on the OCP.
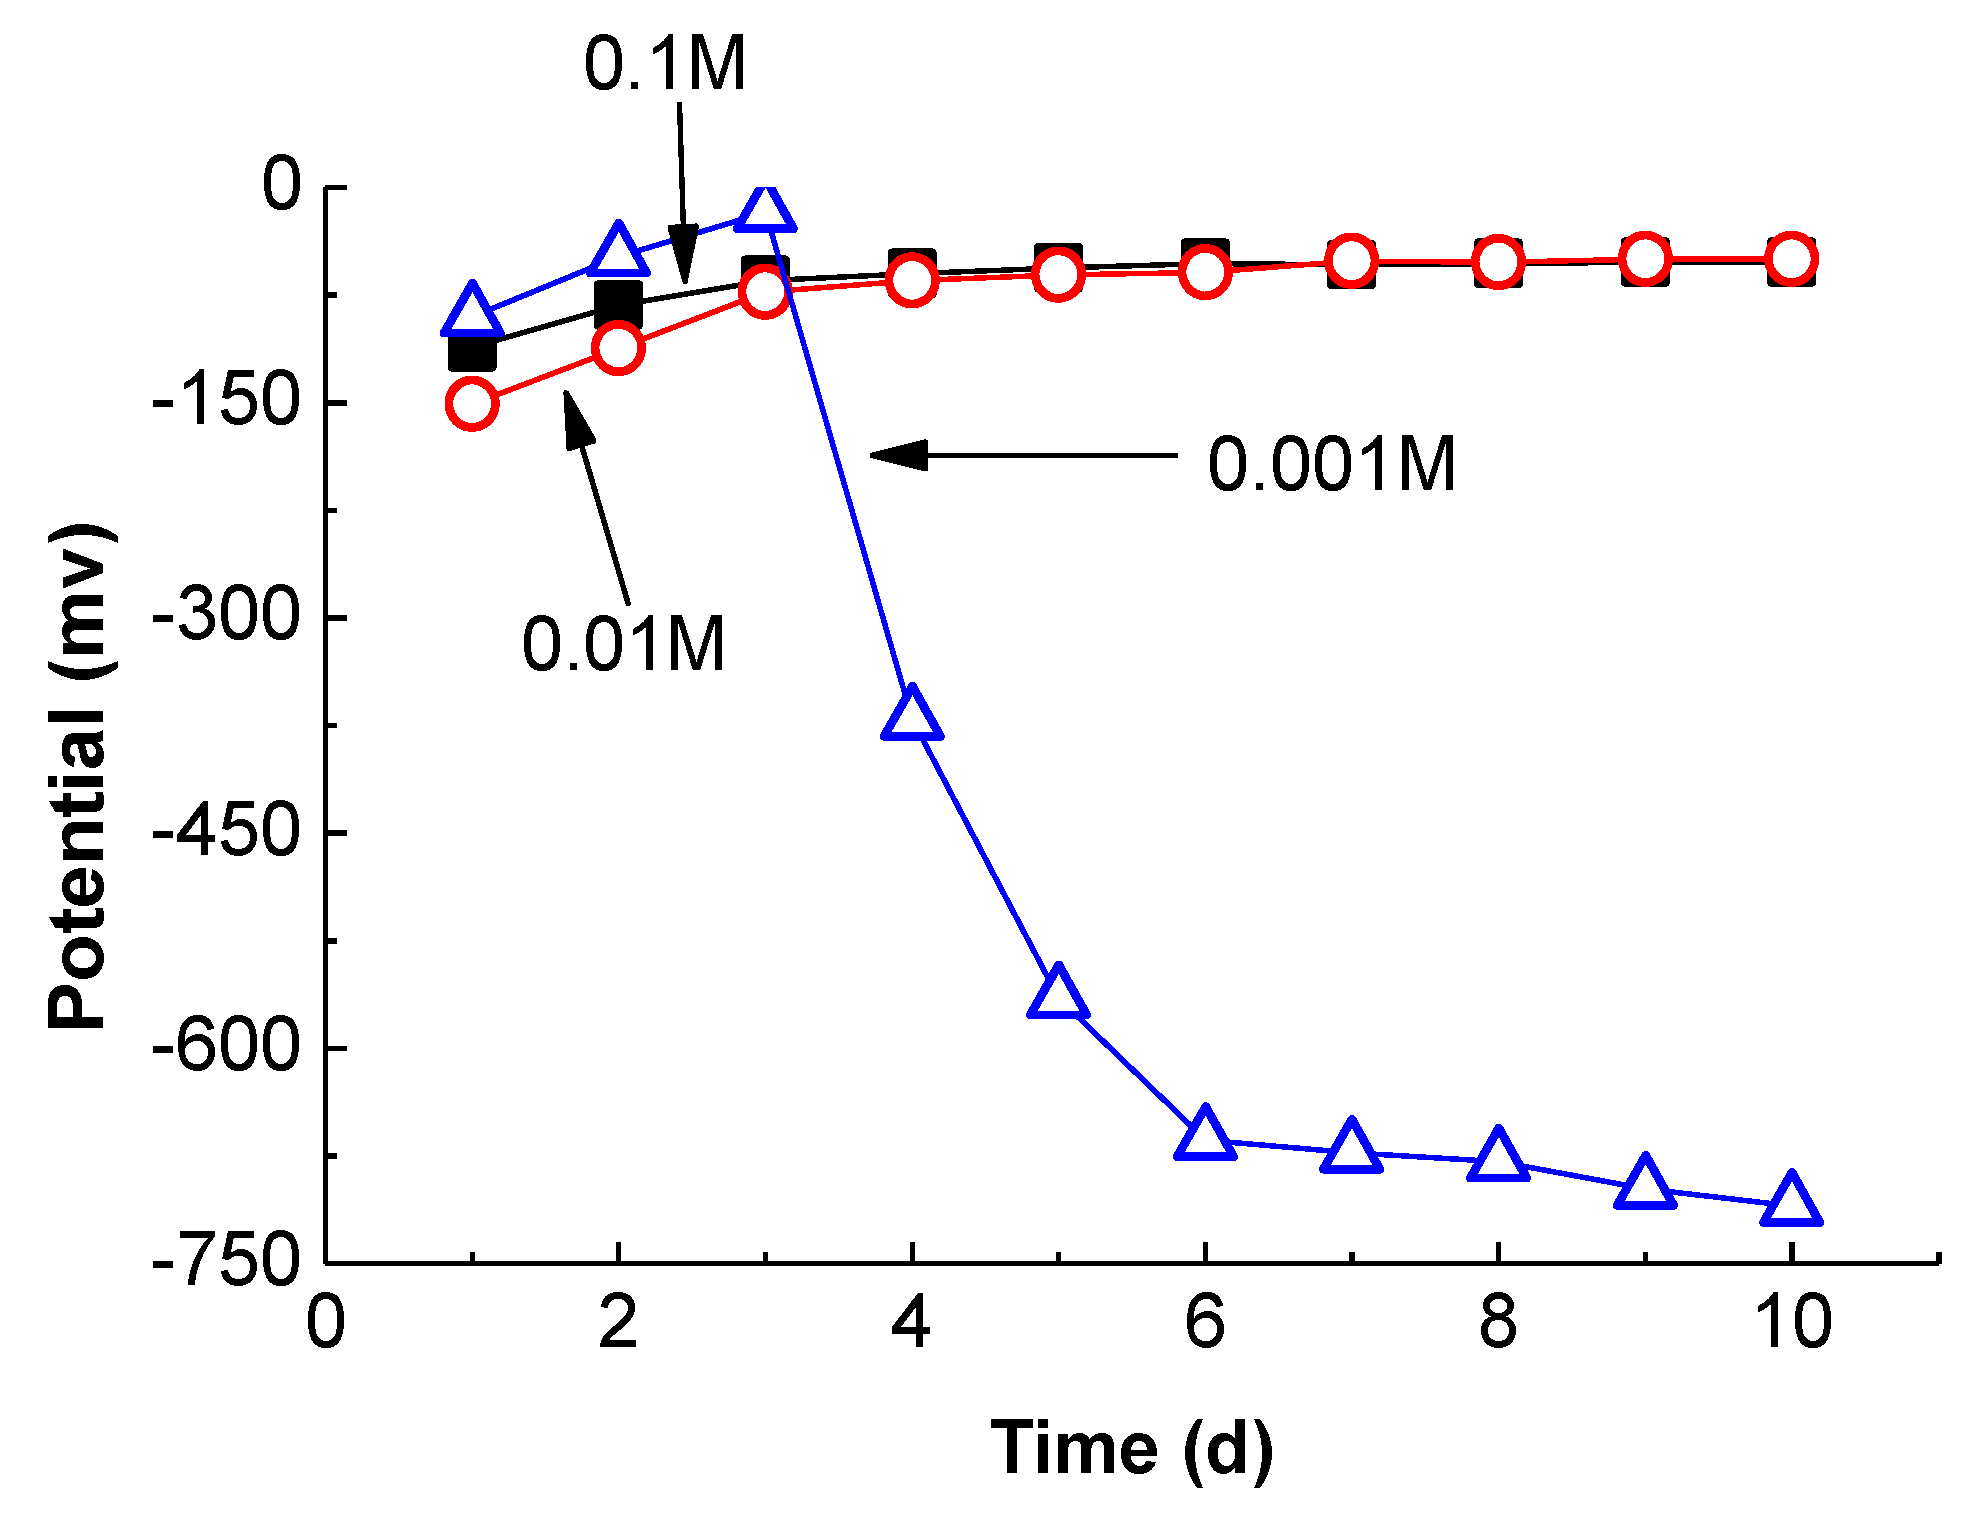
Figure 5.
Effect of SO42− concentrations on the OCP. (a) 0.1 M NaOH + M Na2SO4; (b) 0.01 M NaOH + M Na2SO4; (c) 0.001 M NaOH + M Na2SO4.
Figure 5.
Effect of SO42− concentrations on the OCP. (a) 0.1 M NaOH + M Na2SO4; (b) 0.01 M NaOH + M Na2SO4; (c) 0.001 M NaOH + M Na2SO4.
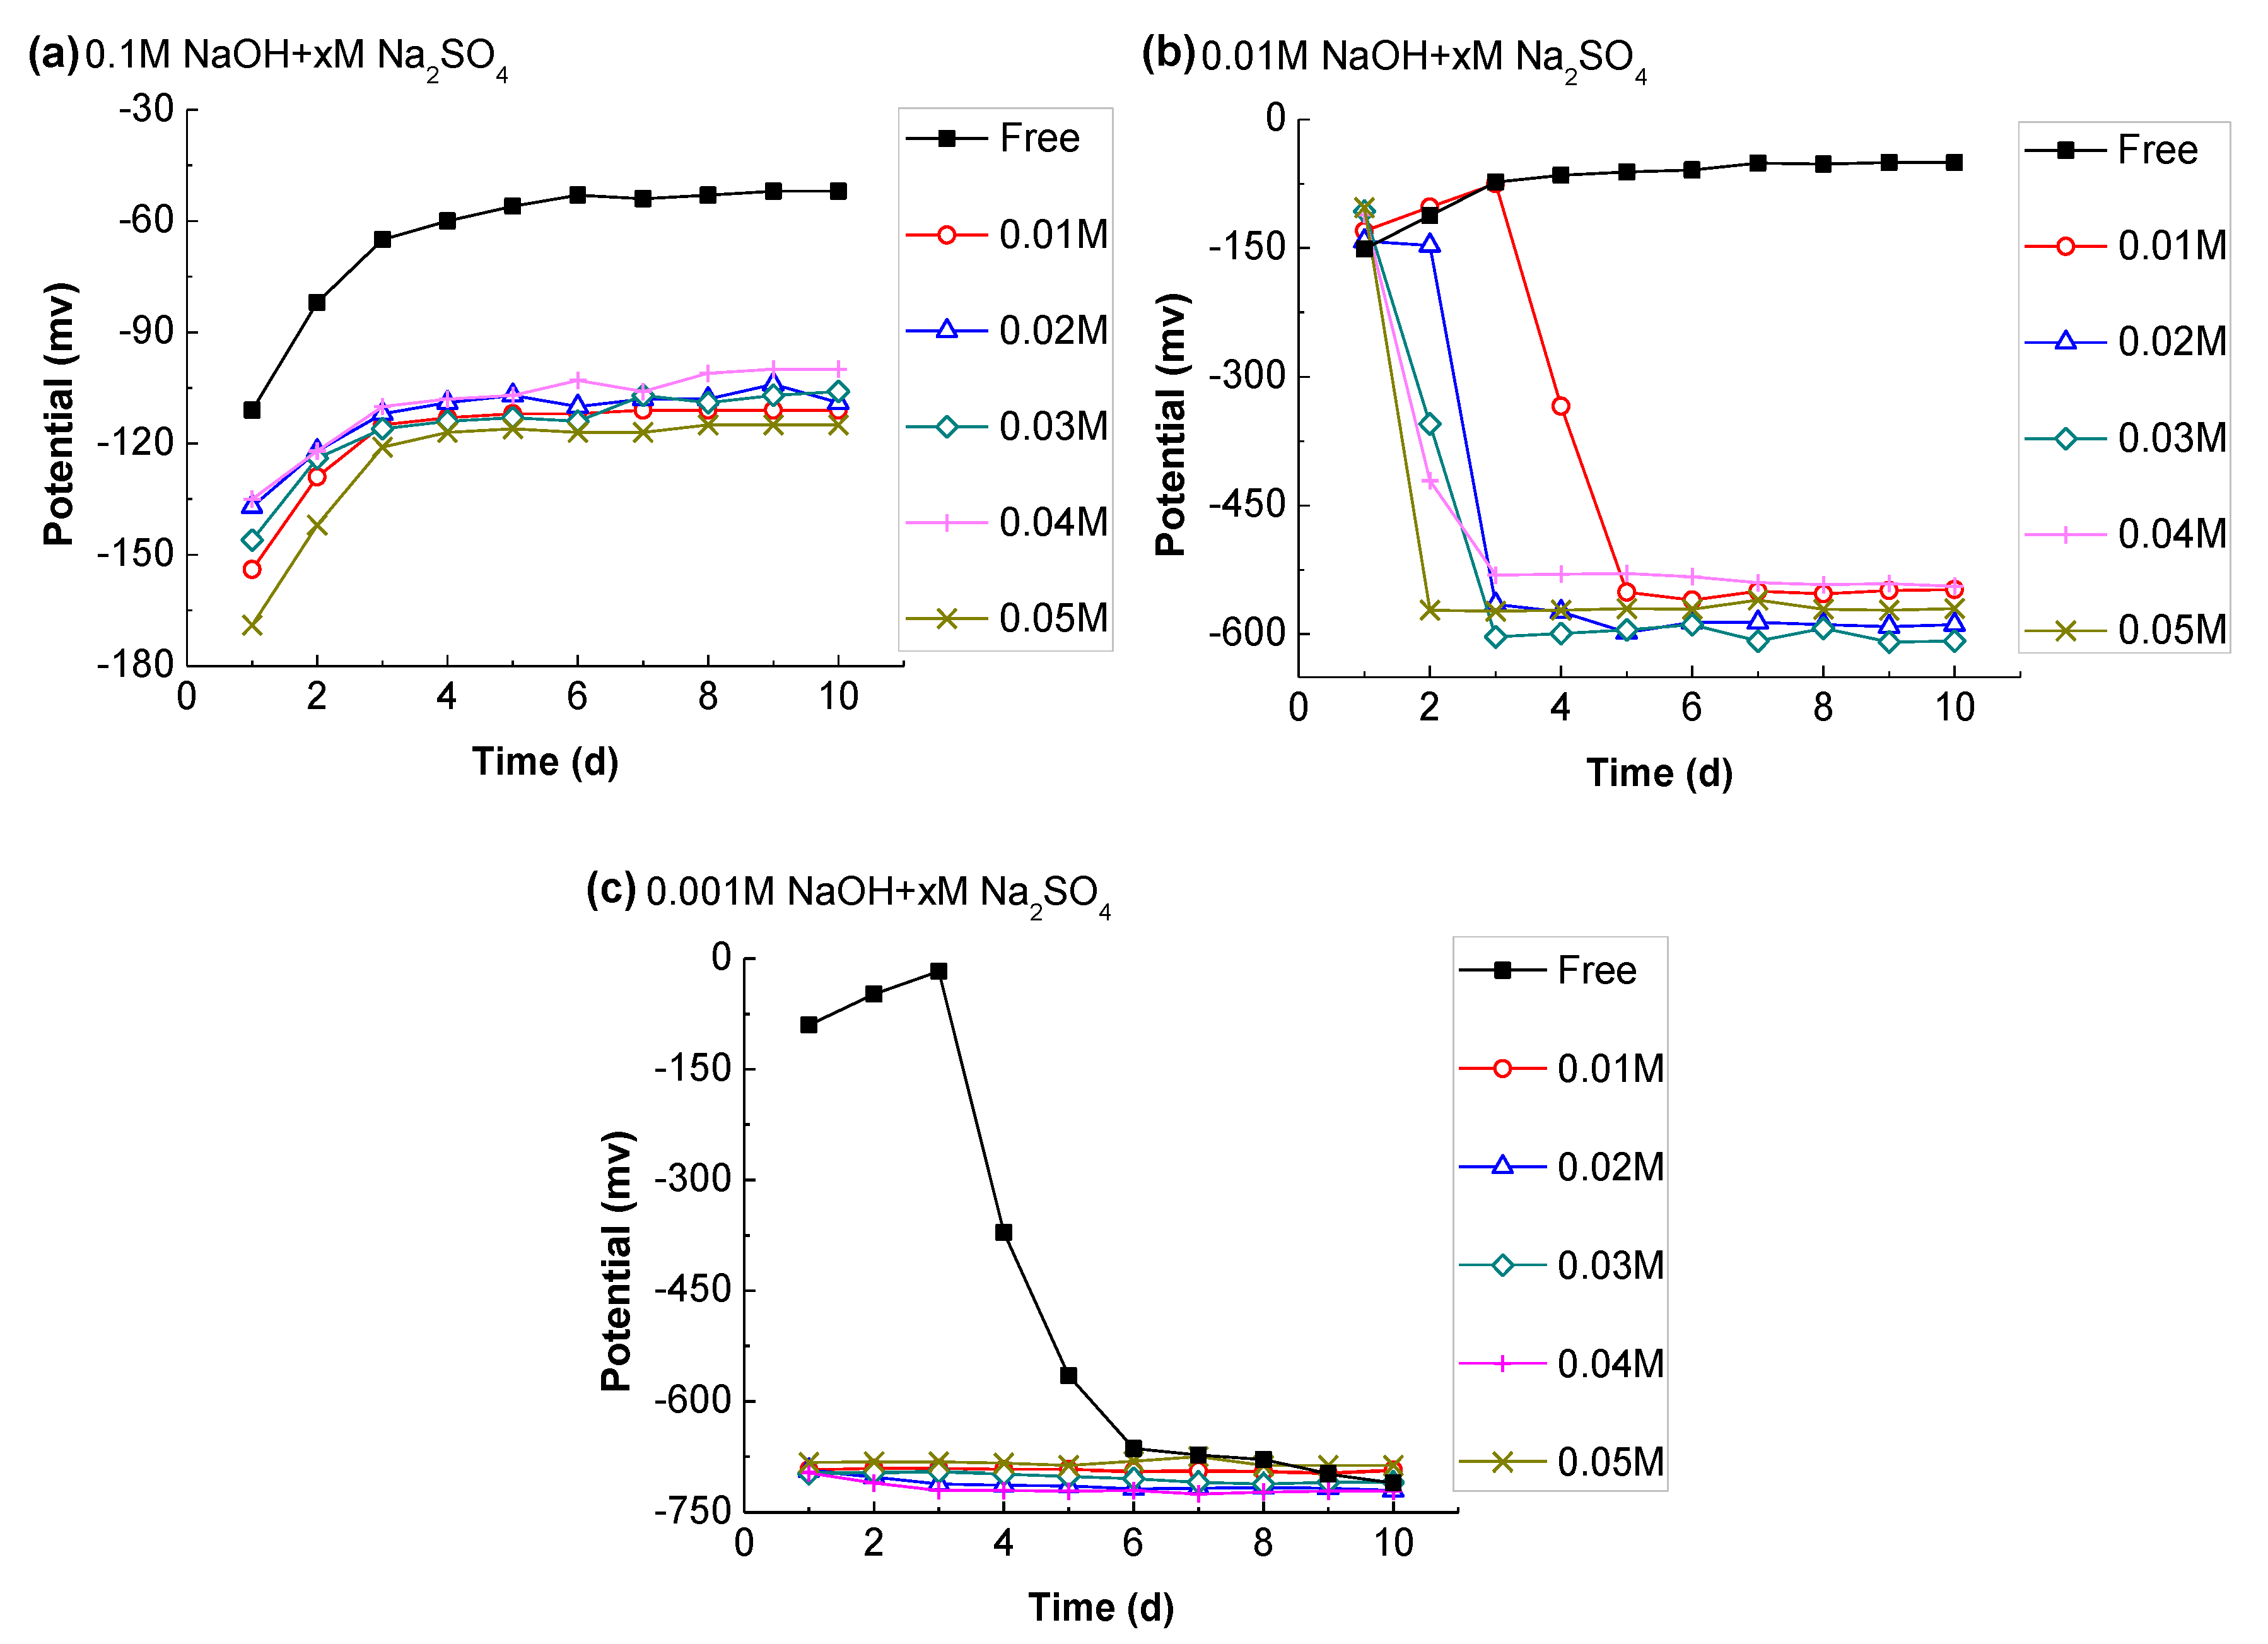
Figure 6.
Effect of Al(OH)− concentrations on the OCP. (a) 0.1 M NaOH + 0.05M Na2SO4 + M NaAlO2; (b) 0.01 M NaOH + 0.05M Na2SO4 + M NaAlO2; (c) 0.001 M NaOH + 0.05M Na2SO4 + M NaAlO2.
Figure 6.
Effect of Al(OH)− concentrations on the OCP. (a) 0.1 M NaOH + 0.05M Na2SO4 + M NaAlO2; (b) 0.01 M NaOH + 0.05M Na2SO4 + M NaAlO2; (c) 0.001 M NaOH + 0.05M Na2SO4 + M NaAlO2.

Table 1.
Chemical composition of cementitious materials (wt%).
| Material | SiO2 | Al2O3 | Fe2O3 | CaO | MgO | SO3 | K2O | Na2O | Loss |
|---|---|---|---|---|---|---|---|---|---|
| CSA | 9.90 | 20.50 | 2.62 | 43.77 | 3.00 | 13.36 | 0.54 | 0.19 | 5.98 |
| OPC | 22.30 | 4.62 | 2.44 | 58.42 | 1.92 | 2.20 | 0.35 | 0.28 | 3.62 |
Table 2.
Constitutions of simulated pore solutions.
| Variables | Composition | Concentration of Compounds (mol/L) | ||
|---|---|---|---|---|
| NaOH | Na2SO4 | NaAlO2 | ||
| Alkalinity | M NaOH | 0.1, 0.01, 0.001 | - | - |
| Sulfate | 0.1 M NaOH + M Na2SO4 | - | 0.01, 0.02, 0.03, 0.04, 0.05 | - |
| 0.01 M NaOH + M Na2SO4 | ||||
| 0.001 M NaOH + M Na2SO4 | ||||
| Aluminate | 0.1 M NaOH + 0.05 M Na2SO4 + M NaAlO2 | - | - | 0, 0.05, 0.1, 0.15, 0.2 |
| 0.01 M NaOH + 0.05 M Na2SO4 + M NaAlO2 | - | - | 0, 0.005, 0.01, 0.015, 0.02 | |
| 0.001 M NaOH + 0.05 M Na2SO4 + M NaAlO2 | - | - | 0, 0.0005, 0.001, 0.0015, 0.002 | |
Table 3.
Leaching solution chemistry of OPC and CSA.
| Sample | Method | ESL (mmol/L) | |||||
|---|---|---|---|---|---|---|---|
| Time (1) | Na+ | K+ | Ca2+ | Al(OH)4− (2) | SO42− | OH− | |
| CSA | 5 min | 55.7 | 106.4 | 29.9 | 18.0 | 38.8 | 0.5 |
| 3 h | 23.7 | 48.9 | 2.4 | 30.5 | 4.3 | 5.5 | |
| 6 h | 20.1 | 36.9 | 1.9 | 32.1 | 3.9 | 5.6 | |
| 1 d | 26.1 | 37.8 | 0.7 | 33.1 | 3.2 | 6.0 | |
| 3 d | 26.1 | 35.6 | bld (3) | 32.6 | 5.9 | 6.3 | |
| 7 d | 23.9 | 35.4 | 0.5 | 28.7 | 7.5 | 5.5 | |
| 28 d | 22.4 | 36.3 | 0.4 | 25.8 | 8.1 | 6.5 | |
| OPC | 5 min | 24.1 | 108.5 | 58.9 | - | 46.2 | 39.8 |
| 1 d | 18.3 | 35.1 | 6.4 | - | bld | 56.4 | |
| 3 d | 18.4 | 33.8 | 7.4 | - | 1.7 | 57.5 | |
| 7 d | 24.0 | 42.6 | 7.1 | - | bld | 61.3 | |
| 28 d | 28.9 | 48.5 | 6.2 | - | 0.4 | 71.9 | |
(1) min stands for minute; h stands for hour; d stands for day. (2) Al(OH)4− was detected through the element of aluminum by ICP-MS; Na+, K+, Ca2+, and SO42− were measured by IC; OH− was measured using a pH meter. (3) bld means below the limit of detection.
Table 4.
Free water content in bulk (wt%).
| Material | Time | |||||
|---|---|---|---|---|---|---|
| 3 h | 6 h | 1 d | 3 d | 7 d | 28 d | |
| CSA | 21.0 | 16.8 | 13.9 | 13.3 | 13.0 | 12.8 |
| OPC | - | - | 23.1 | 22.4 | 20.5 | 17.9 |
Table 5.
Pore solution chemistry of OPC and CSA.
| Sample | Method | Calculation (mmol/L) | |||||
|---|---|---|---|---|---|---|---|
| Time | Na+ | K+ | Ca2+ | Al(OH)4− | SO42− | OH− | |
| CSA | 5 min | 55.7 | 106.4 | 29.9 | 18.0 | 38.76 | 0.48 |
| 3 h | 89.80 | 185.80 | 9.19 | 115.70 | 16.36 | 25.74 | |
| 6 h | 100.60 | 184.80 | 7.56 | 160.70 | 19.49 | 34.70 | |
| 1 d | 163.50 | 236.30 | 4.19 | 207.10 | 20.13 | 46.60 | |
| 3 d | 171.70 | 233.50 | bld | 214.50 | 38.20 | 51.83 | |
| 7 d | 161.50 | 239.50 | 3.58 | 193.80 | 50.92 | 46.11 | |
| 28 d | 154.50 | 250.60 | 2.62 | 178.10 | 55.79 | 55.34 | |
| OPC | 5 min | 24.09 | 108.49 | 58.93 | - | 46.16 | 39.81 |
| 1 d | 61.00 | 117.30 | 1.90 | - | bld | 202.40 | |
| 3 d | 77.00 | 117.50 | 1.90 | - | 5.80 | 215.40 | |
| 7 d | 93.12 | 165.70 | 1.30 | - | bld | 279.50 | |
| 28 d | 135.80 | 221.00 | 0.8 | - | 1.80 | 451.30 | |
Table 6.
Species distribution of aluminum in CSA pore solution simulated by PHREEQC.
| Age | Species Distribution (mmol/L) | ||||
|---|---|---|---|---|---|
| Al | Al(OH)4− | Al(OH)3 | Al(OH)2+ | Al3+ | |
| 1 d | 207.1 | 207.1 | 2.3 × 10⁻⁵ | 8.0 × 10⁻¹¹ | 8.3 × 10⁻²⁵ |
| 3 d | 214.5 | 214.5 | 2.1 × 10⁻⁵ | 6.5 × 10⁻¹⁸ | 5.2 × 10⁻²⁵ |
| 7 d | 193.7 | 193.7 | 2.1 × 10⁻⁵ | 7.5 × 10⁻¹⁸ | 7.6 × 10⁻²⁵ |
| 28 d | 178.1 | 178.1 | 1.6 × 10⁻⁵ | 4.8 × 10⁻¹⁸ | 3.4 × 10⁻²⁵ |
Table 7.
Summary of chemical analysis of pore solutions (OPC).
| Cement Composition | Concentration (mmol/L) (1) | ||||
|---|---|---|---|---|---|
| Na+ | K+ | Ca2+ | SO42− | OH− | |
| This study 28 days, w/b 0.5 Na2O% = 0.28% K2O% = 0.35% | 135.8 | 221.0 | 0.8 | 1.8 | 451.3 |
| Diamond [34] 28 days, w/b 0.5 Na2O% = 0.32% K2O% = 0.60% | - | 320.0 | - | - | 510.0 |
| Scott [2] 28 days, w/b 0.58 Na2O% = 0.19% K2O% = 0.54% | 89.4 | 216.6 | 1.0 | - | 320.0 |
(1) It is assumed that the concentration of an element is equal to the concentration of the corresponding ion, so all the data can be recorded in ionic form.
Table 8.
Summary of chemical analysis of pore solutions (CSA).
| Cement Composition | Concentration (mmol/L) | |||||
|---|---|---|---|---|---|---|
| Na+ | K+ | Ca2+ | Al(OH)4− | SO42− | OH− | |
| This study 28 day, w/b 0.5 Na2O% = 0.19% K2O% = 0.54% Al2O3% = 20.5% SO3% = 13.4% | 154.5 | 250.6 | 2.6 | 178.1 | 55.8 | 55.3 |
| Winnefeld [17] 28 day, w/b 0.72 Na2O% = 0.05% K2O% = 0.21% Al2O3% = 35.5% SO3% = 16.8% | 21.0 | 120.0 | 0.31 | 100 | 3.4 | 50.0 |
| 28 day, w/b 0.8 Na2O% = 0.13% K2O% = 0.40% Al2O3% = 26.8% SO3% = 19.5% | 34 | 82 | 0.23 | 26 | 9 | 70.0 |
| Andac [23] 30 day, w/b 0.8 Na2O% = 0.095% K2O% = 0.295% Al2O3% = 37.4% SO3% = 9.5% | 14.5 | 52 | 0.41 | 14.7 | 0.71 | 66.1 |
© 2019 by the authors. Licensee MDPI, Basel, Switzerland. This article is an open access article distributed under the terms and conditions of the Creative Commons Attribution (CC BY) license (http://creativecommons.org/licenses/by/4.0/).
Share and Cite
MDPI and ACS Style
Wang, L.; Zhan, S.; Tang, X.; Xu, Q.; Qian, K. Pore Solution Chemistry of Calcium Sulfoaluminate Cement and Its Effects on Steel Passivation. Appl. Sci. 2019, 9, 1092. https://doi.org/10.3390/app9061092
AMA Style
Wang L, Zhan S, Tang X, Xu Q, Qian K. Pore Solution Chemistry of Calcium Sulfoaluminate Cement and Its Effects on Steel Passivation. Applied Sciences. 2019; 9(6):1092. https://doi.org/10.3390/app9061092
Chicago/Turabian StyleWang, Lingbo, Shulin Zhan, Xudong Tang, Qiang Xu, and Kuangliang Qian. 2019. "Pore Solution Chemistry of Calcium Sulfoaluminate Cement and Its Effects on Steel Passivation" Applied Sciences 9, no. 6: 1092. https://doi.org/10.3390/app9061092
Note that from the first issue of 2016, this journal uses article numbers instead of page numbers. See further details here.