Article

In-Line Dimensional Inspection of Warm-Die Forged Revolution Workpieces Using 3D Mesh Reconstruction

1
Laboratory of CAD CAM CAE, Universidad EAFIT, Cra 49 no 7-sur-50, Medellín 050022, Colombia
2
Vicomtech, Paseo Mikeletegi 57, Parque Científico y Tecnológico de Gipuzkoa, 20009 Donostia/San Sebastián, Spain
3
Computational Intelligence Group, CCIA Department, UPV/EHU, Paseo Manuel Lardizabal 1, 20018 Donostia/San Sebastián, Spain
4
CIS & Electronics Department, University of Mondragon, Loramendi Kalea 5, 20500 Mondragon, Spain
5
GKN Driveline Legazpi S.A., Calle Urola 10, 20230 Legazpi, Spain
*
Author to whom correspondence should be addressed.
Appl. Sci. 2019, 9(6), 1069; https://doi.org/10.3390/app9061069
Submission received: 12 February 2019 / Revised: 7 March 2019 / Accepted: 12 March 2019 / Published: 14 March 2019

Abstract

:
Industrial dimensional assessment presents instances in which early control is exerted among “warm” (approx. 600 C) pieces. Early control saves resources, as defective processes are timely stopped and corrected. Existing literature is devoid of dimensional assessment on warm workpieces. In response to this absence, this manuscript presents the implementation and results of an optical system which performs in-line dimensional inspection of revolution warm workpieces singled out from the (forming) process. Our system can automatically measure, in less than 60 s, the circular runout of warm revolution workpieces. Such a delay would be 20 times longer if cool-downs were required. Off-line comparison of the runout of T-temperature workpieces (27 C ≤ T ≤ 560 C) shows a maximum difference of 0.1 mm with respect to standard CMM (Coordinate Measurement Machine) runout of cold workpieces (27 C), for workpieces as long as 160 mm. Such a difference is acceptable for the forging process in which the system is deployed. The test results show no correlation between the temperature and the runout of the workpiece at such level of uncertainty. A prior-to-operation Analysis of Variance (ANOVA) test validates the repeatability and reproducibility (R&R) of our measurement system. In-line assessment of warm workpieces fills a gap in manufacturing processes where early detection of dimensional misfits compensates for the precision loss of the vision system. The integrated in-line system reduces the number of defective workpieces by 95 % .

1. Introduction

In the context of warm forming of motorcar parts, current production lines of stub axles process around 1200 pieces per hour. The tools used to form these parts are constantly subjected to high structural and thermal stresses [1,2,3], requiring continuous monitoring and dimensional assessment of the produced parts for process and quality control.
In the case of forged revolution workpieces, the produced parts are not final product, requiring subsequent machining operations. The assessment of the punch orientation with respect to the forming matrix orientation in the forging process is crucial since a severe misalignment between the punch press and the forming matrix axes disables the posterior machining process, resulting in a scrapped part. The circular runout [4] of the forged revolution workpiece indicates the deviation between the punch orientation and the forming matrix axis.
Standard tools for dimensional assessment of these workpieces rely on contact between the probe and the measured workpiece. Such is the case of Coordinate Measurement Machines (CMMs), which provide highly accurate measurements [5]. However, dimensional assessment with standard CMMs (and contact methods in general) is not convenient due to (1) the high temperatures directly affect (or even damage) the probe and, (2) long measurement times for the cooled-down workpieces. Consequently, a delay of nearly 20 min between the production of a single part and its dimensional assessment (including its cooling down, transportation to the metrology office and measuring times) arises. Such time delay translates into an uncertainty in the quality control process of approximately 400 potential defective workpieces (worst case scenario) for each measurement.
This manuscript presents an optical (i.e., contact-avoiding) system for in-line dimensional assessment of warm forming of revolution workpieces. Our system can continuously measure the circular runout of the parts at around 600 C in less than 60 s per part. Results from experiments conducted in this manuscript show no temperature vs. runout correlation for the system uncertainty level (0.1 mm). The system is integrated and deployed in a warm-die forge industry, in the supply chain of world-class auto makers. Such a system allows continuous monitoring for quality and process control of the production line, providing an early detection mechanism of manufacturing failures which reduces the number of potential defective parts from 400 to 20 ( 95 % ) between consecutive measurements. This dimensional assessment for warm workpieces fills a gap in warm-die manufacturing processes in which the advantage of early detection of process bias compensates for the disadvantage of precision loss regarding higher-precision mechanisms (such as contact-based CMM).
The deployed system improves on the classic approaches for dimensional assessment in warm-die industry. Using technologies from Visual Computing and Industry 4.0 [6], the system allows in-line visual assessment of warm workpieces, either by metrologists, engineers, or operators. Furthermore, the increased cadence of the measurements (from 1 measurement every 20 min to 1 measurement per minute) improves the efficiency in product quality and process control, and leaves open future lines of dimensional assessment focused on data analytics.
The remainder of this manuscript is organized as follows: Section 2 reviews the relevant literature. Section 3 describes the developed system. Section 4 presents and discusses the results. Section 5 concludes the manuscript and introduces what remains for future work.

2. Literature Review

In the automotive and aeronautic industry, dimensional inspection of manufactured parts requires high precision methods to assess the quality of the final product. Currently, CMMs are one of the most common tools used to inspect forged workpieces due to their high precision [5]. However, CMMs are not suitable for in-line dimensional inspection of warm-die manufacturing parts due to: (1) their contact-based nature requires the workpieces to be in a cooled state to avoid damaging the measuring probe and, (2) taking measurements with the probe is highly time-consuming (even with cold workpieces). Visual computing provides contact-avoiding technologies and methodologies for Reverse Engineering and dimensional inspection which improve the productivity and efficiency of such CAD CAM CAE processes [6]. While sacrificing accuracy to some extent, optical scanners have become an alternative for dimensional inspection of different kinds of warm-die manufacturing processes [5,7]. Table 1 presents a comparative of standard CMMs vs. optical scanner dimensional assessment.

2.1. Off-Line Dimensional Inspection in Warm-Die Manufacturing

In warm-die manufacturing, constant monitoring of forming tools is crucial for the quality control of produced parts. Forming tools such as punches, are subjected to high structural and thermal stresses that limit their lifetime [1]. Refs. [13,14] analyze the progressing wear of forging tools and forging defects by monitoring volume changes in the manufactured workpieces using 3D mesh reconstruction. In addition, the use of optical scanners allows the integration of numerical methods (such as Finite Element Analysis) in the dimensional inspection pipeline to quantify the thermal and structural damage of the forging tool [1,3]. Other dimensional inspection methods in warm forming include computed tomography [7,15], thermographic assessment [16], ultrasonic assessment [17], liquid penetrant testing [18], among others.

2.2. In-Line Dimensional Inspection

All the previously presented methods only execute off-line measurements on cooled-down workpieces. Measurements directly performed on warm and hot workpieces have been rarely reported [1]. Their main shortcoming is that high temperatures affect the measurements of contact-based methods while the strong radiation affects the optical equipment, thus reducing the quality of the captured images [19]. The spectrum selective method presented in [20] filters specific wavelengths from the captured images to allow the reconstruction of the hot parts. Ref. [21] integrates a specific wavelength and power laser beam with surface fitting to measure the length and diameter of hot cylindrical workpieces. Refs. [22,23] presents an in-line measurement system which uses two-dimensional laser range sensors (TLRS) coupled with servo motors for 3D reconstruction of hot cylindric workpieces. As an alternative to optical scanners, ref. [24] presents a vision system with two cameras that capture and process the hot workpiece without requiring any laser beams. These in-line approaches for hot dimensional assessment have been developed for workpieces with non-complex geometries (such as cylindrical workpieces).
It is worth mentioning in-line dimensional inspection approaches for cooled-down workpieces. Point cloud filtering [11] and accelerated mesh registration algorithms [12] have been developed to allow real-time inspection using 3D optical scanners and mesh reconstruction. Applications of these algorithms for in-line dimensional inspection of cooled-down workpieces include flatness inspection of rolled parts [25], inspection of large parts [26], and inspection of generic parts using geometric features [9,27].

2.3. Conclusions of the Literature Review
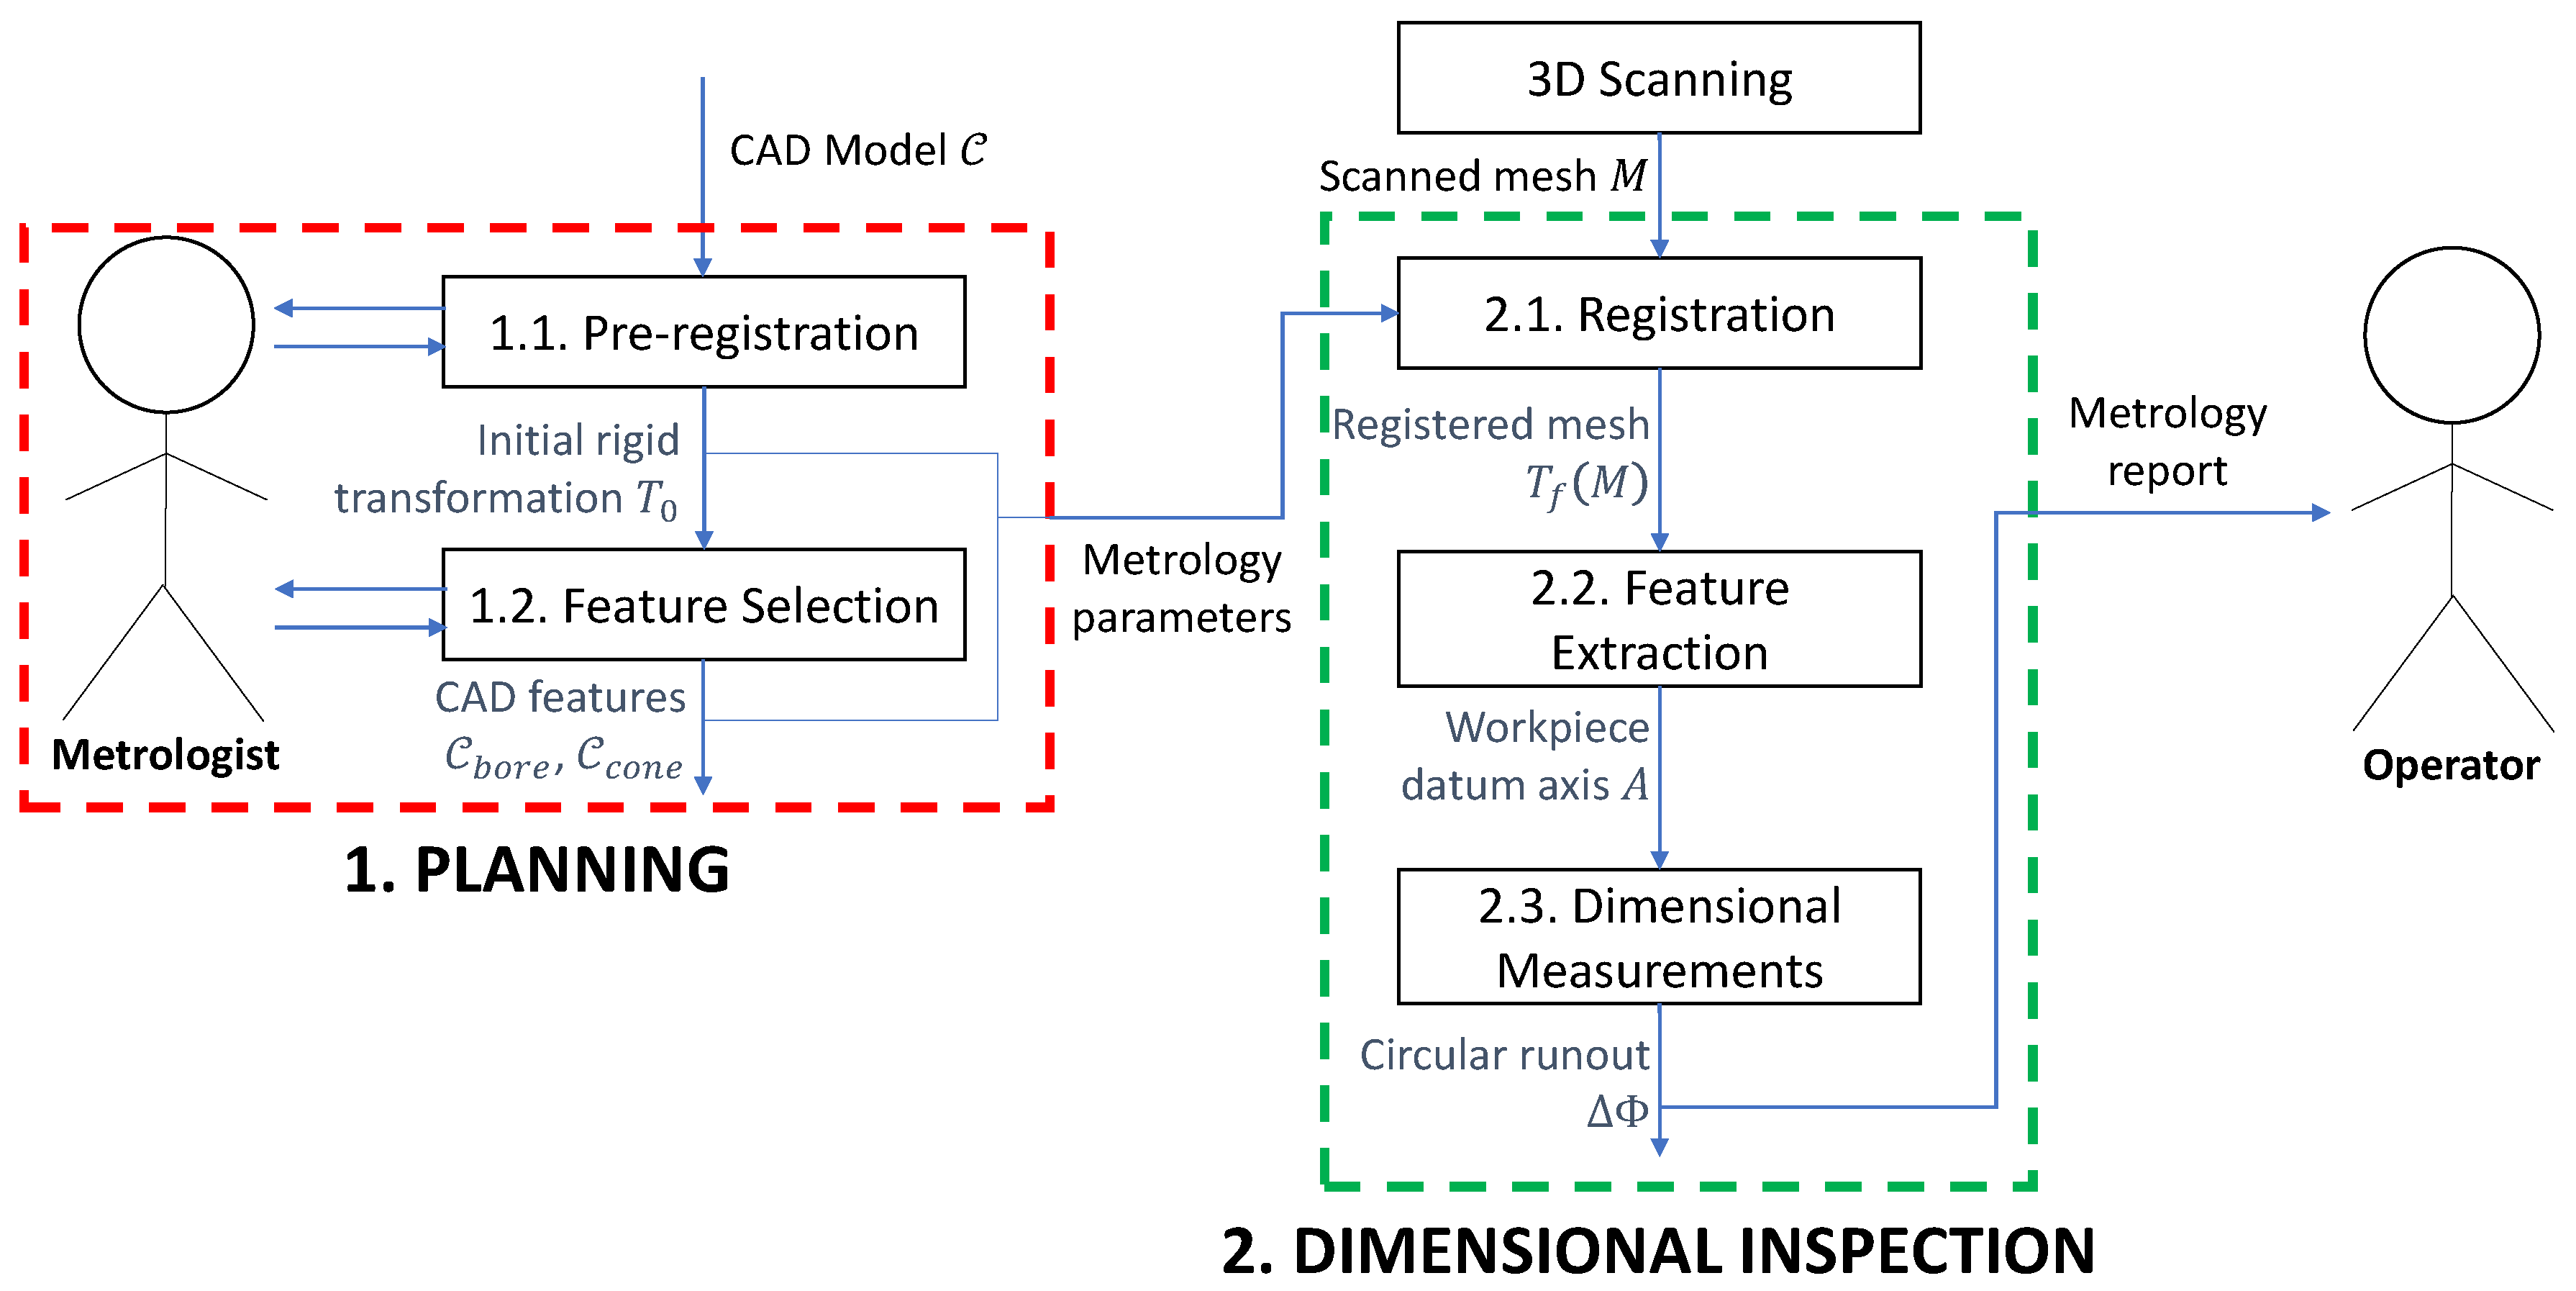
CMMs have been used in the warm forming industry due to their high measurement precision [5]. However, they are not suitable for in-line processes due to (1) the high temperatures of the workpiece affecting or even damaging the measuring probe and, (2) the long measurement times of the probe even for cooled-down workpieces. Other alternatives for dimensional inspection include optical scanner technologies, which do not rely on contact with the workpiece. However, the radiation due to the high temperatures can affect the data acquired by the scanners [19]. Current literature for in-line dimensional inspection of warm workpieces is very limited [1] and accounts only for very simple geometries (such as cylindrical workpieces) [20,21,23,24].
Responding to the current state of the art, we present an optical system for in-line dimensional assessment of forged still-warm workpieces. Whereas previous cold-state methods would require approximately 20 min for the assessment of a single workpiece, our system spends less than 60 s per part. In-line assessment of these warm (approx. 600 C) workpieces fills a gap in manufacturing processes in which early detection of an inherent planning, design, or manufacturing error is more important than the higher precision obtained with standard cold-state measurement methods. The system is implemented and deployed in a global automotive part maker plant, where the number of defective workpieces is reduced by a 95% with respect to previous dimensional assessment methods (i.e., cold-state CMM).
The implemented system executes 3D scanning, mesh registration and comparison (against a CAD database) of the geometry of a forged still-warm workpiece. The system is capable of in-line measurements of circular runout of revolution warm workpieces, singled out from the forming process. Contrast test against cold-state CMM measurements show that the warm-workpiece measurement is good enough for the manufacturing plant in which the system is deployed (error below 0.1 mm for parts as long as 160 mm). The temperature-vs.-runout analysis shows no correlation between these two variables at such level of uncertainty. A prior-to-operation ANOVA test with cold workpieces validates the repeatability and reproducibility (R&R) of our measurement system.

3. Methodology

Given an input reference CAD model C and the triangular mesh M = ( X , T ) of a scanned workpiece, the objective of the optical system is to compute key dimensional measurements on M with respect to C . In the case of revolution workpieces, the circular runout dimension Δ Φ measures how much a circular feature oscillates when the workpiece is rotated around the revolution (datum) axis A = ( v , a 0 ) [8]. Such a dimension is crucial to assess the quality of the process and the produced parts in the production line.
The optical system for dimensional inspection has been designed as a process of two phases (Figure 1). In the first phase, the metrologist defines the parameters of the reference CAD model C required for the dimensional inspection of all workpieces of such reference. In the second phase, the system in-line and automatically estimates the revolution axis A and the circular runout Δ Φ of each workpiece M. The operator in the production line is immediately provided with the results, with no intervention of the metrologist. The following sections describe the process in detail.

3.1. Planning for the Dimensional Inspection

The first phase of the optical system consists in the definition of the dimensional inspection parameters for a given reference CAD model C . The metrologist defines the features of interest in C , which are worth of early assessment in warm workpieces. This phase takes about 5 min, but is performed only once per CAD reference.

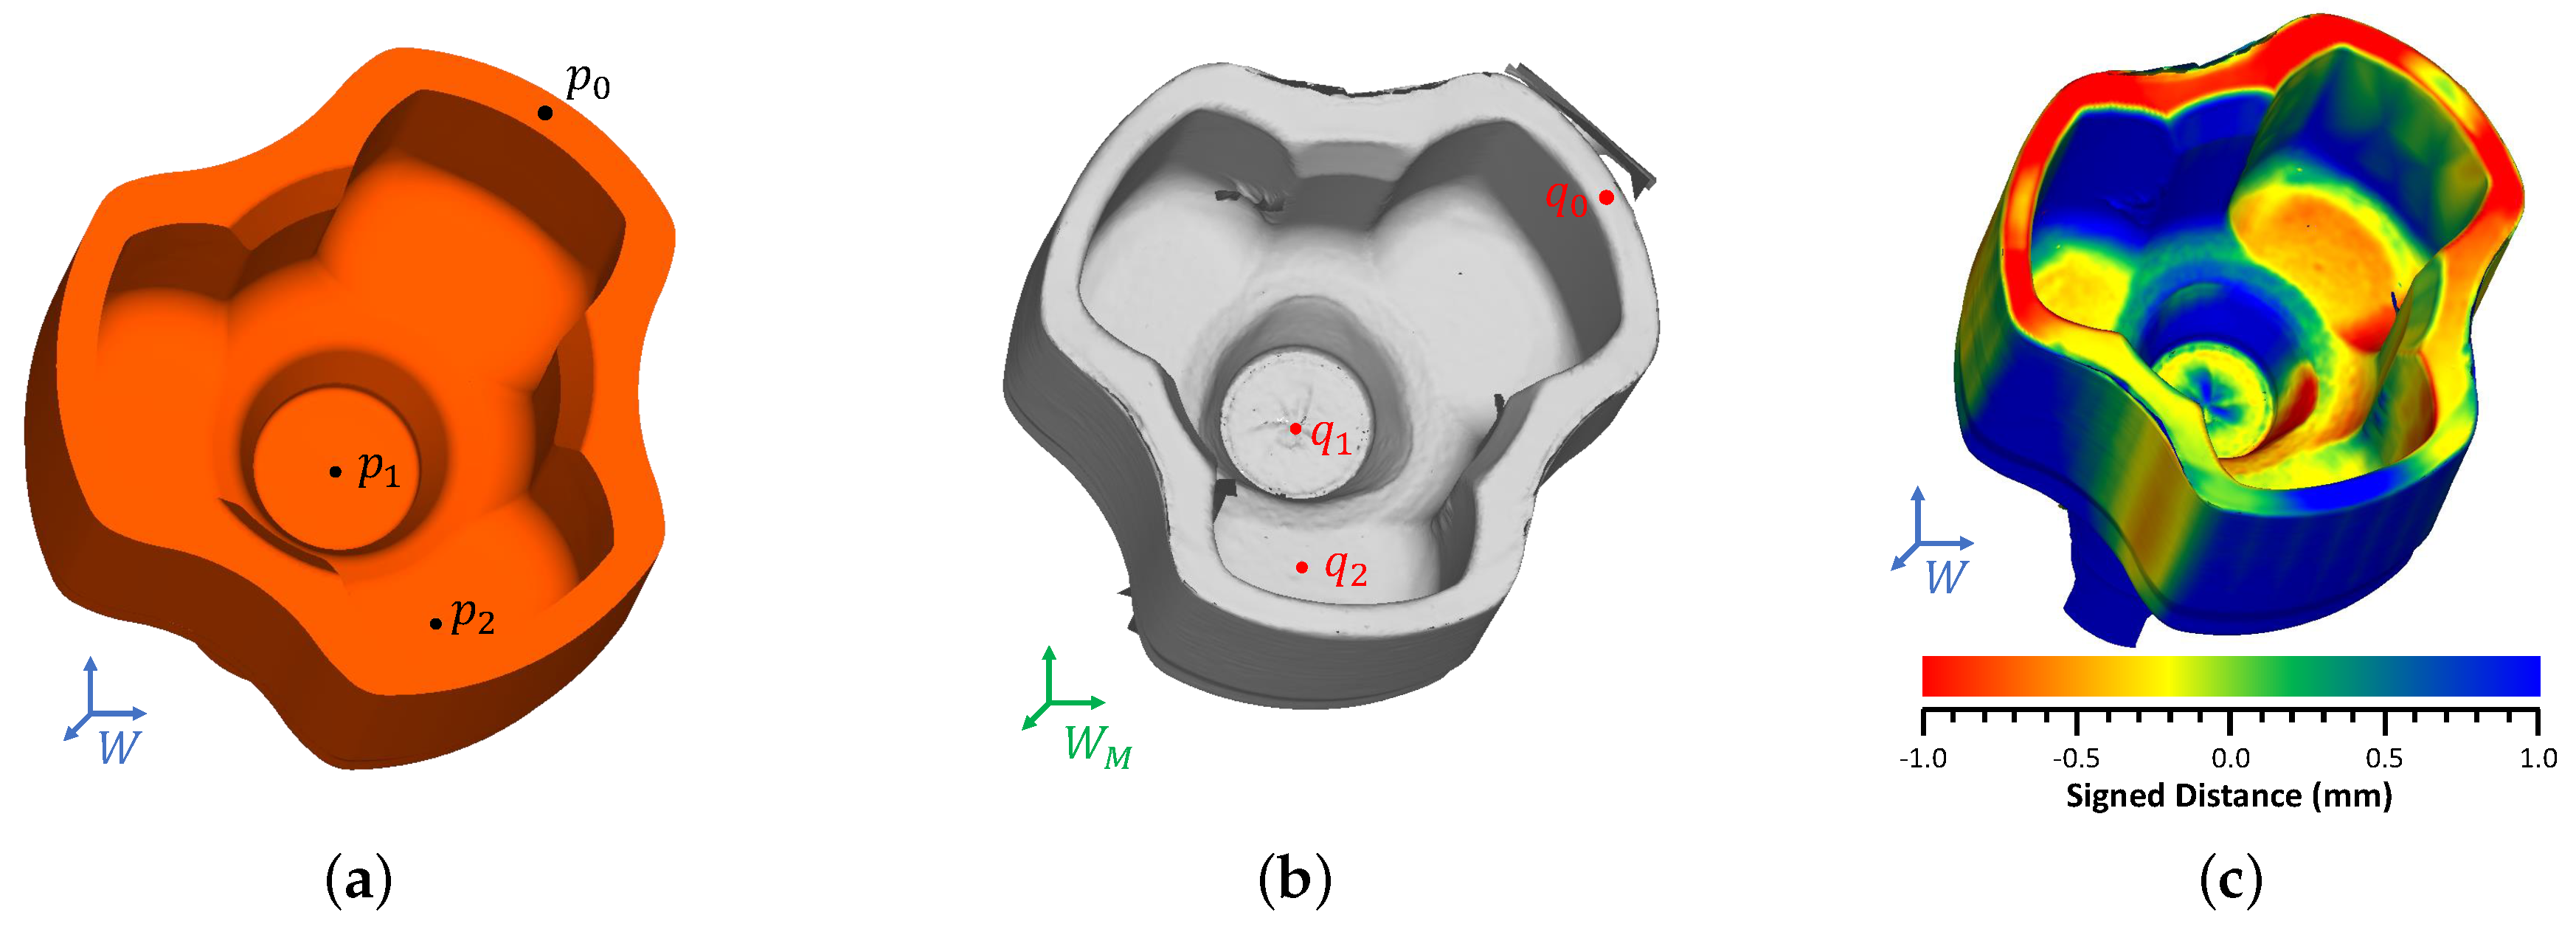
3.1.1. Mesh Pre-Registration

To compare the scanned mesh M with the reference CAD model C , it is crucial that both of these surface representations share the same coordinate system W = { w x , w y , w z ; p w } . If W and W M are the coordinate systems of C and M, respectively, the objective is to compute a rigid transformation T 0 S E ( 3 ) such that T 0 ( W M ) W .
To compute T 0 , the developed system uses an alignment-of-correspondences algorithm [28]. Let { p 0 , p 1 , p 2 } C and { q 0 , q 1 , q 2 } M be three non-collinear points sampled from the reference CAD and the workpiece mesh, respectively. The alignment-of-correspondences algorithm computes the rigid transformation T 0 that minimizes the distance between the two sets of points:
T 0 = arg min i = 0 2 p i T 0 ( q i ) s . t . T 0 S E ( 3 )
where S E ( 3 ) = S O ( 3 ) × R 3 is the special Euclidean group (group of all rigid transformations in R 3 ).
In Equation (1), p i , q i are corresponding points in the CAD and the mesh, respectively. These points are interactively selected by the metrologist as illustrated in Figure 2. This pre-registration is performed only once per CAD reference C .

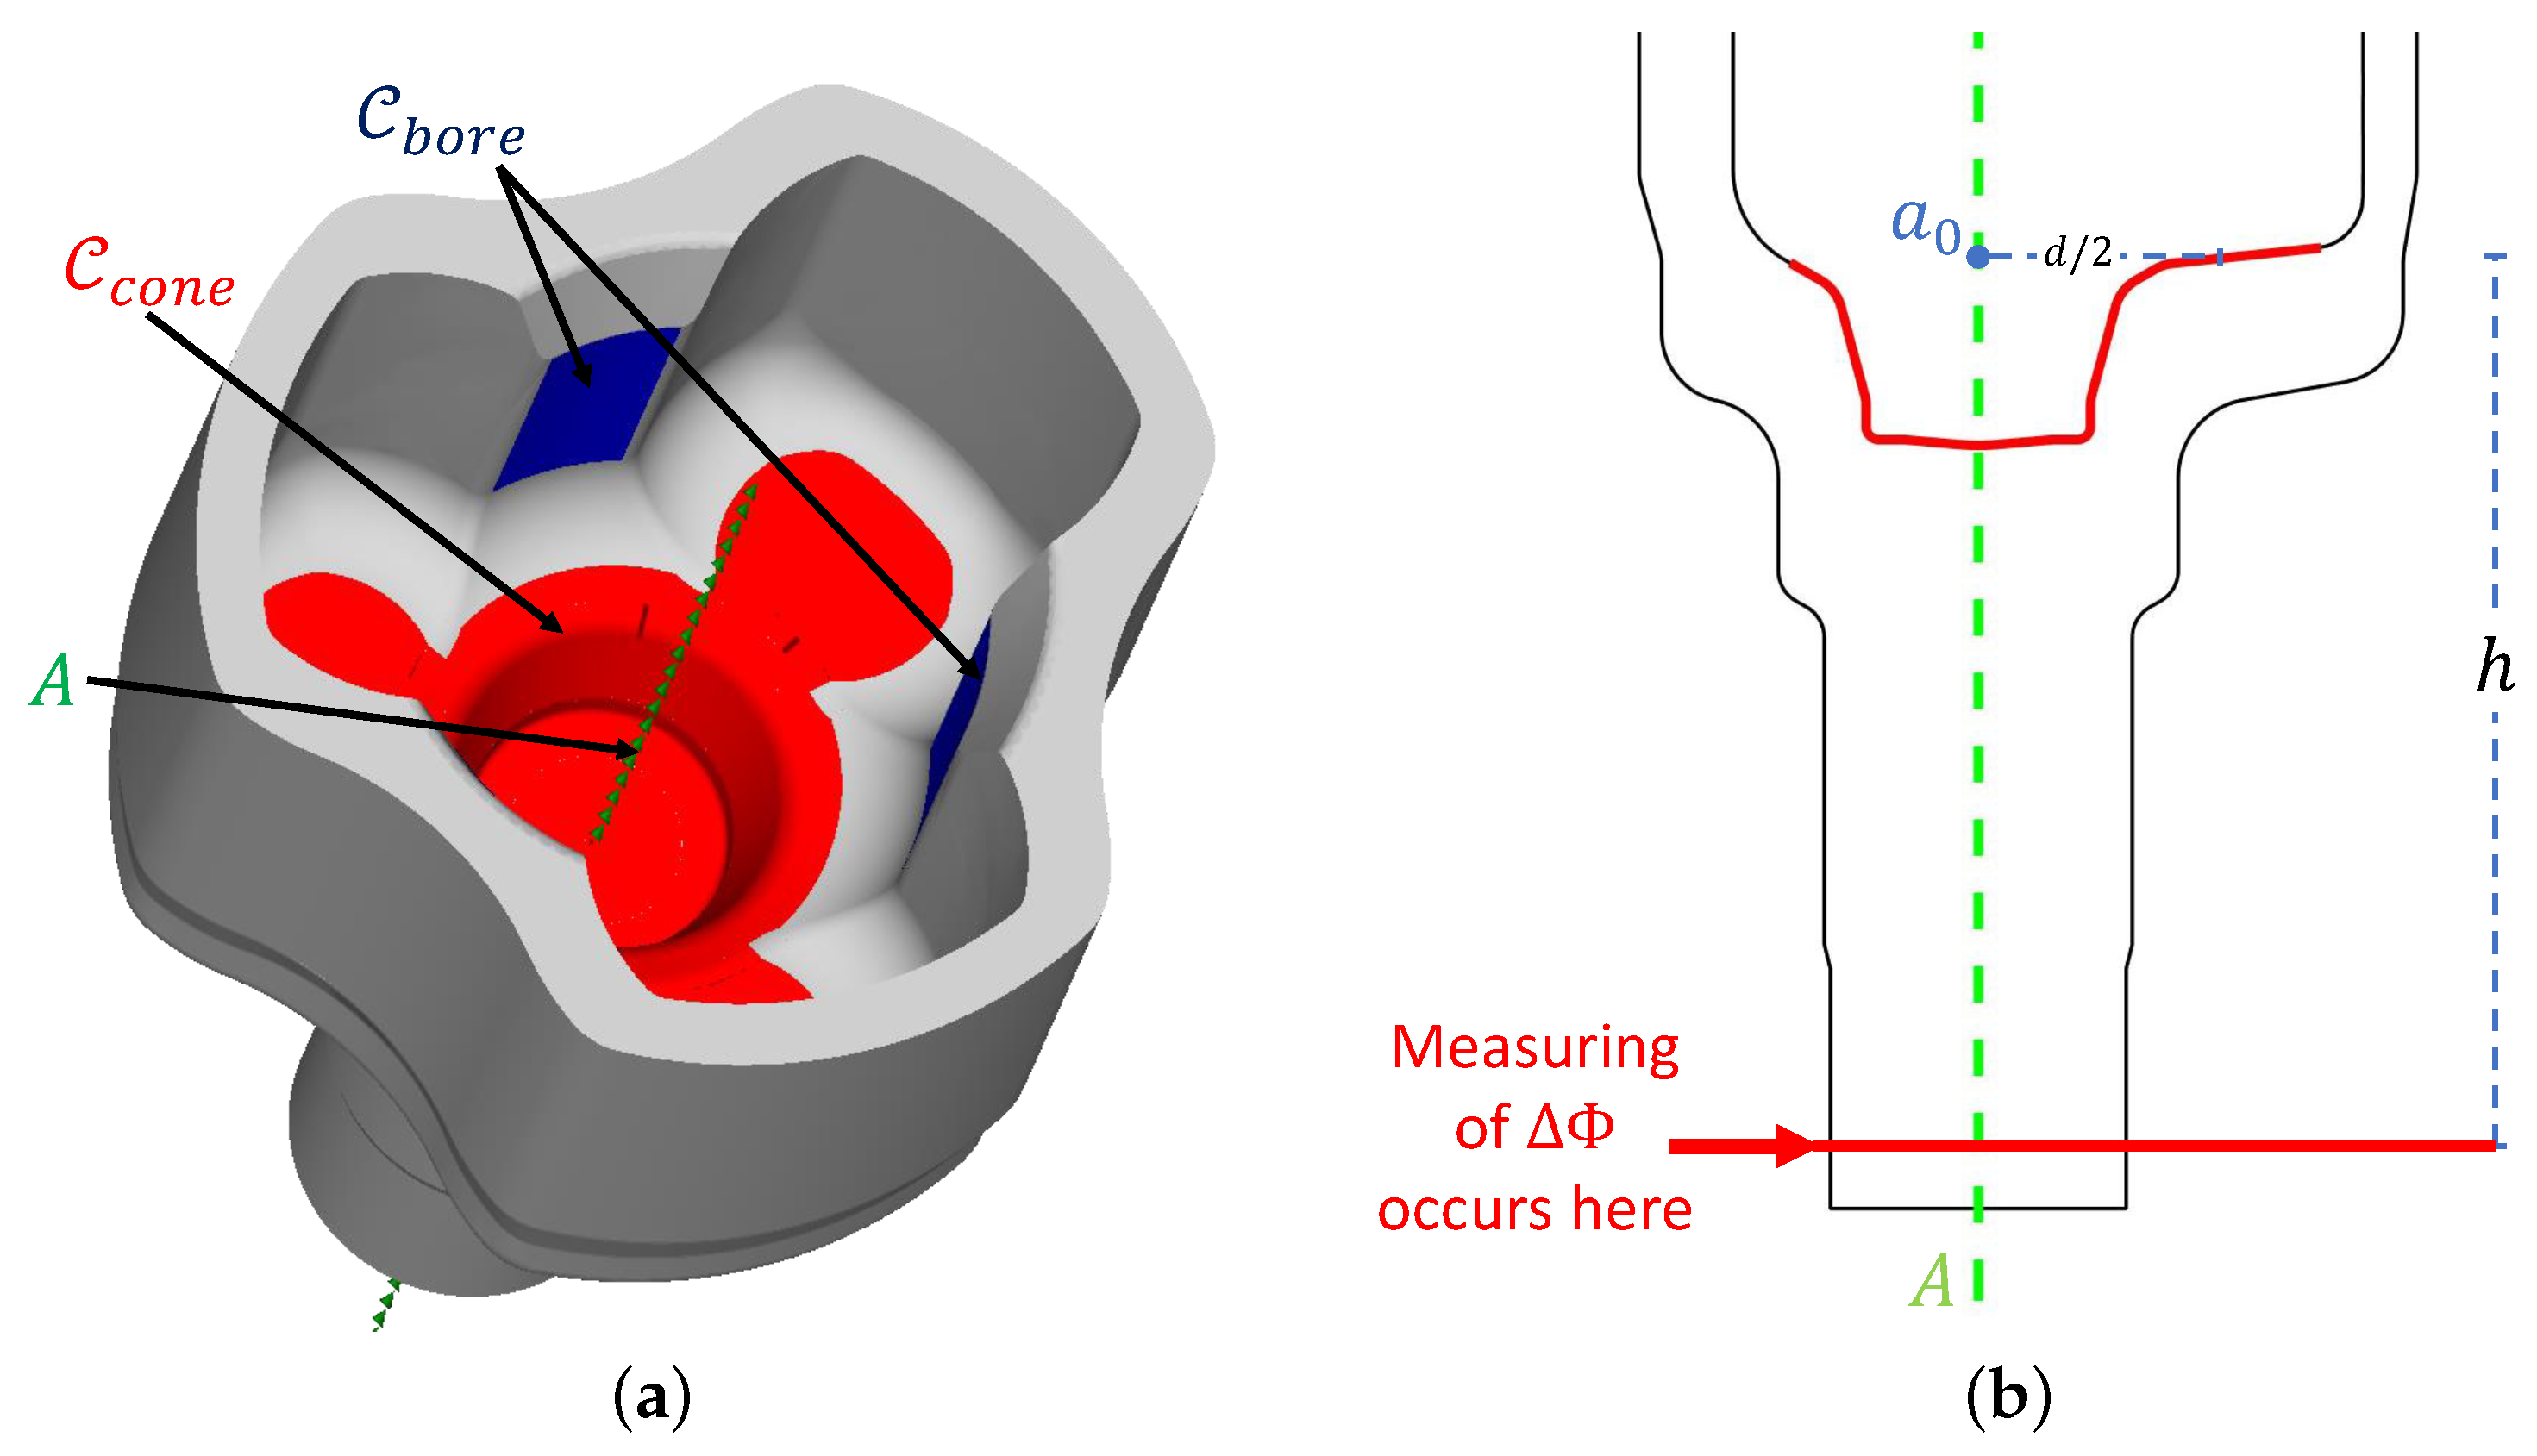
3.1.2. Feature Selection
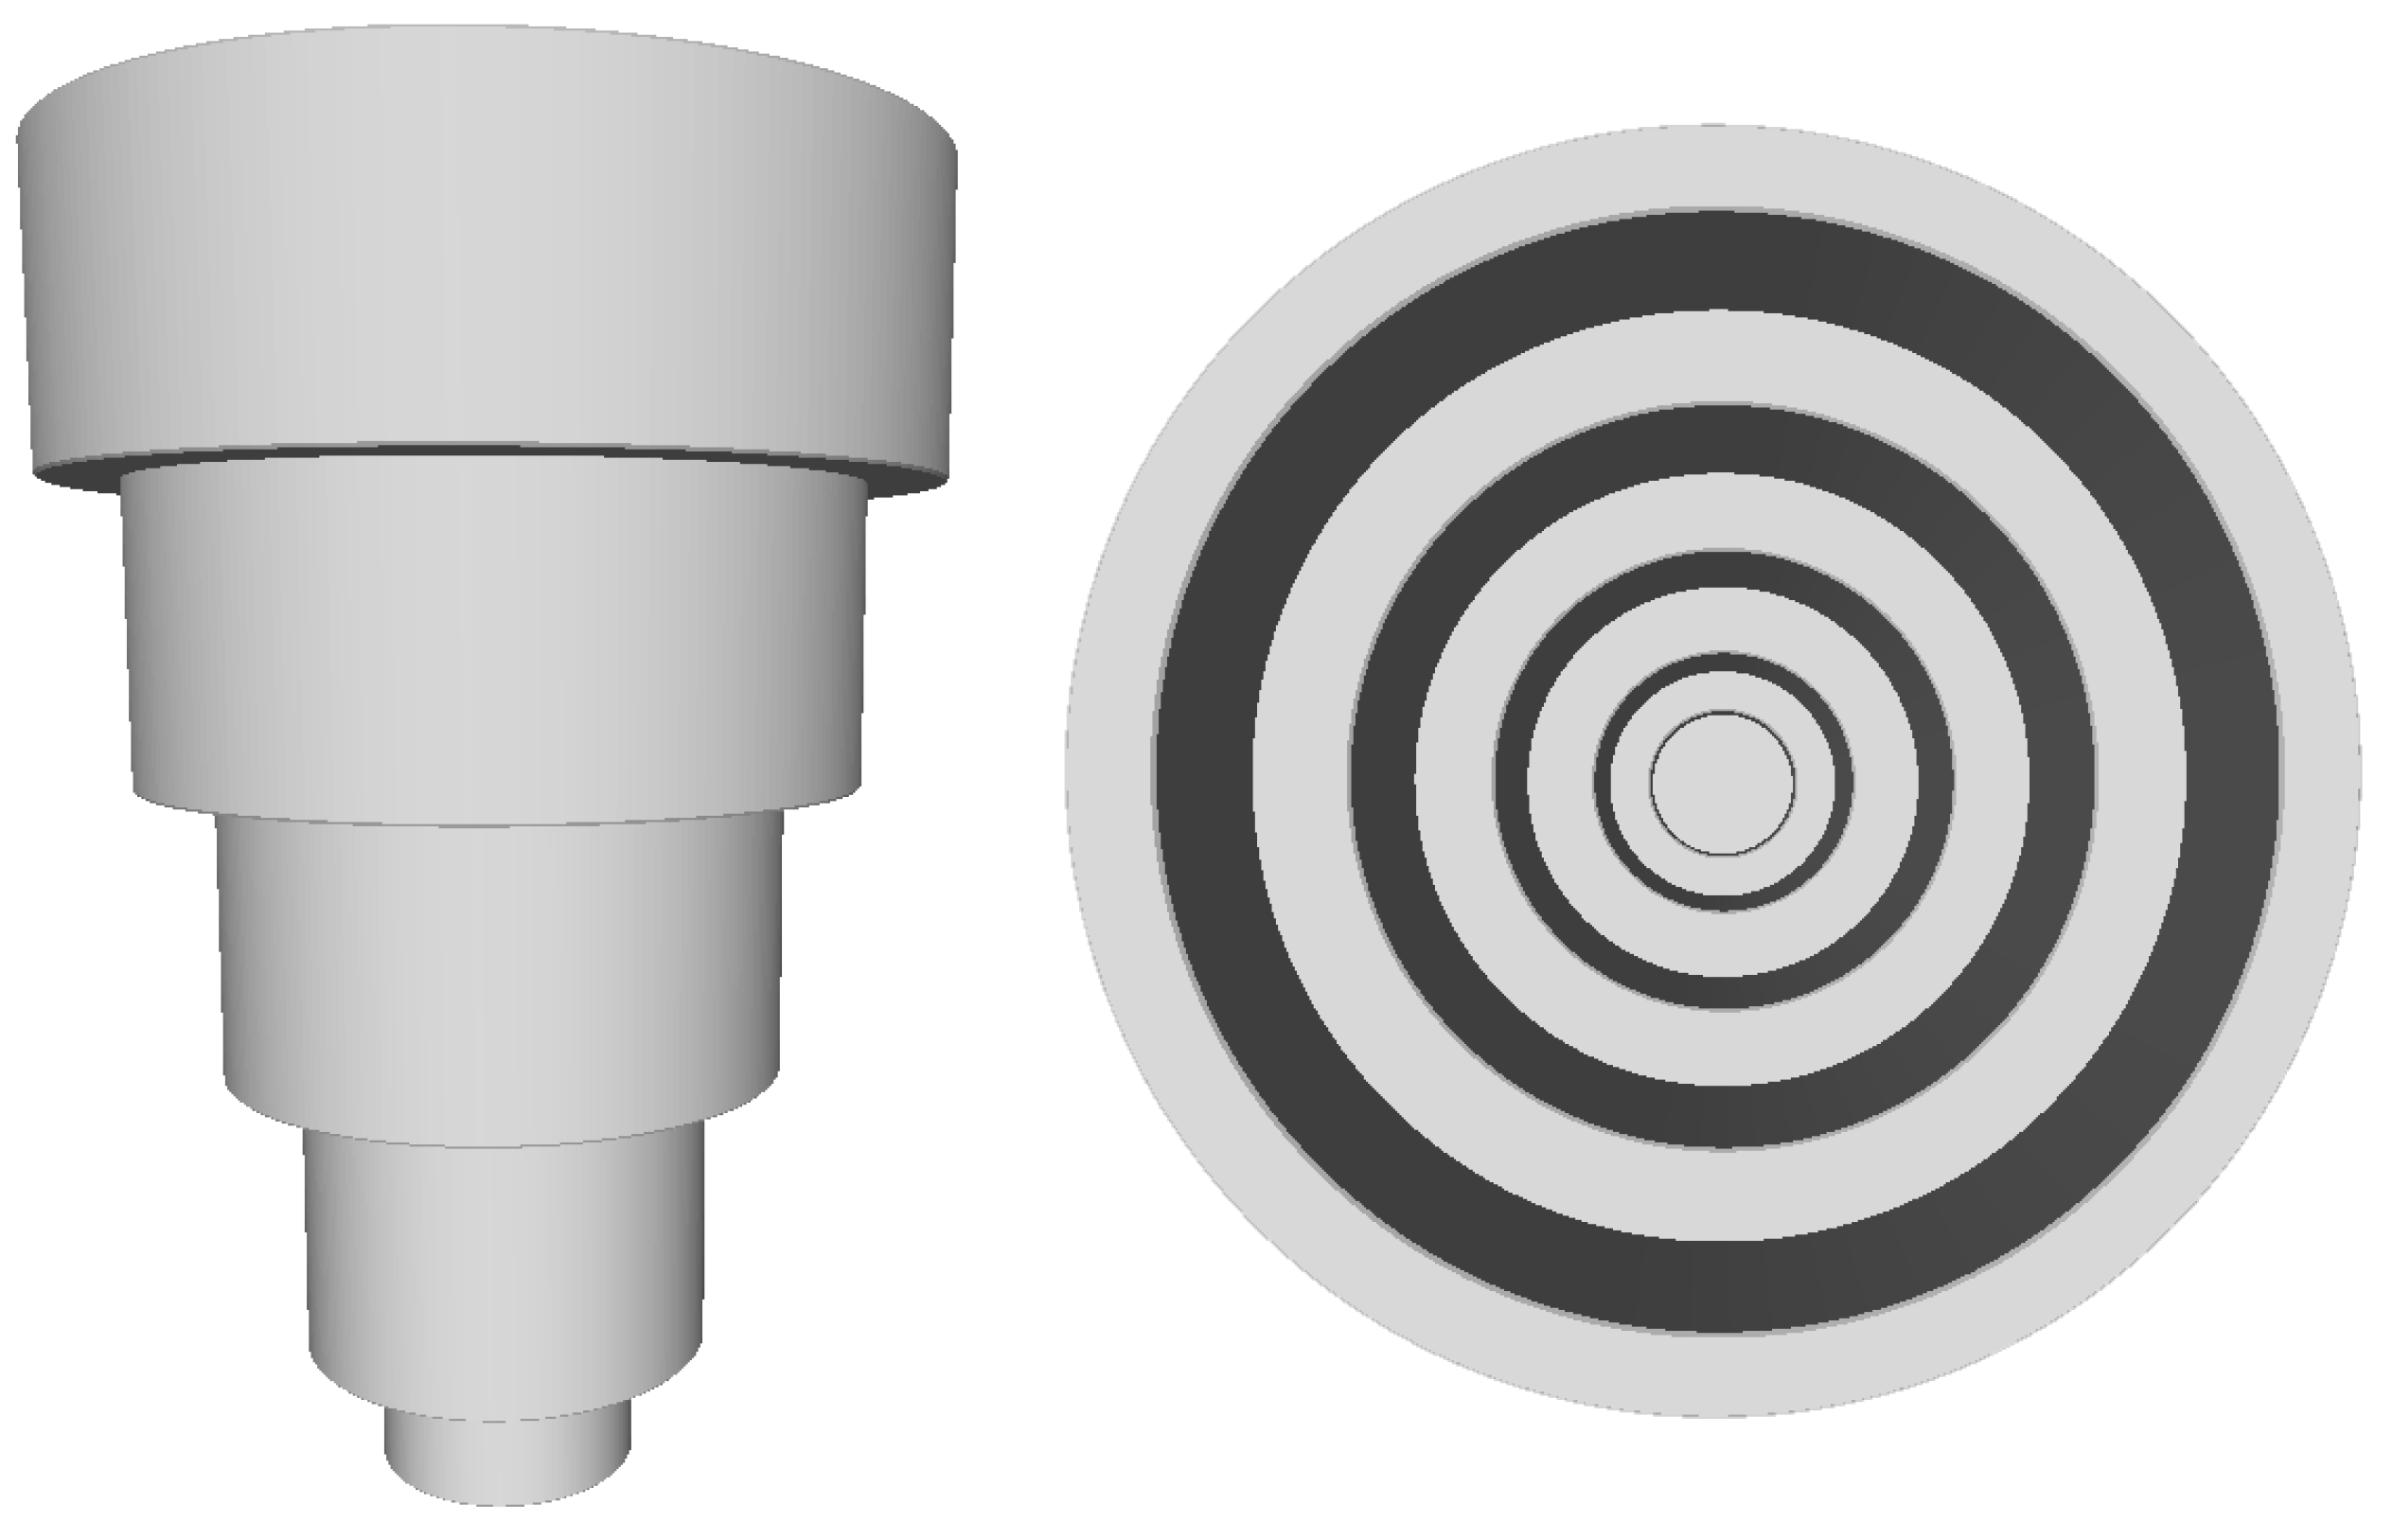
As mentioned starting Section 3, the metrologist interactively selects the different CAD features (FACEs) from C associated with the workpiece revolution axis A = ( v , a 0 ) (Figure 3a). In this case, the metrologist selects the CAD FACEs C b o r e (blue) of the cylindric surface which dictate the rotation of the workpiece. The axis vector of C b o r e defines the theoretical revolution axis vector v (green).
On the other hand, the metrologist must define the axis point a 0 as a reference point. In the context of stub axle forming, the point is computed as follows:
  • The metrologist selects the CAD FACEs C c o n e (red) corresponding to a conical surface at the bottom of the punch zone of the workpiece (Figure 3a).
  • The metrologist defines the datum diameter d > 0 . In this case, the metrologist defines d as the diameter of the supporting fixture for the machining of the workpiece (after it has been formed).
  • The point at the revolution axis A where the surface C c o n e attains the diameter d is the theoretical axis point a 0 . The diameter d is measured perpendicular to the axis A (see Figure 3b). The point a 0 is a reference point for machining operations (after the piece has been formed).
The features C b o r e and C c o n e (Figure 3a) have been chosen for the definition of the reference axis A due to two main reasons:
  • C b o r e is the part of the punch that suffers less wearing since the direction of the compression load during the forging process is parallel to its axis. This fact makes this geometry more stable from a dimensional assessment perspective.
  • The surfaces C b o r e and C c o n e are the same surfaces used to hold the workpiece during the posterior machining process. In this way, the algorithm uses the same coordinate system that will be used in the next step of the manufacturing process. In addition, it can be said that any possible registration error induced by the tool wearing is not relevant given that the subsequent machining process will use the same defective geometries to establish its reference frame.
The runout height h > 0 is the distance from a 0 along the axis A (Figure 3b) where the circular runout is measured. This height h is manually defined by the metrologist.

3.2. In-Line Dimensional Inspection

After the planning has been carried for a given reference C , the automatic inspection for every workpiece M related to that reference is automatically performed. The following sections detail the 3D scanning of the warm workpiece, the registration of the mesh regarding the reference CAD C , the computation of the revolution axis A (datum) on M based on the CAD features, and finally the calculation of the circular runout Δ Φ of the workpiece.

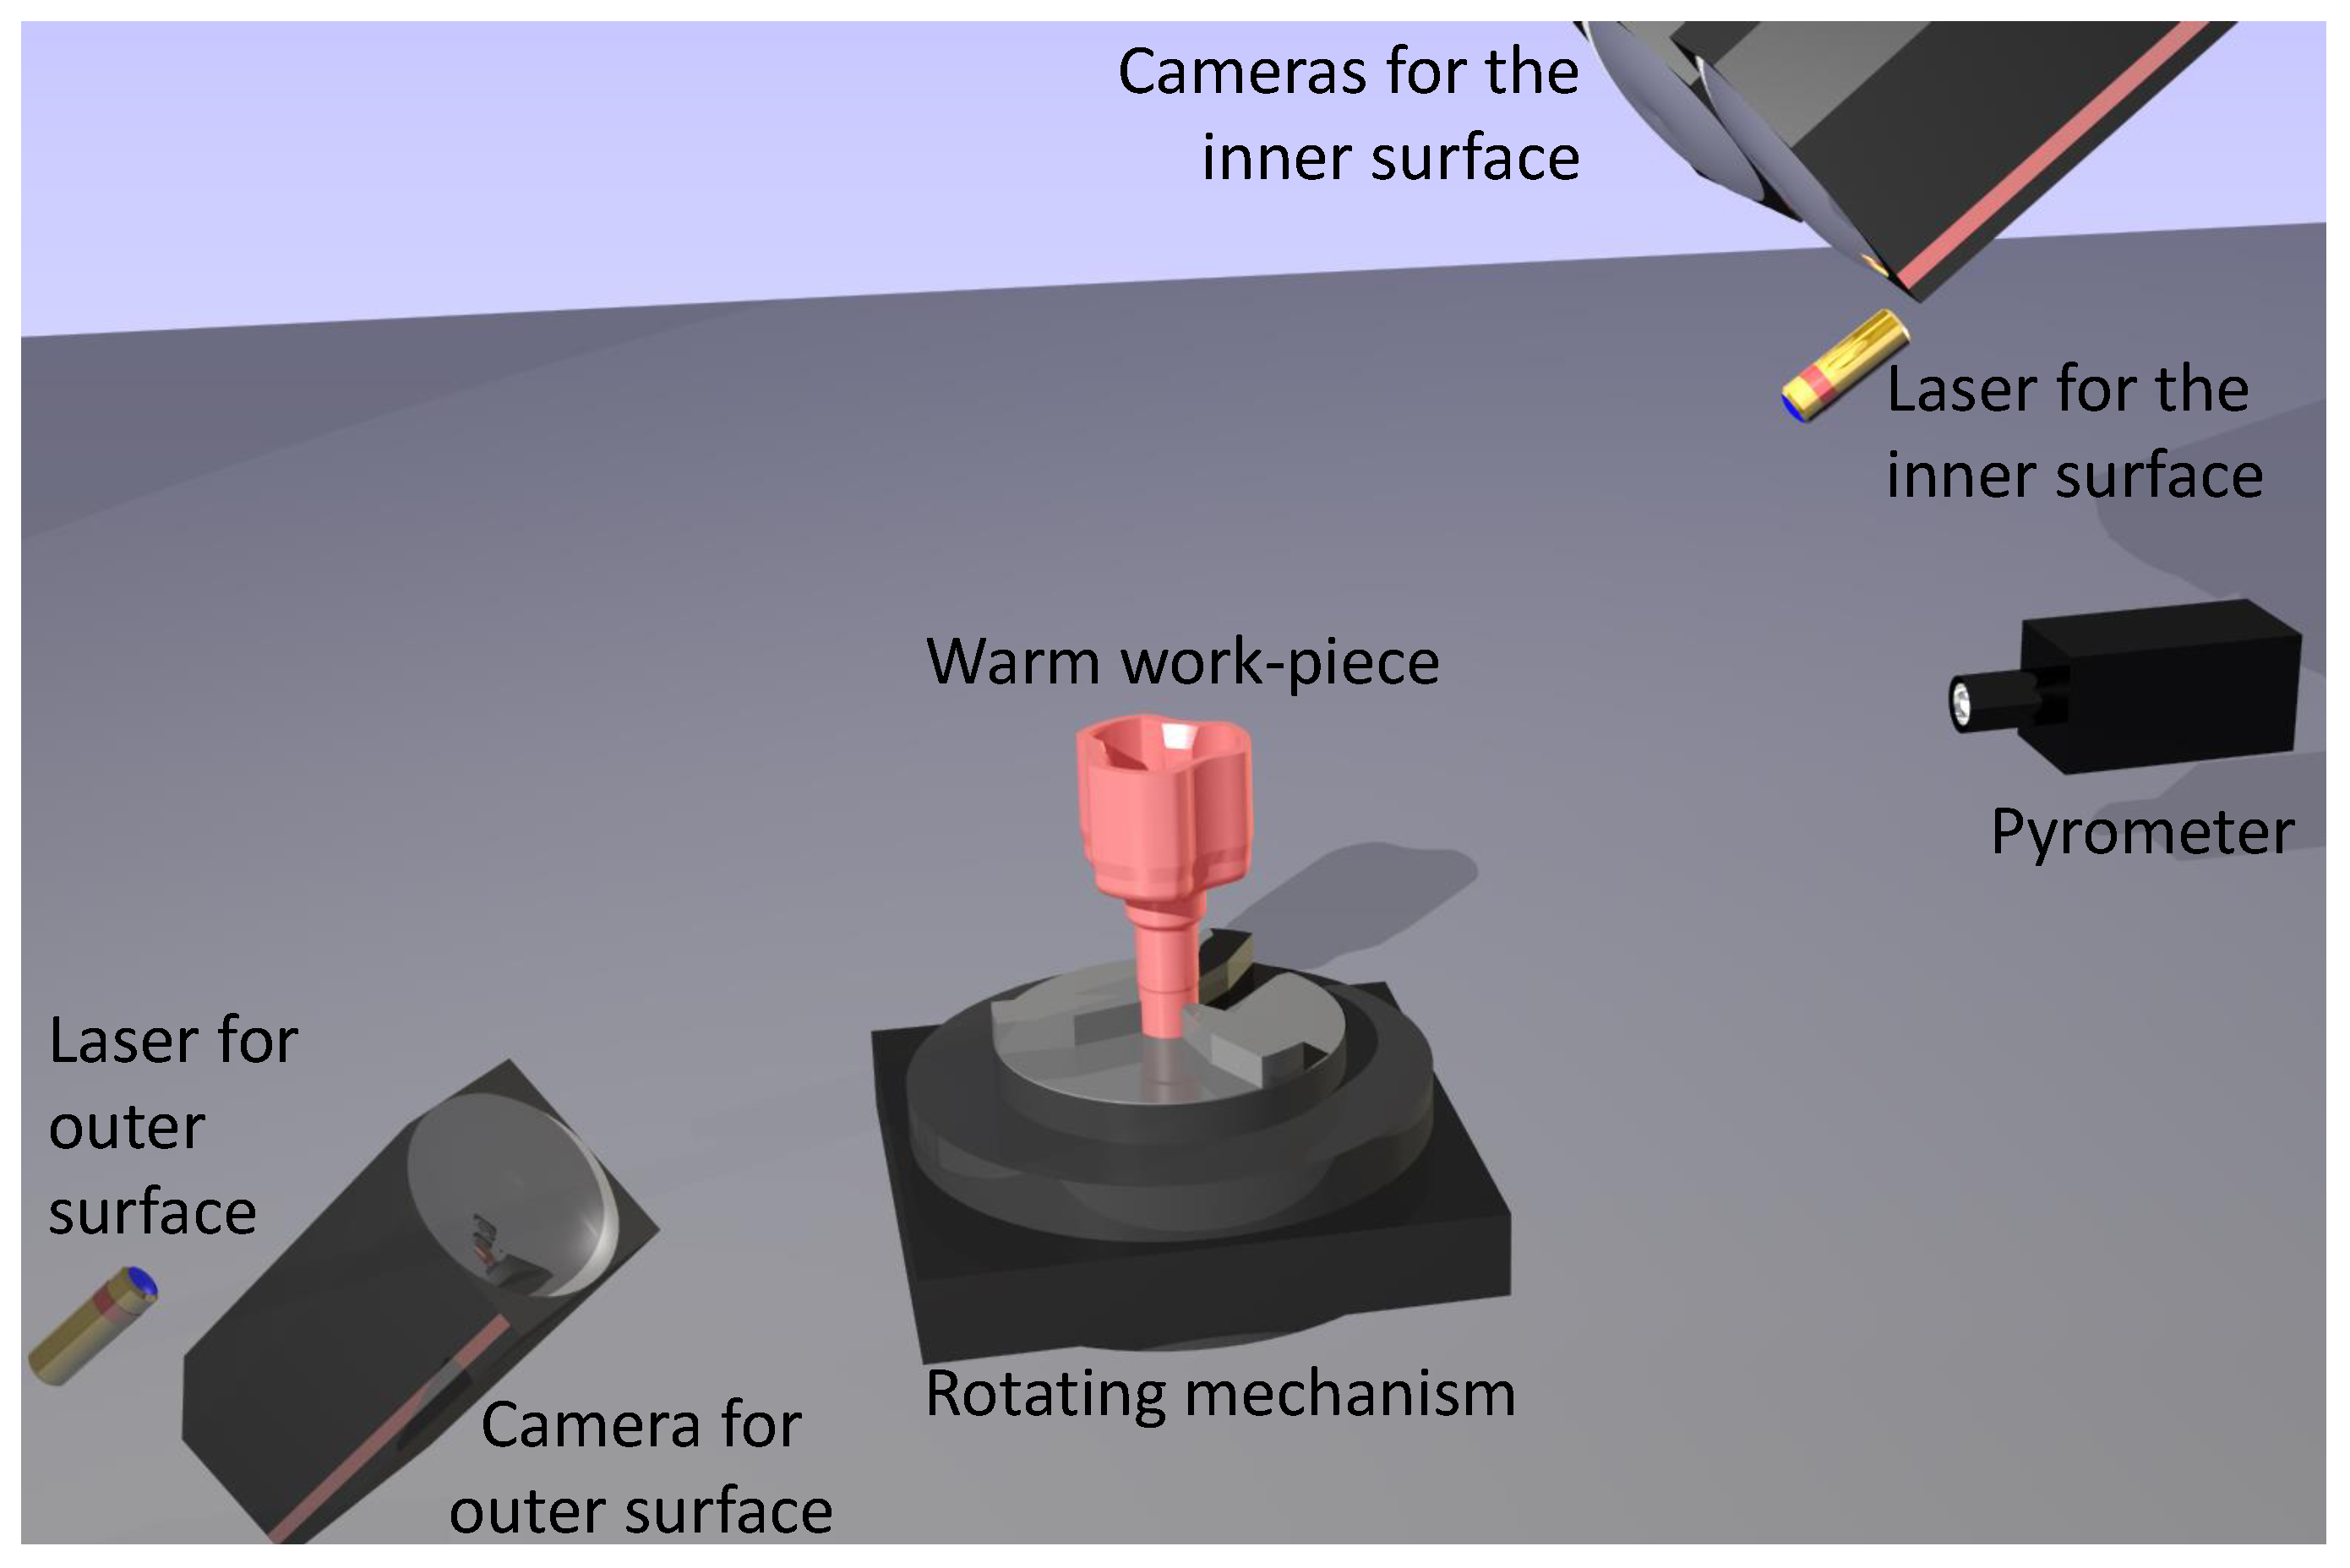
3.2.1. 3D Scanning System

Figure 4 presents the setup for the 3D scan of the warm workpiece.
Laser triangulation is used to reconstruct the surface. Two independent laser line projectors impact the workpiece inner (punch zone) and outer (forming matrix zone) sides, respectively. Since the surface emits light in the red spectrum due to the high temperatures of the workpiece, the two lasers are chosen to work in the blue spectrum.
The first laser is placed above the workpiece, with an elevation near 45 degrees with respect to the plane that supports the workpiece. This laser allows to scan the inner (punch zone) surface of the axle. This laser is observed by 2 cameras since the geometry of such surface is self-occluding. The cameras must be as close to the workpiece as the heat emitted by it permits (approx. 500 mm), in accordance to the operating temperature prescribed for them.
The second laser is positioned underneath the plane supporting the workpiece (elevation near −45 degrees). The external surface (forming matrix zone) of the workpiece is scanned from below, through slots of the supporting table. The laser projection on such surface is captured by a single camera since no occlusions occur.
Since the laser projections do not lie on a plane parallel to their respective camera plane, Scheimpflug adapters [29] are incorporated in all the cameras to fix their plane of focus. In addition, each camera has an interference filter which allows it to only see light near the laser wavelength ( 450 nm ± 25 nm , see Table 2).
A 3-grip system holds the workpiece from the shaft. The grip system is made of steel with ceramic coating to stand the high temperatures. The 3-grip system is mounted on a rotating disk such that the workpiece is rotated 360 degrees around its revolution axis during the scanning. The cameras capture a static image of the workpiece at each pulse of the encoder. Thus, the reconstruction is performed with 360 images per camera.
The 3D mesh reconstruction from the acquired images is executed with HALCON [30]. The acquisition and reconstruction of the warm workpiece takes about 5 s (average). Finally, a pyrometer is used to track the average temperature of the workpiece during the 3D reconstruction.
The full setup has been installed on a foam cushion layer to isolate the sensors form the vibrations induced by the forging presses.

3.2.2. Device Calibration

The calibration of the scanner involves the characterization of the laser triangulators and their relative positions regarding the axis of the rotating disk. The scanner has a total of two triangulators, with one and two cameras respectively (see Figure 4). Assuming that the reference system of the machine is in the center of the rotating disk, the calibration involves the estimation of the three camera poses.
Both laser projectors have been mechanically positioned and aligned so that their intersection coincides with the axis of the rotating disk. During the construction of the scanner this alignment is verified with a gauge specifically designed for this task, and it does not need further adjustments. This alignment ensures that the points reconstructed by the cameras belong to the plane X Z of the reference system, which is defined by the rotation axis and the two laser lines.
The pose of the cameras is estimated using a calibration object with a hollow revolution geometry, as shown in Figure 5. Such a calibration object has been measured using a CMM by a metrology laboratory certified by an ENAC (National Accreditation Entity).
During the calibration process the object rotates around the axis of the turn table while the cameras observe the projections of the lasers on its surface. Each camera captures an image for each pulse of the encoder, which has been set to 360 pulses per complete revolution. From these images the intersection of the different segments (laser projections) are obtained.
Since the geometry of the calibration object is known, it is possible to establish 3D-2D point matches that relate points from a common reference frame with their corresponding observations in the camera images. In this way, it is possible to obtain the pose of the three cameras solving the homography matrices induced by the sets of correspondences [31].
Experimentally, it has been found that the residual error of the homography evaluated in the intersection points after the calibration is under 0.01 mm. Figure 6 shows some dimensions measured in the calibration object. As it can be deduced from the results, the uncertainty of the scanner is better (less deviation) in the central area of the scanning volume. This effect can be attributed to the fact that the images of the cameras have better focus quality in this area, even after adding the Scheimpflug adapters.

3.2.3. Mesh Registration

It is imperative for our system that the scanned triangular mesh M is represented in the same coordinate system W of the CAD reference C . The mesh registration process computes the rigid transformation T f S E ( 3 ) that maps the mesh coordinate system W M to the global coordinate system W i.e., T f ( W M ) = W . The rigid transformation T f is computed by minimizing the distance between the transformed mesh and the reference CAD model:
T f = arg min x i M d ( T f ( x i ) , C ) s . t . T f S E ( 3 )
where d ( T f ( x i ) , C ) is the closest distance from the point T f ( x i ) to the reference C . To solve the minimization problem in Equation (2), the Iterative Closest Point (ICP) algorithm is implemented [32]. The ICP algorithm, transforms the previously defined minimization problem into the following equivalent one:
T i c p = arg min x i M d ( ( T i c p T 0 ) ( x i ) , C ) s . t . T i c p S E ( 3 )
where T f = T i c p T 0 . To avoid local minima, the ICP algorithm requires an initial solution T 0 such that T 0 ( W 0 ) is close to the optimal solution W. T 0 has been previously computed in the planning step (Equation (1)).
In optical-based dimensional inspection, selection of reference geometries for mesh registration is crucial for adequate estimation of datums and measurements [9,10]. Therefore, the registration of the scanned mesh M is performed using only the punch zone of the workpiece, which characterizes the revolution axis A. Figure 7 plots the results of the registration process. The colormap shows the distance from the scanned mesh M to the reference CAD C , with green zones indicating closeness between the models ( d ( x i , C ) 0 mm), and red and blue zones indicating remoteness ( d ( x i , C ) > 0 . 5 mm).
To save computational expenses, the distance d ( T f ( x i ) , C ) is computed by previously meshing the CAD reference. This is done because we have observed from our experiments that computing point-to-CAD distance is more time-consuming than point-to-mesh distance.

3.2.4. Feature Extraction

After the mesh registration of M has been computed, the system proceeds to extract the mesh features required for the dimensional assessment. To compute the revolution axis, we need to first extract the sub-mesh M b o r e M which corresponds to the cylindric surface that dictates the rotation of the workpiece. Such cylindric surface has been already identified by the metrologist in the CAD model during the planning phase (Figure 3a). M b o r e is computed by extracting the mesh points close to the corresponding CAD feature C b o r e :
M b o r e = x M | d ( x , C b o r e ) < ε cos 1 ( n ( x ) · u ( x ) ) < θ
where ε > 0 , 0 θ 180 are a threshold distance (mm) and a threshold angle (degrees), respectively, n ( x ) is the vector normal to the surface at x M , and u ( x ) is a vector pointing to the theoretical revolution axis A = ( v , c 0 ) , defined as follows:
u ( x ) = ( ( x c 0 ) · v ) v ( x c 0 )
The term cos 1 ( n ( x ) · u ( x ) ) is introduced in Equation (4) to filter mesh noise and improve the estimation of the revolution axis on the scanned mesh. From our experiments, we have found that the threshold values ε = 0 . 5 mm and θ = 10 produce good results, considering the thermal contraction of the workpiece, mesh noise, etc.
The vector v is computed by fitting a cylinder to the mesh M b o r e . The RANSAC algorithm from the Point Cloud Library (PCL) [33] is used to perform the surface fitting.
An approach similar to the previous one is used to calculate the reference axis point a 0 . The cone surface feature M c o n e M is computed by extracting the mesh points close to the corresponding CAD feature C c o n e :
M c o n e = x M | d ( x , C c o n e ) < ε
We have found in our experiments that fitting a cone surface to M c o n e produces highly unstable results. Instead of fitting the analytical surface, the developed system computes a cylinder S v , d / 2 with axis vector v and cylinder radius d / 2 . This cylinder is then intersected with M c o n e , which produces a polyline Q (Figure 8a). Finally, the intersection between v and the plane that contains the polyline Q (in a least-squares sense), is the point a 0 (Figure 8b).

3.2.5. Dimensional Measurements
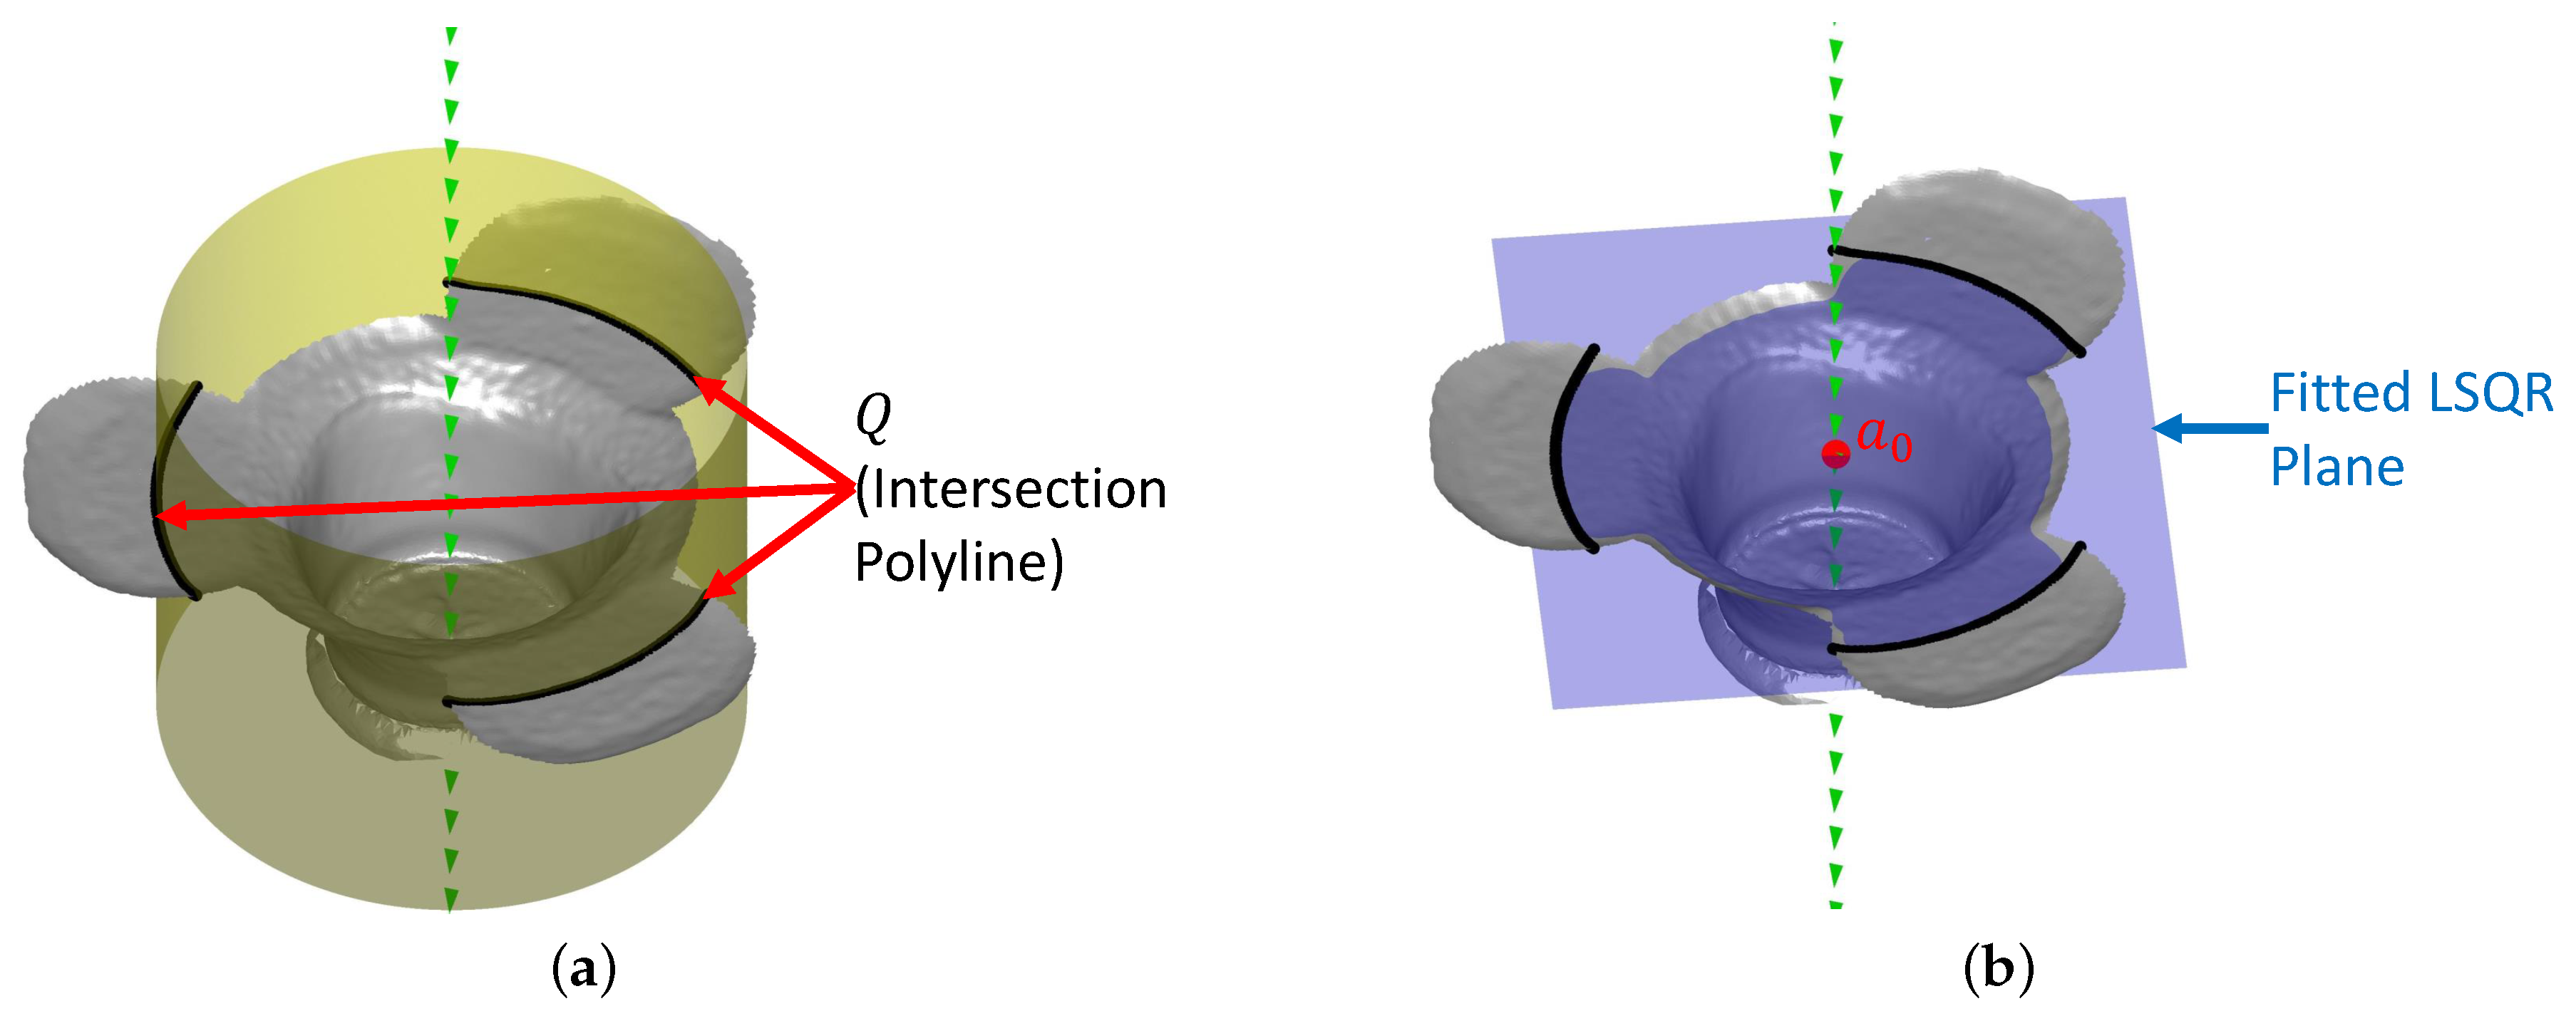
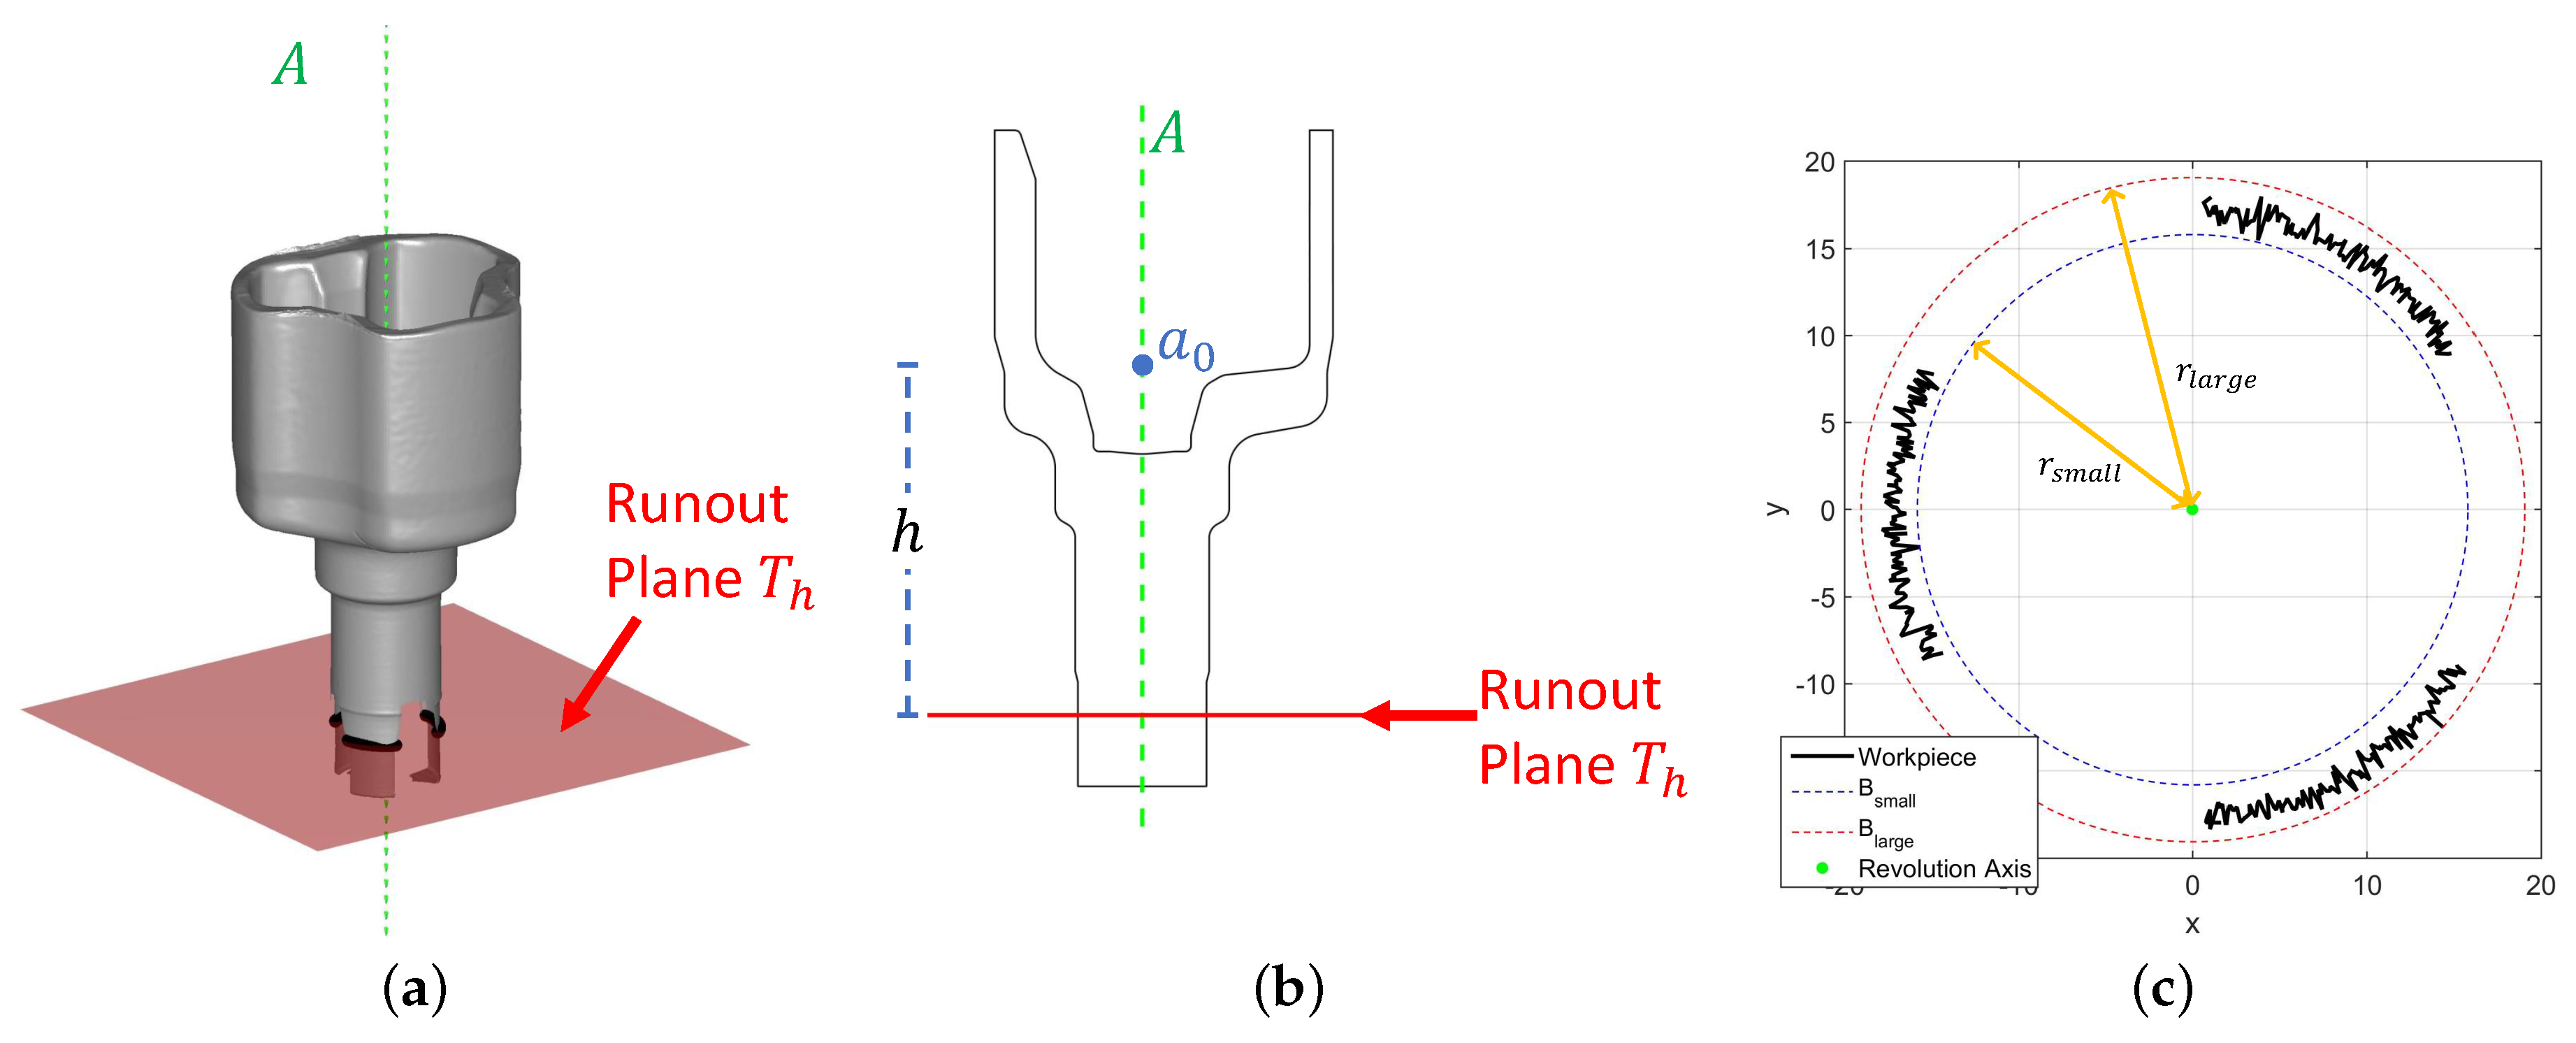
After the workpiece revolution axis A has been calculated, the circular runout can be computed on M. Given a circular feature P M , perpendicular to the revolution axis A (i.e., P A ), the circular runout of P with respect to A measures how much the feature P oscillates when the workpiece is rotated around the axis A [8].
The following steps describe the system’s approach to compute the circular runout of the workpiece:
  • Compute the plane T h with normal vector v and pivot point a 0 + h v (the parameter h has been defined already by the metrologist in the planning step, Section 3.1.2). See Figure 9a,b.
  • Compute the circular feature P defined as:
    P = M T h
  • Filter outliers by removing all points in P whose distance to the theoretical section is greater than a given threshold.
  • Compute the inscribed circle B s m a l l and circumscribed circle B l a r g e of P with center A and respective radii r s m a l l , r l a r g e (Figure 9c). 0 < r s m a l l r l a r g e .
  • Compute the circular runout Δ Φ defined as [8]:
    Δ Φ = r l a r g e r s m a l l
Before the computation of the circular runout, our system performs circle fitting on the feature P using RANSAC. Such a fitting improves the robustness of the runout estimation by filtering noise and outliers from the scanned mesh.
It is worth noting that the runout deviation includes the eccentricity of both axes and roundness deviations of the measured circle. This is an expected behavior following the standards for geometrical dimensioning and tolerancing [8].

4. Results

Section 4.1 presents and discusses the application of the system to assess the runout of a scanned workpiece at different temperatures. Section 4.2 shows the results of prior-to-operation testing the system using an ANOVA R&R test on cold-state workpieces. Section 4.3 discusses the deployment of the developed system in the automotive manufacturing plant. Finally, Section 4.4 discusses the application of the system in the context of Visual Computing and Industry 4.0 technologies.

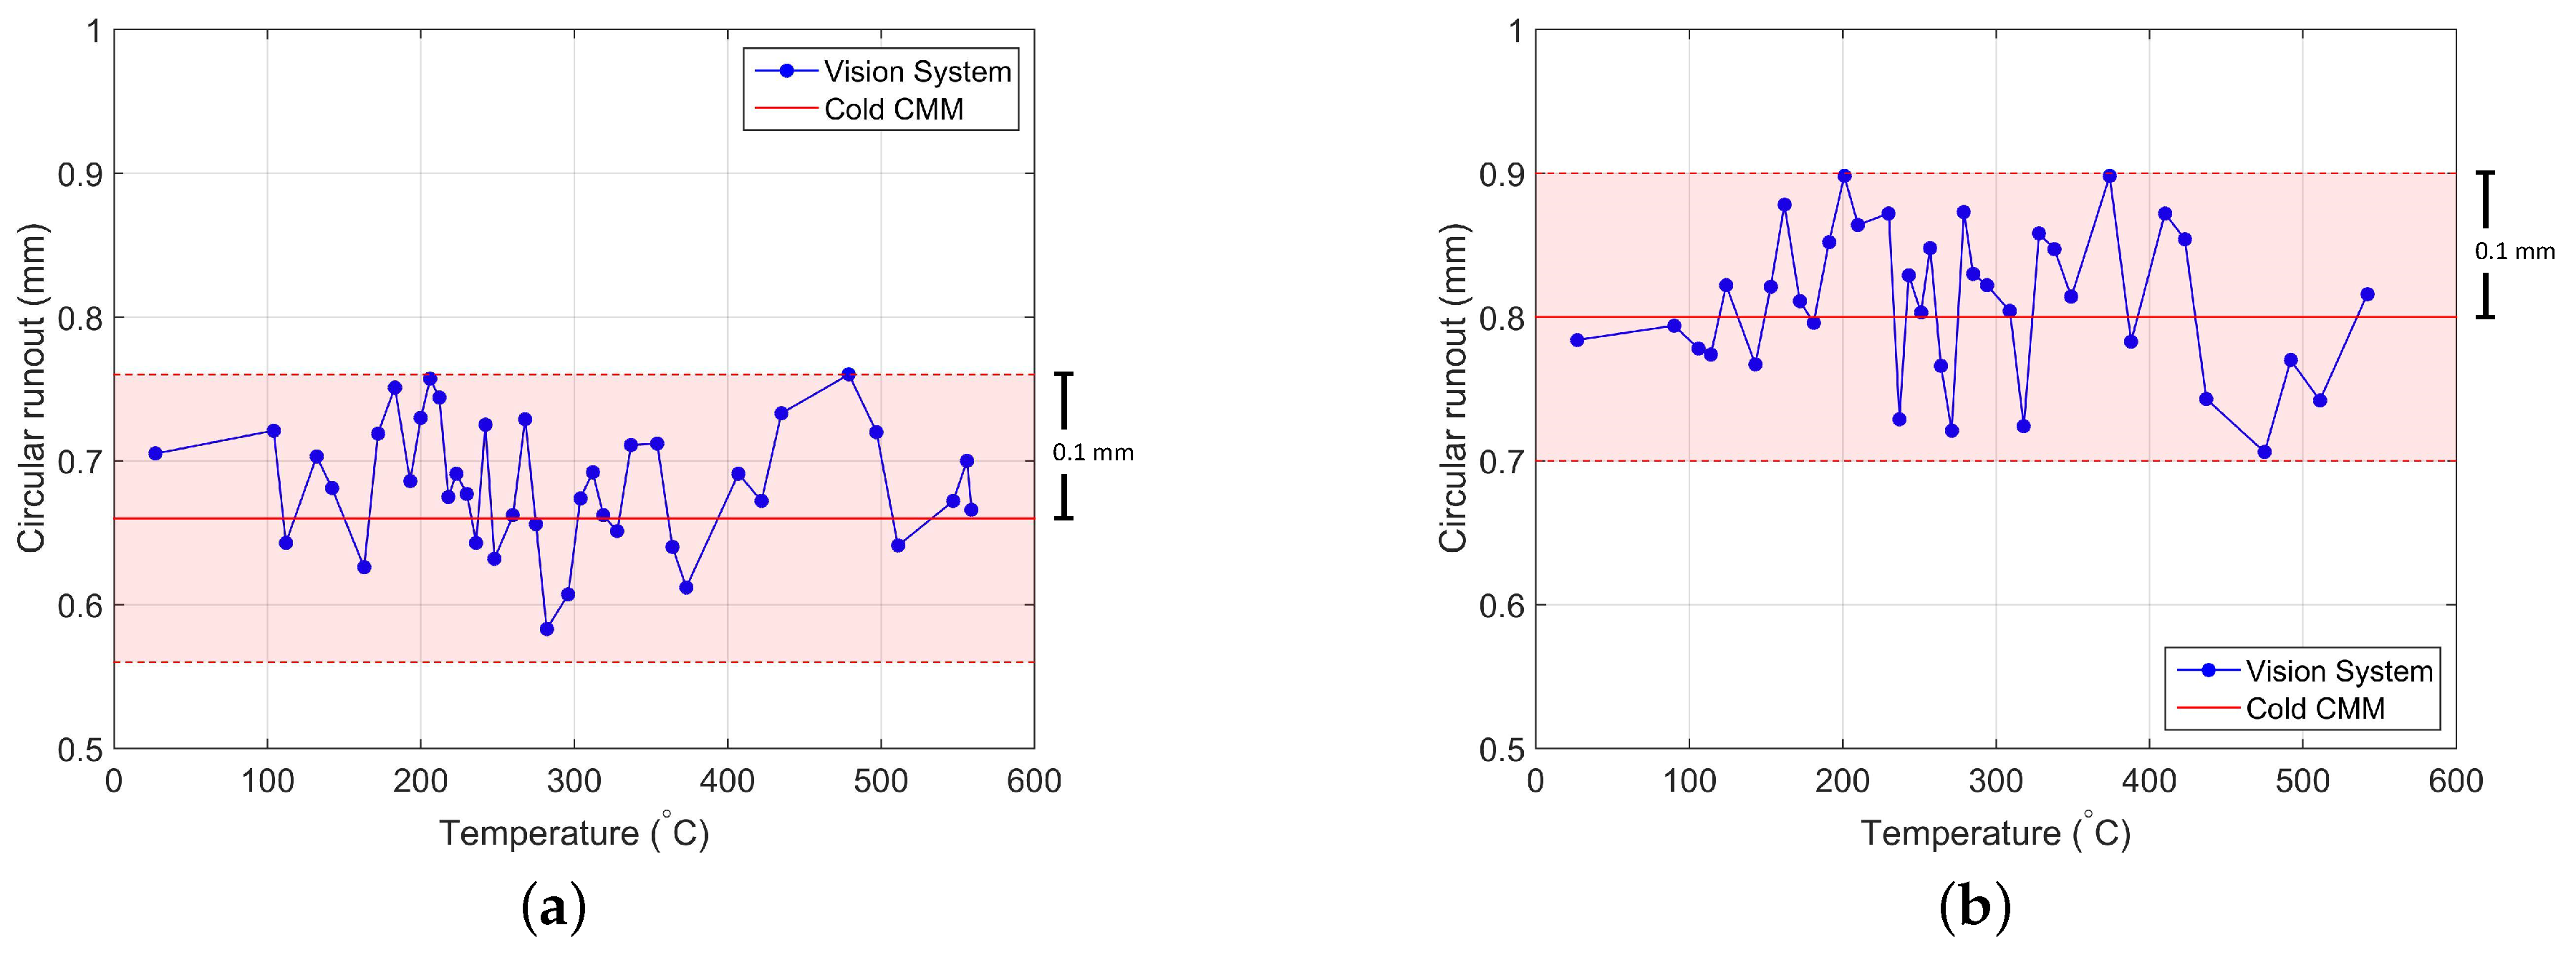
4.1. Warm-Workpiece Measurements

In the manufacturing line, each workpiece leaves the forming press at nearly 800 C. Each part is then left to be cooled naturally by air convection, which takes around 60 min. For this section, two different workpieces are measured continuously during the cool-down. The height of each workpiece is 161.63 mm, and the runout height h (from the axis point a 0 to the runout plane—see Figure 9b) is 64 mm. The objective of this test is to evaluate the accuracy of the system (agreement with the CMM result). Figure 10 plots the runout measurements at different temperatures for the two different workpieces. The workpieces have been measured in the temperature range 27 C ≤ T ≤ 560 C. Each workpiece runout also has been measured with a CMM after cool-down (27 C). The CMM value is used as ground-truth for assessment purposes. The CMM value obtained for the first workpiece is 0.66 mm. Figure 10a shows that our system measurements deviate in less than 0.1 mm from the CMM measurement. The CMM value obtained for the second workpiece is 0.8 mm. Similar to the first workpiece, our system measurements deviate in less than 0.1 mm from the CMM measurement (Figure 10b). It is worth noting that this deviation is dependent on the height h, increasing as longer workpieces are measured (and decreasing for shorter ones). Such a deviation (vs. height) is small enough for the dimensional assessment purposes of the forging process in which the system is deployed.
In Figure 10, there is no apparent correlation between the runout and the temperature of the workpiece at this scale of uncertainty (0.1 mm). Consequently, assessment of the workpiece runout can be performed in our system without the necessity of a correction due to thermal contraction. A more robust study on this matter for this measurement (and other dimensional measurements on the workpiece) is out of the scope of this manuscript, and it is left for future work.

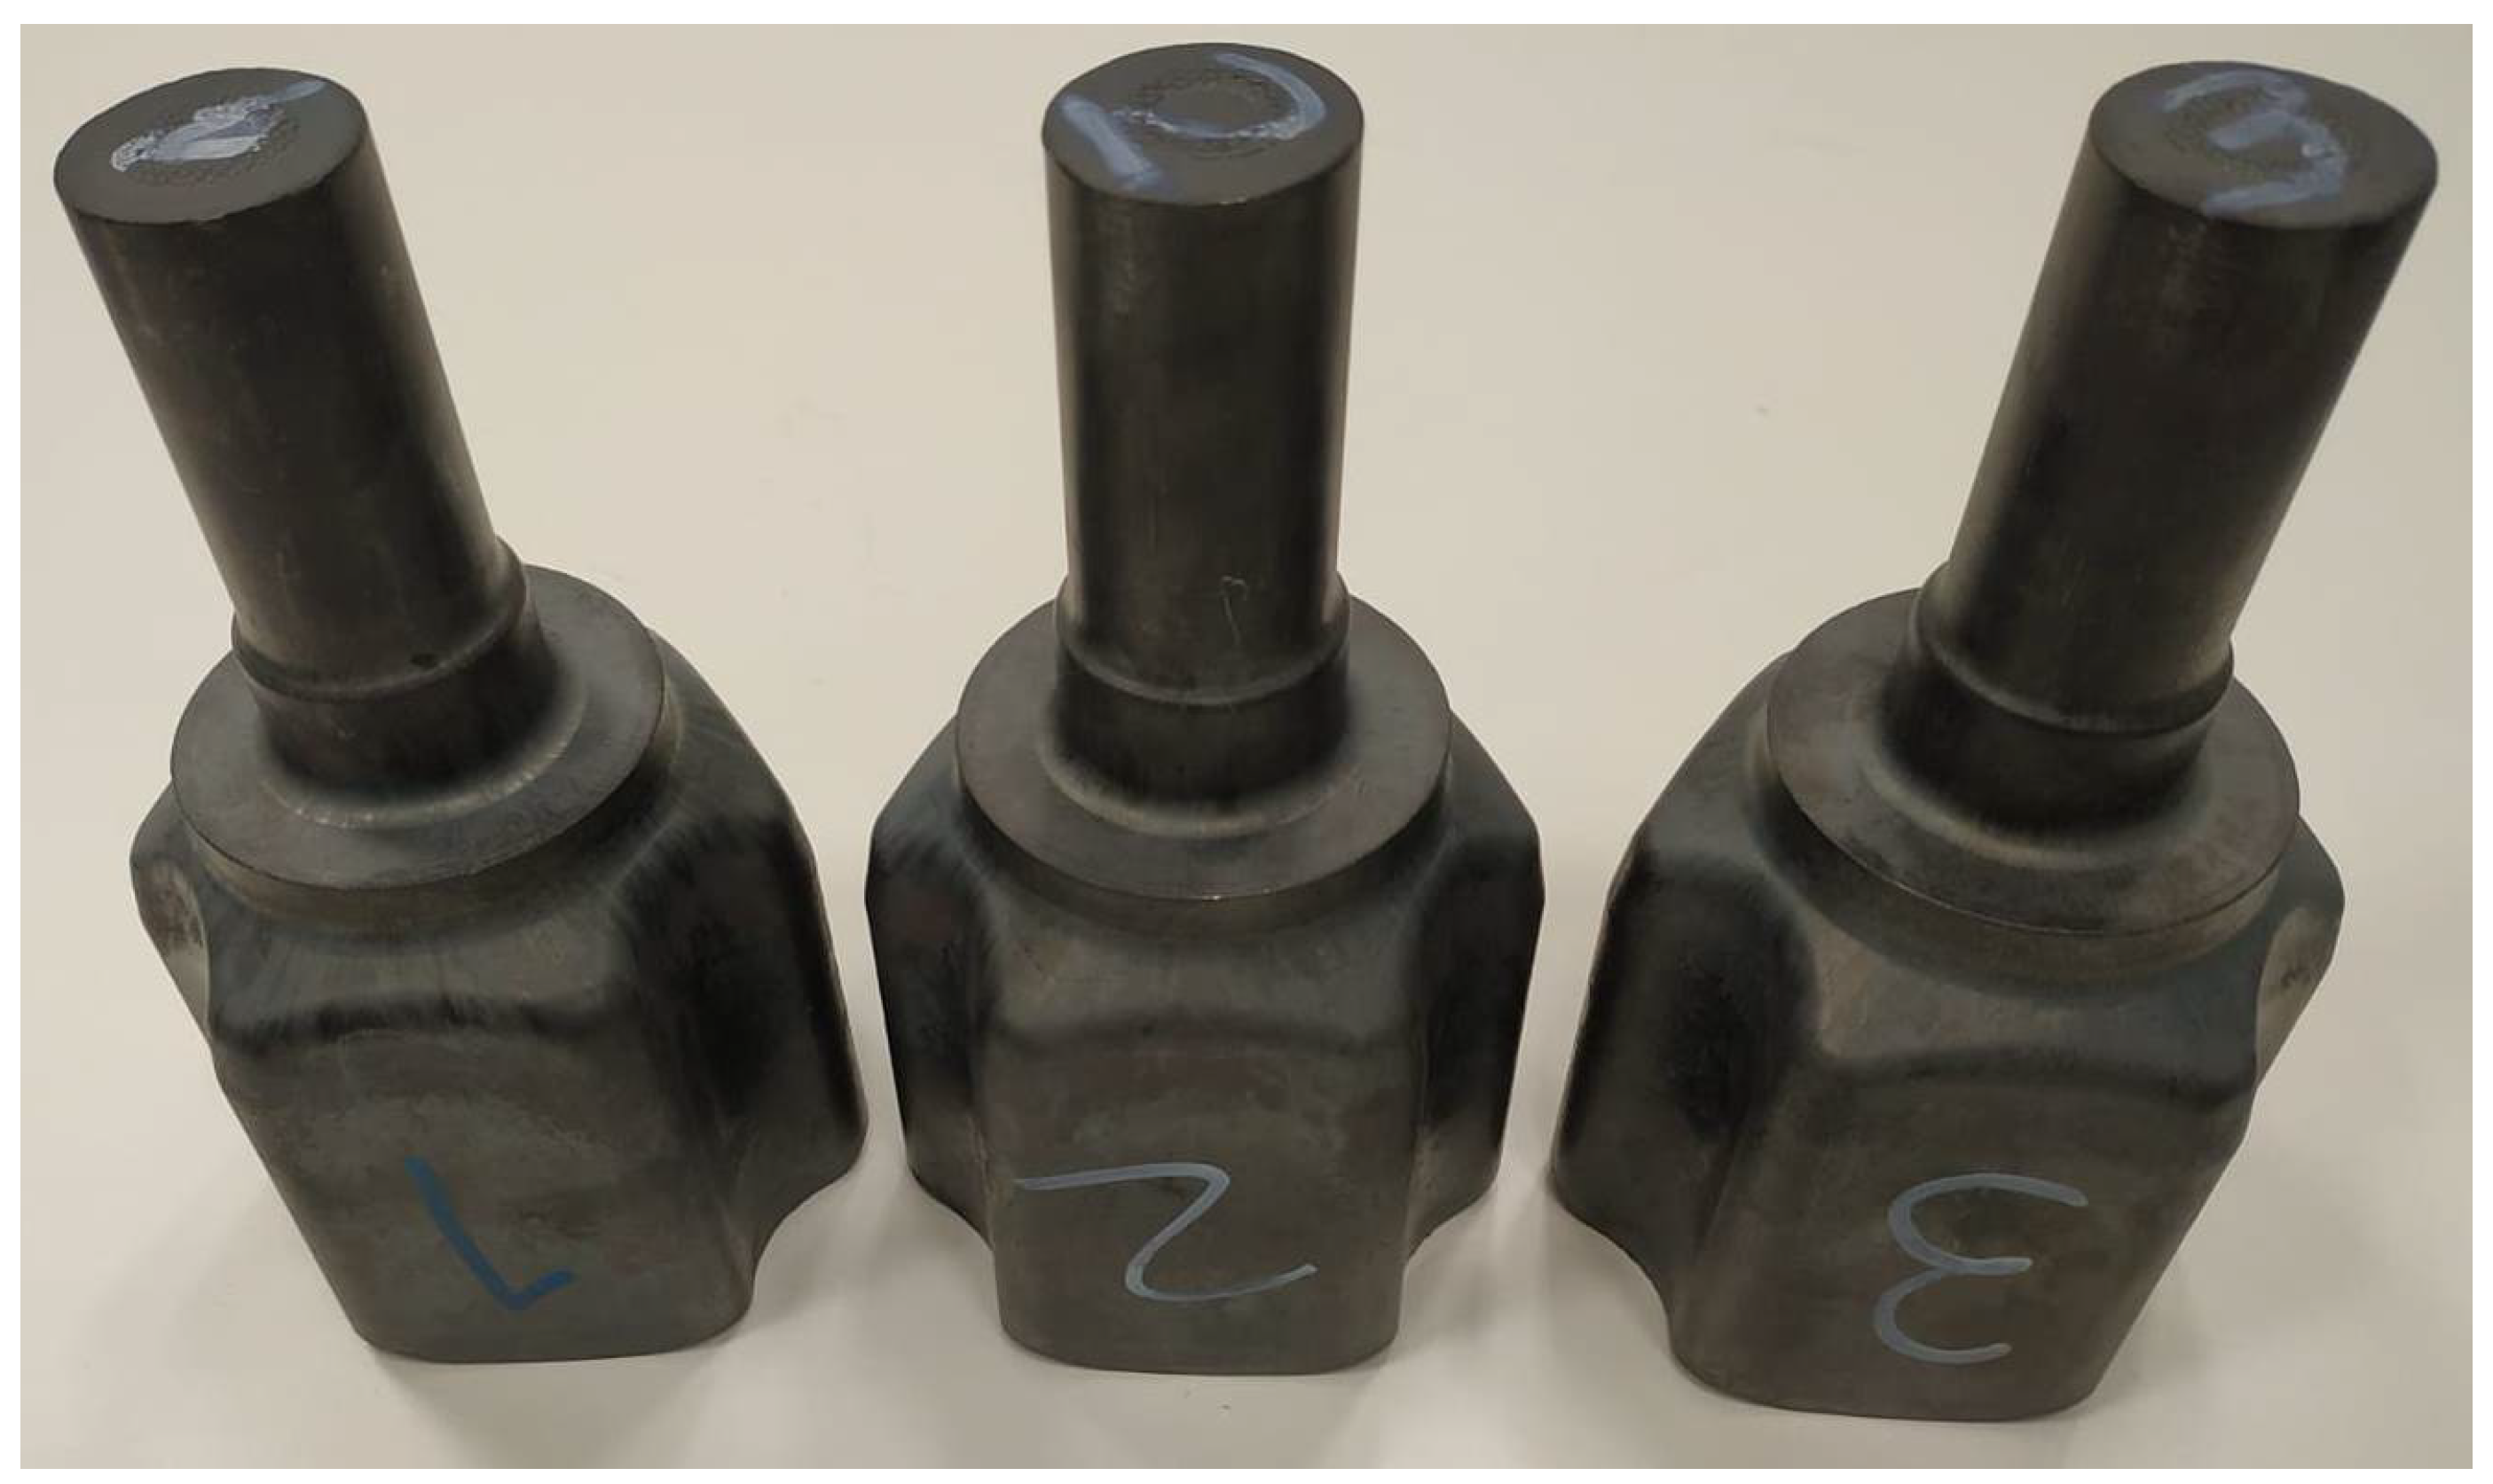
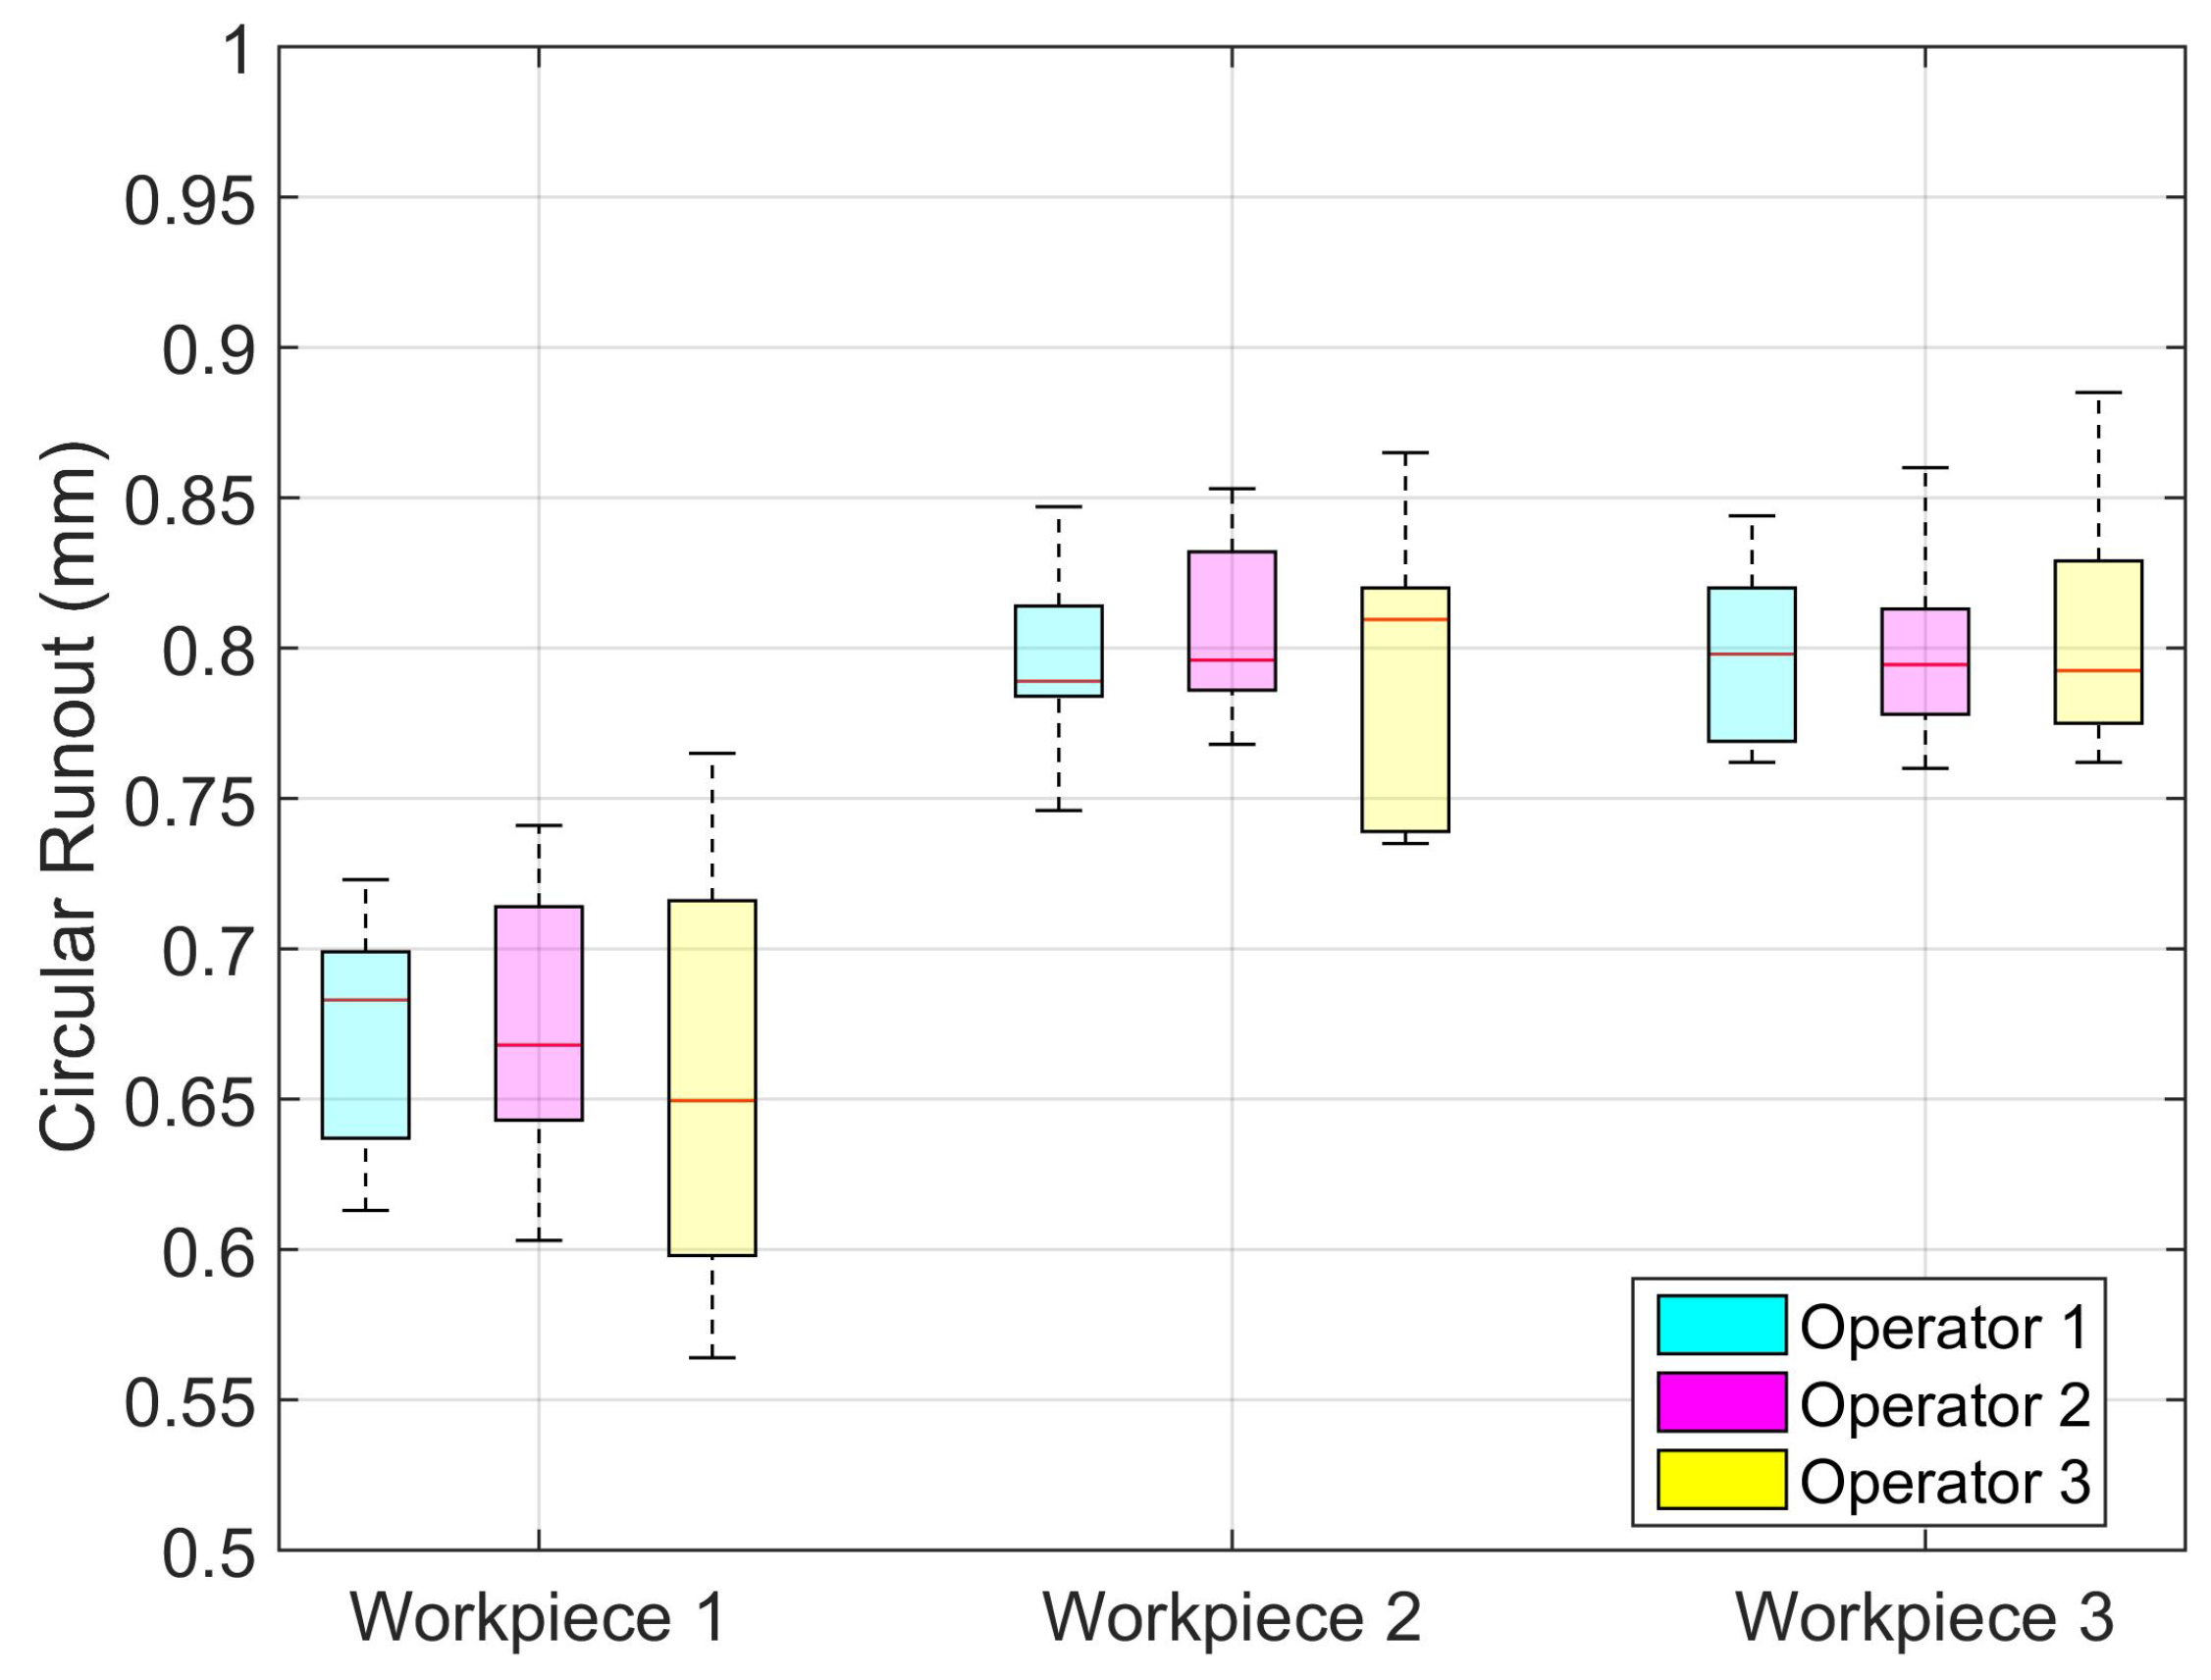
4.2. ANOVA Gauge Repeatability and Reproducibility (R&R) Test
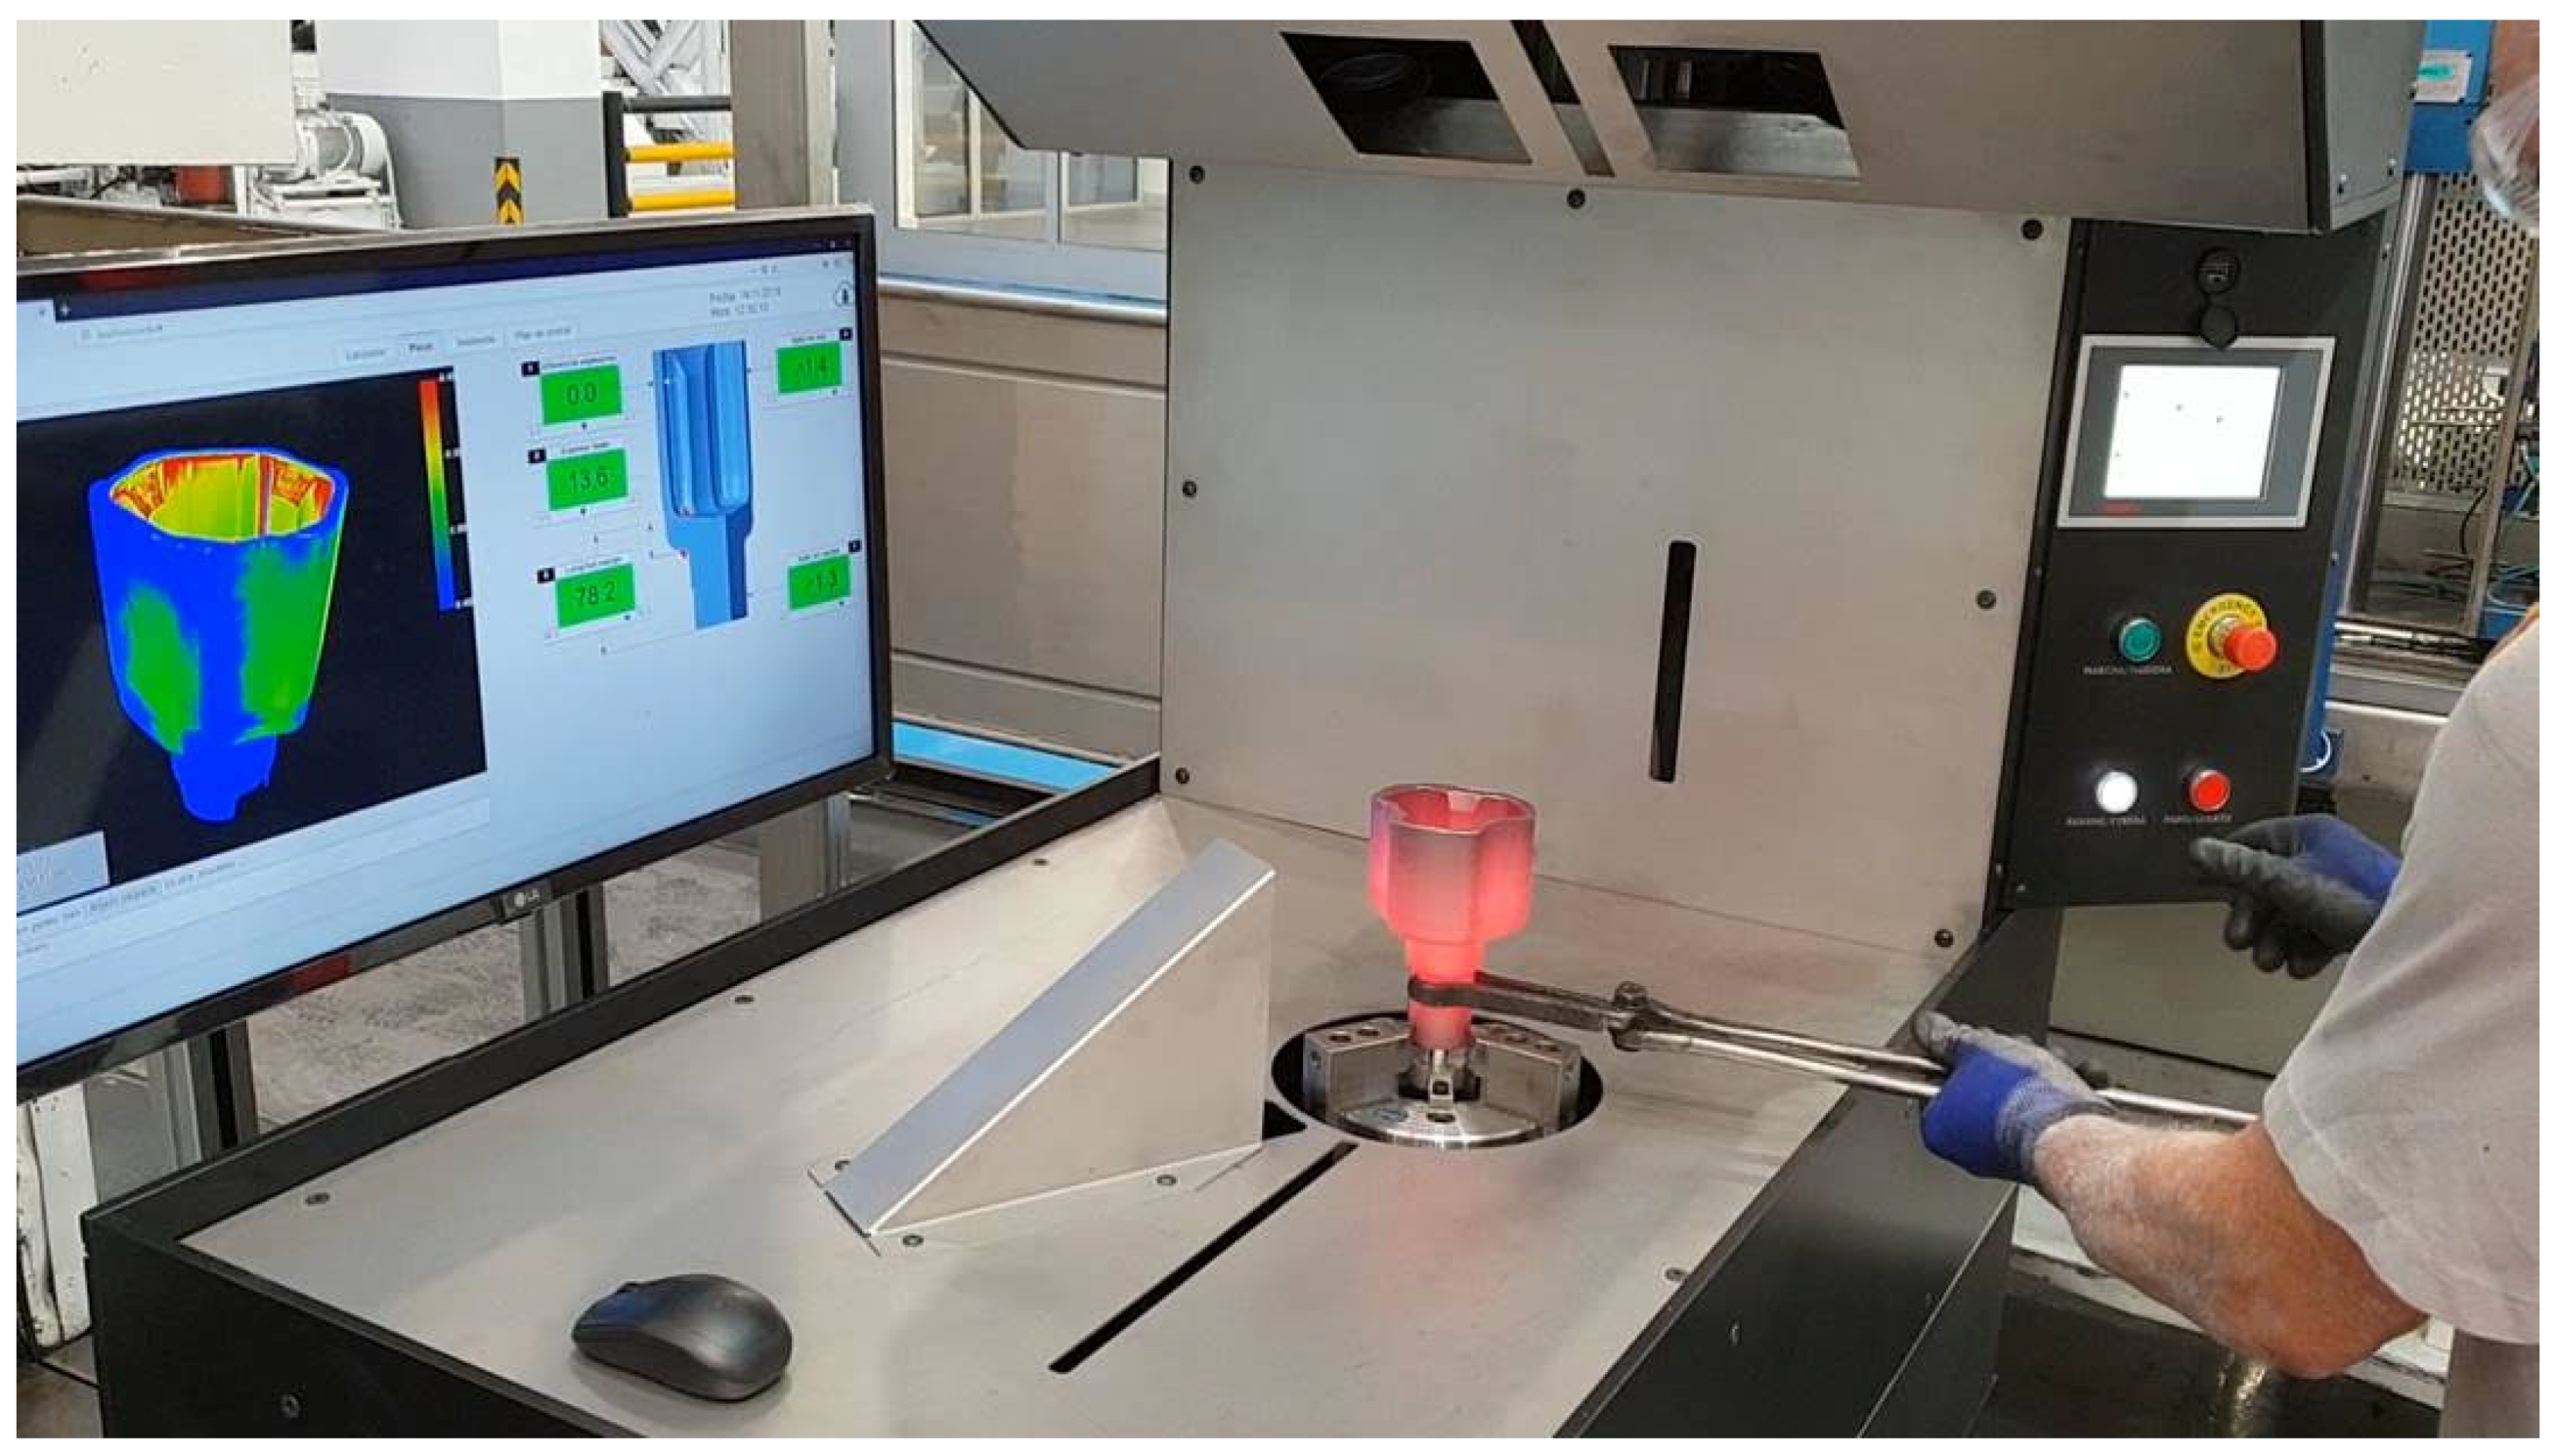
To assess the robustness of the implemented system, a prior-to-operation ANOVA Gauge R&R test is executed. The ANOVA test is performed with cold-state workpieces, which is outside of normal operations. The purpose of the test is to assess the precision (repeatability and reproducibility) of the system but not its accuracy (agreement with the real result). For the control testing, a = 3 different workpieces (Figure 11) are measured m = 10 times by b = 3 different operators, resulting in a sample of 90 measurements. Table 3 presents the measurement results of each experiment.
Table 4 shows the ANOVA results for the conducted experiments. The degrees of freedom (DOG) for each sum of squares are defined as:
DOG operator = b 1 = 2 DOG workpiece = a 1 = 2 DOG interaction = ( a 1 ) ( b 1 ) = 4 DOG vision _ system = a b ( m 1 ) = 81
The test shows that the variable Workpiece is statistically significant for the computed runout (p-value < 0.05). This means that our system can difference each workpiece from the others due to the inherent manufacturing process bias. On the other hand, the operator and the interaction (operator/workpiece) are not statistically significant (p-value > 0.05), which means that the operator is not a significant source of error for our measurement system (reproducibility).
Table 5 presents the Gauge Repeatability & Reproducibility (GRR) [34] results for the executed experiments. The variations induced by the different operators account only for the 0.04% of the total variance of the data, which is an indicator of the reproducibility (less variation equals to more reproducibility) of the developed system. Similarly, the variation introduced by the vision system accounts for the 22.07% of the total variance of the data, which is the indicator of the repeatability (less variation equals to more repeatability) of the system. The manufacturing process accounts for the rest of the variance (77.89%). The Gauge R&R (repeatability + reproducibility) accounts for the 22.11% of the total variance. Such Gauge Repeatability and Reproducibility (GRR) variation is acceptable for the warm forge plant in which the system is deployed (GRR < 25%), where the early detection of dimensional misfits in warm workpieces compensates for the precision loss of the measuring system.
Figure 12 presents a boxplot of the data collected in Table 3. Each box represents the 10 measurements taken by an operator. The central marker shows the median of the samples, the bottom and top edges of the box indicate the 25th and 75th percentiles, respectively. The whiskers are the maximum and minimum obtained runout values.
As previously discussed, the manufacturing process induces most of the variance in the form of workpieces with three different runouts (0.67 mm, 0.8 mm and 0.8 mm, respectively). On the other hand, the variance induced by each operator and our measuring system is less significant (largest standard deviation—0.06 mm—in workpiece 1, operator 3).

4.3. Deployment

The metrology system has been deployed in the shop floor of an automotive warm forge of motorcar stub axles, next to one of the press lines. The press line forges around 1200 workpieces per hour. As shown in Figure 13, in this initial setup an operator places manually the warm workpiece into the scanner directly from the press ramp. In the future this operation will be assumed by a robot arm to obtain higher measuring cadences.
To avoid damages to the optical equipment, all the devices are protected with a metal cover. The chassis has been mounted on a foam cushion layer to absorb the vibrations caused by the press.
The measurement software is connected to the Manufacturing Execution System (MES) of the factory. This integration allows automatic loading of the measurement program for the reference that is being manufactured, as well as other data, such as the manufacturing order, the operator name, etc. This data is stored in the report for each workpiece along with the calculated measurements for traceability purposes.
The implemented system automatically assesses the runout of the revolution-like workpieces in less than 60 s. Current measurements are performed with the warm workpiece at approximately 600 C. The system works as an early detection mechanism for manufacturing and process failures, mainly due to deviations between the forging punch axis and the forming matrix axis. The previous dimensional assessment mechanism (cold-state CMM) used to take only one measurement for every 400 fabricated parts (i.e., every 20 min). On the contrary, our system performs a measurement every 20 fabricated parts (i.e., every minute). Therefore, the system improves the previous measurement method by reducing the number of defective workpieces by around an estimated 95%.

4.4. Industry 4.0 and Visual Computing

The use of optical systems and visual computing technologies has become an important factor for the improvement of recently developed and classic manufacturing processes [6]. In the context of Industry 4.0, the deployed system improves the classic approaches for dimensional assessment in the warm-die forge industry as follows:
  • Our system performs measurements directly on warm workpieces. Such approach changes the classic scheme for dimensional assessment, which demands workpieces in cold state, limiting in-line metrology application in the warm-die and hot-die forge industry.
  • Thanks to Visual Computing and Industry 4.0 technologies, the developed system can perform fast dimensional measurements on warm workpieces. Over standard cold-state measurement methods, our measurement system reduces the time required to process a warm part by a factor of 95% (from 20 min to 1 min per part).
  • As already mentioned, the Visual Computing technologies provide a framework that allows deployment of the measurement system directly in the manufacturing line. Consequently, the efficiency of the process and product control highly increases as measurements and lines of action can be performed in-line.
  • The deployed system results are shown in a display using a web report tool with visual feedback about the dimensional quality of the measured workpiece. Thanks to the use of such web technologies [27], the report becomes available in real time to any computer of the factory and any member of the manufacturing plant, including operators, metrologists, and engineers.
  • The visual feedback provided by the visual computing techniques allows easier understanding and more intuitive dimensional assessment of scanned workpieces [9], in contrast to standard CMM numerical data.
  • The automation of the process, together with the high cadence of data acquisition and the aid of web reporting tools, enable a global perspective of the manufacturing process in the context of data analytics. However, such approach is out of scope of the current manuscript, and it is left for future work.

5. Conclusions

This manuscript presents the implementation and deployment of an optical system for automatic in-line dimensional inspection of revolution warm workpieces. The circular runout of warm-forged revolution workpieces is critical as a severe misalignment between the punch press and the forming matrix axes disables the posterior machining, resulting in a scrapped part. The system splits the inspection in two steps: (1) the dimensional assessment planning, performed only once by the metrologist, off-line the production, and (2) the in-line automated dimensional inspection. The developed system automatically assesses, in less than 60 s, the circular runout of the workpiece, whose temperature nears 600 C. Our prior-to-operation test results show that the measurements of the developed system for warm workpieces (27 C ≤ T ≤ 560 C) deviate less than 0.1 with respect to the standard CMM measurements of the cooled-down workpieces, for workpieces as long as 160 mm. In addition, the temperature-vs.-runout analysis shows no correlation between these two variables at such level of uncertainty. The measuring system repeatability and reproducibility (R&R) has been validated with an ANOVA test. This assessment of dimensions in warm workpieces fills a gap in processes in which the advantage of early detection of an inherent planning, design, or manufacturing error compensates for the disadvantage of precision loss due to the cooling of the workpiece.
Our system has been deployed by an automotive part manufacturer in a warm forming production line of stub axles, working as early detection of dimensional misfits. This early detection reduces the time needed to detect a defective part from 20 min to 1 min. Since the forge is a highly repetitive manufacturing process, when a defective part is found, all the pieces between the last correct part and the defective one are systematically scrapped. Thus, considering the production cadence, the number of parts that are scrapped each time a defective part is detected has been reduced from 400 to 20 ( 95 % ).
Future work concerns: (1) A warm-workpiece assessment method for data which are highly sensitive to cooling effects, which accounts for the heat loss effects on the workpiece geometry. (2) The integration of a robot arm for automatic placement of forged workpieces, to increase the measurement efficiency. (3) Metrological certification of the equipment by an ENAC accredited laboratory.

Author Contributions

D.M.-P. and J.R.S. conceptualized and implemented the Computational Geometry and Dimensional Inspection methodology. M.A. and A.I. designed, implemented and executed the system calibration and the Computer Vision system for data acquisition. E.G. and J.P. designed the methodology and experiments, and supervised the the Dimensional Inspection of warm-forge parts. O.R.-S. and J.P. supervised the Stochastic Computational Geometry aspects and applications of this research. All the authors contributed in the writing of this manuscript.

Funding

This research was partially supported by the Basque Government under the grant Basque Industry 4.0.

Acknowledgments

We want to thank our colleagues from Sariki Metrología S.A. whose knowledge of dimensional inspection has been very valuable during this research.

Conflicts of Interest

The authors declare no conflict of interest.

Abbreviations

The following abbreviations are used in this manuscript:
CMMCoordinate Measurement Machine.
ANOVAANalysis Of VAriance.
R&RRepeatability and Reproducibility.
FACEA connected region on a parametric surface in R 3 .
C Boundary representation (CAD model) of the reference geometry. C R 3 is a 2-manifold, represented as set of BODY, LUMPSs, FACEs, LOOPs, EDGEs, and VERTICES.
MTriangular mesh M = ( X , T ) of the scanned workpiece. X = { x 0 , x 1 , , n } and T = { t 0 , t 1 , , n } are the points (geometry) and triangles (topology) of the mesh, respectively. M R 3 is a 2-manifold.
ARevolution (datum) axis A = ( v , a 0 ) of the workpiece M. The vector v R 3 defines the direction of the axis and a 0 R 3 is a point lying on the axis.
Δ Φ Circular runout (mm) of the scanned workpiece M. Δ Φ 0 measures how much a cylindrical feature oscillates when rotated around the revolution axis A.
hHeight h > 0 (mm) where the circular runout Δ Φ is measured in the workpiece. This height is measured from a 0 , in the direction of v .
WReference coordinate system W = { w x , w y , w z ; p w } . W is the coordinate system of C and the coordinate system of M after mesh registration.
W M Coordinate system of M before mesh registration.
S E ( 3 ) Special Euclidean group. Group of all rigid transformations in R 3 . S E ( 3 ) is composed by all the possible rotation matrices and all possible translations in R 3 , i.e., S E ( 3 ) = S O ( 3 ) × R 3 .
T 0 Initial rigid transformation T 0 S E ( 3 ) that approximately maps W M to W.
T i c p Rigid transformation T i c p S E ( 3 ) that maps T 0 ( W M ) to W. T i c p is the result of registering the mesh M to the reference C .
T f Rigid transformation T f S E ( 3 ) that maps W M to W. T f = T i c p T 0 .
M b o r e Cylindrical surface M c y l i n d e r M whose axis vector is the revolution axis vector of the workpiece v .
M c o n e Conical surface M c o n e M used to compute the axis reference point a 0 .
C b o r e Subset of FACES C b o r e C which define a cylindrical surface in the CAD reference. These set of faces are used to extract M b o r e from M.
C c o n e Subset of FACES C c o n e C which define a conical surface in the CAD reference. These set of faces are used to extract M c o n e from M.
ε Distance threshold (mm) used to extract the mesh features M b o r e , M c o n e .
dDatum diameter d > 0 (mm). The point a 0 is located on the plane where the conical surface M c o n e attains the diameter d.
PCircular feature P M where the circular runout Δ Φ is measured with respect to A. P defines a polyline perpendicular to the axis A ( P A ).
T h Plane T h R 3 used to extract P from M. The plane T h has normal v and pivot point a 0 + h v .
TTemperature of the workpiece ( C ).
aNumber of workpieces for the ANOVA test.
bNumber of operators for the ANOVA test.
mNumber of measurements for the ANOVA test.

References

  1. Hawryluk, M.; Ziemba, J. Possibilities of application measurement techniques in hot die forging processes. Measurement 2017, 110, 284–295. [Google Scholar] [CrossRef]
  2. Gronostajski, Z.; Kaszuba, M.; Hawryluk, M.; Zwierzchowski, M. A review of the degradation mechanisms of the hot forging tools. Arch. Civ. Mech. Engi. 2014, 14, 528–539. [Google Scholar] [CrossRef]
  3. Hawryluk, M.; Gronostajski, Z.; Kaszuba, M.; Polak, S.; Widomski, P.; Ziemba, J.; Smolik, J. Application of selected surface engineering methods to improve the durability of tools used in precision forging. Int. J. Adv. Manuf. Technol. 2017, 93, 2183–2200. [Google Scholar] [CrossRef]
  4. International Organization for Standardization. ISO 1101:2017 Geometrical Product Specifications (GPS)—Geometrical Tolerancing—Tolerances of Form, Orientation, Location and Run-Out; Standard, International Organization for Standardization: Geneva, Switzerland, 2017. [Google Scholar]
  5. Hawryluk, M.; Ziemba, J.; Sadowski, P. A Review of Current and New Measurement Techniques Used in Hot Die Forging Processes. Meas. Control 2017, 50, 74–86. [Google Scholar] [CrossRef]
  6. Posada, J.; Toro, C.; Barandiaran, I.; Oyarzun, D.; Stricker, D.; de Amicis, R.; Pinto, E.B.; Eisert, P.; Döllner, J.; Vallarino, I. Visual Computing as a Key Enabling Technology for Industrie 4.0 and Industrial Internet. IEEE Comput. Graph. Appl. 2015, 35, 26–40. [Google Scholar] [CrossRef] [PubMed]
  7. Gapinski, B.; Wieczorowski, M.; Marciniak-Podsadna, L.; Dybala, B.; Ziolkowski, G. Comparison of Different Method of Measurement Geometry Using CMM, Optical Scanner and Computed Tomography 3D. Procedia Eng. 2014, 69, 255–262. [Google Scholar] [CrossRef] [Green Version]
  8. Henzold, G. 18—Inspection of Geometrical Deviations. In Geometrical Dimensioning and Tolerancing for Design, Manufacturing and Inspection, 2nd ed.; Butterworth-Heinemann: Oxford, UK, 2006; pp. 160–254. [Google Scholar] [CrossRef]
  9. Sánchez, J.R.; Segura, Á.; Barandiaran, I. Fast and accurate mesh registration applied to in-line dimensional inspection processes. Int. J. Interact. Des. Manuf. 2018, 12, 877–887. [Google Scholar] [CrossRef]
  10. Minetola, P. The importance of a correct alignment in contactless inspection of additive manufactured parts. Int. J. Precis. Eng. Manuf. 2012, 13, 211–218. [Google Scholar] [CrossRef] [Green Version]
  11. Shi, Q.; Xi, N. Automated data processing for a rapid 3D surface inspection system. In Proceedings of the 2008 IEEE International Conference on Robotics and Automation, Pasadena, CA, USA, 19–23 May 2008; pp. 3939–3944. [Google Scholar] [CrossRef]
  12. Zhu, L.; Barhak, J.; Srivatsan, V.; Katz, R. Efficient registration for precision inspection of free-form surfaces. Int. J. Adv. Manuf. Technol. 2007, 32, 505–515. [Google Scholar] [CrossRef]
  13. Gronostajski, Z.; Hawryluk, M.; Kaszuba, M.; Widomski, P.; Ziemba, J. Application of the reverse 3D scanning method to evaluate the wear of forging tools divided on two selected areas. Int. J. Autom. Technol. 2017, 18, 653–662. [Google Scholar] [CrossRef]
  14. Hawryluk, M.; Ziemba, J. Application of the 3D reverse scanning method in the analysis of tool wear and forging defects. Measurement 2018, 128, 204–213. [Google Scholar] [CrossRef]
  15. Jung, K.H.; Lee, S.; Kim, Y.B.; Ahn, B.; Kim, E.Z.; Lee, G.A. Assessment of ZK60A magnesium billets for forging depending on casting methods by upsetting and tomography. J. Mech. Sci. Technol. 2013, 27, 3149–3153. [Google Scholar] [CrossRef]
  16. D’Annibale, A.; Ilio, A.D.; Trozzi, M.; Bonaventura, L. The Use of Infrared Thermography for Maintenance Purposes in the Production Process of Components for Automotive Alternators. Procedia CIRP 2015, 38, 143–146. [Google Scholar] [CrossRef] [Green Version]
  17. Fendt, K.T.; Mooshofer, H.; Rupitsch, S.J.; Ermert, H. Ultrasonic Defect Characterization in Heavy Rotor Forgings by Means of the Synthetic Aperture Focusing Technique and Optimization Methods. IEEE Trans. Ultrason. Ferroelectr. Freq. Control 2016, 63, 874–885. [Google Scholar] [CrossRef]
  18. Reddy, K.A. Non-Destructive Testing, Evaluation Of Stainless Steel Materials. Mater. Today Proc. 2017, 4, 7302–7312. [Google Scholar] [CrossRef]
  19. Dworkin, S.; Nye, T. Image processing for machine vision measurement of hot formed parts. J. Mater. Process. Technol. 2006, 174, 1–6. [Google Scholar] [CrossRef]
  20. Jia, Z.; Wang, B.; Liu, W.; Sun, Y. An improved image acquiring method for machine vision measurement of hot formed parts. J. Mater. Process. Technol. 2010, 210, 267–271. [Google Scholar] [CrossRef]
  21. Zhang, Y.-C.; Han, J.-X.; Fu, X.-B.; Zhang, F.-L. Measurement and control technology of the size for large hot forgings. Measurement 2014, 49, 52–59. [Google Scholar] [CrossRef]
  22. Du, Y.D. Simple three-dimensional laser radar measuring method and model reconstruction for hot heavy forgings. Opt. Eng. 2012, 51, 021118. [Google Scholar] [CrossRef]
  23. Du, Z.; Wu, Z.; Yang, J. 3D measuring and segmentation method for hot heavy forging. Measurement 2016, 85, 43–53. [Google Scholar] [CrossRef]
  24. Liu, W.; Jia, Z.; Wang, F.; Ma, X.; Wang, W.; Jia, X.; Song, D. An improved online dimensional measurement method of large hot cylindrical forging. Measurement 2012, 45, 2041–2051. [Google Scholar] [CrossRef]
  25. Molleda, J.; Usamentiaga, R.; García, D.F.; Bulnes, F.G. Real-time flatness inspection of rolled products based on optical laser triangulation and three-dimensional surface reconstruction. J. Electron. Imaging 2010, 19, 031206. [Google Scholar] [CrossRef] [Green Version]
  26. Babu, M.; Franciosa, P.; Ceglarek, D. Adaptive Measurement and Modelling Methodology for In-line 3D Surface Metrology Scanners. Procedia CIRP 2017, 60, 26–31. [Google Scholar] [CrossRef]
  27. Mejia, D.; Sánchez, J.R.; Segura, A.; Ruiz-Salguero, O.; Posada, J.; Cadavid, C. Mesh Segmentation and Texture Mapping for Dimensional Inspection in Web3D. In Proceedings of the 22nd International Conference on 3D Web Technology (Web3D ’17), Brisbane, Queensland, Australia, 5–7 June 2017; ACM: New York, NY, USA, 2017; pp. 3:1–3:4. [Google Scholar] [CrossRef]
  28. Horn, B.K.P. Closed-form solution of absolute orientation using unit quaternions. J. Opt. Soc. Am. A 1987, 4, 629–642. [Google Scholar] [CrossRef]
  29. Sun, C.; Liu, H.; Jia, M.; Chen, S. Review of Calibration Methods for Scheimpflug Camera. J. Sens. 2018, 2018, 3901431. [Google Scholar] [CrossRef] [PubMed]
  30. Steger, C.; Ulrich, M.; Wiedemann, C. Machine Vision Algorithms and Applications, 2nd ed.; Wiley-VCH: Weinheim, Germany, 2017. [Google Scholar]
  31. Hartley, R.I.; Zisserman, A. Multiple View Geometry in Computer Vision, 2nd ed.; Cambridge University Press: Cambridge, UK, 2004; ISBN 0521540518. [Google Scholar]
  32. Besl, P.J.; McKay, N.D. A method for registration of 3-D shapes. IEEE Trans. Pattern Anal. Mach. Intell. 1992, 14, 239–256. [Google Scholar] [CrossRef]
  33. Rusu, R.B.; Cousins, S. 3D is here: Point Cloud Library (PCL). In Proceedings of the 2011 IEEE International Conference on Robotics and Automation, Shanghai, China, 9–13 May 2011; pp. 1–4. [Google Scholar] [CrossRef]
  34. McNeese, B. ANOVA GAGE R&R—Part 2. 2012. Available online: https://www.spcforexcel.com/knowledge/measurement-systems-analysis/anova-gage-rr-part-2 (accessed on 4 February 2019).
Figure 1. Workflow of the reverse engineering system for dimensional inspection. The system provides the dimensional inspection results to the operator directly in the production line.
Applsci 09 01069 g001
Figure 2. User-assisted alignment of correspondences [28]. The metrologist selects 3 corresponding points in both the CAD (orange) and a scanned mesh (gray). (a) CAD reference and its coordinate system W; (b) Scanned mesh and its coordinate system W M ; (c) Alignment of corresponding points [28].
Applsci 09 01069 g002
Figure 3. Cylindrical C b o r e (blue) and conical C c o n e (red) features on the CAD reference used to compute the revolution axis A (green). (a) CAD features C b o r e , C c o n e and A; (b) Reference axis point a 0 defined where C c o n e achieves an specific diameter d.
Applsci 09 01069 g003
Figure 4. Setup of the 3D optical system designed to digitize the warm workpiece.
Applsci 09 01069 g004
Figure 5. Front and top views of the calibration object geometry.
Applsci 09 01069 g005
Figure 6. Deviations (mm) after calibration in a cross-section of the scanned pattern (purple), through the X Z plane.
Applsci 09 01069 g006
Figure 7. Mesh registration results. The colormap shows the signed distance from the scanned mesh M to the CAD model C . (a) Initial guess from np-align (Figure 2c); (b) Iterative Closest Point (ICP) mesh registration.
Applsci 09 01069 g007
Figure 8. Computation of the reference point a 0 on C c o n e . (a) Mesh-cylinder intersection; (b) Plane-axis intersection.
Applsci 09 01069 g008
Figure 9. Calculation of the workpiece runout Δ Φ regarding the revolution axis A. Δ Φ = r l a r g e r s m a l l . (a) Runout plane T h perpendicular to the revolution axis A; (b) The runout plane T h is defined at a height h from the reference point a 0 ; (c) r s m a l l and r l a r g e radii computed at the plane T h .
Applsci 09 01069 g009
Figure 10. Measurements of 2 warm workpieces until cool-down (27 C≤ T ≤ 560 C). Results of our measurement system (blue line) do not deviate more than 0.1 mm from Coordinate Measurement Machine (CMM) measurements (red line). (a) Workpiece 1. CMM runout = 0.66 mm; (b) Workpiece 2. CMM runout = 0.8 mm.
Applsci 09 01069 g010
Figure 11. Cold workpieces used to run the ANOVA R&R test. The three workpieces share the same CAD reference.
Applsci 09 01069 g011
Figure 12. Boxplot of the runout measurements presented in Table 3.
Applsci 09 01069 g012
Figure 13. Deployment of the optical system into the production line of warm forming of motorcar stub axles. The temperature of the workpiece is approximately 600 C.
Applsci 09 01069 g013
Table 1. Comparison between standard contact-based Coordinate Measurement Machines (CMMs) vs optical scanners for dimensional assessment.
CMMOptical Scanner
Highly accurate measurements [5].Less-accurate measurements [5].
Data collection relying on probe vs. piece contact.Contact probe vs. piece not required.
Technician assistance required for definition of piece feature coordinate systems [8].Technician assistant required for point sample vs. B-Rep (i.e., CAD model) registration [9,10].
Time-consuming data acquisition protocol [8].Real-time data acquisition and post-processing of the digitized mesh (triangulation, mesh registration, feature extraction) [11,12].
Inherently sparse point samples, conducted according to discrete trajectories. Analytic form fitting needed as a consequence [8].Dense point samples. Both mesh computation and analytic form fitting possible [9].
Competing equipment precision at the cost of off-line measurements [3].Accurate measurement systems for in-line dimensional assessment [3].
Requires specific clamps for each reference model, introducing additional complexity in the management of measuring resources.Allows the use of fixed universal setups for many different workpiece references.
Table 2. Properties of the laser line projectors used to irradiate the warm workpiece surface.
PropertyValue
Power20 mW
Wavelength450 nm
Table 3. Runout results (mm) of our system for 3 different cold workpieces (Figure 11), measured 10 times by 3 different operators.
Workpiece 1Workpiece 2Workpiece 3
Op 1Op. 2Op. 3Op. 1Op. 2Op. 3Op. 1Op. 2Op. 3
Msh 10.710.600.770.780.820.740.790.840.89
Msh 20.630.710.720.790.850.870.770.810.81
Msh 30.640.610.650.810.790.820.800.790.83
Msh 40.700.650.560.790.800.800.770.800.77
Msh 50.650.740.650.790.830.740.790.860.78
Msh 60.690.680.600.840.840.830.820.760.85
Msh 70.680.670.670.850.800.820.840.770.80
Msh 80.700.740.720.750.800.810.760.780.76
Msh 90.610.670.650.810.780.740.820.810.78
Msh 100.720.640.580.750.770.810.840.790.79
Mean0.670.670.660.800.810.800.800.800.80
Std. Dev.0.030.040.060.030.030.040.030.030.04
Max-Min0.110.140.200.100.090.130.080.100.12
Table 4. Analysis of Variance (ANOVA) table.
Source of VariabilityDegrees of FreedomSum of SquaresMean SquareF Statisticp-Value
Operator20.00100.00051.22820.3838
Workpiece20.35750.1787438.59640.0000
Interaction40.00160.00040.24190.9137
Vision System810.13640.0017
Total890.4966
Table 5. Gauge Repeatability and Reproducibility (GRR) table.
SourceVariance% of Total Variance
Operators (Reproducibility)0.00000.04%
Vision System (Repeatability)0.001722.07%
Gauge R&R (GRR)0.001722.11%
Interaction0.00000.00%
Workpieces0.005977.89%
Total0.0076100.00%

