Enhancing Wind Energy Harvesting Using Passive Turbulence Control Devices


1
School of Chemical Engineering and Energy, Zhengzhou University, Zhengzhou 450000, China
2
School of Aeronautics, Northwestern Polytechnical University, Xi’an 710072, China
3
Department of Automation, Lublin University of Technology, Nadbystrzycka 36, PL-20-618 Lublin, Poland
*
Author to whom correspondence should be addressed.
Appl. Sci. 2019, 9(5), 998; https://doi.org/10.3390/app9050998
Submission received: 31 January 2019
/
Revised: 3 March 2019
/
Accepted: 6 March 2019
/
Published: 10 March 2019
(This article belongs to the Special Issue State-of-the-Art of Techniques, Devices and Electronic Circuits for Energy Harvesting)
Abstract
:Aiming to predict the performance of galloping piezoelectric energy harvesters, a theoretical model is established and verified by experiments. The relative error between the model and experimental results is 5.3%. In addition, the present model is used to study the AC output characteristics of the piezoelectric energy harvesting system under passive turbulence control (PTC), and the influence of load resistance on the critical wind speed, displacement, and output power under both strong and weak coupling are analyzed from the perspective of electromechanical coupling strength, respectively. The results show that the critical wind speed initially increases and then decreases with increasing load resistance. For weak and critical coupling cases, the output power firstly increases and then decreases with the increase of the load resistance, and reaches the maximum value at the optimal load. For the weak, critical, and strong coupling cases, the critical optimal load is 1.1 MΩ, 1.1 MΩ, and 3.0 MΩ, respectively. Overall, the response mechanism of the presented harvester is revealed.
1. Introduction
In recent years, micro-electromechanical systems (MEMS) and wireless sensor networks (WSNs) have been developed rapidly in the industrial field. Traditional batteries for powering the above devices have some disadvantages. For example, they have a limited lifespan and are difficult to be replaced in some application areas. The technique of harvesting energy from environmental vibrations can effectively provide an energy supplement for MEMS and WSNs [1,2,3,4,5]. In addition, advanced nonlinear systems were invented to enhance broadband energy harvesting [6,7,8,9,10]. In ambient environments, fluid kinetic energy has the advantages of being renewable and clean, such as wind and water energy, can be efficiently harvested [11,12,13,14,15], and has sufficient potential for energy conversion [16,17,18,19,20].
In particular, wind energy harvesting technology, based on different physical mechanisms to excite nonlinear resonators, has been developed rapidly [21,22,23,24,25]. Liu et al. [26] presented a comprehensive review of state-of-the-art piezoelectric energy harvesting (PEH). Various key aspects to improve the overall performance of a PEH device are discussed in detail. Joseph et al. [27] established the possibility of utilizing energy harvesting from mechanical vibrations to estimate extreme value responses of the host structure, and indicated that vibration energy harvesting, in its own right, has the potential to be used for extreme value analysis and estimates. Furthermore, this work is applied to health monitoring and assessment, and to the impact of exposure to the natural environment throughout its life cycle. Piezoelectric or electromagnetic transducers attached to the resonators can convert the kinetic energy of wind into useful electric energy. It can work in hostile environments, which overcomes the limitations of large wind installations. A wide band vibrating piezoelectric energy harvester with adjustable frequency was presented by Yang and Zhang [28]. The working frequency of the piezoelectric energy harvester could be adjusted by a rotating joint beam. Their results showed that a multi-beam system broadened the working frequency range of the harvester and improved the energy harvesting efficiency. Ibrahim et al. [29] designed a turbine using the double multi-flow tube algorithm in QBlade software, which can harness 200 W output power at 0.582 m/s water velocity with a 5.5 m2 swept area. Zhang et al. [30] studied the influence of the spring-damped rectangular cylinder on the cross-sectional aspect ratio of a shark fin and the hydrokinetic energy conversion by a numerical method, with results indicating that the converted power shows an increasing trend. As the aspect ratio decreased from 2 to ¼, the maximum Flow Induced Motion (FIM) energy conversion efficiency also accordingly increased to 15.5%. Hu et al. [31,32] studied the performance of a cylinder galloping piezoelectric energy harvester with two small rod-shaped accessories installed on the main cylinder through experiments. The rod sections were round, triangular, and square. The results showed that by attaching these three rod types at the circumferential locations of 45° and 60°, power could be harvested continuously beyond the critical wind speed and was dramatically superior over both the plain circular cylinder and the cases with other attachment locations. In addition, they measured aerodynamic force coefficients and found that the circular cylinder with triangular rods at the location of 60° had larger transverse force coefficients than the other two rod type cases. Bernitsas et al. [33,34] discussed the basic concepts of Vortex Induced Vibration Aquatic Clean Energy (VIVACE) converters and gave the design of physical models and laboratory prototypes. Based on this, a mathematical model was established and the design parameters of various application scales were calculated. Sun et al. [35] experimentally studied a kind of nonlinear harvester and tested the energy conversion efficiency of fluid dynamics under passive turbulence control when the Reynolds number was 30,000 ≤ Re ≤ 120,000. Results showed that the utilized power increased with the increase of nonlinearity at low flow velocity. He et al. [36] tested a new type of wind energy harvester. Results showed that the effective wind speed region was integrated with the galloping wind speed region, forming a single region with a high-power output of the harvester. Mutsuda et al. [37] developed a highly flexible galloping piezoelectric energy harvester and optimized the design of the whole system by considering aspect ratio, support system, initial tension, and other factors. Chang et al. [38] studied the effects of roughness location and surface coverage on vibration by the passive turbulence control (PTC) method with surface roughness selective distribution, and the range of Re was 3.0 × 10⁴ < Re < 1.2 × 10⁵. The results showed that 16° roughness coverage is effective in the range inducing the reduced vortex-induced vibration (VIV), enhanced VIV, or galloping.
Yan et al. [39] theoretically studied a galloping energy harvester with a bluff body of the triangular cross-section using the quasi-steady state approximation method to model the aerodynamic load. They concluded that the maximum power was obtained when the lateral displacement was the smallest with the change in load resistance. On the other hand, Mutsuda and Tabesh et al. [40,41] established a quasi-steady state vibration model of a piezoelectric cantilever beam under the condition of small deflection vibration. In addition, they applied the frequency domain analysis method to solve the electromechanical coupling equation by Laplace transform (for a linear system), and put forward the concepts of electric damping and electric stiffness. Barrero et al. [42] studied the influence of different cross-section shapes and mechanical parameters of the harvester on the energy harvesting efficiency by establishing a single-degree-of-freedom (SDOF) model, and they theoretically analyzed the potential possibility of galloping energy harvesting. Wang et al. [43,44,45] solved a fluid–mechanical–electrical coupling model of flow-induced vibration energy harvesting systems using a concentrated parameter method and the quasi-steady state theory. Ramasur and Sirohi [46,47] developed a harvester in which an equilateral triangular cross-section of the resistive fluid is connected to two piezoelectric cantilevers. When the wind speed is 4.92 m/s, the maximum power can reach 53 mW. Zhao and Dai et al. [48,49,50] used wind tunnel experiment tests and circuit simulations to derive explicitly the analytical solution of steady-state mechanical and electrical responses of galloping-based energy harvesters with the synchronized switch harvesting on inductor (SSHI) interface. However, the above research of vibration energy harvesting mostly uses a pure resistive load circuit and seldom involves high strength electromechanical coupling of complex nonlinear load circuits. In many cases, strong and weak coupling exist side by side, such as in AC circuits, high-speed motors, elevators, wireless sensors, and some high-strength detection devices. Energy harvesting technologies can be used in conjunction with working sensors or other microelectronic devices. Recently, some researchers have explored the strong and weak coupling effects based on galloping energy harvesting. Liao et al. [51] analyzed the maximum output power of a piezoelectric energy harvester. They proposed that the total power limit could be obtained by tuning the energy harvesting circuit, and they defined three different types of coupling strength by analyzing the closed expression between the mechanical damping and the effective electromechanical coupling coefficient. Shu and Lien [52] studied the optimal output power of system rectifier piezoelectric devices. They proposed design guidelines for devices with a large coupling coefficient and quality factor. In addition, Renno et al. [53] studied the maximum possible power of the harvester with an R-L (resistive load and inductor) circuit interface. Liang and Liao [54] experimentally studied the output power of the harvester under base excitations, which was 200% higher than that with a standard circuit.
In this paper, the behavior of galloping piezoelectric energy harvesters with two 60° PTC structures (GEH-PTC) is experimentally and theoretically studied. A theoretical model is provided. This model is used to analyze the energy harvesting efficiency of the harvester under the condition of strong and weak coupling load circuits, and the response of amplitude, power, and bandwidth. The analysis and verification of the models are established. In addition, the performance of the two energy harvesters are compared. Furthermore, the paper analyzes the influence of wind speed and external load on the performance of the GEH-PTC under the strong and weak coupling condition.
2. Physical Mathematical Model
2.1. Physical and Mathematical Model
Galloping vibration can be a kind of bending vibration of the cantilever-based structure caused by the self-excitation of airflows [55,56,57,58,59]. For the VIV vibration transforming the galloping vibration, Hu et al. [31,32] studied the influence of attached rods with cross-sections and equipping angles on the transformation from vortex-induced vibration to galloping vibration, and they explored the influence of attack angle on transverse force coefficients. Inspired by Hu et al. [31,32], Bernitsas et al. [33,34], and our previous study [13], the physical model in our paper uses quite a different structure called a Passive Turbulence Control (PTC) device, which is made of sanding belts with very coarse surface. In addition, this paper focuses on the influence of different electrical circuits components, including electromechanical coupling strengths, wind speeds, and load resistances on the performance of the harvester.
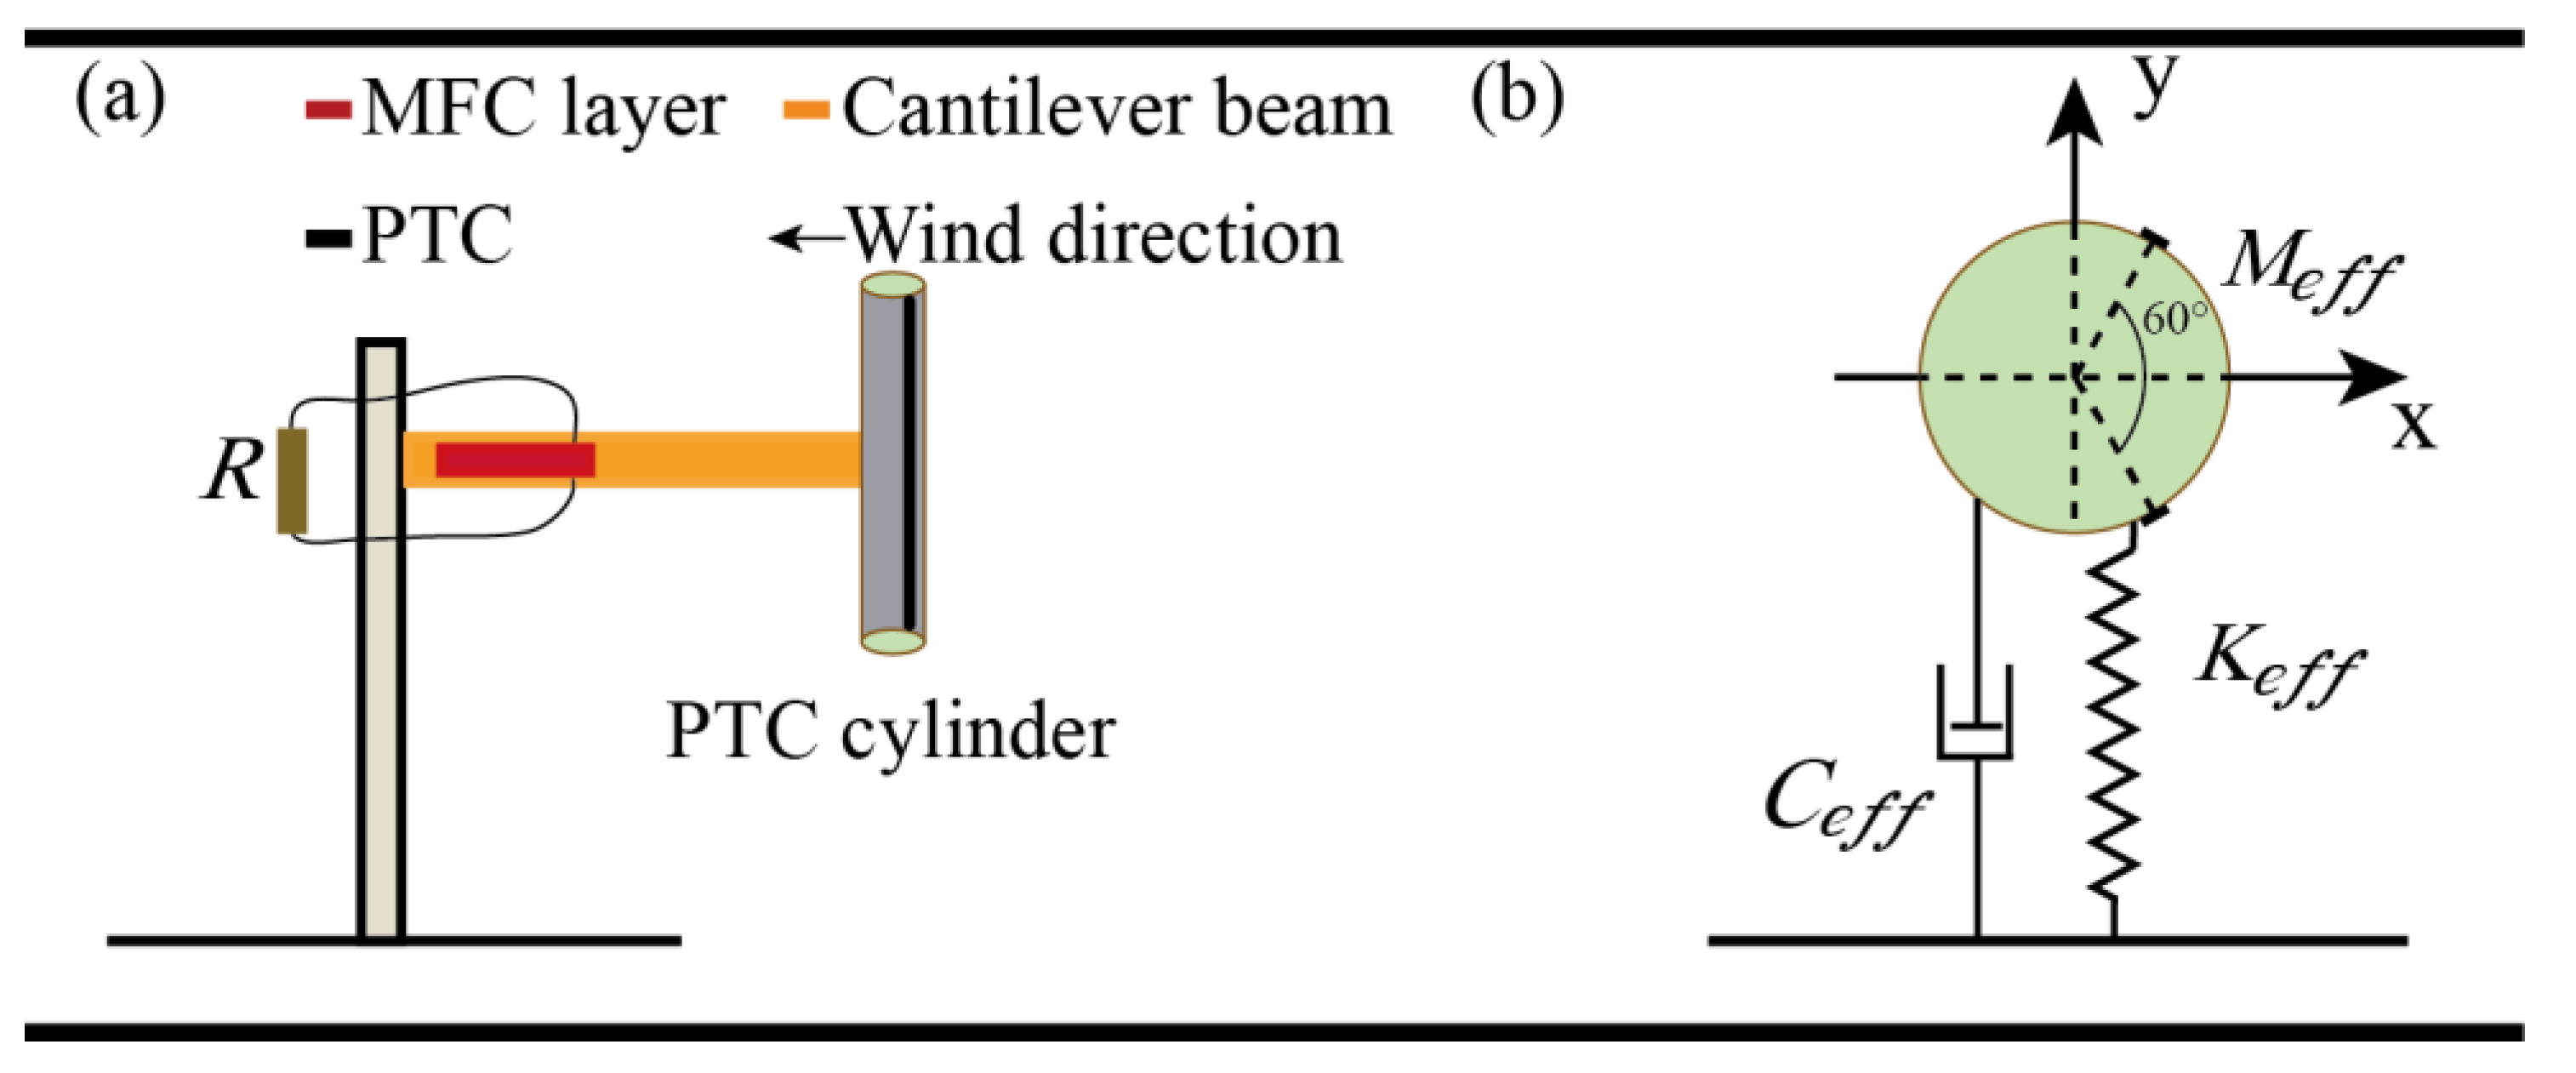
Considering a curved section structure mounted on a flexible support, the surface along the axial direction of 60° is symmetrical with two belts (to induce turbulence conditions for PTC). A previous study has proved that 60° Y-shaped attachments can arouse galloping phenomenon [13] and VIV is caused by the vortex shedding effect, while resonance occurs when the vortex shedding frequency is close to the natural frequency of the vibratory system. In other words, VIV is mainly caused by the vortex shedding effect. Equipping a Passive Turbulence Control (PTC) device on the bluff body can affect the formation of the vortex street behind the bluff body, and different flow-induced motions (FIM) can be observed depending primarily on the circumferential location of the two strips [60,61]. Furthermore, galloping can be aroused when a negative nonlinear aerodynamic damping appears for the equipment of the PTC in this work. In this study, two compact belts are designed to assist the passive turbulence control to improve the performance of the wind energy harvester, as shown in Figure 1. As shown in Figure 1a, wind speed U is perpendicular to the cylindrical section. Based on the Euler-Bernoulli beam theory, Kirchhoff’s law, piezoelectric effect, and galloping self-induced vibration, the aero-electromechanical coupling model of the energy harvester is able to be obtained in a distributed parameter model, which can be included into a lumped parameter model form [13,62]. The structure shown in Figure 1a is simplified to an equivalent Single-degree-of-freedom (SDOF) mass-damping-spring (M-C-K) model in Figure 1b. The cantilever beam is equivalent to a spring oscillator, and α is the angle of attack. Therefore, the governing equations can be expressed as:
The three expressions in Equations (4)–(6) represent weak coupling, critical coupling, and strong coupling, respectively. Assuming that the wind speed remains constant, under quasi-static conditions, Fy(t) can be expressed as [63].
where ρ is the air density. S is the area of the bluff body perpendicular to the wind direction, U is the wind speed, ai is the empirical coefficient related to the shape of the bluff body section. is the aerodynamic coefficient, it is expressed as , where . The galloping stability of the system depends on whether the aerodynamic coefficient and angle of attack are in the same direction. The vibration is stable [64] when . Combining Equations (1) and (7), then Equation (1) can be rewritten as:
For i = 1, the damping term of the system is Ceff − 1/2a1ρSU, and the damping term is linear. For i > 1, the damping term exists in a nonlinear form. Supposing the critical wind speed of the bluff body is Ucr. When U < Ucr, the damping term is Ceff − 1/2a1ρSU > 0, the nonlinear term can be neglected, at this time the damping term inhibits the vibration of the bluff body. Critical wind speed Ucr is expressed as [56]:
where R and N are load resistance and ideal transformer ratio, respectively. R1 is the equivalent component resistance. As wind speed increases, the bluff body begins to vibrate when U = Ucr, and the damping term becomes negative. At this time, the nonlinear damping term starts to maintain the vibration of the bluff body. For a complex alternating circuit, the critical wind speed of the GEH-PTC can be determined by circuit simulation. Taking into account the rotation of the bluff body, the revised aerodynamic coefficient is given as:
where the angle of attack is (). The coefficient of the rotation angle and the lateral displacement at the free end of the cantilever beam is (L is the length of the free segment of the cantilever beam) [65].
2.2. Solution and Verification of the Model
The influence of the load at the interface of the circuit on the natural frequency, the system damping and the critical wind speed of the harvester can be determined by linear analysis of electromechanical coupling problems. The following state variables are introduced:
Therefore, the matrix form of Equations (1) and (2) can be expressed as:
MATLAB program solver “ODE45.m” was used to obtain the analytical solution of Equations (9) and (12). The aerodynamic parameters and the fitting results of linear and nonlinear coefficients a1 and a3 in the matrix equation are shown in Table 1. Positive nonlinear mechanical damping is introduced into the harvester. The amplitude is self-limited, so that the harvester undergoes steady-state limit cycle oscillation at each wind speed.
In addition, the resistance value ranges from 100 KΩ to 10 MΩ. The electromechanical coupling coefficient is θ = 2.0 × 10⁻⁵ N·V−1. The piezoelectric plates are made of fiber MFC (Macro Fiber Composite). Capacitance is Cp = 15.7 nF. The other values of the relevant parameters are listed in Table 2.
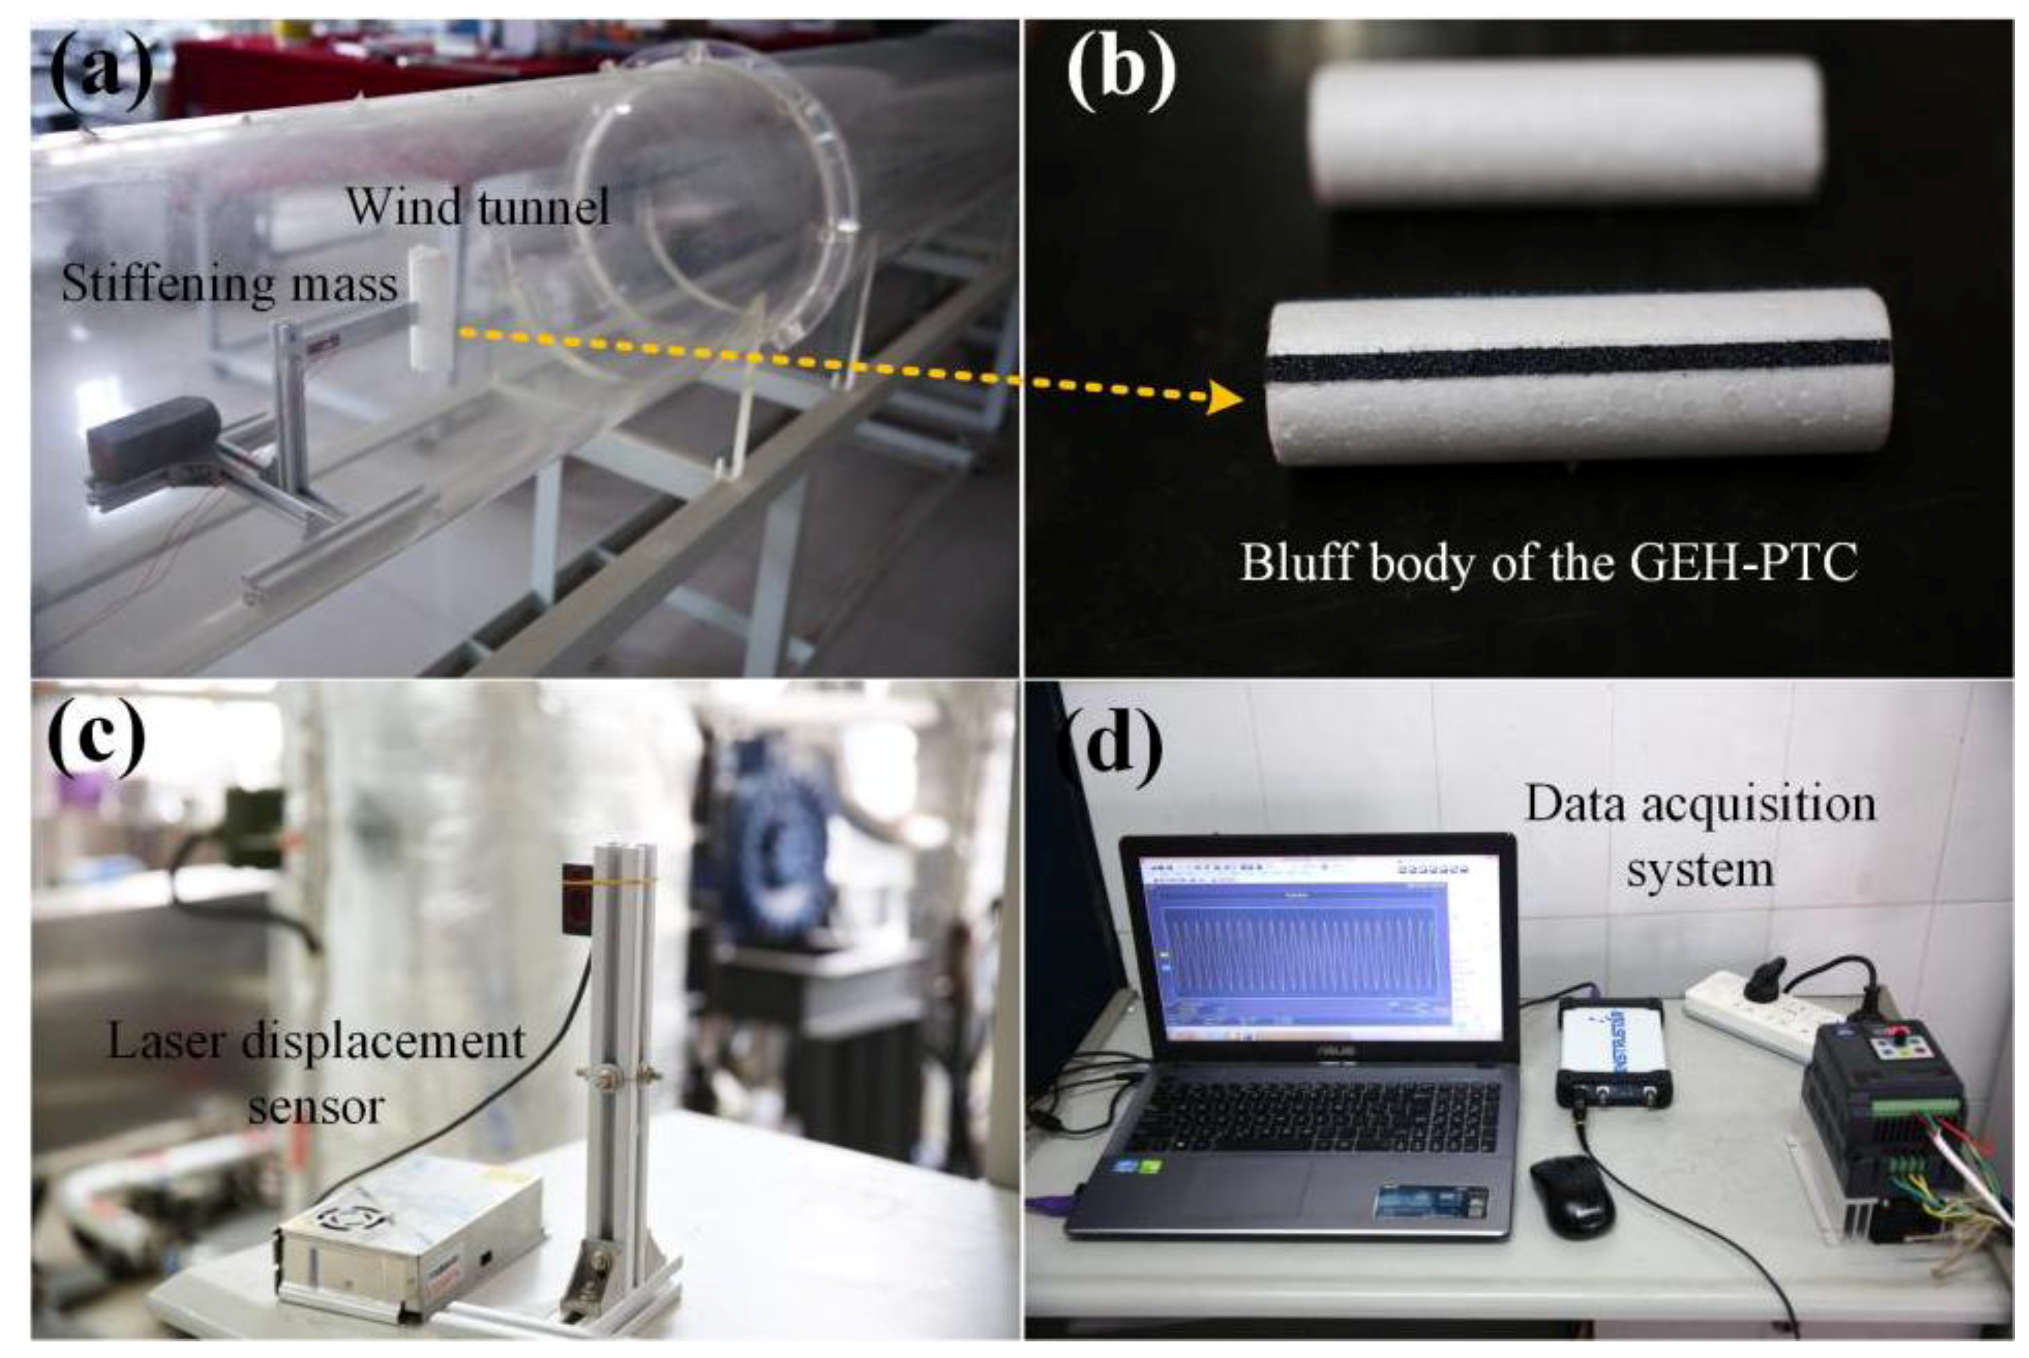
In order to verify the theoretical model of the harvester, a T-shaped device was designed, as show in Figure 2. The device was installed in a circular wind tunnel with a diameter of 400 mm and was connected to a linear resistance load with wires. The honeycomb region in the middle of the wind tunnel is the stable wind section. The piezoelectric plate was 35 × 10 × 0.3 mm3 in size and was placed on the top of the aluminum cantilever beam. The width of the PTC was 3 mm and the length was the same as the bluff body. Simple harmonics produced by the bluff body can be captured by a digital oscilloscope (ISDS220B) and the vibration is measured by a laser sensor (Panasonic, hg-c1400, Kadoma shi, Japan).
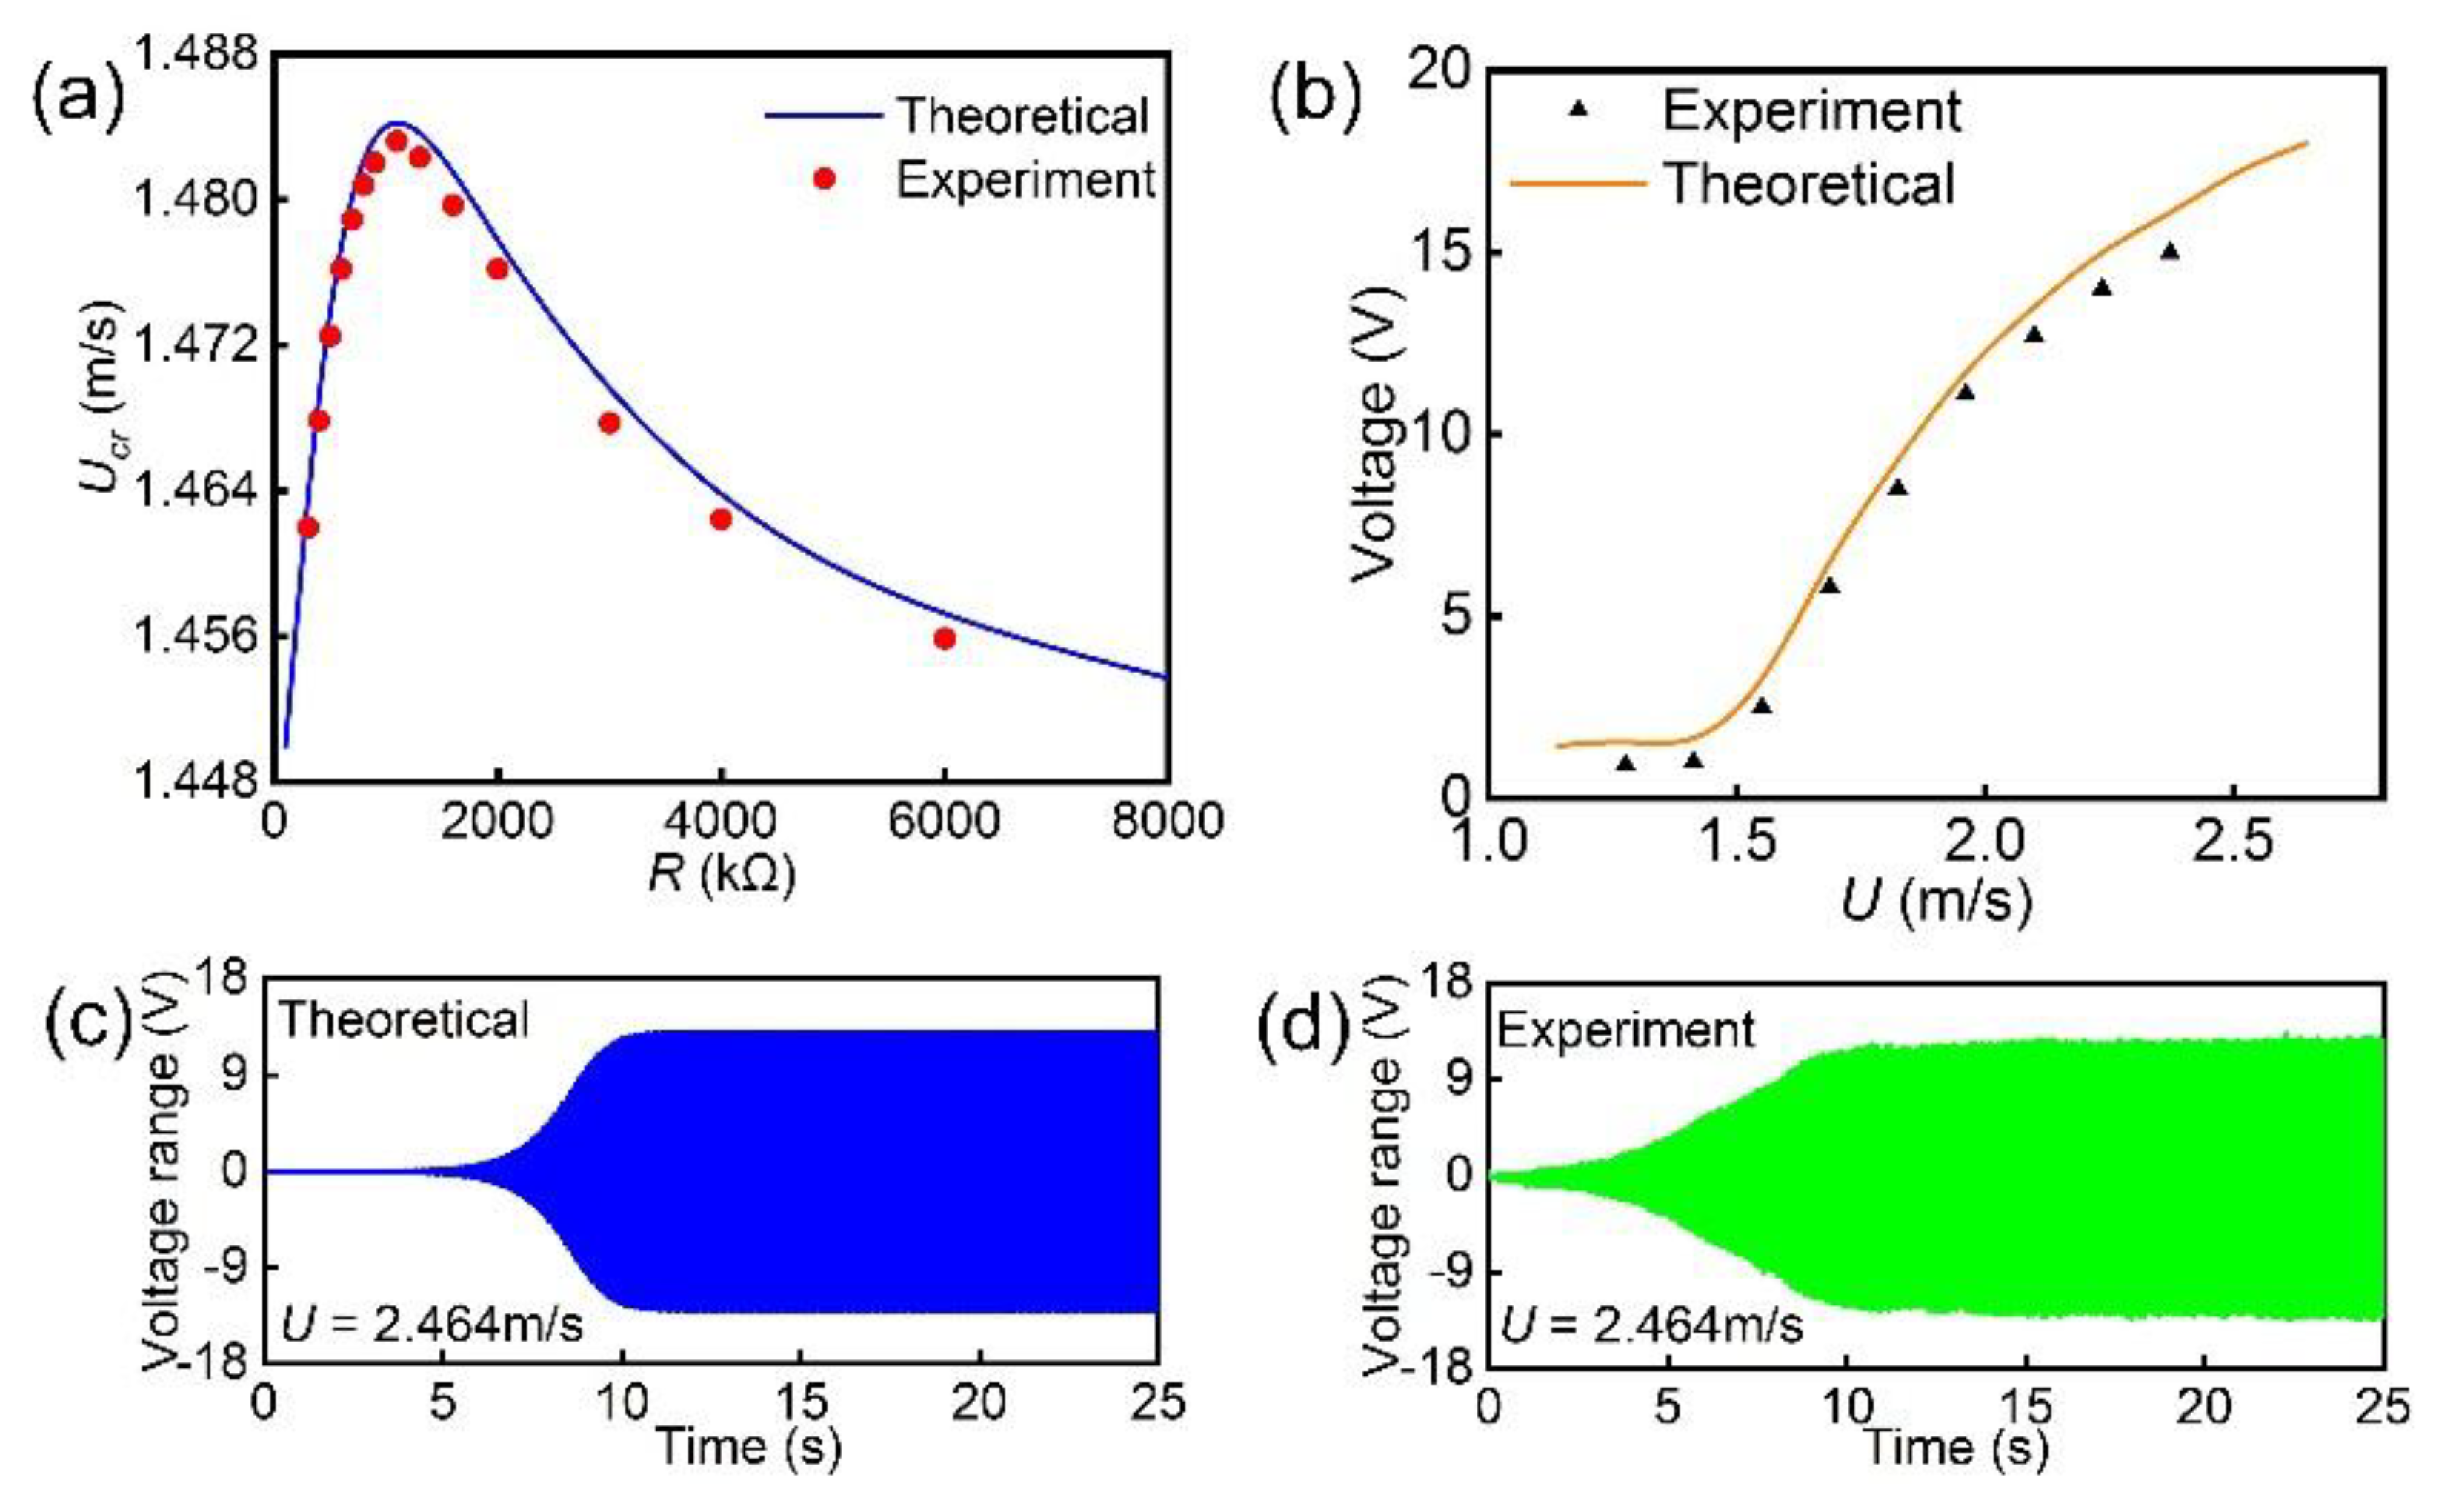
The theoretical model was verified by experimental results as shown in Figure 3, where Figure 3a shows the effect of load resistance R on the critical wind speed Ucr. It can be found that for the galloping energy harvester, Ucr firstly increases and then decreases with the increase of R.
The model maximizes at the optimum load of 1.1 MΩ, Ucrmax = 1.485 m/s. Figure 3b is the output voltage amplitude along with the wind speed in the open circuit condition. The voltage increases along with increases in the wind speed, which is a common characteristic of the galloping energy harvester. Figure 3c,d are respectively the time-domain output voltage range of the GEH-PTC with R = 1.1 MΩ at U = 2.464 m/s. The stable theoretical and experimental voltage amplitudes are 13.2 V and 12.5 V, respectively. Figure 3 shows that both the critical wind speed and the output voltage are slightly smaller than the theoretical values when the wind speed is very small, but the divergence is small. In general, the results from the theoretical model are very close to the experimental results, proving its accuracy.
3. Performance of the GEH-PTC
In this section, we experimentally compare two different harvesters (their cylinders have the same mass). Figure 4a,b are respectively the experimental output voltage and vibration frequency along with the wind speed under the open circuit condition. From Figure 4a, the GEH-PTC and the vortex-induced vibration energy harvester (VIVEH) with an ordinary smooth cylinder respectively represent two completely different vibration forms, which are galloping vibration and vortex-induced vibration. Galloping vibration shows that the output voltage increases along with increases in wind speed, while vortex-induced vibration shows that the output voltage firstly increases and then decreases with an increase in wind speed. Figure 4b further analyzes the difference between them based on the vibration frequency.
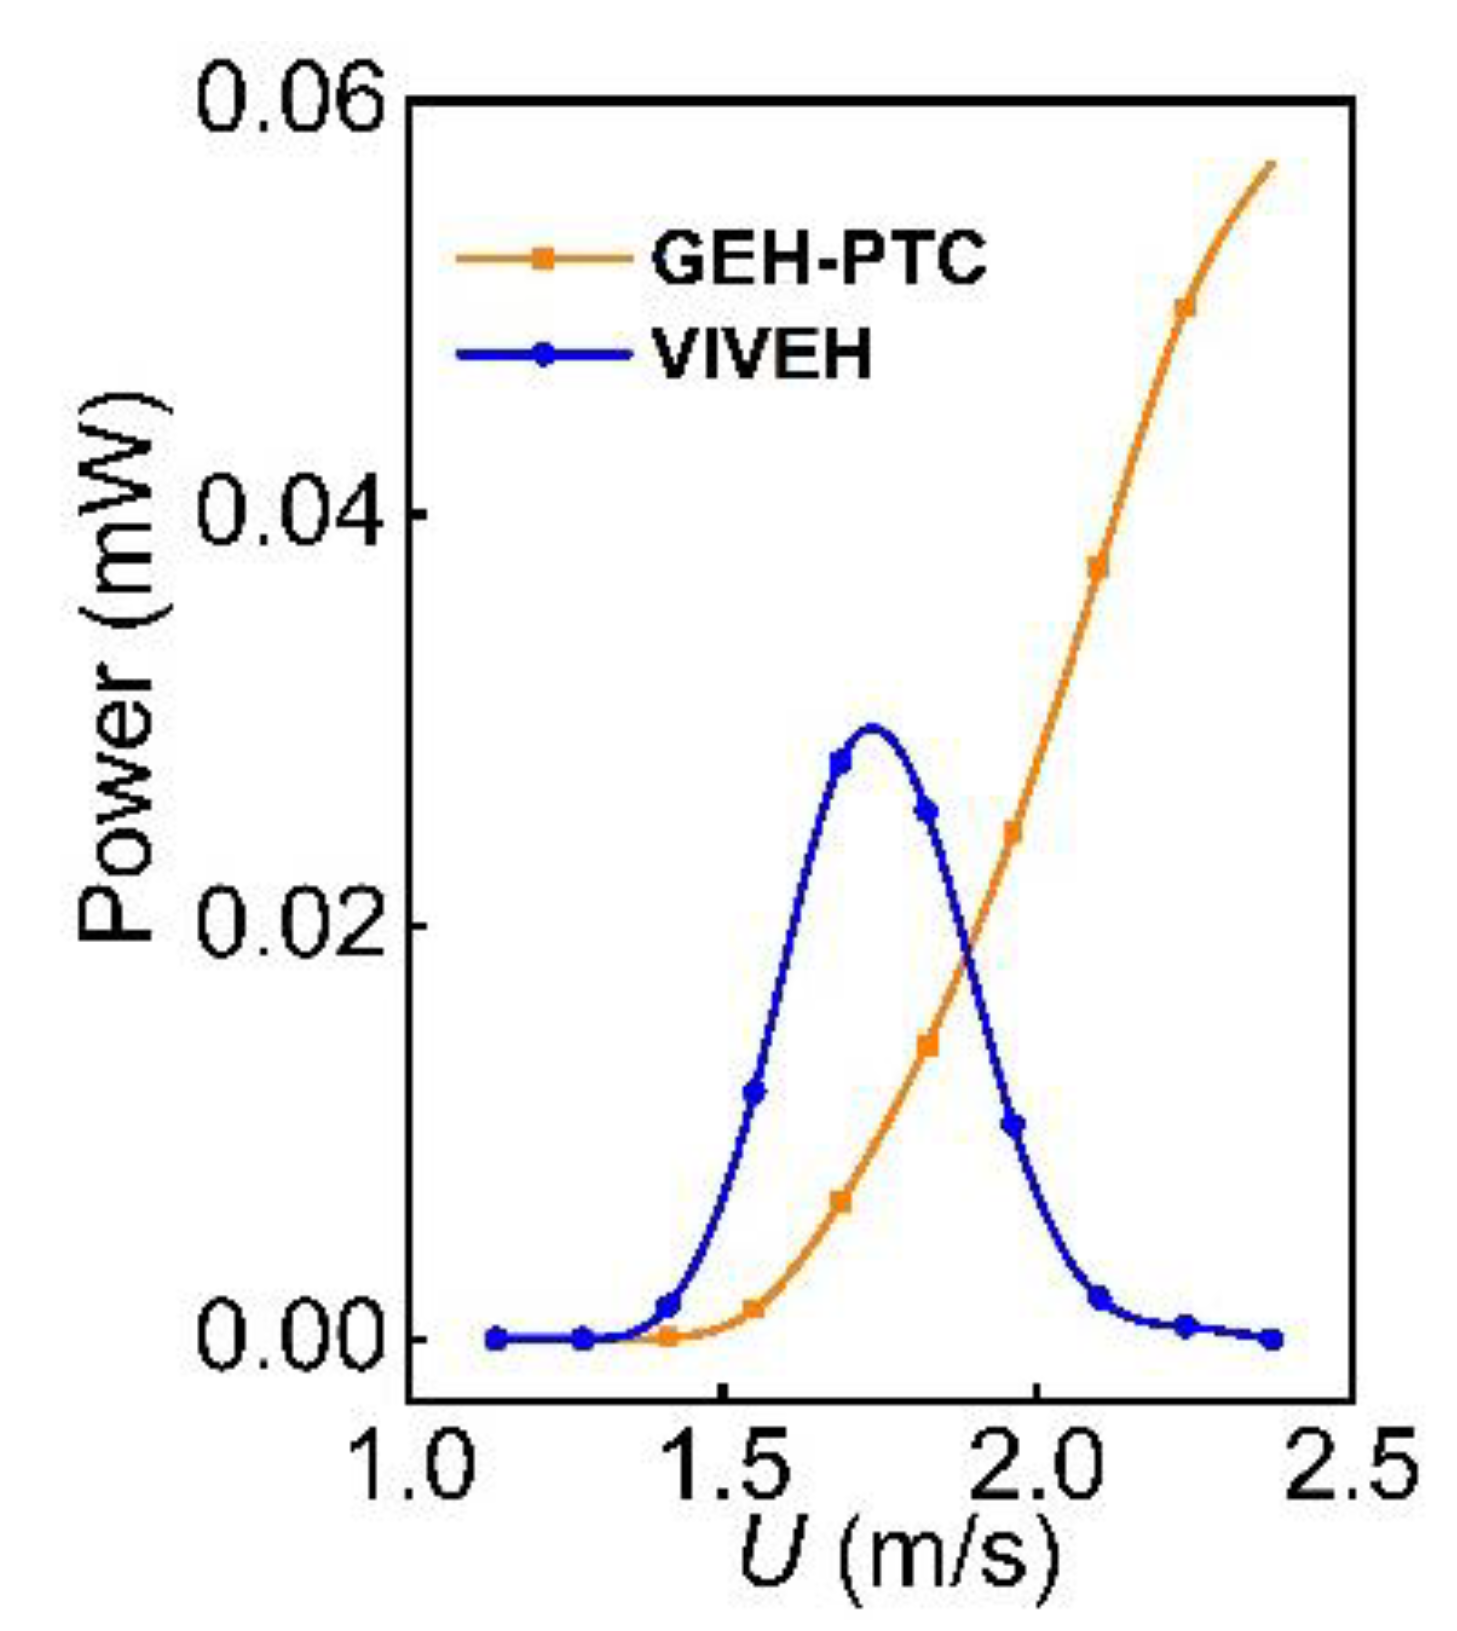
The natural frequency of both two harvesters is 9.2 Hz. When the wind speed is small, the vibration frequency of the GEH-PTC and the VIVEH differs greatly from the natural frequency, therefore, it is difficult to generate resonant vibration. With the increase in wind speed, the vibration frequency of the two energy harvesters is close to the natural frequency. Their effective speed ranges are U > 1.9 m/s and 1.67–1.83 m/s, respectively. Therefore, the GEH-PTC has a much wider effective speed range than the VIVEH. In other words, the GEH-PTC can efficiently harvest energy once the wind speed is larger than the critical wind speed. More importantly, the design of the GEH-PTC is very convenient for changing to different PTCs, which may change its dynamic characteristics and benefit wind energy harvesting. Figure 5 compares the output power of two harvesters with the optimal load Ropt = 1.1 MΩ. It can be found that the maximum power of the GEH-PTC and the VIVEH is 0.058 mW and 0.03 mW when U1 = 2.372 m/s and U2 = 1.687 m/s, respectively. The output power of the GEH-PTC is improved by 93% compared with the VIVEH.
4. Effect of the Coupling Strength
In this section, the influence of the electromechanical coupling strength, wind speed, and the load resistance on the output voltage and the response displacement of the harvester will be numerically analyzed. The parameters of the energy harvester are the same as those in the last section. The damping ratio is calculated by free decay experiments ζ = 0.013. k2/(4ζ + 4ζ2) = 0.029, 1, 2.9, respectively
4.1. Effect of Coupling Strength
Figure 6 shows the output power of the GEH-PTC along with the load resistance with three different electromechanical coupling strengths. Figure 6a,b respectively represent the weak coupling (k2/(4ζ + 4ζ2) = 0.029) and the critical coupling (k2/(4ζ + 4ζ2) = 1), and the wind speed range is 2.098–2.646 m/s. When the electromechanical coupling strength presents weak coupling and critical coupling, the output power firstly increases and then decreases with the increase of external load, and it reaches the maximum value at the optimal load resistance. The optimal load resistance of the weak coupling and the critical coupling is respectively 1.1 MΩ and 3.0 MΩ, which is very close to the theoretical one () [64]. When the wind speed is 2.646 m/s, the peak output power in the above two cases reaches 0.15 mW and 0.5 mW, respectively.
For the strong coupling (k2/(4ζ + 4ζ2) = 2.9), results are shown in Figure 6c. At each wind speed, there will be a trough between the two power peaks, and the corresponding resistance value of the trough is the optimal load resistance. Therefore, based on Figure 6, we can guess that the coupling strength is an important factor affecting the output power. The output power increases with an increase in electromechanical coupling strength. However, when the coupling strength is higher than the critical coupling strength, the output power does not increase further, and the power reaches saturation. The change of output power along with the wind speed is shown in Figure 7, and the resistance is in range of 0.5–8.0 MΩ. As a whole, it can be observed that under the three coupling strengths power increases with increasing wind speed. However, at a higher wind speed, the power increase rate gradually decreases, which is consistent with the experimental results. In addition, as shown in Figure 7c, when the electromechanical coupling strength presents as strong coupling, the power increase rate under small resistance (R = 0.5 MΩ) is obviously greater than that under large resistance (R = 8.0 MΩ), which can be seen from the intersection of bold solid lines. Different from strong coupling, weak coupling (Figure 7a) and critical coupling (Figure 7b) do not show such a phenomenon of solid line crossing, and the power reaches the maximum at the optimal load (Figure 7a: Ropt = 1.1 MΩ; Figure 7b: Ropt = 3.0 MΩ), which can also be reflected in Figure 6.
4.2. Effect of the Coupling Strength on Displacement
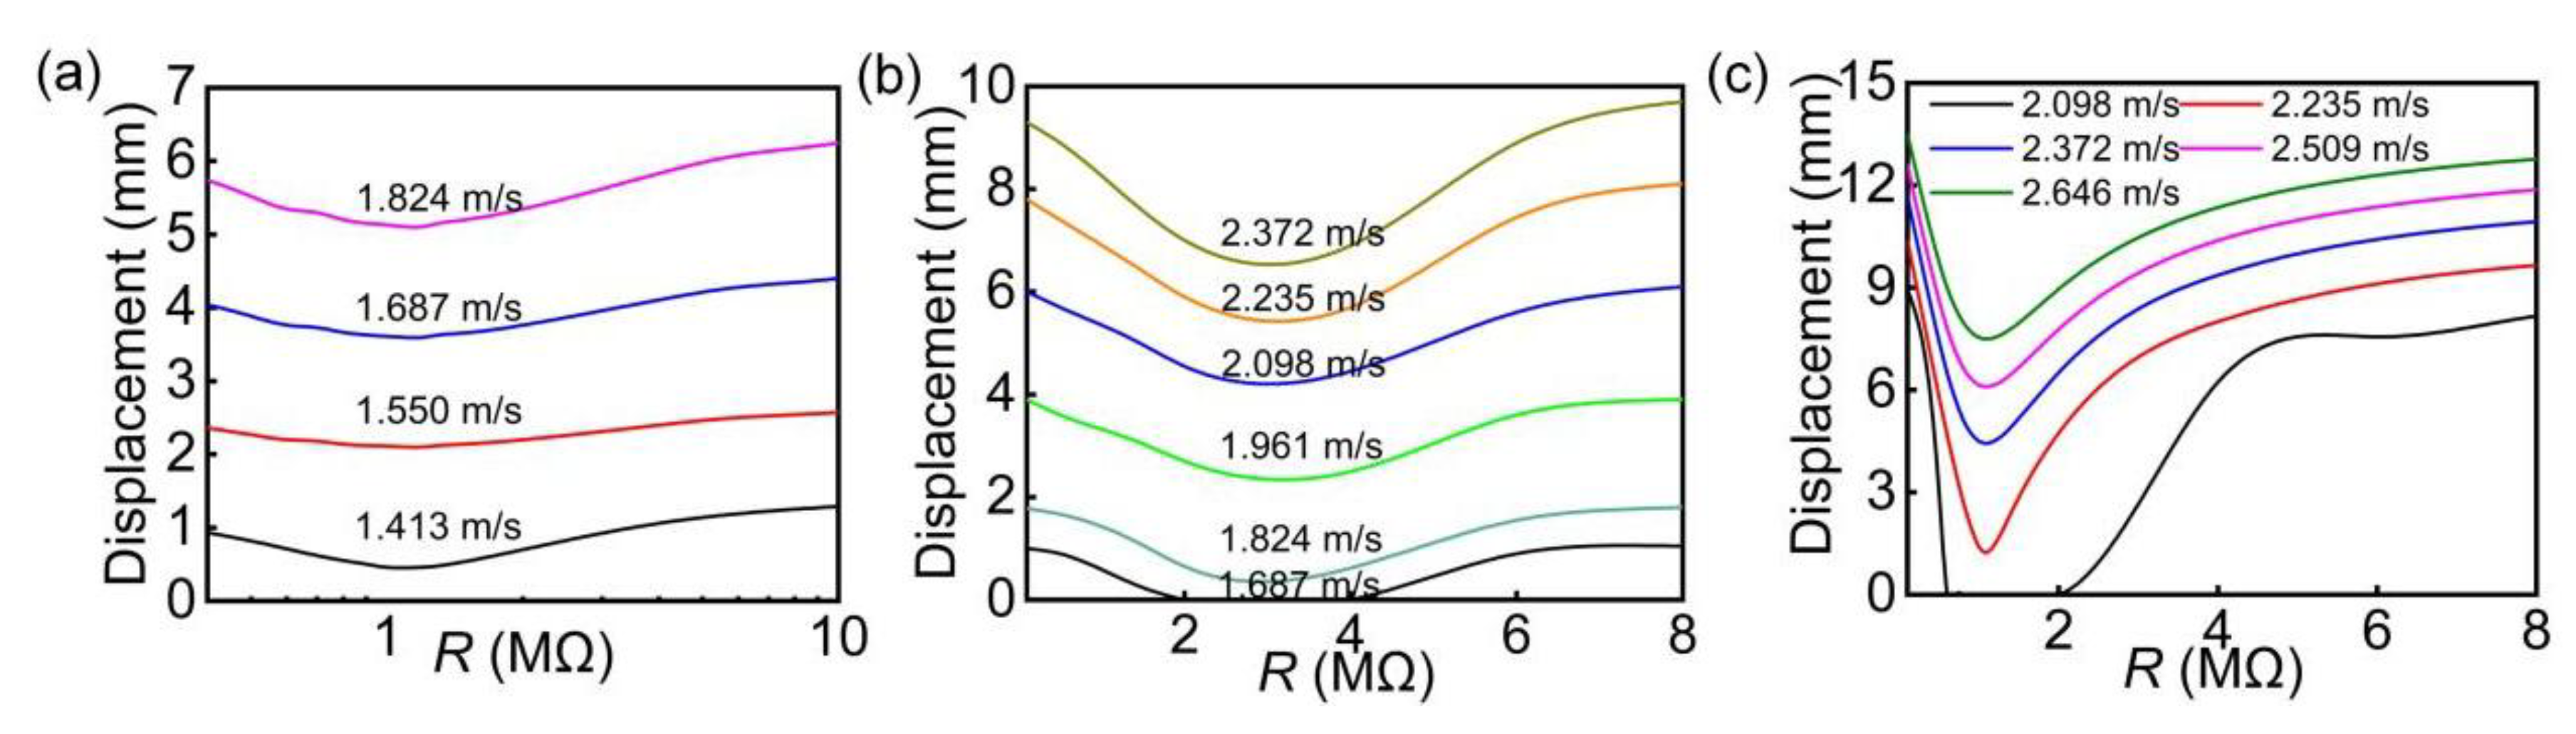
The response displacement of the GEH-PTC with three coupling strengths is shown in Figure 8. It is found that the response displacement increases along with increasing coupling strength and wind speed. The maximum displacement the GEH-PTC with the weak, critical, and strong couplings reached 6 mm, 10 mm, and 13.5 mm, respectively. Meanwhile, the corresponding wind speed is 1.824 m/s, 2.372 m/s, 2.646 m/s, respectively. Compared with the weak coupling, the displacement in the strong coupling case increases by 125%. However, increases in coupling strength makes the response displacement curve of the GEH-PTC with the optimal load appear as a ‘depression’ under each wind speed, which is obvious in the case of strong coupling. For the critical coupling (Figure 8b) and the strong coupling (Figure 8c), the response displacement curve even breaks when the wind speed is 1.687 m/s and 2.098 m/s due to the ‘sag’ phenomenon. At this time, the load resistance ranges are 2–4 MΩ and 0.5–2 MΩ, respectively. Galloping phenomenon does not occur when the load resistance is in these ranges. Therefore, it is called a ‘suppressed load’. When the load resistance in the three coupling cases are 1.1 MΩ, 3.0 MΩ, and 1.1 MΩ, respectively, the galloping suppression is the most obvious. On the contrary, this value is shown as the optimal load in Figure 6a,b.
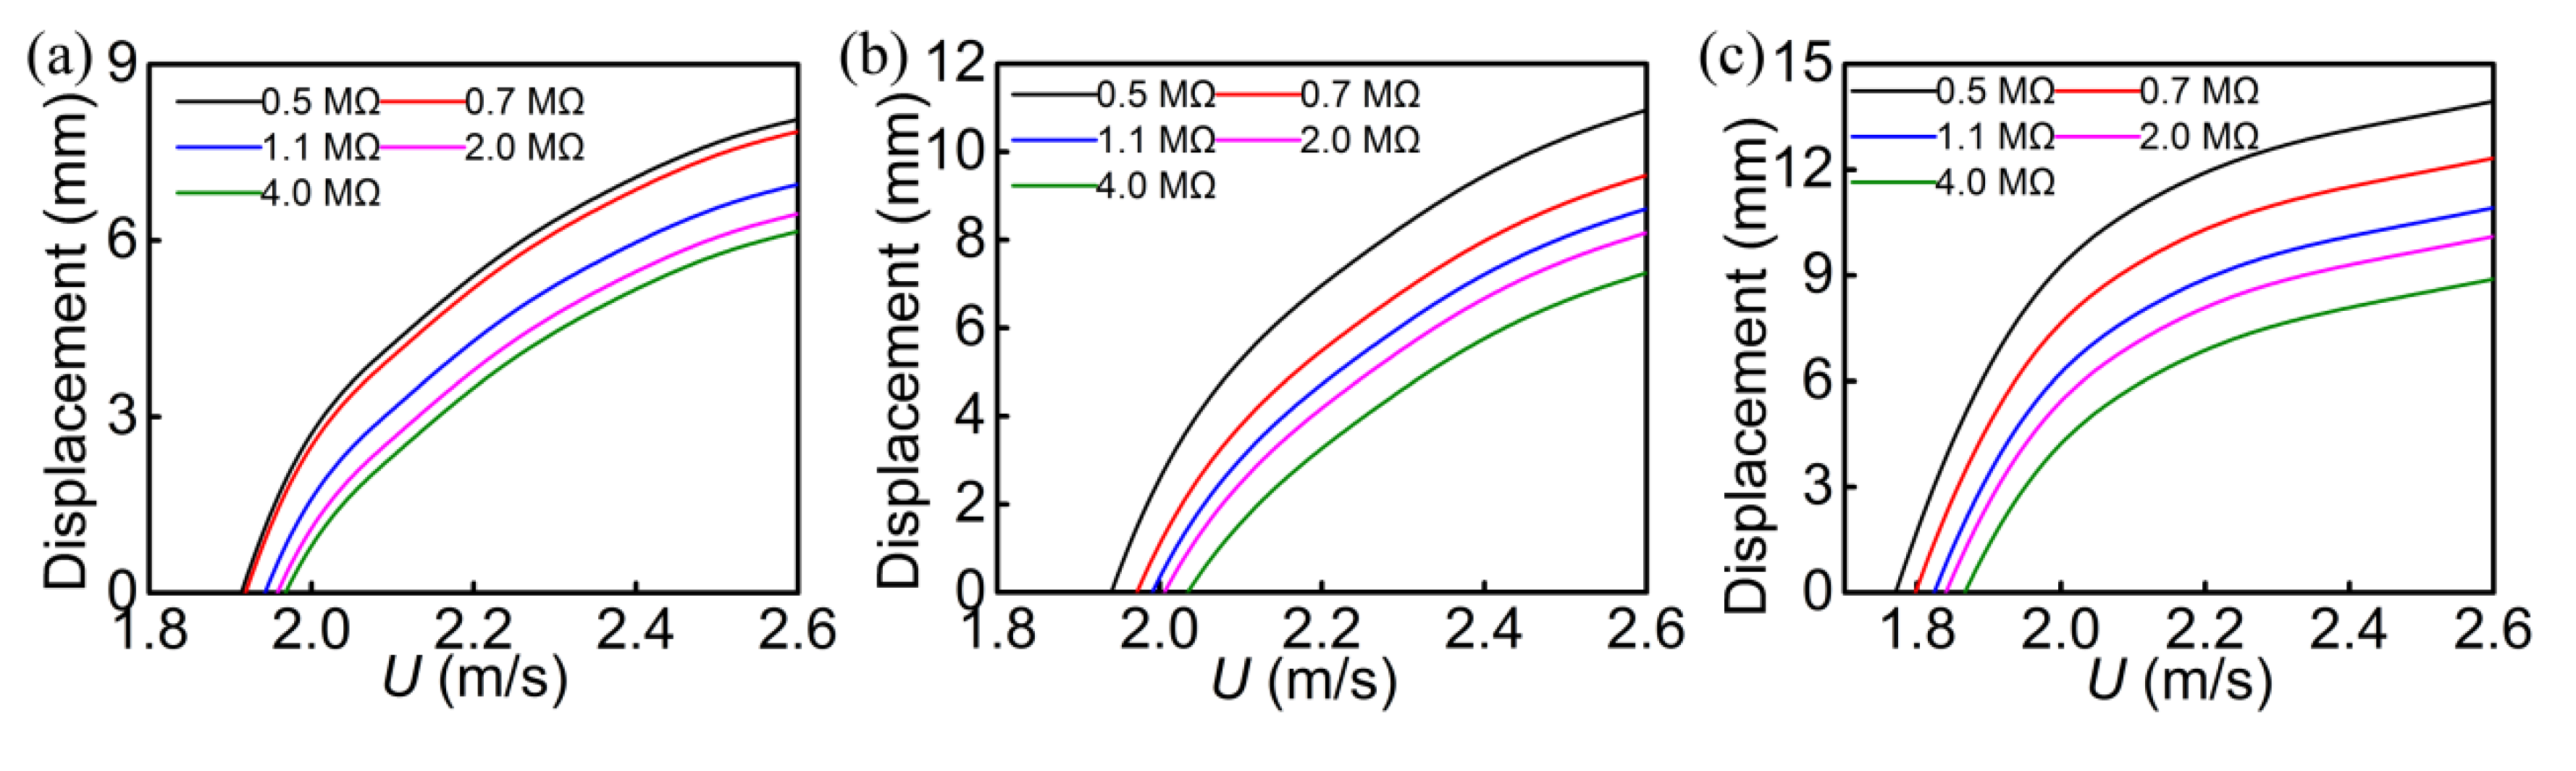
In Figure 9, the response displacement of the GEH-PTC with three coupling strengths are compared. The load resistances in each case are 0.5 MΩ, 0.7 MΩ, 1.1 MΩ, 2.0 MΩ, and 4.0 MΩ. The response displacement in the three cases also increases with increasing wind speed. When the wind speed is 2.6 m/s and the load resistance is 0.5 MΩ, the maximum displacement reaches 8 mm, 11 mm, and 14 mm for the weak, critical, and strong coupling cases, respectively. For a specific coupling strength, different resistance values correspond to different critical wind speeds Ucr. High load resistance leads to a high critical wind speed. However, the displacement corresponding to high resistance values will obviously decrease. For the critical (Figure 9a), weak (Figure 9b), and strong coupling (Figure 9c) cases, the critical wind speed range is respectively 1.92–1.97 m/s, 1.94–2.04 m/s, and 1.76–1.86 m/s. The necessary condition for achieving galloping vibration is that the incoming wind speed is higher than the critical value.
5. Conclusions
In this paper, the galloping piezoelectric energy harvester with two 60° PTC structures (GEH-PTC) is experimentally and theoretically studied. A theoretical model of the GEH-PTC is established and the accuracy of the model is verified by experiments. The effect of the load resistance on the critical wind speed (Ucr), the response displacement, and the output power of the GEH-PTC under strong and weak coupling conditions are analyzed from the perspective of the electromechanical coupling strength. Results show that Ucr increases firstly and then decreases along with increasing load resistance. Compared with the VIVEH in the studied wind range conditions, the maximum output power and voltage of the GEH-PTC increased by 93% and 66.7%, respectively. When the electromechanical coupling strength shows weak coupling and critical coupling, the output power increases firstly and then decreases with increased load resistance, and it reaches the maximum value at the optimal load, which is 1.1 MΩ and 3.0 MΩ for the former and the latter, respectively. At 2.646 m/s, the peak output power in the cases of the weak coupling and the critical coupling reached 0.15 mW and 0.5 mW, respectively. With increasing coupling strength and wind speed, the response displacement increases obviously. Compared with the weak coupling case, the displacement in the strong coupling case increased by 125%. In future work, we will change the coupling strength by changing the piezoelectric materials in the experiment to obtain different coupling strengths. The key factor is the piezoelectric materials, specifically the arrangement mode, numbers, etc.
Author Contributions
J.W. and G.L. carried out the energy harvesting experiments. J.W., S.Z. and G.L. wrote the paper.
Acknowledgments
This work was supported by the National Natural Science Foundation of China (Grant Nos. 51606171 and 11802237), and the Fundamental Research Funds for the Central Universities of China (Grant No. G2018KY0306).
Conflicts of Interest
The authors declare no conflict of interest.
References
- Beeby, S.P.; Tudor, M.J.; White, N.M. Energy harvesting vibration sources for microsystems applications. Meas. Sci. Technol. 2006, 17, R175–R195. [Google Scholar] [CrossRef]
- Erturk, A.; Hoffmann, J.; Inman, D.J. A piezomagnetoelastic structure for broadband vibration energy harvesting. Appl. Phys. Lett. 2009, 94, 254102. [Google Scholar] [CrossRef] [Green Version]
- Litak, G.; Friswell, M.I.; Adhikari, S. Magnetopiezoelastic energy harvesting driven by random excitations. Appl. Phys. Lett. 2010, 96, 214103. [Google Scholar] [CrossRef]
- Zhou, S.X.; Cao, J.Y.; Erturk, A.; Lin, J. Enhanced broadband piezoelectric energy harvesting using rotatable magnets. Appl. Phys. Lett. 2013, 102, 173901. [Google Scholar] [CrossRef]
- Wei, C.F.; Jing, X.J. A comprehensive review on vibration energy harvesting: Modelling and realization. Renew. Sustain. Energy Rev. 2017, 74, 1–18. [Google Scholar] [CrossRef]
- Ferrari, M.; Ferrari, V.; Guizzetti, M.; Andò, B.; Baglio, S.; Trigona, C. Improved energy harvesting from wideband vibrations by nonlinear piezoelectric converters. Sens. Actuators A Phys. 2010, 162, 425–431. [Google Scholar] [CrossRef]
- Chen, L.Q.; Jiang, W.A. Internal resonance energy harvesting. J. Appl. Mech. 2015, 82, 031004. [Google Scholar] [CrossRef]
- Chen, L.Q.; Jiang, W.A.; Panyam, M.; Daqaq, M.F. A broadband internally resonant vibratory energy harvester. J. Vib. Acoust. 2016, 138, 061007. [Google Scholar] [CrossRef]
- Zhou, S.X.; Zuo, L. Nonlinear dynamic analysis of asymmetric tristable energy harvesters for enhanced energy harvesting. Commun. Nonlinear Sci. Numer. Simul. 2018, 61, 271–284. [Google Scholar] [CrossRef]
- Huang, D.M.; Zhou, S.X.; Litak, G. Theoretical analysis of multi-stable energy harvesters with high-order stiffness terms. Commun. Nonlinear Sci. Numer. Simul. 2019, 69, 270–286. [Google Scholar] [CrossRef]
- Ding, L.; Bernitsas, M.M.; Kim, E.S. 2-D URANS vs. experiments of flow induced motions of two circular cylinders in tandem with passive turbulence control for 30,000 <Re <105,000. Ocean Eng. 2013, 72, 429–440. [Google Scholar]
- Wang, J.L.; Zhao, G.F.; Zhang, M.; Zhang, Z.E. Efficient study of a coarse structure number on the bluff body during the harvesting of wind energy. Energy Sources Part A Recovery Utilization Environ. Eff. 2018, 40, 1788–1797. [Google Scholar] [CrossRef]
- Wang, J.L.; Zhou, S.X.; Zhang, Z.E.; Yurchenko, D. High-performance piezoelectric wind energy harvester with Y-shaped attachments. Energy Convers. Manag. 2019, 181, 645–652. [Google Scholar] [CrossRef]
- Wu, N.; Wang, Q.; Xie, X.D. Ocean wave energy harvesting with a piezoelectric coupled buoy structure. Appl. Ocean Res. 2015, 50, 110–118. [Google Scholar] [CrossRef]
- Chen, N.; Wei, T.C.; Jung, H.J.; Lee, S. Quick self-start and minimum power-loss management circuit for impact-type micro wind piezoelectric energy harvesters. Sens. Actuators A Phys. 2017, 263, 23–29. [Google Scholar] [CrossRef]
- Abdelkefi, A. Aeroelastic energy harvesting: A review. Int. J. Eng. Sci. 2016, 100, 112–135. [Google Scholar] [CrossRef]
- Güney, M.S.; Kaygusuz, K. Hydrokinetic energy conversion systems: A technology status review. Renew. Sustain. Energy Rev. 2010, 14, 2996–3004. [Google Scholar] [CrossRef]
- Lee, J.H.; Xiros, N.; Bernitsas, M.M. Virtual damper–spring system for VIV experiments and hydrokinetic energy conversion. Ocean Eng. 2011, 38, 732–747. [Google Scholar] [CrossRef]
- Cada, G.; Ahlgrimm, J.; Bahleda, M.; Bigford, T.; Stavrakas, S.; Hall, D.; Moursund, R.; Sale, M. Potential impacts of hydrokinetic and wave energy conversion technologies on aquatic environments. Fisheries 2007, 32, 174–181. [Google Scholar] [CrossRef]
- Neary, V.S.; Gunawan, B.; Sale, D.C. Turbulent inflow characteristics for hydrokinetic energy conversion in rivers. Renew. Sustain. Energy Rev. 2013, 26, 437–445. [Google Scholar] [CrossRef]
- Chen, Z.S.; He, J.; Liu, J.H.; Xiong, Y. Switching delay in self-powered nonlinear piezoelectric vibration energy harvesting circuit: Mechanisms, effects, and solutions. IEEE Trans. Power Electron. 2019, 34, 2427–2440. [Google Scholar] [CrossRef]
- Zhang, M.; Wang, J.L. Experimental study on piezoelectric energy harvesting from vortex-induced vibrations and wake-induced vibrations. J. Sens. 2016, 2016, 2673292. [Google Scholar] [CrossRef]
- Wu, Y.P.; Qiu, J.H.; Zhou, S.X.; Ji, H.; Chen, Y.; Li, S. A piezoelectric spring pendulum oscillator used for multi-directional and ultra-low frequency vibration energy harvesting. Appl. Energy 2018, 231, 600–614. [Google Scholar] [CrossRef]
- Wang, J.L.; Geng, L.F.; Zhang, M.; Zhan, G.; Zhang, M.; Zhang, Z.; Li, Y. Broadening Band of Wind Speed for Aeroelastic Energy Scavenging of a Cylinder through Buffeting in the Wakes of a Squared Prism. Shock Vib. 2018, 2018, 2039561. [Google Scholar] [CrossRef]
- Kitio Kwuimy, C.A.; Litak, G.; Borowiec, M.; Nataraj, C. Performance of a piezoelectric energy harvester driven by air flow. Appl. Phys. Lett. 2012, 100, 024103. [Google Scholar] [CrossRef]
- Liu, H.C.; Zhong, J.W.; Lee, C.K.; Lee, S.; Lin, L. A comprehensive review on piezoelectric energy harvesting technology: Materials, mechanisms, and applications. Appl. Phys. Rev. 2018, 5, 041306. [Google Scholar] [CrossRef]
- Joseph, G.V.; Hao, G.; Pakrashi, V. Extreme value estimates using vibration energy harvesting. J. Sound Vib. 2018, 437, 29–39. [Google Scholar] [CrossRef]
- Yang, L.J.; Zhang, H.F. A wide-band piezoelectric energy harvester with adjustable frequency through rotating the angle of the jointed beam. Ferroelectrics 2017, 520, 237–244. [Google Scholar] [CrossRef]
- Ibrahim, W.I.; Ismail, R.; Mohamed, M.R. Hydrokinetic energy harnessing for river application. J. Telecommun. Electron. Comput. Eng. (JTEC) 2018, 10, 133–138. [Google Scholar]
- Zhang, B.S.; Wang, K.H.; Song, B.W.; Mao, Z.; Tian, W. Numerical investigation on the effect of the cross-sectional aspect ratio of a rectangular cylinder in FIM on hydrokinetic energy conversion. Energy 2018, 165, 949–964. [Google Scholar] [CrossRef]
- Hu, G.; Tse, K.T.; Wei, M.H.; Naseer, R.; Abdelkefi, A.; Kwok, K. Experimental investigation on the efficiency of circular cylinder-based wind energy harvester with different rod-shaped attachments. Appl. Energy 2018, 226, 682–689. [Google Scholar] [CrossRef]
- Hu, G.; Tse, K.T.; Kwok, K.C.S.; Song, J.; Lyu, Y. Aerodynamic modification to a circular cylinder to enhance the piezoelectric wind energy harvesting. Appl. Phys. Lett. 2016, 109, 193902. [Google Scholar] [CrossRef]
- Bernitsas, M.M.; Raghavan, K.; Ben-Simon, Y.; Garcia, E.M. VIVACE (Vortex Induced Vibration Aquatic Clean Energy): A new concept in generation of clean and renewable energy from fluid flow. J. Offshore Mech. Arct. Eng. 2008, 130, 041101. [Google Scholar] [CrossRef]
- Bernitsas, M.M.; Ben-Simon, Y.; Raghavan, K.; Garcia, E. The VIVACE converter: Model tests at high damping and Reynolds number around 105. J. Offshore Mech. Arct. Eng. 2009, 131, 011102. [Google Scholar] [CrossRef]
- Sun, H.; Ma, C.H.; Bernitsas, M.M. Hydrokinetic power conversion using Flow Induced Vibrations with cubic restoring force. Energy 2018, 153, 490–508. [Google Scholar] [CrossRef]
- He, X.F.; Yang, X.K.; Jiang, S.L. Enhancement of wind energy harvesting by interaction between vortex-induced vibration and galloping. Appl. Phys. Lett. 2018, 112, 033901. [Google Scholar] [CrossRef]
- Mutsuda, H.; Tanaka, Y.; Patel, R.; Doi, Y. Harvesting flow-induced vibration using a highly flexible piezoelectric energy device. Appl. Ocean Res. 2017, 68, 39–52. [Google Scholar] [CrossRef]
- Chang, C.C.J.; Kumar, R.A.; Bernitsas, M.M. VIV and galloping of single circular cylinder with surface roughness at 3.0 × 10⁴ ≤ Re ≤ 1.2 × 10⁵. Ocean Eng. 2011, 38, 1713–1732. [Google Scholar] [CrossRef]
- Yan, Z.M.; Abdelkefi, A.; Hajj, M.R. Piezoelectric energy harvesting from hybrid vibrations. Smart Mater. Struct. 2014, 23, 204. [Google Scholar] [CrossRef]
- Mutsuda, H.; Kawakami, K.; Kurokawa, T.; Doi, Y.; Tanaka, Y. A technology of electrical energy generated from ocean power using flexible piezoelectric device. In Proceedings of the ASME 2010 29th International Conference on Ocean, Offshore and Arctic Engineering, Shanghai, China, 6–11 June 2010; pp. 313–321. [Google Scholar]
- Tabesh, A.; Frechette, L.G. A Low-Power Stand-Alone Adaptive Circuit for Harvesting Energy From a Piezoelectric Micropower Generator. IEEE Trans. Ind. Electron. 2010, 57, 840–849. [Google Scholar] [CrossRef] [Green Version]
- Barrero, A.; Alonso, G.; Sanz, A. Energy harvesting from transverse galloping. J. Sound Vib. 2010, 329, 2873–2883. [Google Scholar] [CrossRef] [Green Version]
- Wang, J.L.; Li, G.P.; Zhang, M.; Zhao, G.; Jin, Z.; Xu, K.; Zhang, Z. Energy harvesting from flow-induced vibration: A lumped parameter model. Energy Sources Part A Recovery Utilizationand Environ. Eff. 2018, 40, 2903–2913. [Google Scholar] [CrossRef]
- Zhang, M.; Zhao, G.F.; Wang, J.L. Study on Fluid-Induced Vibration Power Harvesting of Square Columns under Different Attack Angles. Geofluids 2017, 2017, 6439401. [Google Scholar] [CrossRef]
- Zhou, S.X.; Wang, J.L. Dual serial vortex-induced energy harvesting system for enhanced energy harvesting. Aip Adv. 2018, 8, 075221. [Google Scholar] [CrossRef]
- Ramasur, D.; Hancke, G.P. A wind energy harvester for low power wireless sensor networks. In Proceedings of the 2012 IEEE Conference on Instrumentation and Measurement Technology, Graz, Austria, 13–16 May 2012; pp. 2623–2627. [Google Scholar]
- Sirohi, J.; Mahadik, R. Harvesting wind energy using a galloping piezoelectric beam. J. Vib. Acoust. 2012, 134, 011009. [Google Scholar] [CrossRef]
- Yang, Y.W.; Zhao, L.Y.; Tang, L.H. Comparative study of tip cross-sections for efficient galloping energy harvesting. Appl. Phys. Lett. 2013, 102, 064105. [Google Scholar] [CrossRef]
- Zhao, L.Y.; Tang, L.H.; Liang, J.; Yang, Y. Synergy of Wind Energy Harvesting and Synchronized Switch Harvesting Interface Circuit. IEEE/ASME Trans. Mechatron. 2017, 22, 1093–1103. [Google Scholar] [CrossRef]
- Dai, H.L.; Abdelkefi, A.; Yang, Y.; Wang, L. Orientation of bluff body for designing efficient energy harvesters from vortex-induced vibrations. Appl. Phys. Lett. 2016, 108, 175–195. [Google Scholar] [CrossRef]
- Liao, Y.B.; Liang, J.R. Maximum power, optimal load, and impedance analysis of piezoelectric vibration energy harvesters. Smart Mater. Struct. 2018, 27, 075053. [Google Scholar] [CrossRef] [Green Version]
- Shu, Y.C.; Lien, I.C. Analysis of power output for piezoelectric energy harvesting systems. Smart Mater. Struct. 2006, 15, 1499. [Google Scholar] [CrossRef]
- Renno, J.M.; Daqaq, M.F.; Inman, D.J. On the Optimal Energy Harvesting from a Vibration Source Using a Piezoelectric Stack. J. Sound Vib. 2009, 320, 386–405. [Google Scholar] [CrossRef]
- Liang, J.R.; Liao, W.H. Improved Design and Analysis of Self-Powered Synchronized Switch Interface Circuit for Piezoelectric Energy Harvesting Systems. Ieee Trans. Ind. Electron. 2012, 59, 1950–1960. [Google Scholar] [CrossRef]
- Zhu, H.J.; Lin, P.Z.; Gao, Y. Vortex-induced vibration and mode transition of a curved flexible free-hanging cylinder in exponential shear flows. J. Fluids Struct. 2019, 84, 56–76. [Google Scholar] [CrossRef]
- Tang, L.H.; Zhao, L.Y.; Yang, Y.W.; Lefeuvre, E. Equivalent circuit representation and analysis of galloping-based wind energy harvesting. IEEE/ASME Trans. Mechatron. 2015, 20, 834–844. [Google Scholar] [CrossRef]
- McCarthy, J.M.; Watkins, S.; Deivasigamani, A. Fluttering energy harvesters in the wind: A review. J. Sound Vib. 2016, 361, 355–377. [Google Scholar] [CrossRef]
- Xu, J.; Vicente, D.; Barrero, A. Theoretical study of the energy harvesting of a cantilever with attached prism under aeroelastic galloping. Eur. J. Mech.-B/Fluids 2016, 60, 189–195. [Google Scholar] [CrossRef] [Green Version]
- Wang, J.L.; Tang, L.H.; Zhao, L.Y.; Zhang, Z.E. Efficiency investigation on energy harvesting from airflows in HVAC system based on galloping of isosceles triangle sectioned bluff bodies. Energy 2019, 172, 1066–1078. [Google Scholar] [CrossRef]
- Park, H.; Kumar, R.A.; Bernitsas, M.M. Enhancement of flow-induced motion of rigid circular cylinder on springs by localized surface roughness at 3 × 10⁴ ≤ Re ≤ 1.2 × 10⁵. Ocean Eng. 2013, 72, 403–415. [Google Scholar] [CrossRef]
- Ding, L.; Zhang, L.; Bernitsas, M.M.; Chang, C.C. Numerical simulation and experimental validation for energy harvesting of single-cylinder VIVACE converter with passive turbulence control. Renew. Energy 2016, 85, 1246–1259. [Google Scholar] [CrossRef]
- Zhao, L.Y.; Tang, L.H.; Yang, Y.W. Comparison of modeling methods and parametric study for a piezoelectric wind energy harvester. Smart Mater. Struct. 2013, 22, 125003. [Google Scholar] [CrossRef]
- Simiu, E.; Scanlan, R.H. Wind Effect on Structures: An Introduction to Wind Engineering; Wiley-Interscience: New York, NY, USA, 1986. [Google Scholar]
- Inman, D.J. Engineering Vibration, 4th ed.; Prentice Hall: Upper Saddle River, NJ, USA, 2013. [Google Scholar]
- Erturk, A.; Inman, D.J. A distributed parameter electromechanical model for cantilevered piezoelectric energy harvesters. J. Vib. Acoust. 2008, 130, 041002. [Google Scholar] [CrossRef]
Figure 1.
The Galloping based energy harvester with PTC(GEH-PTC): (a) The structural diagram; (b) the equivalent model.
Figure 1.
The Galloping based energy harvester with PTC(GEH-PTC): (a) The structural diagram; (b) the equivalent model.

Figure 2.
Experimental setup: (a) the wind tunnel with the bluff body with attachments (PTC), which is made of (b) sanding belts with a very coarse surface, (c) the laser sensor, and (d) the data acquisition system.
Figure 2.
Experimental setup: (a) the wind tunnel with the bluff body with attachments (PTC), which is made of (b) sanding belts with a very coarse surface, (c) the laser sensor, and (d) the data acquisition system.

Figure 3.
Verification of the theoretical model: (a) the critical wind speed Ucr versus R; (b) the output voltage versus R; (c,d) are respectively theoretical and experimental time-domain output voltage range of the GEH-PTC at U = 2.464 m/s and R = 1.1 MΩ.
Figure 3.
Verification of the theoretical model: (a) the critical wind speed Ucr versus R; (b) the output voltage versus R; (c,d) are respectively theoretical and experimental time-domain output voltage range of the GEH-PTC at U = 2.464 m/s and R = 1.1 MΩ.

Figure 4.
Experimental comparison of the GEH-PTC and the vortex-induced vibration energy harvester (VIVEH): (a) output voltage; (b) vibration frequency.
Figure 4.
Experimental comparison of the GEH-PTC and the vortex-induced vibration energy harvester (VIVEH): (a) output voltage; (b) vibration frequency.
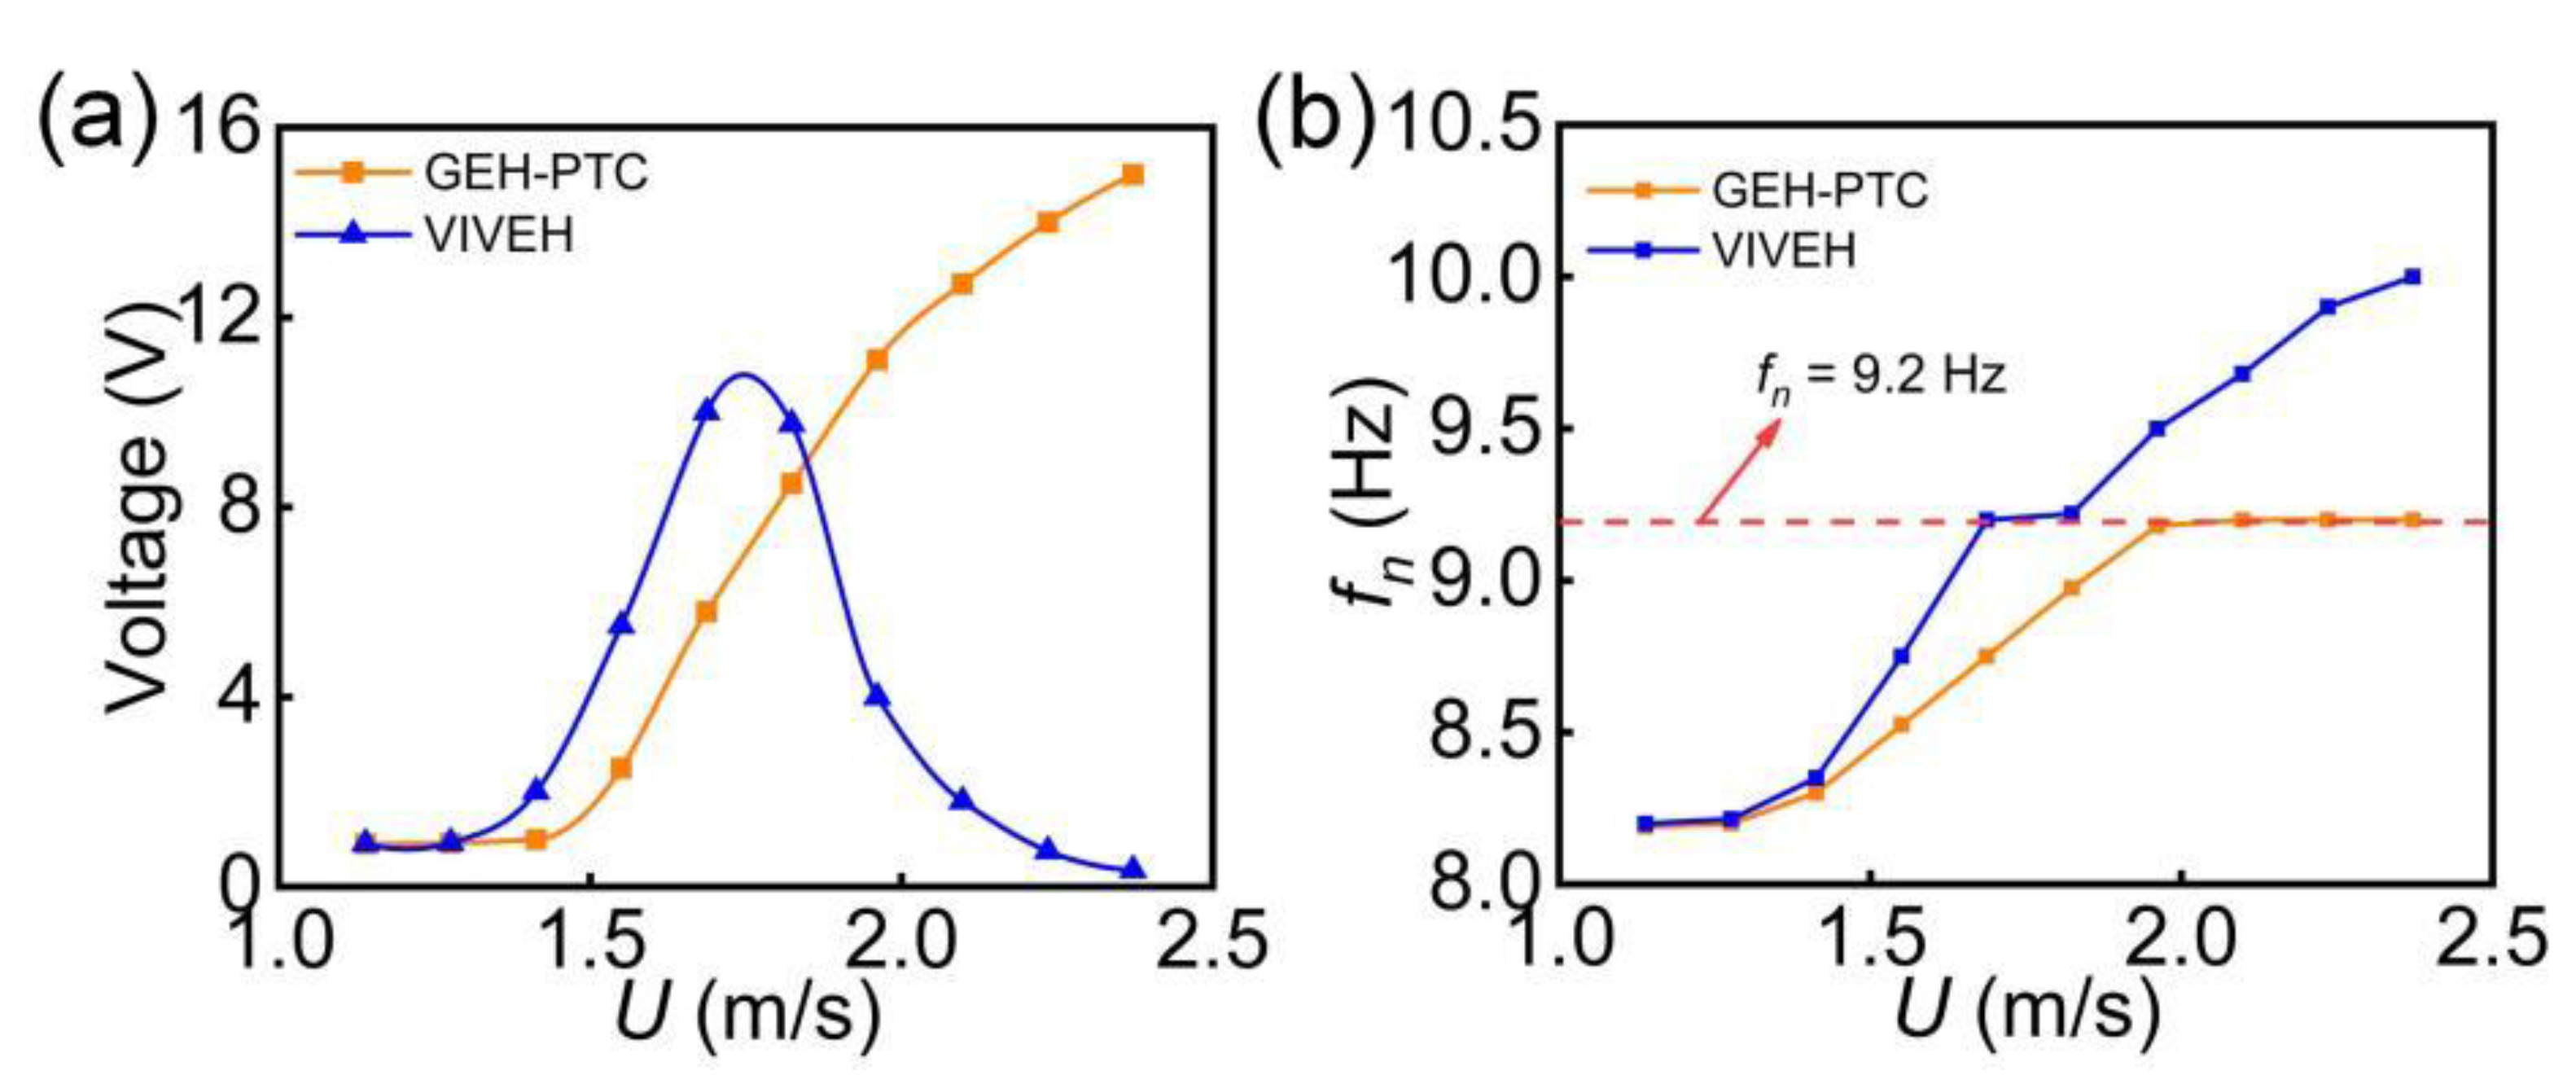
Figure 5.
The output power comparison of the GEH-PTC and the VIVEH in experiment.

Figure 6.
Numerical output power versus load resistance: (a) Weak coupling k2/(4ζ + 4ζ2) = 0.029; (b) critical coupling k2/(4ζ + 4ζ2) = 1; (c) strong coupling k2/(4ζ + 4ζ2) = 2.9.
Figure 6.
Numerical output power versus load resistance: (a) Weak coupling k2/(4ζ + 4ζ2) = 0.029; (b) critical coupling k2/(4ζ + 4ζ2) = 1; (c) strong coupling k2/(4ζ + 4ζ2) = 2.9.
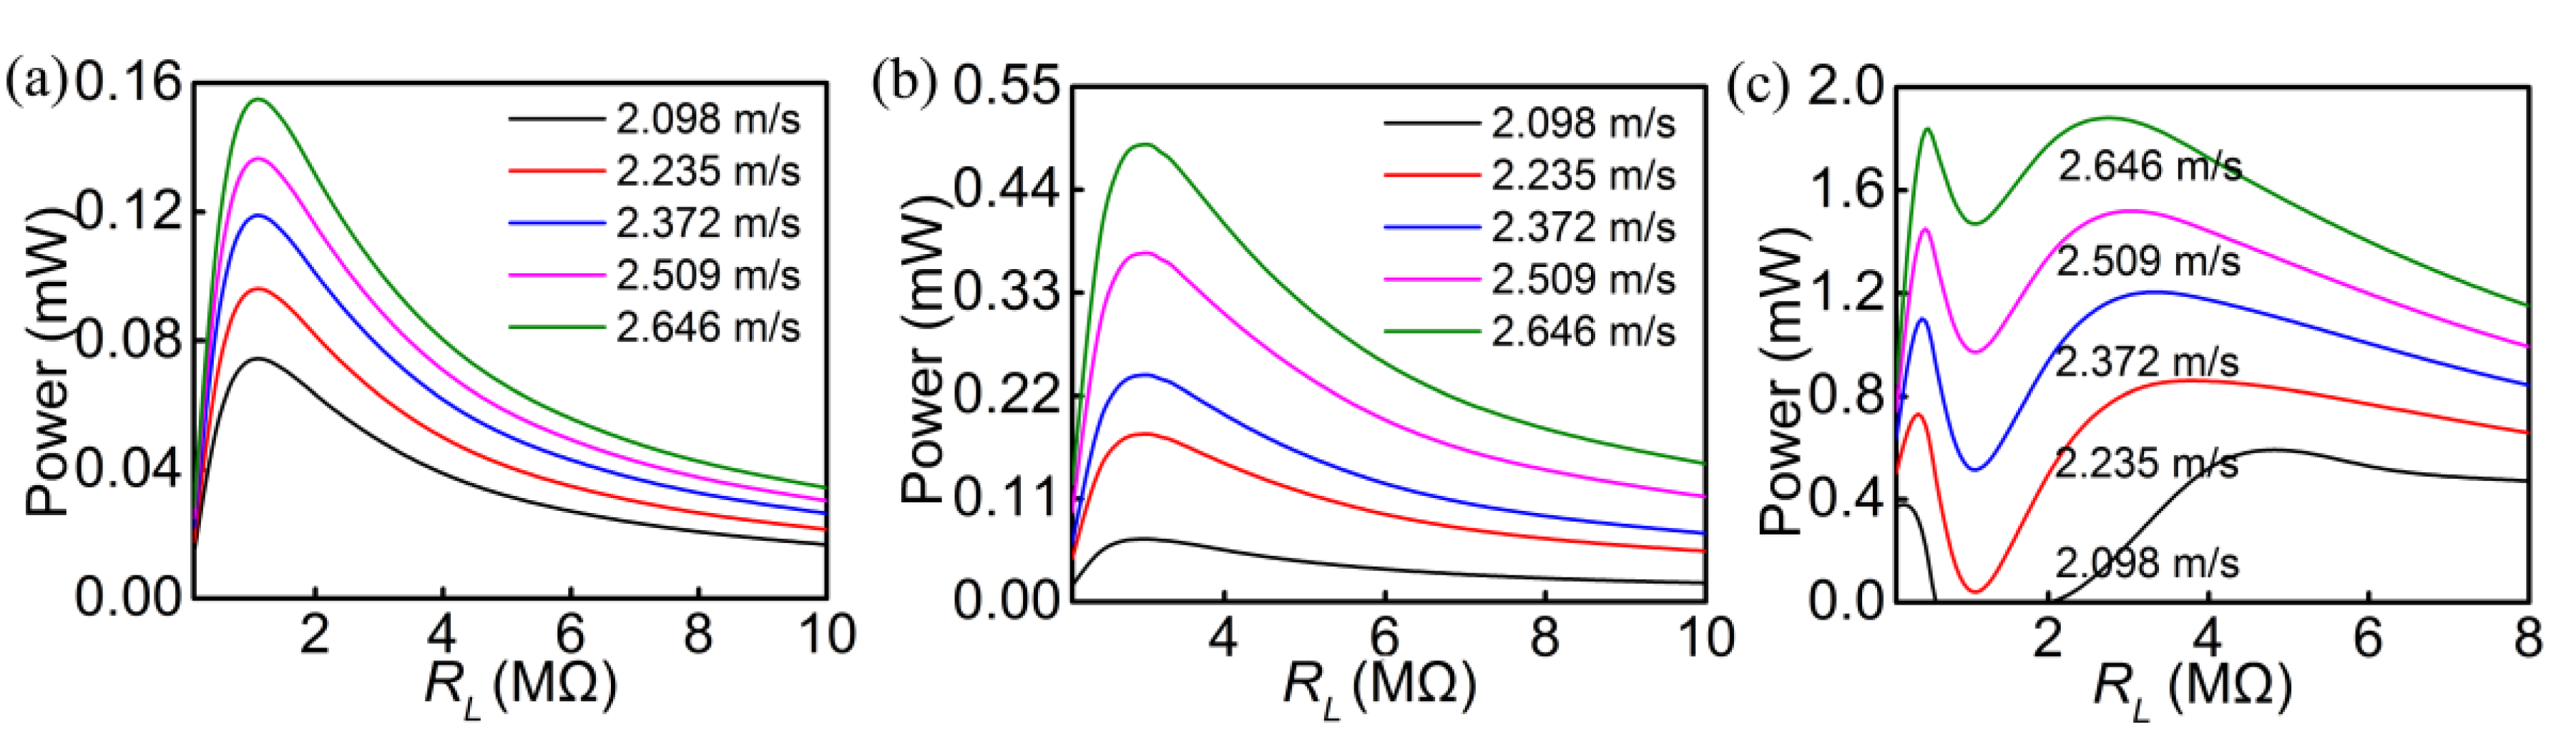
Figure 7.
Numerical output power versus the wind speed: (a) Weak coupling k2/(4ζ + 4ζ2) = 0.029; (b) critical coupling k2/(4ζ + 4ζ2) = 1; (c) strong coupling k2/(4ζ + 4ζ2) = 2.9.
Figure 7.
Numerical output power versus the wind speed: (a) Weak coupling k2/(4ζ + 4ζ2) = 0.029; (b) critical coupling k2/(4ζ + 4ζ2) = 1; (c) strong coupling k2/(4ζ + 4ζ2) = 2.9.
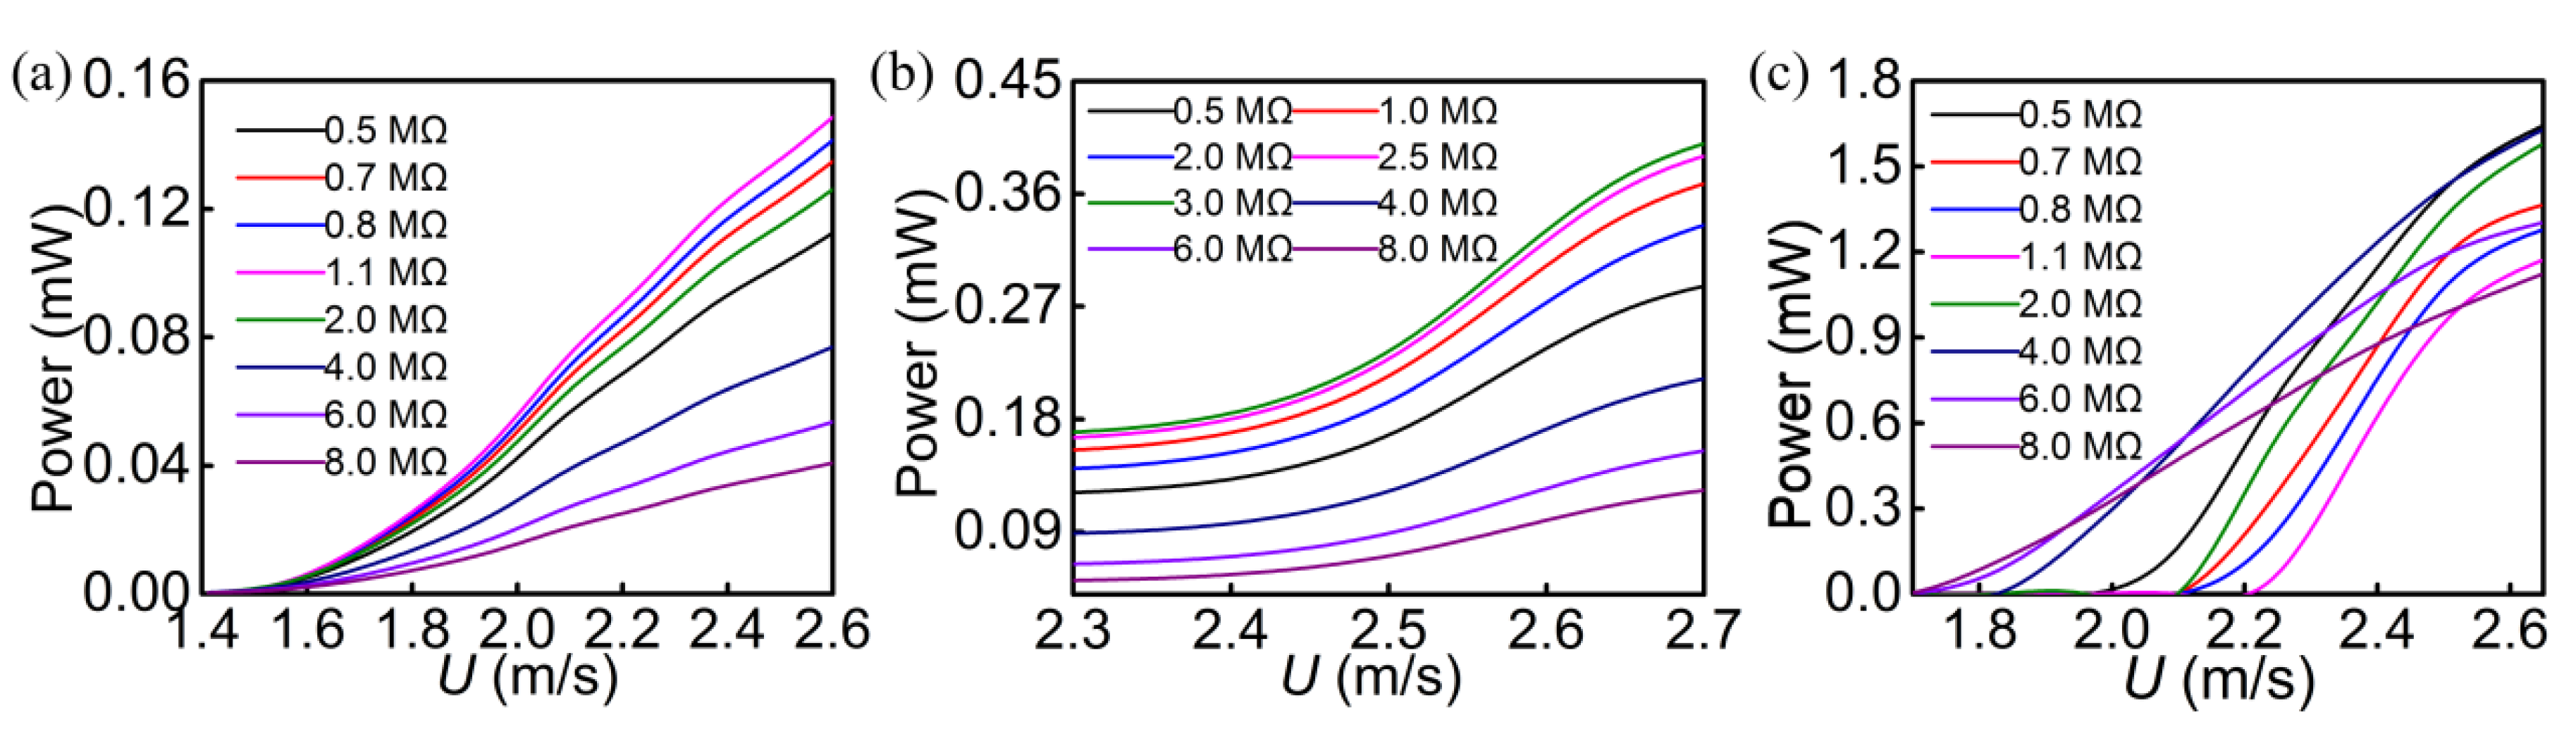
Figure 8.
Variation of numerical displacement with the load resistance: (a) weak coupling k2/(4ζ + 4ζ2) = 0.029; (b) critical coupling k2/(4ζ + 4ζ2) = 1; (c) strong coupling k2/(4ζ + 4ζ2) = 2.9.
Figure 8.
Variation of numerical displacement with the load resistance: (a) weak coupling k2/(4ζ + 4ζ2) = 0.029; (b) critical coupling k2/(4ζ + 4ζ2) = 1; (c) strong coupling k2/(4ζ + 4ζ2) = 2.9.

Figure 9.
Numerical displacement versus wind speed: (a) Weak coupling k2/(4ζ + 4ζ2) = 0.029; (b) critical coupling k2/(4ζ + 4ζ2) = 1; (c) strong coupling k2/(4ζ + 4ζ2) = 2.9.
Figure 9.
Numerical displacement versus wind speed: (a) Weak coupling k2/(4ζ + 4ζ2) = 0.029; (b) critical coupling k2/(4ζ + 4ζ2) = 1; (c) strong coupling k2/(4ζ + 4ζ2) = 2.9.


Table 1.
Values of system aerodynamic parameters and a1, a3.
| U | λ/Keff | (−1/2)ρSU2 | a1 | a3 |
|---|---|---|---|---|
| 1.276 | 0.62 | −0.0038 | 2.4 | −35 |
| 1.413 | 0.62 | −0.0046 | 2.4 | −28 |
| 1.550 | 0.62 | −0.0055 | 2.3 | −21 |
| 1.687 | 0.62 | −0.0066 | 2.4 | −24 |
| 1.824 | 0.62 | −0.0077 | 2.6 | −24 |
| 1.961 | 0.62 | −0.0089 | 2.8 | −23 |
| 2.098 | 0.62 | −0.0101 | 2.9 | −20 |
| 2.235 | 0.62 | −0.0115 | 3.0 | −20 |
| 2.372 | 0.62 | −0.0130 | 3.0 | −19 |
| 2.509 | 0.62 | −0.0145 | 3.0 | −19 |
| 2.646 | 0.62 | −0.0161 | 3.0 | −19 |
Table 2.
Parameters of the harvester.
| Material and Physical Properties | Symbol | Numerical Value |
|---|---|---|
| The effective length of the cantilever beam/m | La | 0.14 |
| Bluff body diameter/m | d | 0.032 |
| The length of the bluff/m | L | 0.12 |
| Equivalent mass/kg | Meff | 5.15 × 10⁻³ |
| width of the PTC /m | Lb | 0.004 |
| The system damping/N·s·m−1 | Ceff | 7.6 × 10⁻³ |
| The system stiffness/N·m−1 | Keff | 17.21 |
| Damping ratio | ζ | 0.013 |
| Natural frequency/Hz | fn | 9.2 |
© 2019 by the authors. Licensee MDPI, Basel, Switzerland. This article is an open access article distributed under the terms and conditions of the Creative Commons Attribution (CC BY) license (http://creativecommons.org/licenses/by/4.0/).
Share and Cite
MDPI and ACS Style
Wang, J.; Li, G.; Zhou, S.; Litak, G. Enhancing Wind Energy Harvesting Using Passive Turbulence Control Devices. Appl. Sci. 2019, 9, 998. https://doi.org/10.3390/app9050998
AMA Style
Wang J, Li G, Zhou S, Litak G. Enhancing Wind Energy Harvesting Using Passive Turbulence Control Devices. Applied Sciences. 2019; 9(5):998. https://doi.org/10.3390/app9050998
Chicago/Turabian StyleWang, Junlei, Guoping Li, Shengxi Zhou, and Grzegorz Litak. 2019. "Enhancing Wind Energy Harvesting Using Passive Turbulence Control Devices" Applied Sciences 9, no. 5: 998. https://doi.org/10.3390/app9050998
Note that from the first issue of 2016, this journal uses article numbers instead of page numbers. See further details here.