Article

Exploring the Utility of 3-D-printed Laboratory Equipment

1
Department of Agricultural and Biological Engineering, School of Mechanical Engineering, Purdue University, West Lafayette, IN 47907, USA
2
Applied Optics Laboratory, School of Mechanical Engineering, Purdue University, West Lafayette, IN 47907, USA
*
Author to whom correspondence should be addressed.
Appl. Sci. 2019, 9(5), 937; https://doi.org/10.3390/app9050937
Submission received: 5 February 2019 / Revised: 19 February 2019 / Accepted: 27 February 2019 / Published: 6 March 2019
(This article belongs to the Section Mechanical Engineering)

Abstract

:
Many laboratories utilize different types of opto-mechanical positioning devices in their experiments. Such devices include lateral stages, which provide 1-dimenstional translational movement, 3-dimensional translation stages, and laboratory jacks, which provide a convenient way of changing the vertical position of a sample. Recent advances in and affordability of 3-D printing have opened up a variety of possibilities, not only providing versatile and custom-designed laboratory equipment but also reducing the cost of constructing typical laboratory opto-mechanical positioning stages. Here, we present the possibility of printing typical linear stages, thereby constructing a full XYZ stage. In addition, a vertical laboratory jack, which utilizes a scissor format, has also been printed using polylactic acid (PLA) filament. The design of these systems required modeling the strength of material to estimate the deflection, which was conducted by finite element analysis. The effectiveness of the proposed 3-D-printed positioning devices was tested by measuring the stroke and the repeatability. As an example of application, a multispectral reflection imaging device was constructed with the help of 3-D-printed linear stages and a laboratory scissor jack.

Graphical Abstract

1. Introduction

3-D printing has been widely accepted as a new tool to expedite time-consuming experimental processes, which often require custom-designed equipment, unique sample holders, and special types of motion controllers [1]. Conventional procedure requires machining or manufacturing a design prototype that needs to be tested on the experiment. This is an iterative process sometimes requiring multiple trials. Applications of 3-D printing range from conventional opto-mechanical lab experiments [2,3], biomedical applications, which include dental and special instruments [2,4,5,6,7,8], to biological and pharmaceutical experiments, which require a wet laboratory [9,10,11,12]. For these applications, laboratory translation stages are a common piece of equipment used to accurately position samples and instruments. The precise motion of the stages enables researchers to adjust the relative position of the sample and instrument with respect to Cartesian coordinates, as well as to collect more data in different positions and conditions without disassembling and recalibrating the whole system. Among all the stages, XYZ translation linear stages are most commonly used. This stage can position samples or instruments linearly in 3 dimensions. While maintaining a high standard accuracy, this type of stage is also user friendly; the user can simply turn three handles to translate the stage with precision in 3 dimensions. However, prices for XYZ translation linear stages are high, even unaffordable for some labs. The cost of a one-dimension linear stage is over $100, while that for an XYZ three-dimension one will exceed $500.
To provide better affordability and wider usage of linear stages, a 3-D printing method can be used. The advantages of 3-D printing include but are not limited to reducing the complexity of product manufacturing, shortening production time and improving efficiency, reducing product manufacturing processes, and allowing immediate production [13,14,15]. These points make possible the production of laboratory XYZ translation linear stages by 3-D printing, as well as reducing the unit cost per stage. Another widely used piece of laboratory equipment is a laboratory scissors jack. This is a lifting stage that can lift heavier weights and provide longer strokes compared to a typical vertical stage; common laboratory jacks can adjust height from 5 cm to 20 cm. They contain platforms to hold experiment material, a scissors-like system to achieve up-down movement and a central screw to allow manual adjustment. A suitable laboratory jack requires reasonable load capacity, movement accuracy, and operational feasibility. Based on the above criteria, this project provides several new solutions for XYZ linear stages and laboratory scissor jacks by the 3-D printing method. These solutions include 2-in2 and 3-in2 XYZ linear stage systems and a 4-in2 laboratory jack. All these stage systems benefit users, especially researchers in labs, by providing great alternatives for expensive commercial laboratory linear stages. The use of Computer Aided Design (CAD) design and 3-D printing methods for these stage systems not only significantly reduces the cost per system, but also enables users to revise the design themselves to obtain the special functions they need and then puts the design into production immediately.

2. Material and methods

2.1. Linear Stages

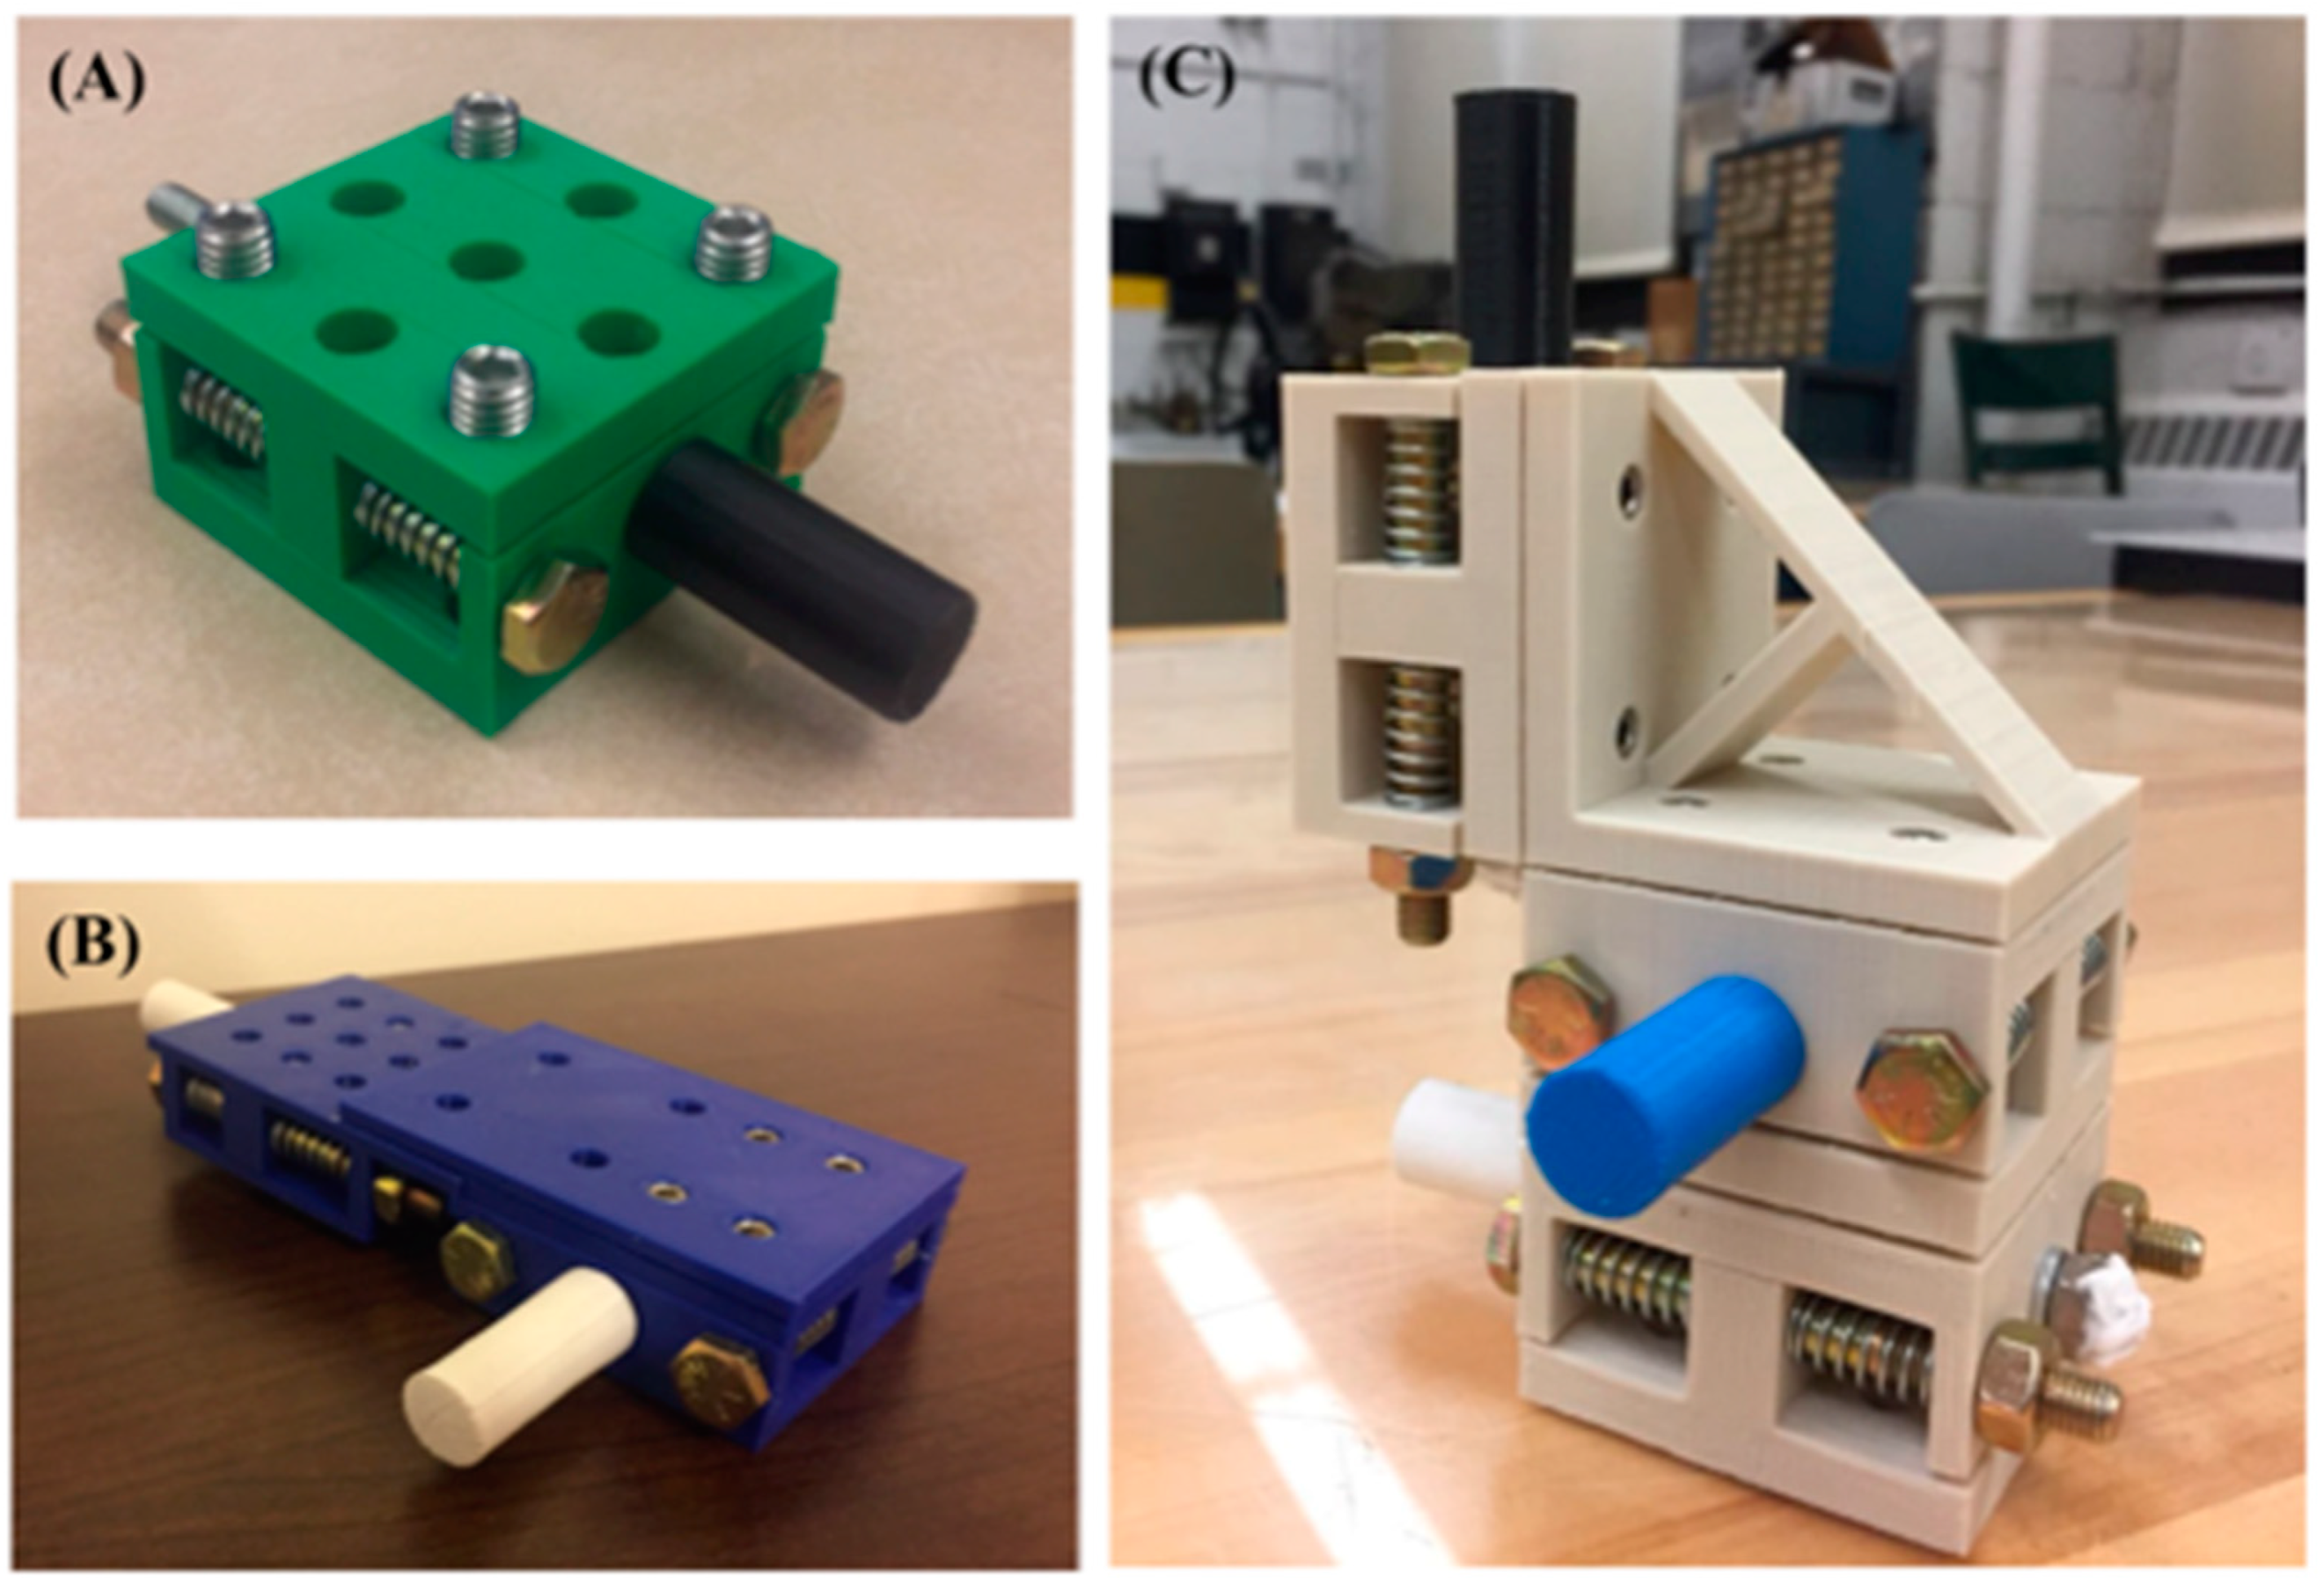
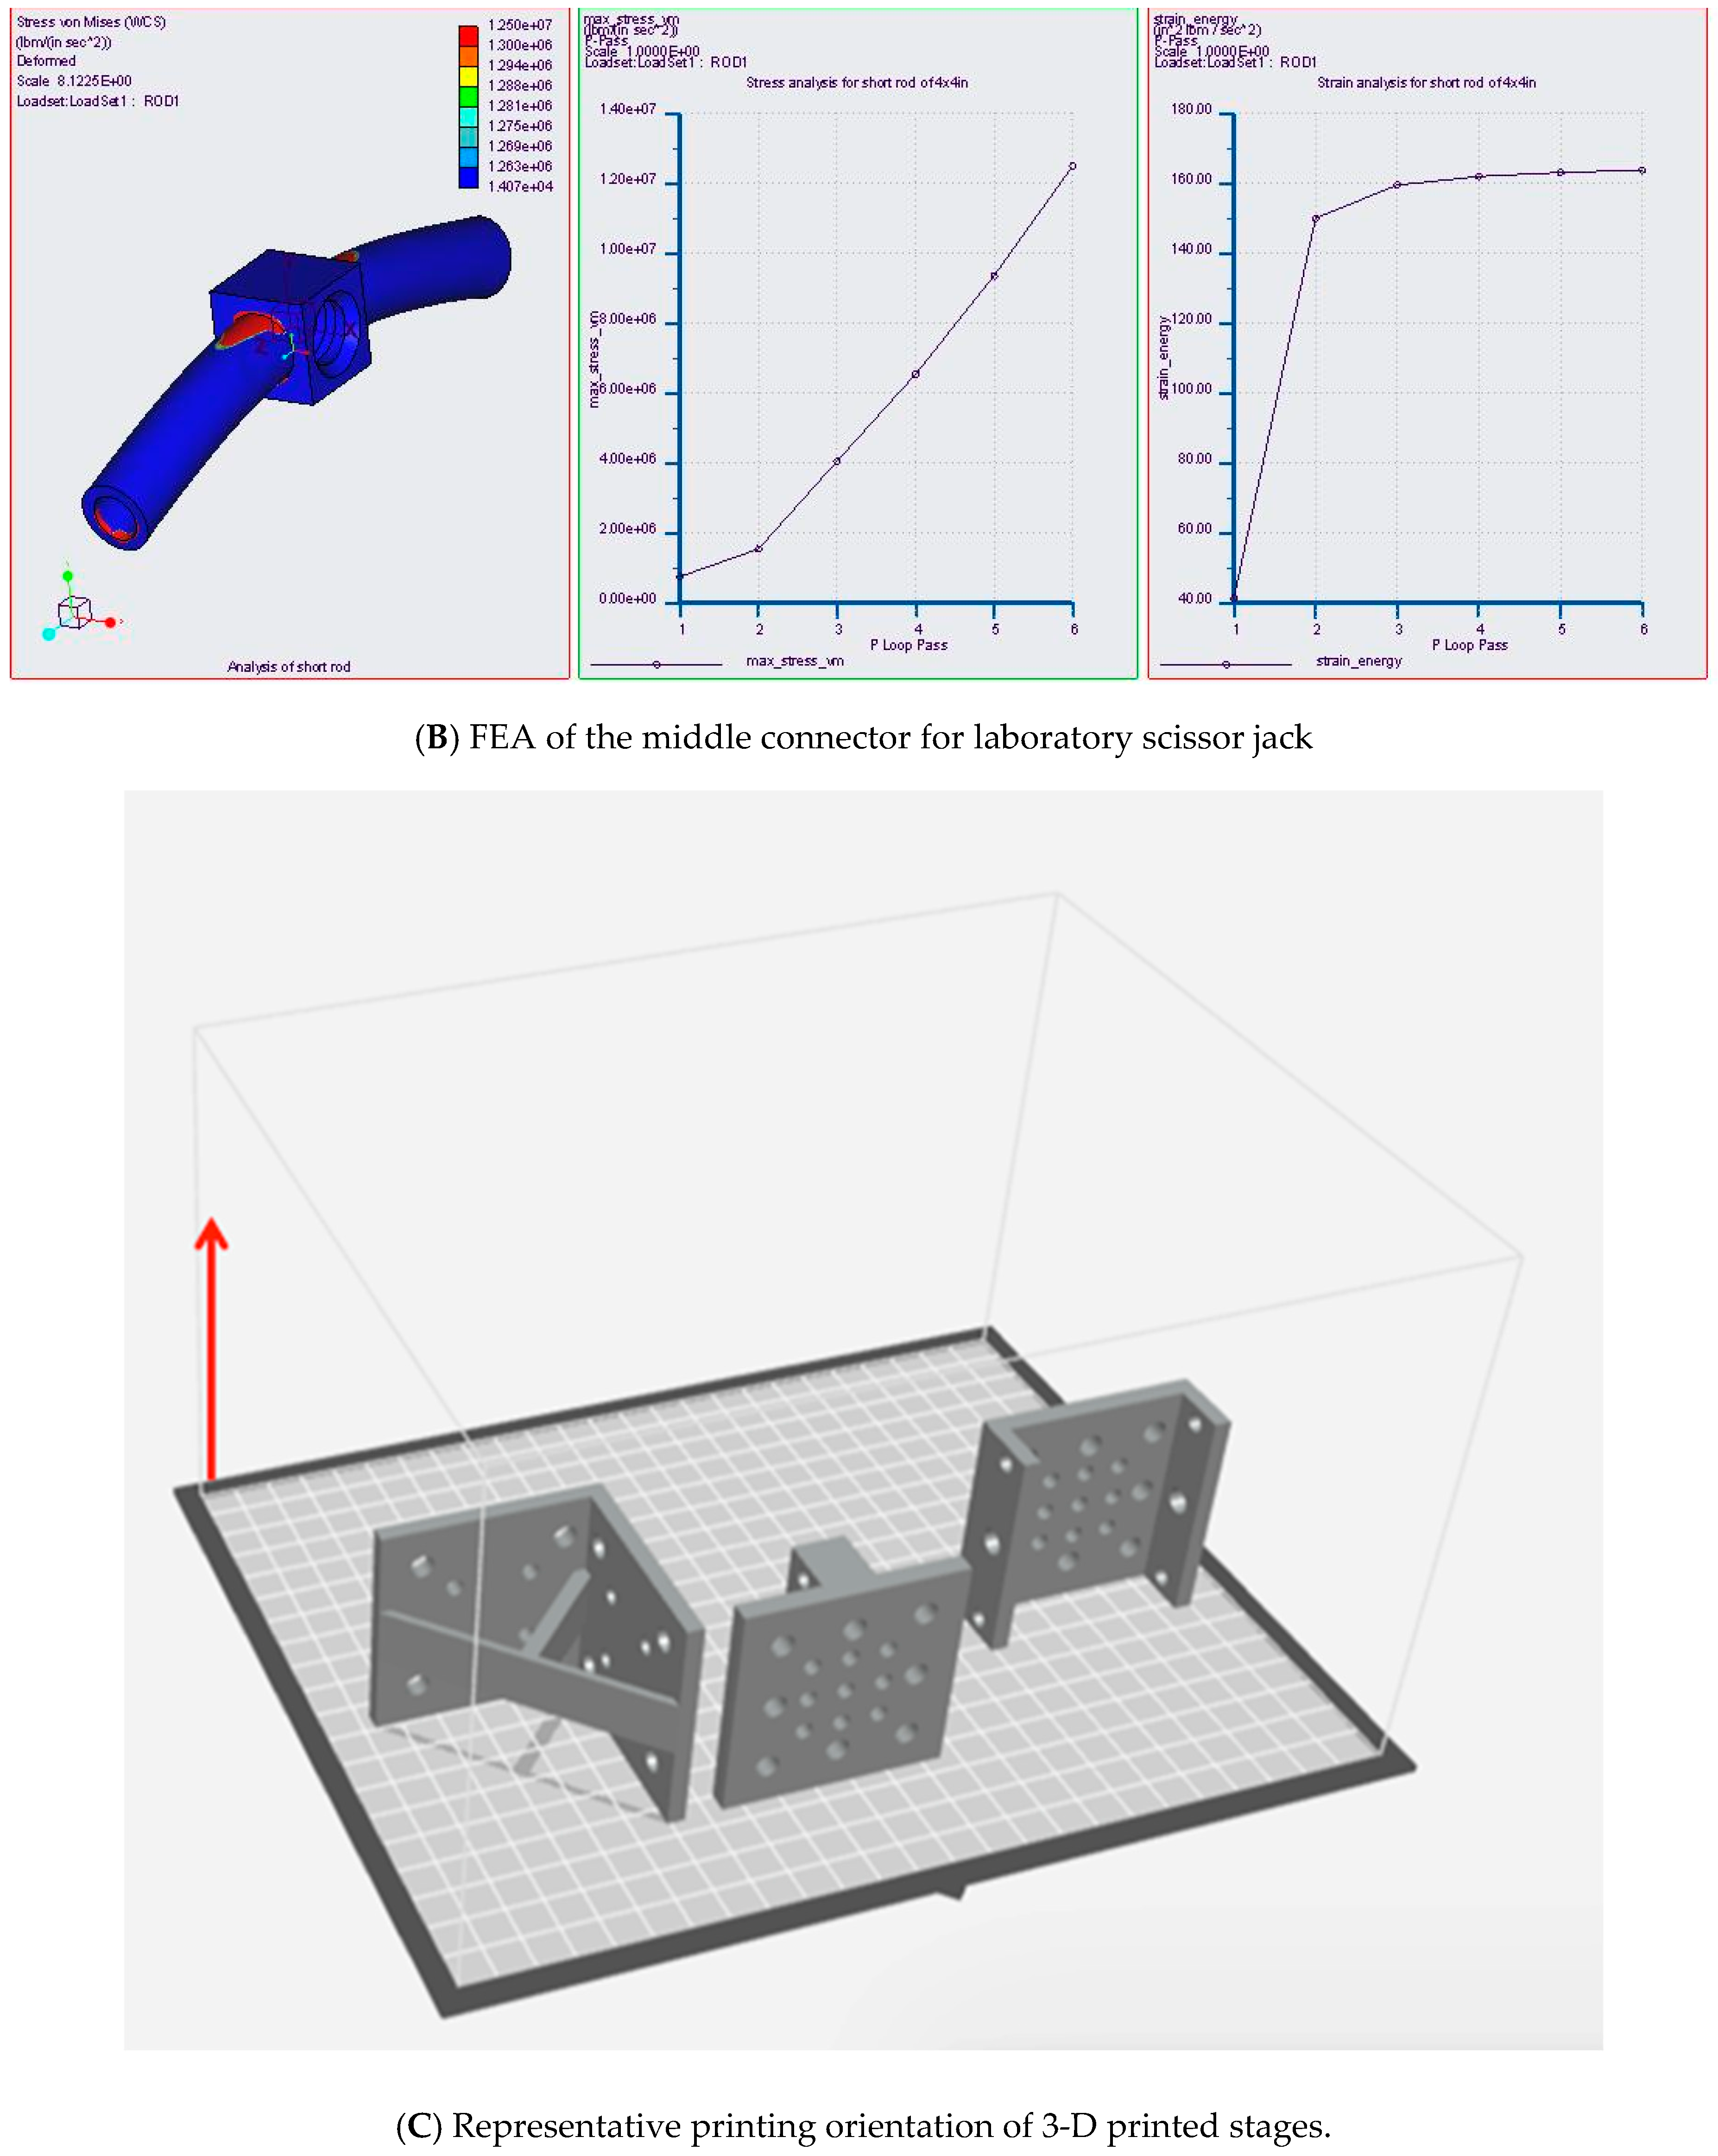
CREO CAD software (Version 4.0, PTC Inc., Needham, MA, USA) was used to design and create the 3-D models of the stages for 3-D model design as well as its possession of several default analysis functions such as stress/strain and motion analysis. In this project, CREO commands such as Extrude, Holes, Pattern, and Mirror have been used to assemble the parts and simulate practical using conditions. To conduct stress analysis and quality assurance, the multi-pass Finite Element Analysis (FEA) function was used. After the analysis design file was exported in STL format, parts were printed using a Makerbot 3-D printer (Model MakerBot Replicator+, MakerBot Industries, LLC, Brooklyn, NY, USA) with 10% infill and hexagonal patterns while temperatures were set to 210–230 °C. To guarantee the linear motion of the stage, silicone glue was used to fix the nuts and the middle hex bolt together (Figure 1). The materials used for three different stage systems and printing orientations are listed in Table A1 to Table A2 along with total printing time (Table A3 and Table A4); Individual CAD drawings for 3 × 3-in stage and miniature stage were shown Figure A1 and Figure A3. all these materials were purchased in a hardware store.

2.2. Laboratory Scissor Jacks

Parts required for a laboratory scissor jack are as follows: top and bottom platforms, scissors type 1 and type 2, short rods with and without female thread, 12 screws, a handle, and a central threaded rod (shown in Table A5). The top and bottom platforms were designed with CREO. A rectangular platform was designed with a circular holes and a rectangular opening on two sides of surfaces. The circular holes were designed to connect the platform and scissor while the rectangular opening was designed to allow the hinge of the scissors to move freely.
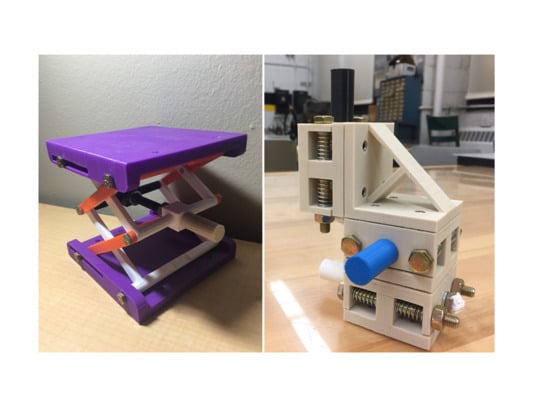
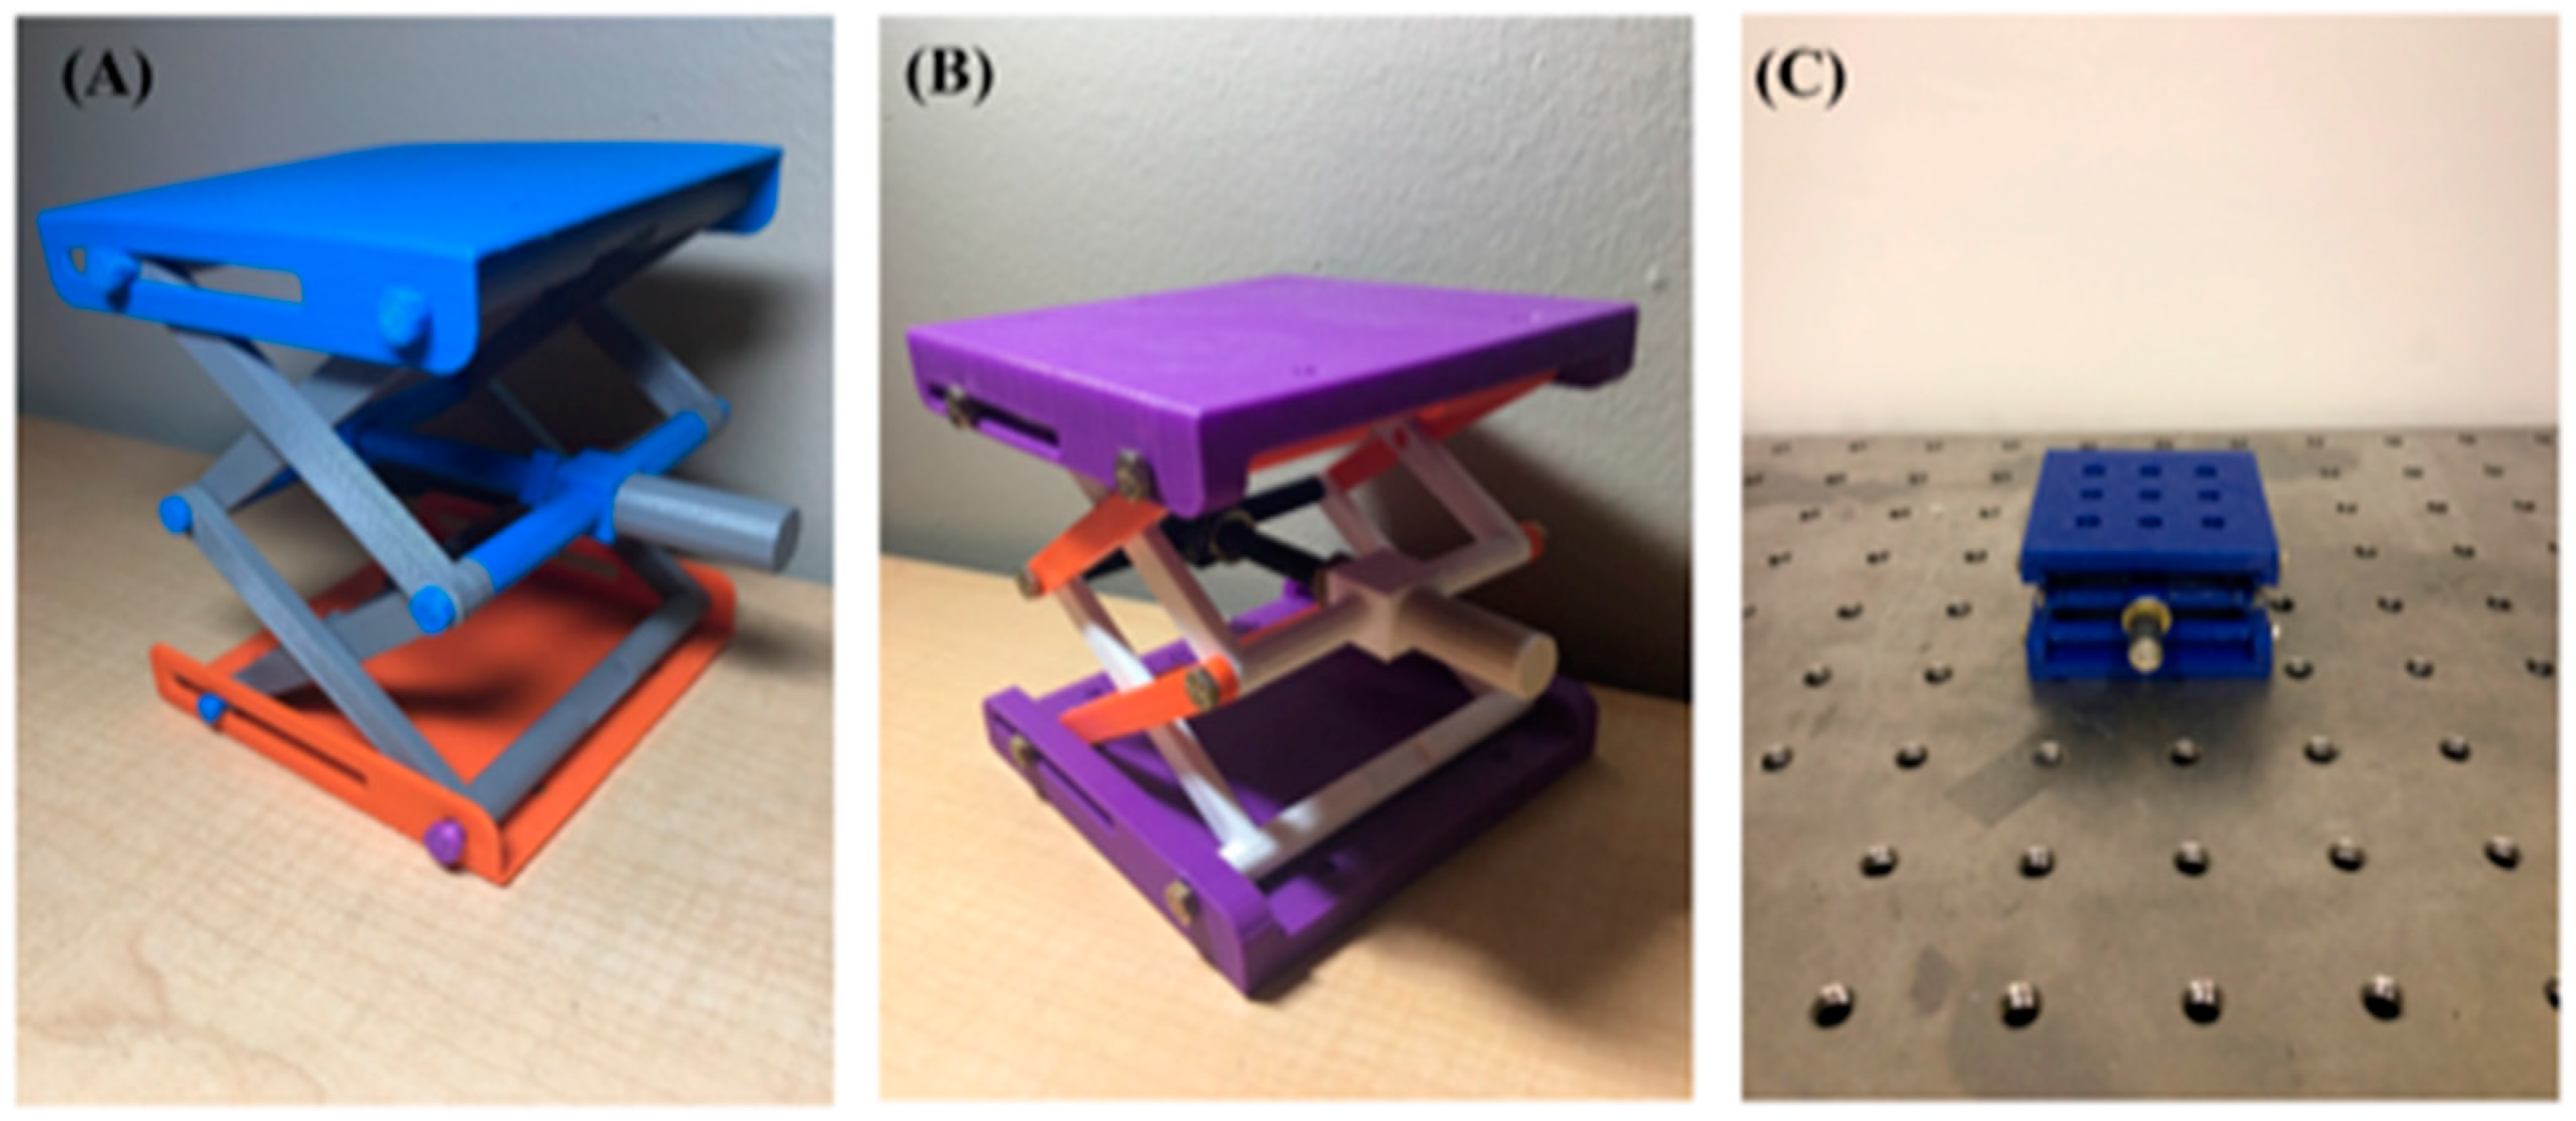
The scissor fixed at the circular hole of the platform is considered as scissor type 1. The central threaded rod was high-strength steel 5’’ long with thread size of 18 threads per inch. Both short rods were fixed by screws at the connection of four scissors. An extreme-strength steel 5/16’’18 hex nut was used on the central threaded rod. For this work, we constructed three different models of a laboratory jack: a full plastic model, called plastic laboratory jack (PLJ), a second model with metal screws, called plastic metal hybrid laboratory jack (PMH-LJ), and a custom-designed miniature laboratory jack for multispectral imaging, called mini laboratory jack (mini-LJ).

2.3. Motion and Displacement Analysis

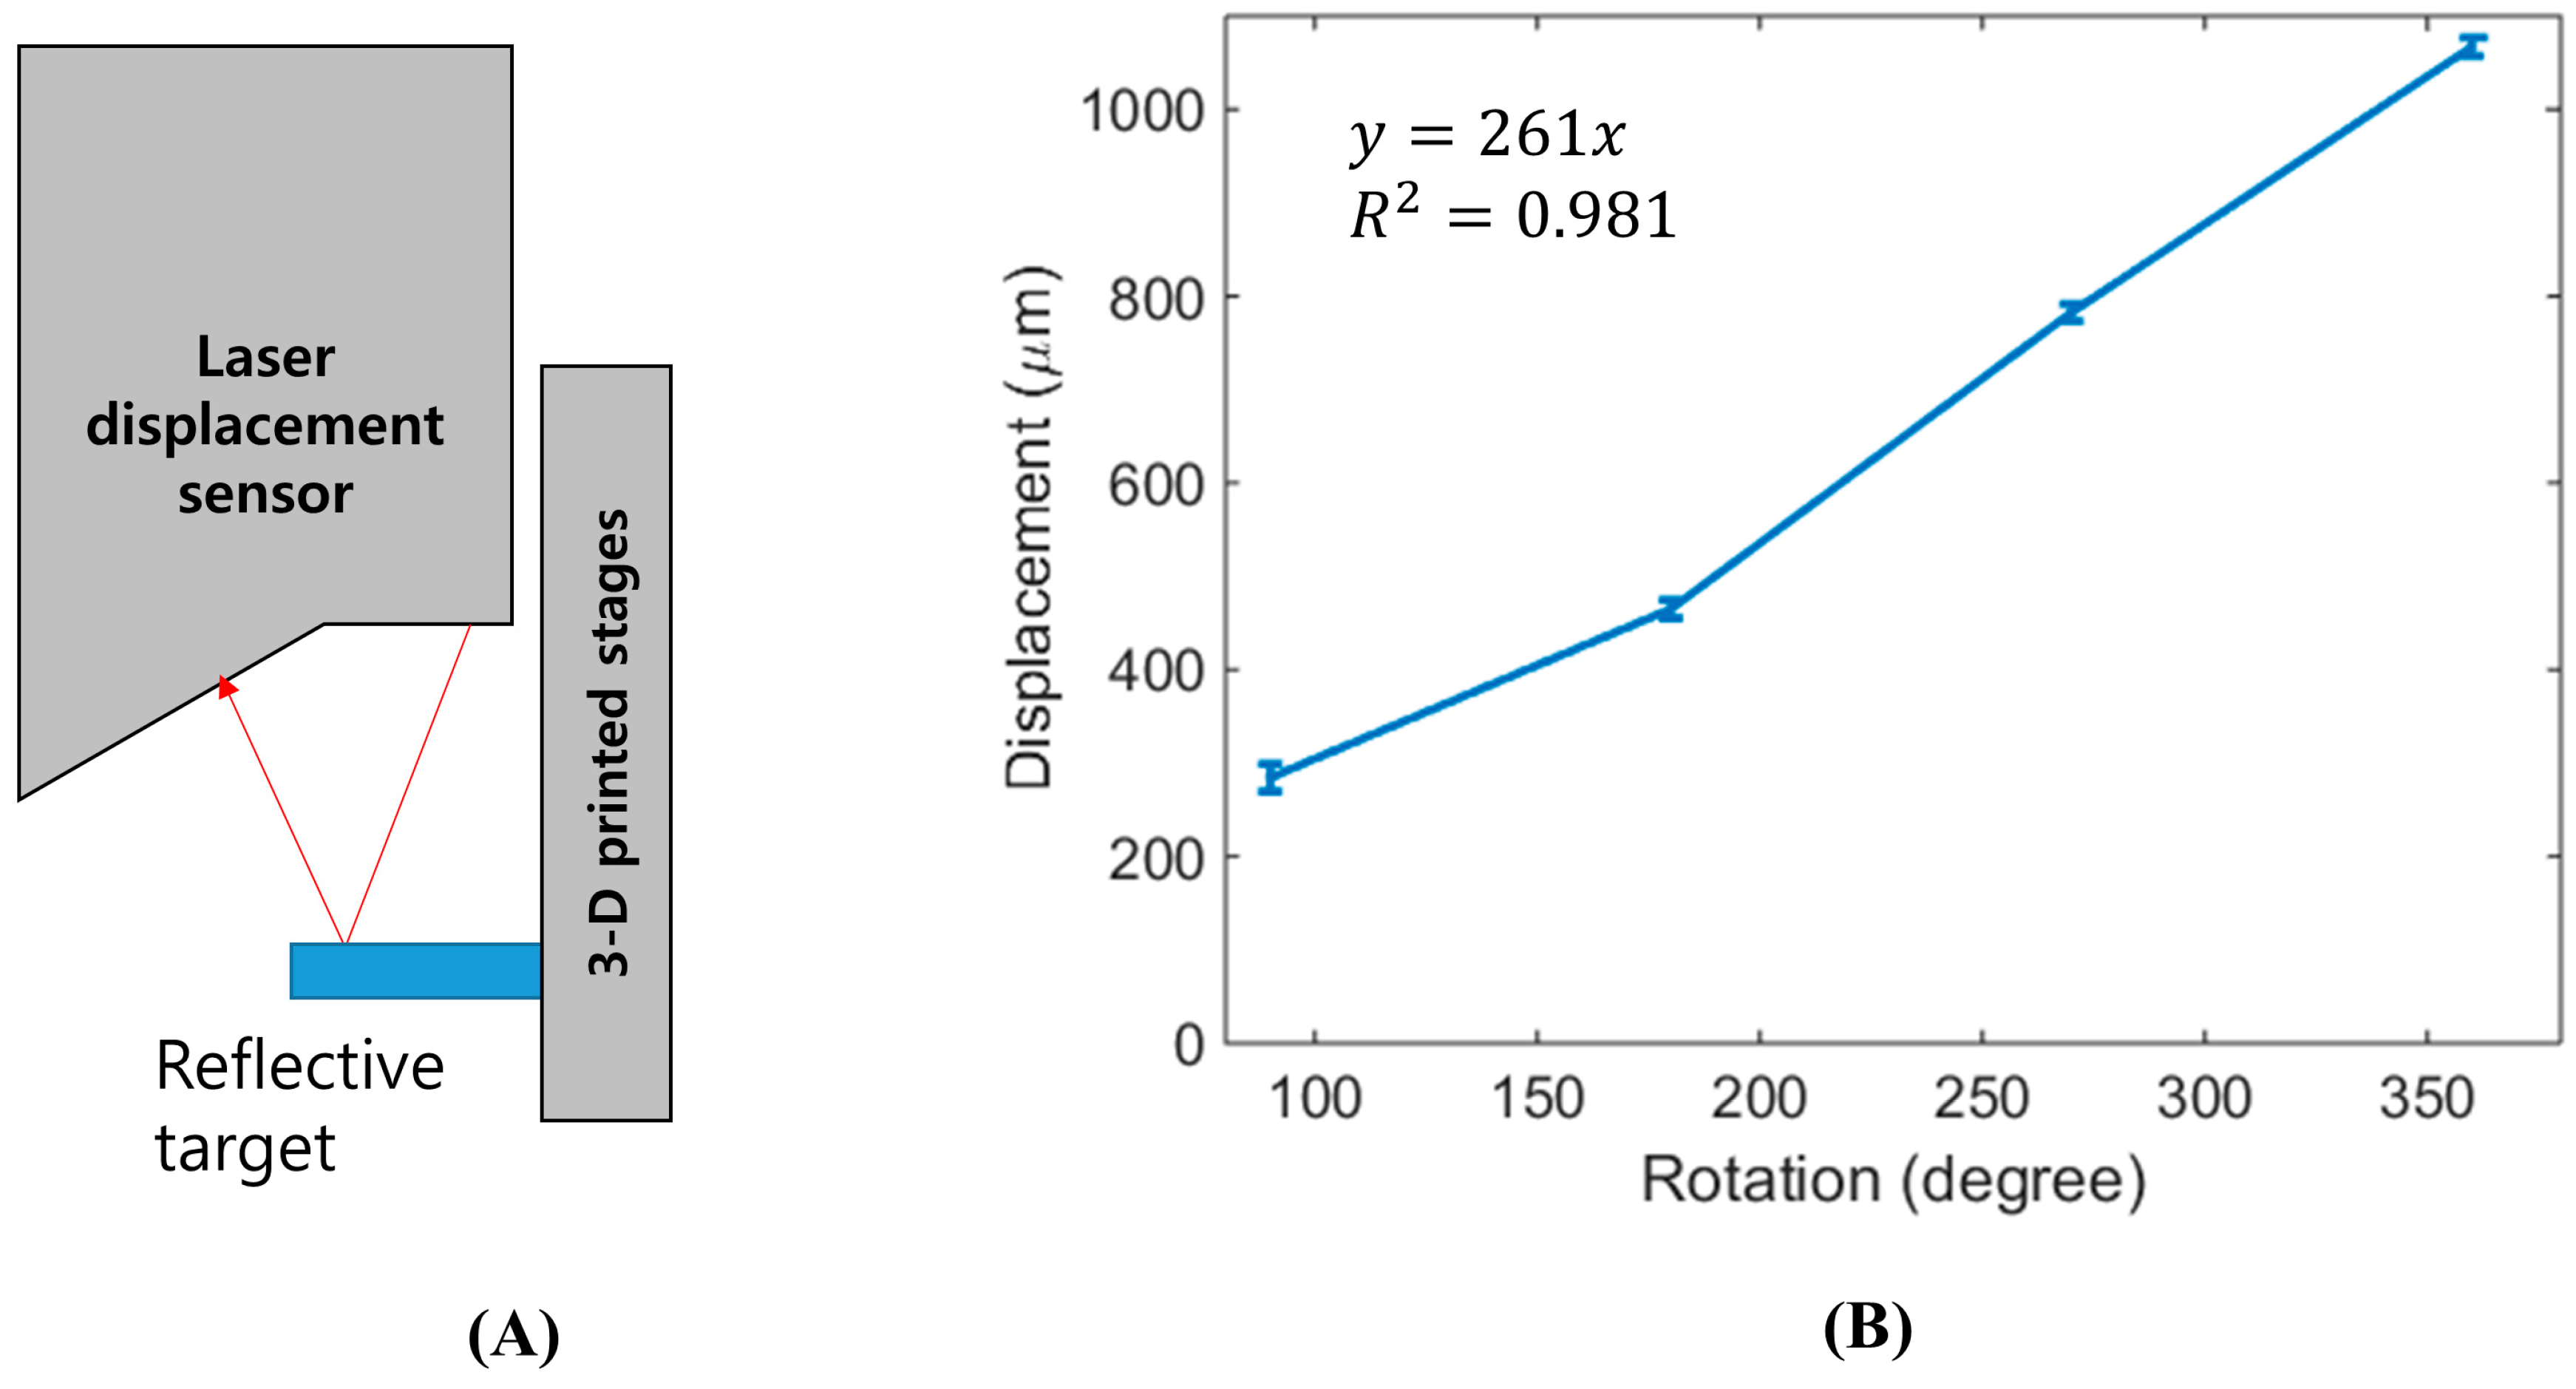
For accurate performance analysis of both linear stages and laboratory jack, a laser displacement sensor (Keyence LT-9010M, Itasca, IL, USA) and a digital caliper (Mitutoyo 500-196, Aurora, IL, USA) were used for accurate measurement. The laser displacement sensor provided 0.1- μ m measurement accuracy within a total range of 600   μ m for the stage movement analysis; the digital caliper provided 10-µm measurement accuracy with 15 cm of total stroke, so all deflection measurements except for the miniature laboratory jacks were conducted with the digital caliper. Each measurement was repeated three times for the statistical report. For linear stages, displacement was measured for rotational angle of the knobs versus linear translation. In addition, linear translation per revolution was continuously measured through the whole stroke. Repeatability tests for stages in both scales were also conducted by turning the stage three revolutions in one direction and then back in the reverse direction while continuously measuring the linear translation per revolution. For the laboratory jack, combinations of calibration masses (Neewer stainless steel set, Amazon, Seattle, WA, USA) were used to generate 100, 200, 500, 700, and 900 g of mass to replicate a vertical load on the jack.

2.4. Computational Analysis

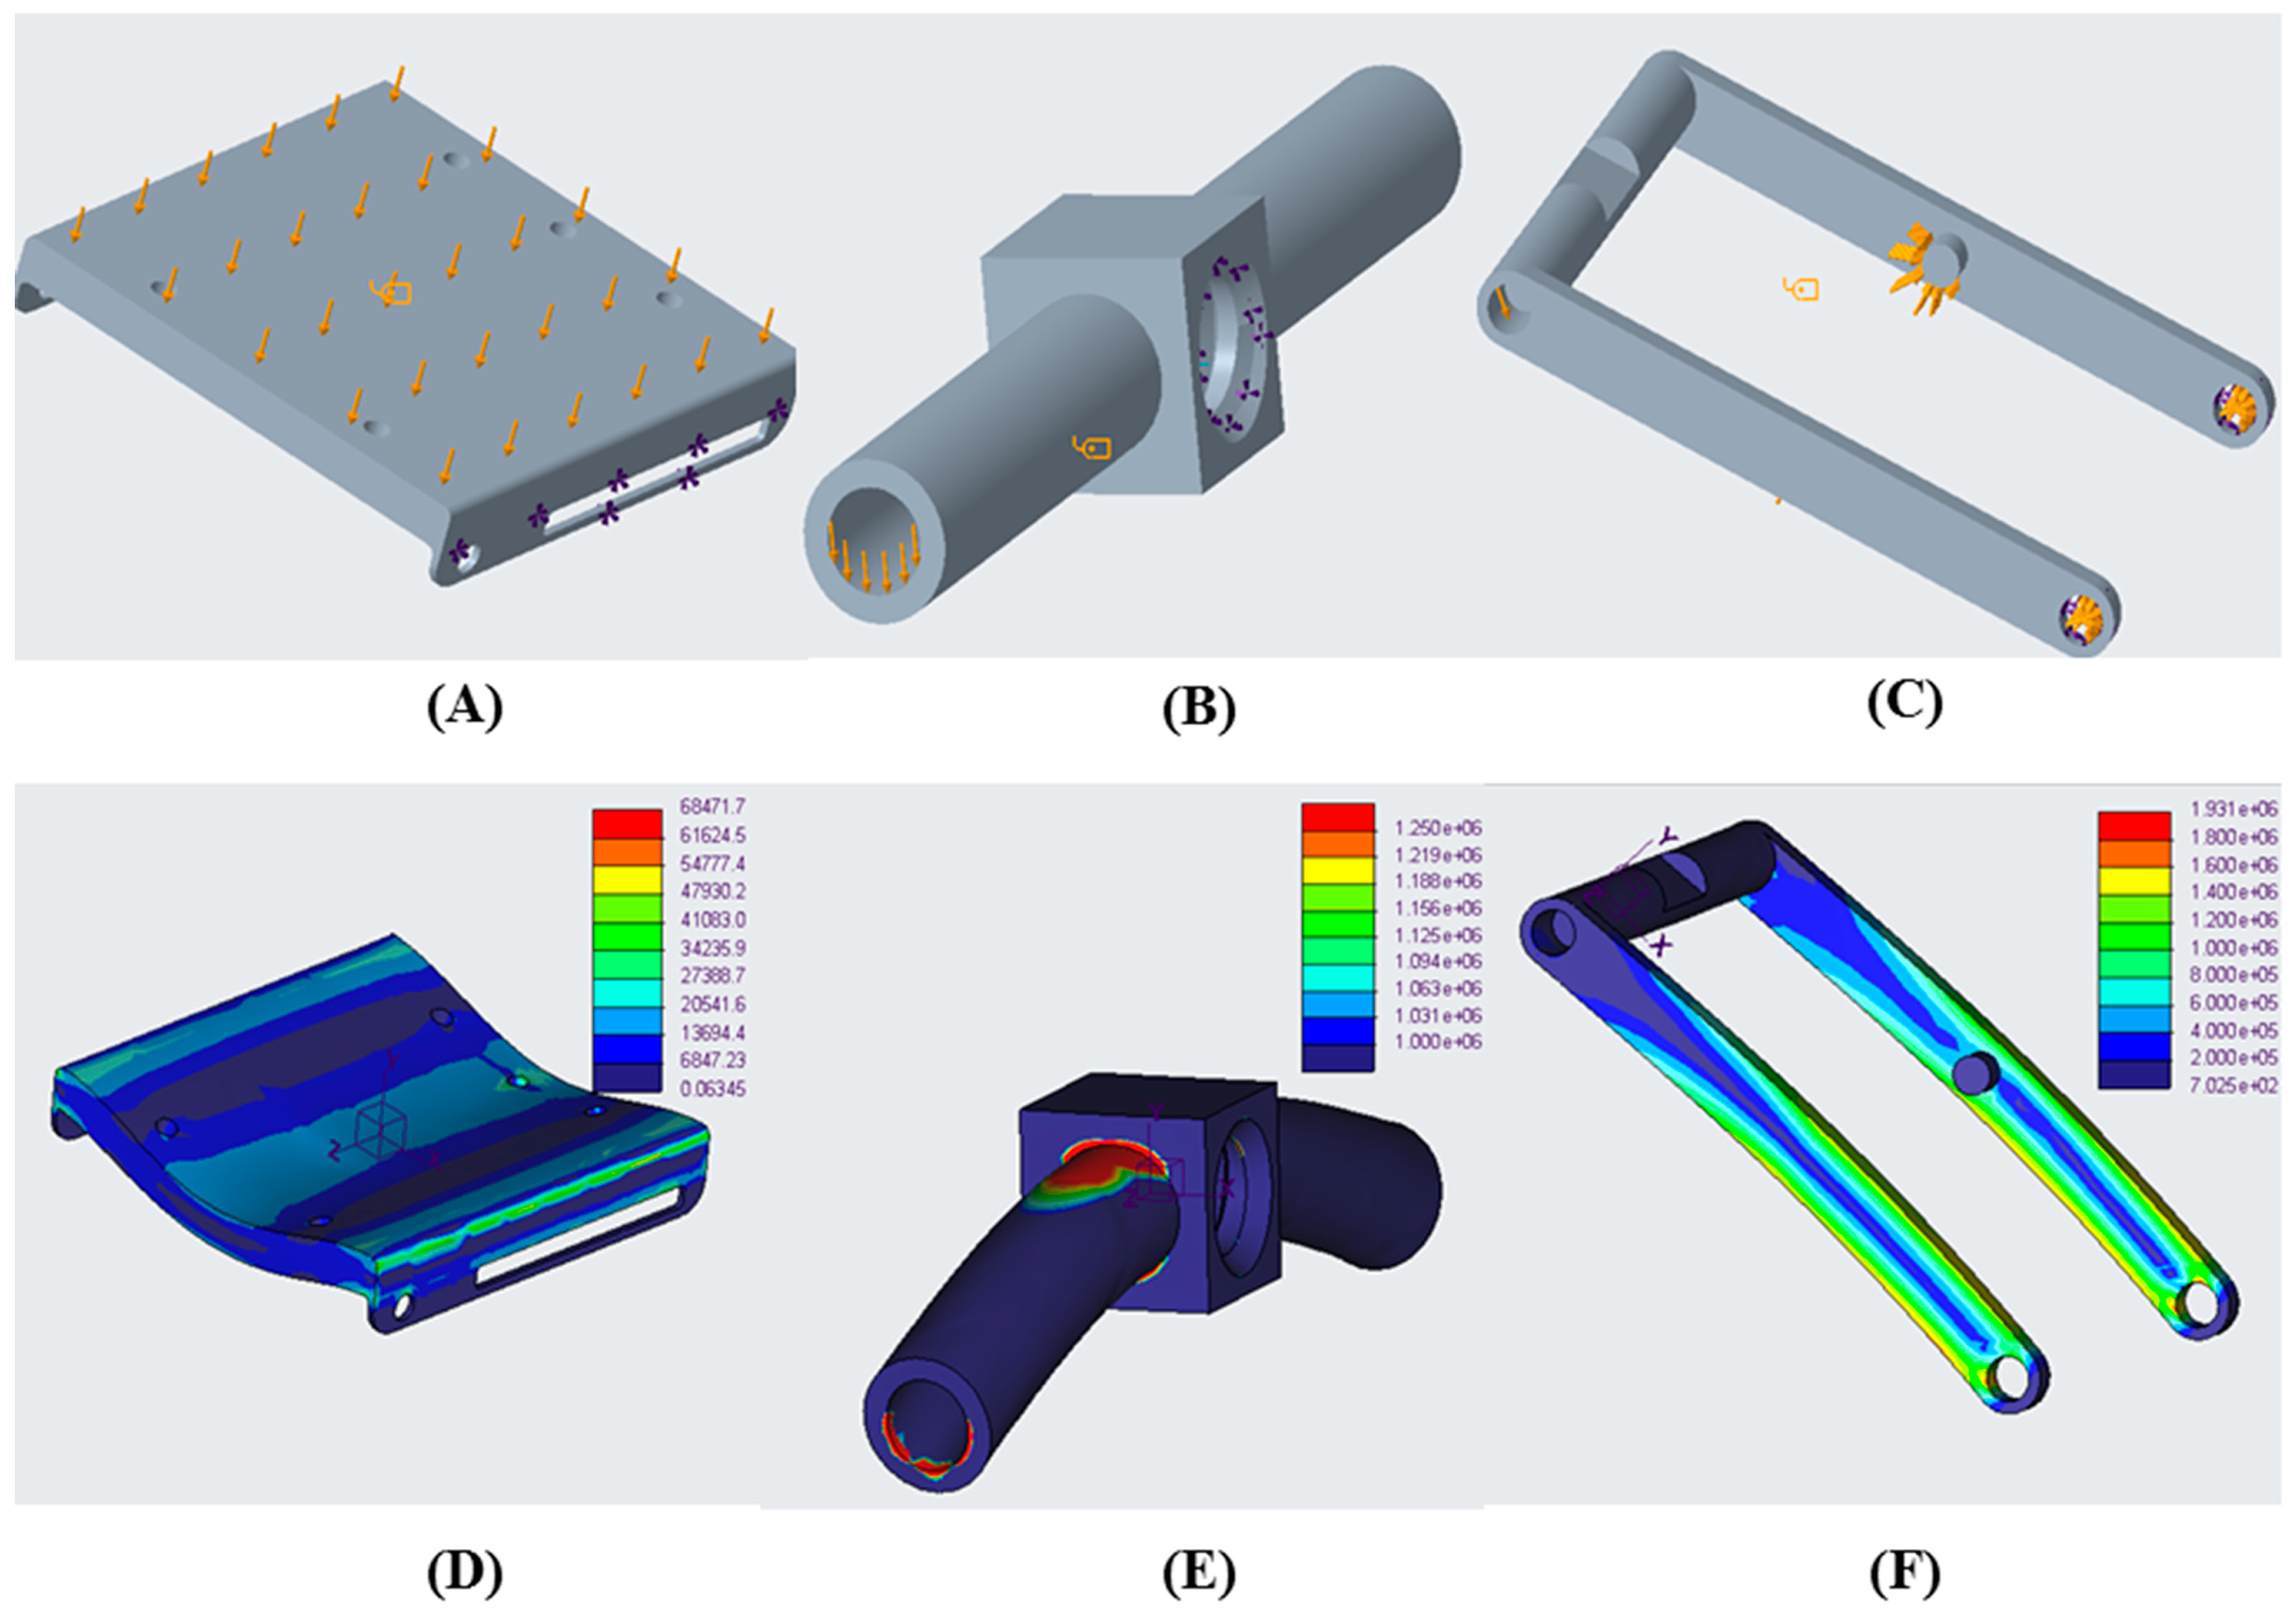
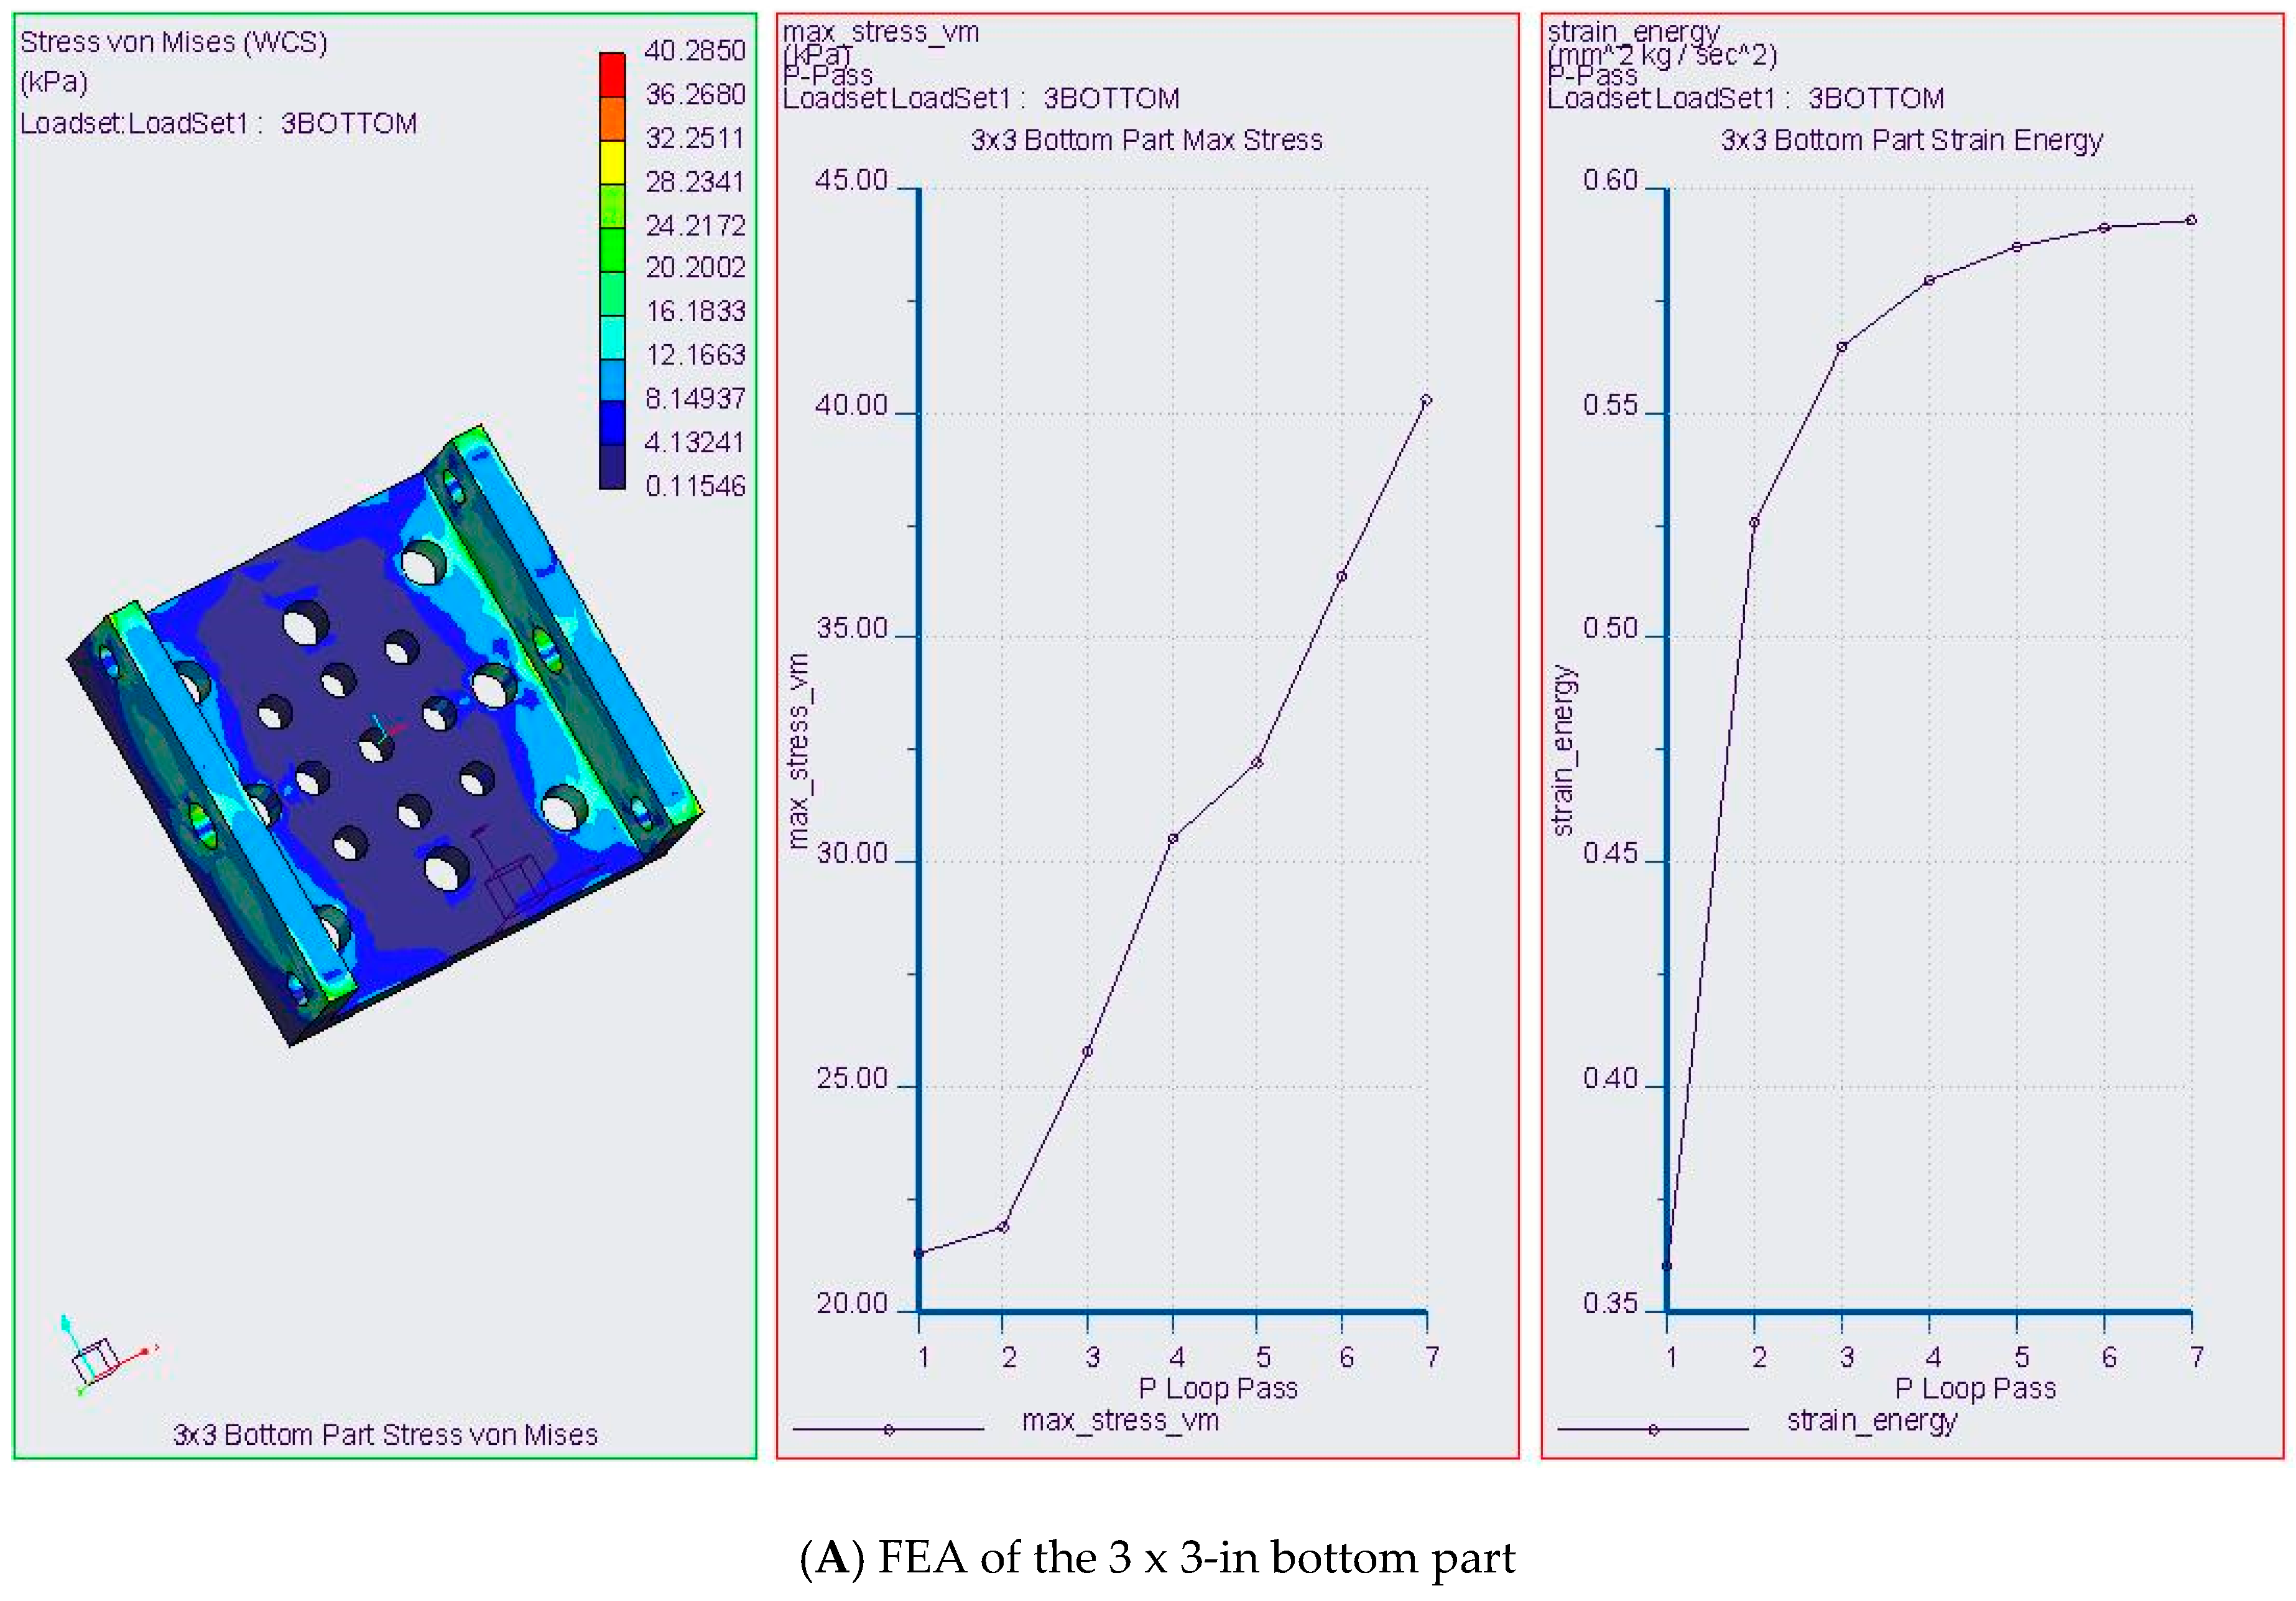
FEA analysis inside CREO 4.0 was used for stress analysis. Since XY stages are placed horizontally on a surface, the major concern regarding stress failure was for the assembled XYZ-stage. For 2 × 2 in stages, the load was assumed to be 10 N (1 kg) as the average day-to-day usage, and the 2.5 N-force (10 N/ 4 holes) was placed vertically and uniformly on each of the four through holes on the top plate. For constraints, all three-dimensional linear motions of this displacement were fixed, while the three directions of rotational motion were set as free. For the 3 × 3-in stages, all methods for placing loads and constraints were the same as for the 2 × 2-in stages; however, the load was assumed to be 20 N (2 kg), and each hole was distributed as 5 N. Additional results and printing direction were summarized in Figure A2.
For laboratory scissor-jack stress analysis, three separate analyses were performed (platform, scissor, and short rod), since 3-D printed parts could potentially deform with large normal stress. For the platform, the load was assumed as 100 N uniformly sitting on the top surface. For the scissors, the load was also assumed as 100 N and placed at the edges of the hole with the direction of 45 degrees with respect to vertical axis. Constraints in this case were holes at the end which are assumed as fixed.

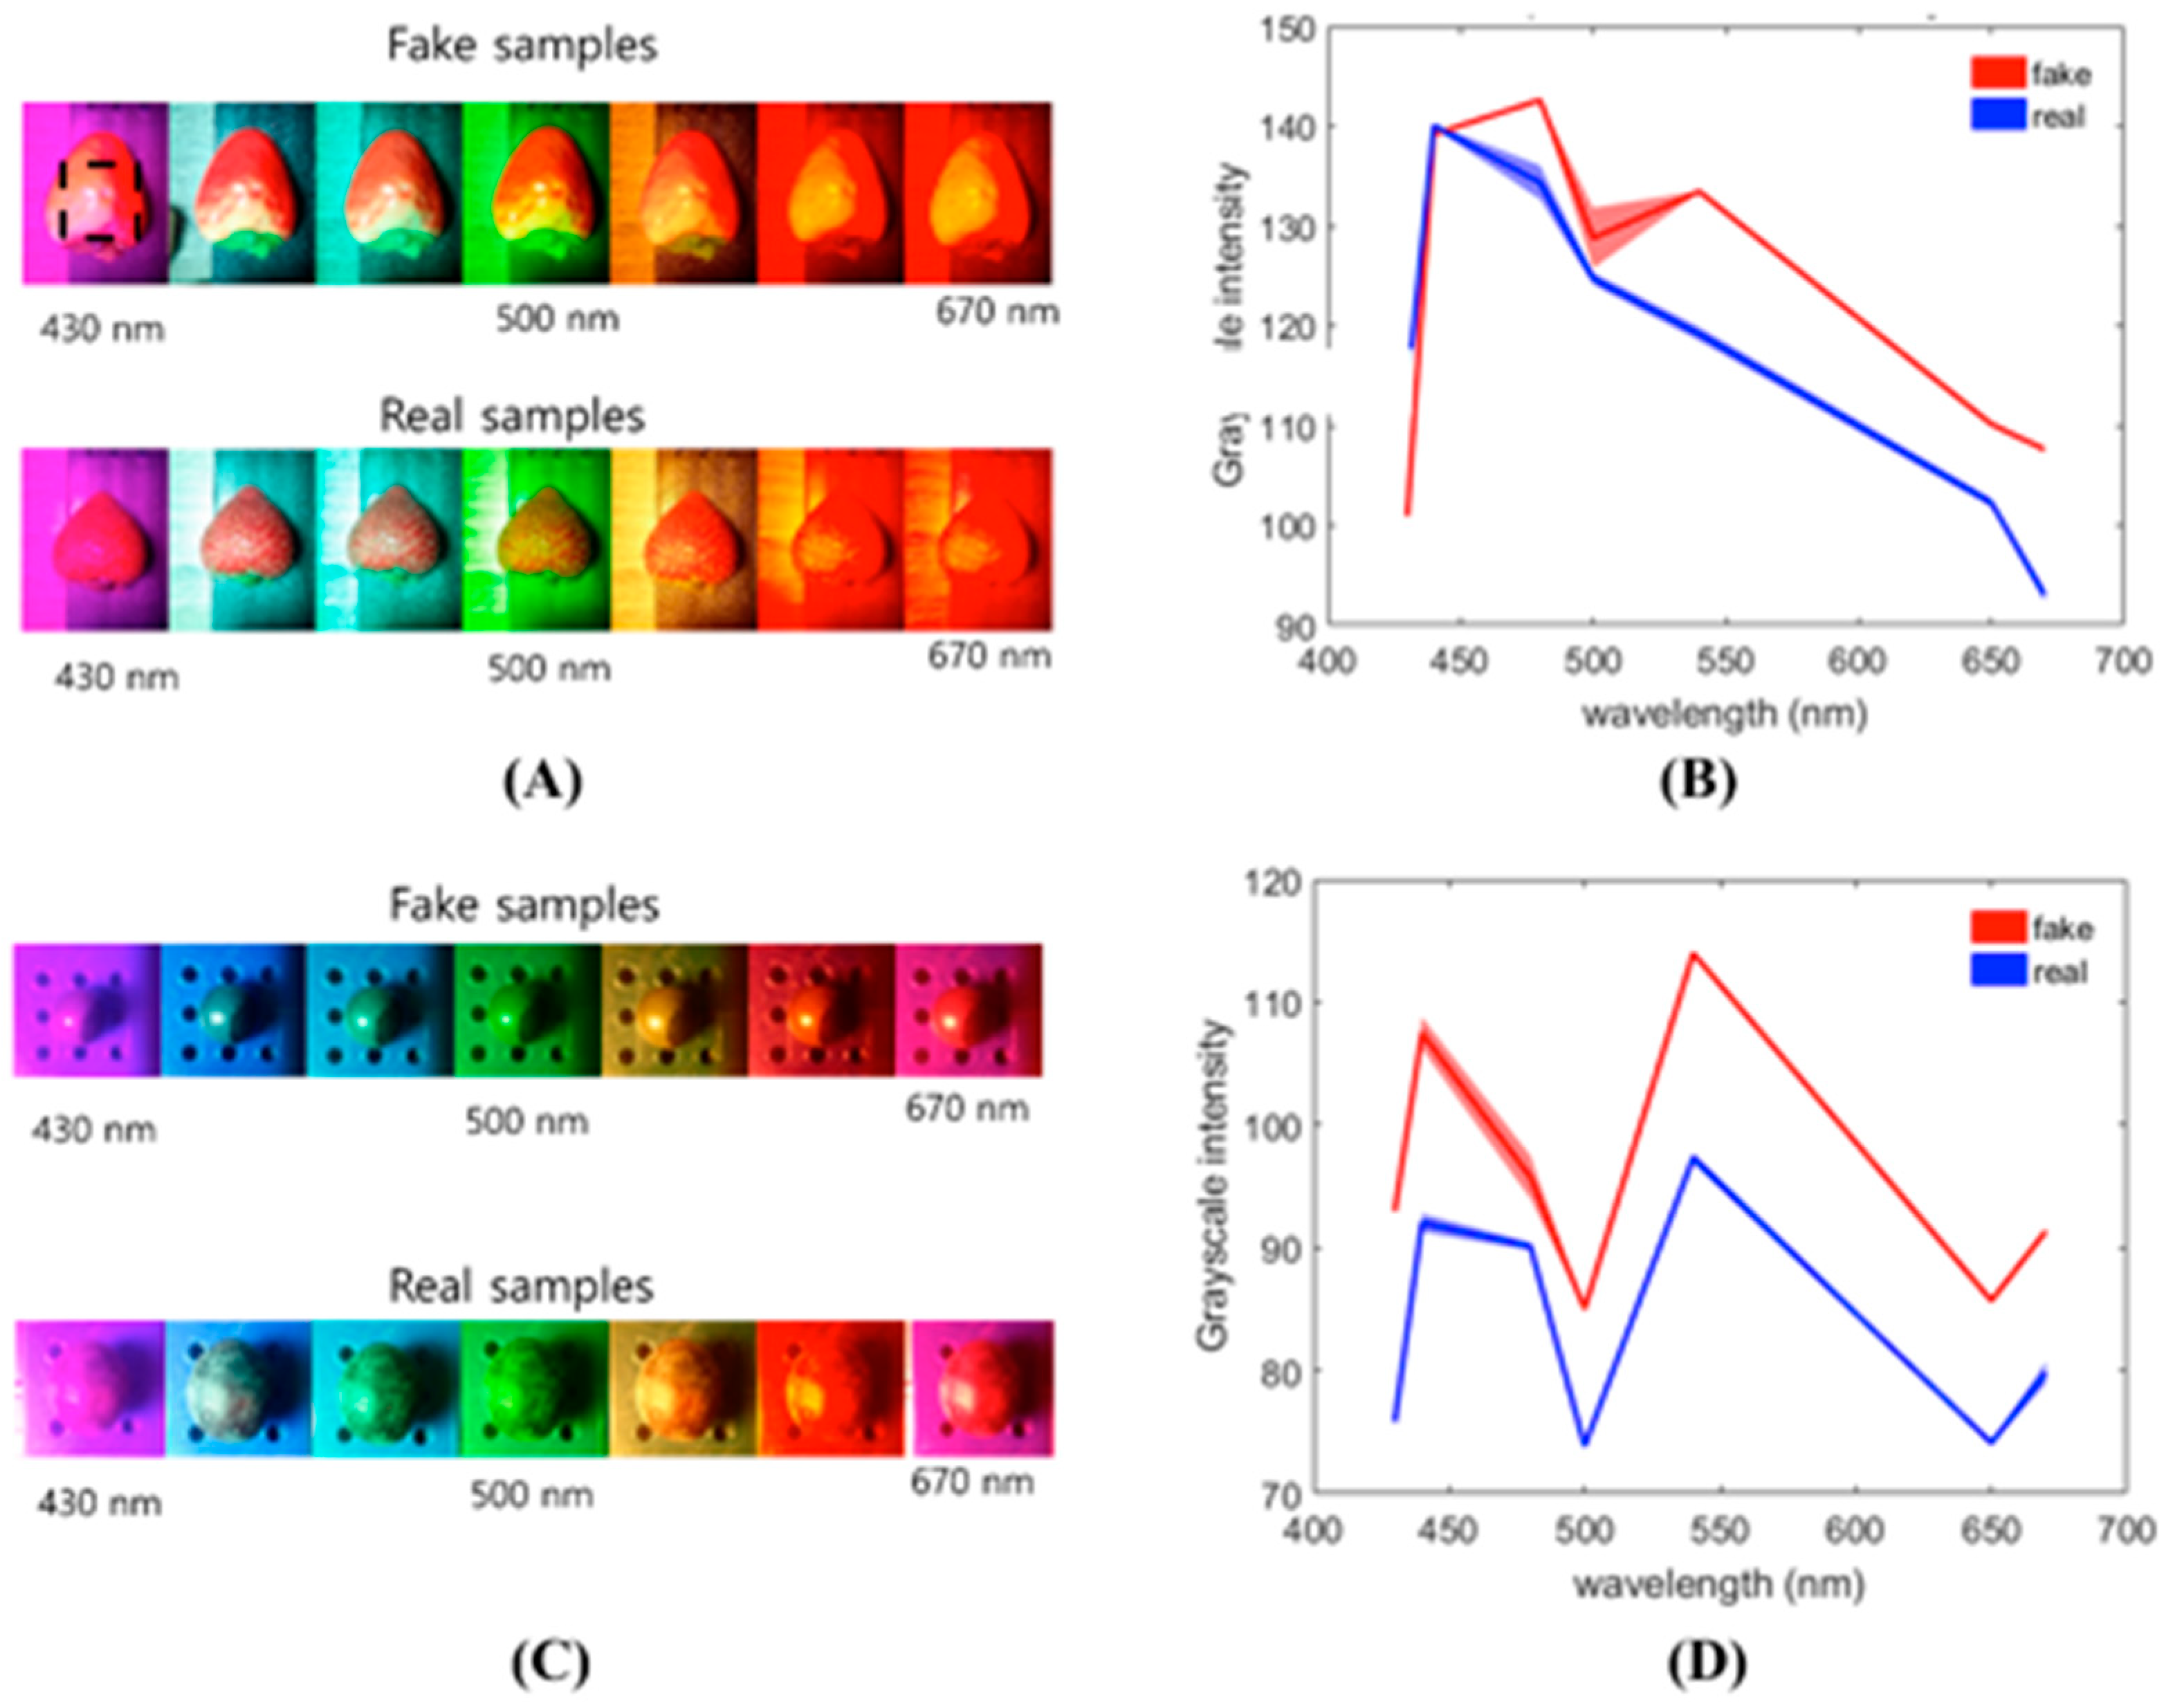
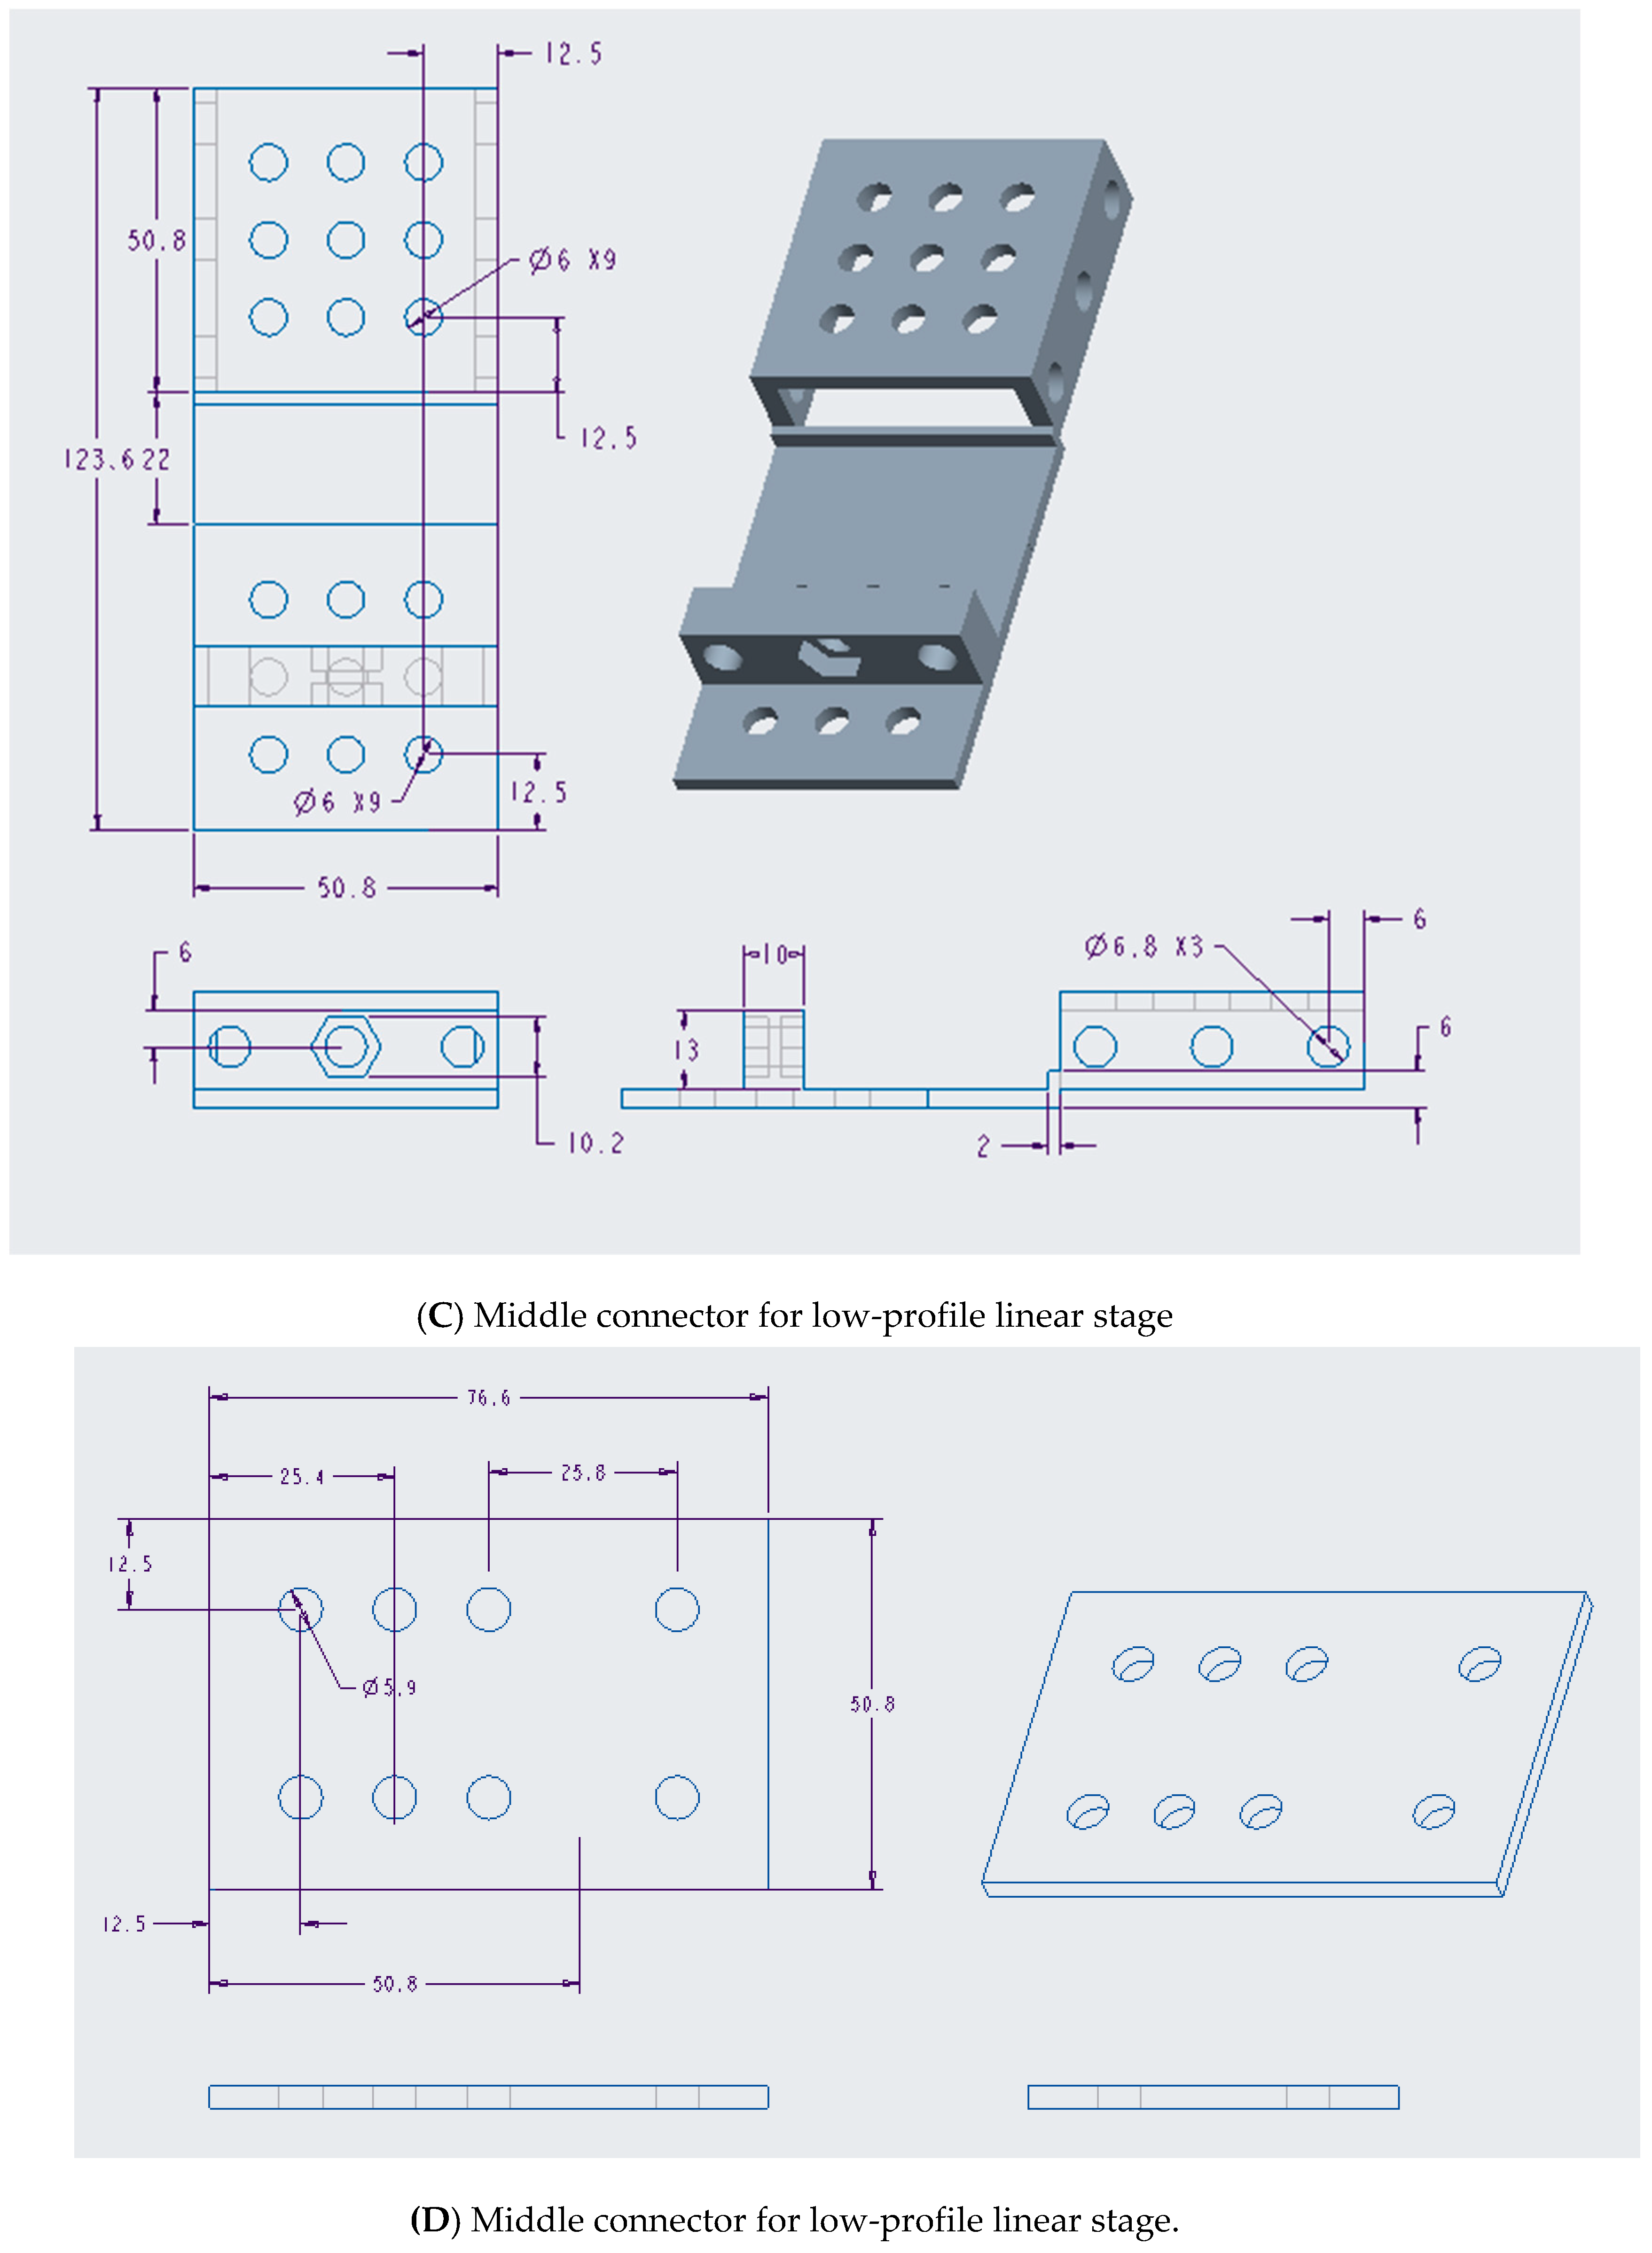
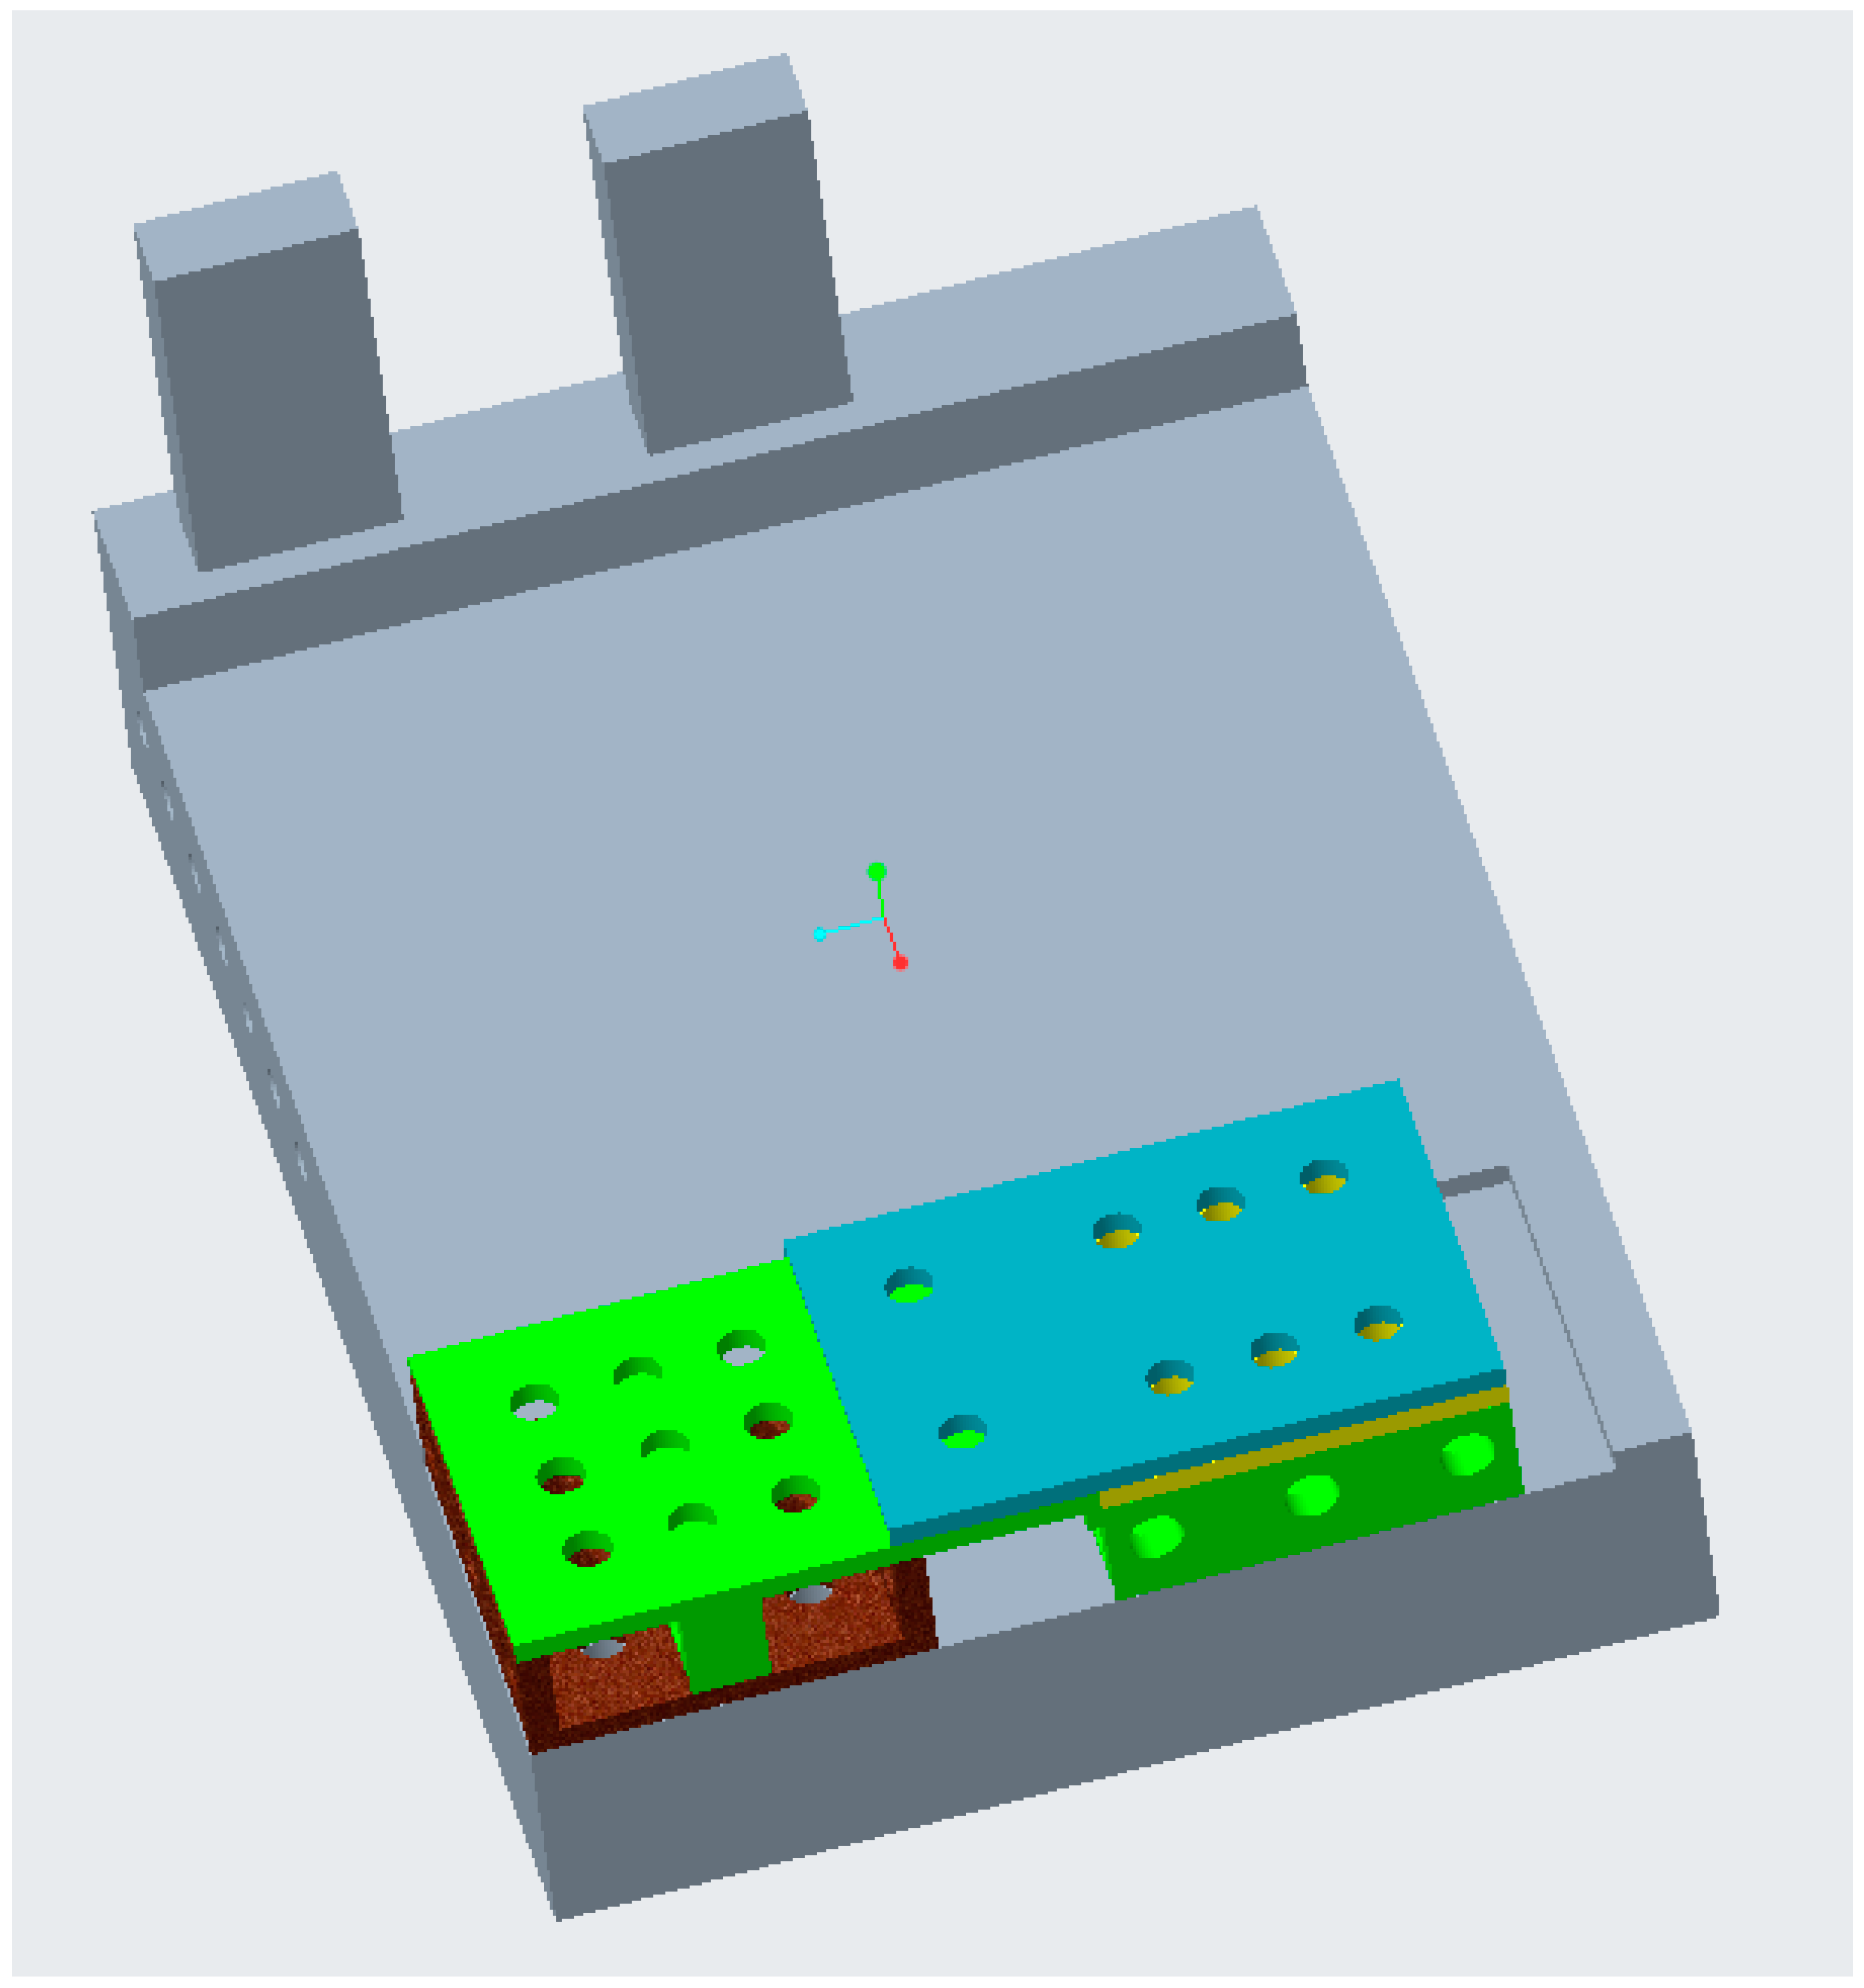
2.5. Sample Stage for Portable Multispectral Imaging Device

The proposed XY stages and laboratory jacks were used for sample stages in a portable multispectral imaging (MSI) system. In this application, the 2 × 2-in XY stages function as a lateral sample stage while the mini-LJ allows a large stroke of vertical sample movement, thus providing XYZ movement of the sample. Since the laboratory jack was placed directly on the linear stage, the main modification for this application was to make the total thickness of the XY stage as thin as possible in order to make room for the laboratory jack and the sample. This design utilized a new idea to reduce the total height of the XY stage system by putting single stages in parallel with each other. The connecting adapter was the critical part that combined the top part of the X stage and the bottom part of the Y stage; while the bottom part of the X stage and the top part of the Y stage were almost the same as the normal 2 ×2-in stage design. The adapter had eight 6-mm holes to connect the XY stage with the laboratory jack. This design ensured that the laboratory jack and the sample were placed exactly in the middle of the whole system when the XY stage was installed.

3. Results

3.1. Linear Stages

A variety of fully assembled linear stages is shown in Figure 1, which includes a 1-D linear stage, a low-profile 2-D linear stage, and a 3-D linear stage. The parts list and bill of materials for a 3 × 3-in stage are shown in Table A1. Since each stage had three individual parts, printing times were also recorded for the Makerbot replicator+, summarized in Table A3 and Table A4.
According to the stress analysis (FEA) result, for a 2 × 2-in stage, the highest Von Mises stress appears in the bottom part, top part, and connector part as 7.41 psi, 7.91 psi, and 31.62 psi, respectively; for a 3 ×3-in stage, the highest stress appears as 11.92 psi, 11.68 psi, and 120.56 psi, respectively (Figure 2). According to the official PLA technical data sheet [16], the ultimate tensile strength, the maximum stress that the material can resist without fracture, is 7080 psi. By comparison, the highest Von Mises stress (120.56 psi) obtained from the FEA test should not do any damage to the stages for regular day-to-day usage. Constructing a complete XYZ stage required one additional adapter to hold the vertical stage on top of the XY stage. Since vertical load will be applied in this case, design of the connectors was analyzed again with FEA; results showed a maximum stress of 120.56 psi, which is still well over an order of magnitude lower than the stress limit.
Figure 3 and Table 1 displays the measurement results from the laser displacement sensor when the linear stage was translated by rotating the knob by 90° at each step. A complete revolution provides approximately 1080 m of maximum stroke with a slope of approximately 3 m per degree of rotation. The standard deviation for each quarter revolution was approximately 9–14 m, which is a 1 to 5% coefficient of variation (CV).
As shown in Figure A5 and Figure A6, average linear displacement per revolution through the whole stroke (18 revolutions) for the 2 × 2-in stage was 1028 μm, with a standard deviation of 21 μm and a CV of 2.1%, while that of the 3 × 3-in stage was 1321 μm, with a standard deviation of 20 μm and a CV of 1.5%. Finally, for the repeatability test, the average linear displacement per revolution through three up and down strokes for a 2 × 2-in stage is 1092 μm, with a standard deviation of 12 μm and a CV of 1.1%, while that of the 3 × 3-in stage is 1337 μm, with a standard deviation of 13 μm and a CV of 0.9%.

3.2. Laboratory Scissor Jack

The initial aim of the project was to completely replace components of a commercial metal laboraotry jack with 3-D printed counterparts, as shown in Figure 4A. However, the plastic platform was fragile due to a lack of thickness. To maintain high load capacity and reliability, a modification was needed that included (1) increasing the thickness of the top and bottom layer from 1.6 mm to 8.73 mm while all other thicknesses (such as scissors) remained the same and (2) replacing all plastic bolts and long center screw with readily available metal parts since 3-D printed threads on the plastic screw did not provide satisfactory repeatability and reliability (Figure 4B).
As with the linear stage analysis, an FEA model was constructed for the three major parts of the laboratory jack: top surface, short rod, and scissor (Figure 5). For the top surface, a normal force of 100 N resulted in a maximum stress of 1222.77 kPa. For the short rods, a vertical load of 100 N resulted in a maximum stress of 34,488 kPa on the middle and edge of the rods, while for the scissors, the center section of the arm was subject to a maximum stress of 16,710.9 kPa.
Since vertical translation accuracy is another important index for a laboratory jack, we compared the theoretical and experimental displacement for both PLJ and PMH-LJ under no load condition using the kinematics of the jack. The incremental height of the jack was calculated as
δ h = 2 [ L 2 ( a t ) 2 L 2 a 2 ]
where parameter 2 originates from the double stack of the scissor platform, L is the length of the longer arm and a the length of the center rod, while t is the reciprocal of threads per inch and set to 1/18.
Figure 6A shows a schematic diagram of the theoretical model, while Figure 6B shows the comparison among theory, PLJ, and PMH-LJ. This result clearly indicated that we can control the stroke and sensitivity of the vertical movement by simply controlling the arm length (L) and rod length (a).
As expected, PLJ displayed significant deviation (up to 42%) from the theoretical model, especially at lower revolutions (equivalent to the lower height), whereas PMH-LJ displayed consistent performance from minimum to maximum height (error range of 1.4–12%). Figure 7 displays a series of load tests conducted for all three models. Figure 7A displays mass versus percentage deflection for all three types of laboratory jacks. (A) displays the % deflection for PLJ and PMH-LJ when individual height was set at maximum and 50% of maximum. Plastic laboratory jacks showed close to 30% height changes when 0.9 kg of mass was placed on top. Figure 7B shows a similar relationship for the custom-designed mini-LJ for the MSI. Maximum deflection was around 1% of the total height even with 0.9 kg.

3.3. Application in a Portable Multispectral Imaging System

A custom-designed low-profile linear stage and mini-LJ were installed on the 3-D-printed MSI device shown in Figure 8 and Figure A6 This instrument utilizes a smartphone to perform as an MSI detector while using a linear motor to sweep a color filter to generate a series of spectral reflectance images. Installing a lower-profile linear stage and mini-LJ was critical to ensure horizontal sample positioning and to account for large size differences in the objects under investigation. Since smartphone systems were configured as macro-MSI (imaging large surface area) and micro-MSI (zoom-in on a small area), a simple attachment such as the mini-LJ ensured image focus, particularly for the micro-MSI, which served as a low-power microscope. As a proof of concept, 7-color band reflection images were acquired and average grayscale intensities plotted for fake and real fruit (Figure 9). The spectral intensity plot clearly distinguishes two classes, particularly in the red color region (600–650 nm), where real fruit provides less intensity than artificially colored fruit.

4. Discussion

Even though the 3-D printed laboratory stages have cost-reduction advantages, they may still be considered impractical unless their accuracy is high enough for usage. Considering the average linear displacement per revolution through the whole stroke and the repeatability tests for the 2 × 2-in and 3 × 3-in stages, the coefficient of variation (CV), 0.9% to 2.1%, is good enough for many laboratory experiments.
These low CV numbers make it reasonable to conclude that the performance of stages in both sizes remains almost constant, regardless of the relative positions of the top and bottom parts of the stages, despite possible differences in inner spring force. Moreover, these small CVs also prove that the direction of stage-handle turning does not have any influence on stage performance either. Finally, since the stage is placed vertically during the Keyence test, the small CVs also mean that the gravitational force of the stages themselves do not affect the performance of the stages, making it reasonable to conclude that the stage can be placed in any direction without any sacrifice in performance. All in all, the results of the motion and displacement analysis demonstrate the high adaptability and reliability of the stages.
When designing a customized low-profile linear stage, the main aim was to maintain functionalities while reducing the overall volume of the stage. The simplest action was to reduce the thickness of each top/middle/bottom part. However, there was a practical limit to how much we can reduce the thickness owing to concerns about material strength and interference with metal parts, so this approach produced a final thickness of 38 mm (20 mm less than the original design of 58 mm). However, there was still a margin of possible improvement, which was achieved by a unique design of parallel positioning of both stages: one stage is fixed to the MSI system, while other is bridged by a horizontal connector with about 2–3 mm clearance. This type of floating stage enabled us to keep the thickness of XY stages the same as that of a single X stage while providing translation in both directions. The total thickness is 19 mm, about 1/3 of the original thickness of a stacked XY stage.
A laboratory jack can provide vertical displacement owing to a distance change between two junction points where the two short rods and long threaded rod interact (Figure 6A). A metal laboratory jack uses a threaded rod with two orientation threads on each side. In this case, when the threaded rod is rotated, two junction points move towards or away from each other and the jack moves in the up or down direction. The junction points nearer to the handle side can be regarded as fixed points. When the threaded rod rotates, the other point will move toward or away from the fixed point to change the distance between two junction points. However, the handle length of the plastic jack should be carefully designed to make sure that every rotation counts. At the jack’s lowest height, the handle should exactly hit the short rod. In this way, the first rotation will make the laboratory jack move up. If the handle does not hit the short rod, there will be several empty rotations at the beginning, where model and experimental discrepancy appeared (Figure 6C. When a vertical load is applied, Figure 6A defines the angle between orientation of the force and the jack as θ. When the jack is at its maximum height, the value of θ is the smallest. Therefore, the friction needed to keep balance is at a minimum when the jack has maximum load capacity. When the jack is at half height, the value of θ becomes larger and the friction needed is larger. At this point, the height deflection becomes larger because of less load capacity (Figure 7).
When designing a unique experimental setup that includes an opto-mechanical positioning component, the engineer’s concept is always cross-checked with the catalog of commercial components, and we build our experiment sets based on availability. Now with the advent of more accurate and affordable 3-D printers available to the public, engineers have more flexibility to literally print their customized and unique positioning system with just the cost of the filament. Take the 3 × 3-in three-dimensional stage as an example; according to Table A1, the unit cost of each XYZ stage (3-D stage) is $36.08. However, the typical cost of a commercial XYZ stage exceeds $500, approximately 14 times that of our 3 × 3-in XYZ stage. The second advantage of our 3-D printed stages is time efficiency. According to Table A3 and Table A4, the total printing times for the 2 × 2-in and 3 × 3-in three-dimensional laboratory stages are 16 h 12 m and 32 h 47 m, respectively. Although purchasing a three-dimensional stage through a website might be a one-click process, delivery may take some time. Relatively short preparation time for the 3-D printed stages makes it feasible to fabricate the stages in case of need, instead of making purchases in anticipation of usage. One example of the custom-designed opto-mechanical positioning system was shown in the application of portable MSI. The current report is based on the general printing technique of fused filament fabrication (FFF), also known as fused deposition modeling (FDM). PLA and ABS are two of the major materials used. PLA-printed objects are less temperature sensitive and provide better surface quality and strength, although printed objects become degraded over time when in contact with liquid such as water. ABS is sensitive to temperature changes but can withstand more wear and tear. However, owing to the temperature sensitivity, ABS requires more time to cool down and typically generates more curling and warping during the printing process [17,18]. Printing with PLA not only provided enough tensile and axial strength for overall stability, but also saved significant amounts of time and money for prototype and assembly iterations (Table A1, Table A2 and Table A5 show bills of materials). Conducting this design iteration with a conventional machine shop would have taken more resources to complete the same task. One downside of the 3-D printed system is that these systems will not provide a feasible solution for nanometer-scale positioning. However, many applications, including our MSI, find that a resolution of 5–100 m is sufficient for certain applications [19] and research is being reported on next-generation development of nanoscale 3-D printing [14,20].

5. Conclusions

Design and application of 3-D-printed opto-mechanical stages and laboratory jacks were presented. Linear stages and laboratory jacks were manufactured with varying stage dimensions and thickness to accommodate different experimental situations. Manufacturing time and bills of material suggest that the 3-D printing method provides fast design turnaround and cost reduction while still maintaining relatively good accuracy and repeatability. Finally, a 3-D printed opto-mechanical system was applied to a portable multispectral imaging system.

Author Contributions

Conceptualization, E.B. and I.-J.D.; methodology, E.B., Y.Z., and C.D.; Validation, Y.Z., C.D., and I.-J.D.; data analysis, Y.Z., C.D., and I.-J.D.; draft preparation: E.B., Y.Z., and C.D.; writing, E.B., Y.Z., and C.D.; Funding acquisition, E.B.

Funding

This material is based upon work supported by the U.S. Department of Agriculture, Agricultural Research Service, under Project No. 8072-42000-077. Any opinions, findings, conclusion, or recommendations expressed in this publication are those of the authors and do not necessarily reflect the view of the U.S. Department of Agriculture.

Conflicts of Interest

The authors declare no conflict of interest.

Appendix

Table A1. Materials for 3 in × 3 in XYZ stages.
Part NameQtyUnit CostTotal
6 mm-1.0 × 90 mm Zinc Class 8.8 Hex Cap Screw 86$0.99$5.94
6 mm-1.00 Zinc Class 8 Coarse Thread Hex Nut-2 count3 pack$0.29$0.87
21/64” × 1-1/8” Compression Spring - 1 count12$0.59$7.08
8 mm-1.25 × 90 mm Zinc Grade A Hex Tap Bolt-1 Count3$2.19$6.57
8 mm-1.25 Stainless 18-8 Coarse Thread Hex Nut-2 Count5 pack$0.69$3.45
8 mm Class 8 Zinc Flat Washer-3 Count1 pack$0.29$0.29
Socket Set Screw Stainless Steel 8 mm-1.25 × 12 mm12$0.99$11.88
Total Price(Exclude Tax)
$36.08
Table A2. Materials for the low-profile stages for MSI.
Part NameQtyUnit CostTota
1/4”-28 × 2-1/2” Hex Cap Screw-1count4$0.0.69$2.76
1/4” - 28 Grade 8 Fine Thread Hex Nut-2 count2 pack$0.29$0.58
21/64” × 1-1/8” Compression Spring- 1 count8$0.59$4.72
6 mm-1.0 × 60 mm Grade A Hex Tap Bolt- 1 count2$0.89$1.78
6 mm-1.00 Zinc Class 8 Coarse Thread Hex Nut-2 count3 pack$0.29$0.87
6 mm Class 8 Zinc Flat Washer-4 Count1 pack$0.29$0.29
Socket Set Screw Stainless Steel 6 mm-1.0 × 12 mm12$0.69$8.28
Total Price(Exclude Tax)
$19.28
Table A3. Printing Time of the 2 × 2in XYZ stage using Makerbot replicator +.
NamePrinting TimeQuantityTotal
Bottom2 h 1 min36 h 3 min
Top1 h 53 min35 h 39 min
Connector2 h 45 min12 h 45 min
Handle35 min31 h 45 min
Total time16 h 12 min
Table A4. Printing Time of the 3 × 3-in XYZ stage using Makerbot replicator +.
NamePrinting TimeQuantityTotal
Bottom4 h 1 min312 h 3 min
Top3 h 59 min311 h 57 min
Connector6 h 14 min16 h 14 min
Handle51 min32 h 33 min
Total time32 h 47 min
Table A5. Materials for laboratory scissor jack.
Part NameHow ManyUnit PriceTotal Part Price
10-24 Thread size, ½″ Long Zinc Yellow-Chromate Plated Hex Head Screw12$0.48$5.76
5/16″-18 Thread size, 6″Long High-Strength Steel Threaded Rod1$7.32$7.32
5/16″-18 Thread size, Extreme-Strength Steel Hex Nut1$0.37$0.37
5/16-18 Threaded Insert1$0.12$0.12
Total Price$13.57
Figure A1. CAD drawings for 3 × 3-in stage.
Applsci 09 00937 g0a1aApplsci 09 00937 g0a1bApplsci 09 00937 g0a1c
Figure A2. FEA model of representative parts.
Applsci 09 00937 g0a2aApplsci 09 00937 g0a2b
Figure A3. CAD model for custom designed opto-mechanical system.
Applsci 09 00937 g0a3aApplsci 09 00937 g0a3b
Figure A4. Average translations per revolution covering the full stroke of a linear stage. Statistical result shows COV of 2.1%.
Applsci 09 00937 g0a4
Figure A5. Repeatability test results for forward and reverse translations of the stage. Statistical result shows COV of 1.1%.
Applsci 09 00937 g0a5
Figure A6. CAD model for custom designed opto-mechanical system integrated into the portable HSI system.
Applsci 09 00937 g0a6

References

  1. Palenzuela, C.L.M.; Pumera, M. (Bio) Analytical chemistry enabled by 3D printing: Sensors and biosensors. Trac Trends Anal. Chem. 2018, 103, 110–118. [Google Scholar] [CrossRef]
  2. Campbell, R.A.; Eifert, R.W.; Turner, G.C. OpenStage: A low-cost motorized microscope stage with sub-micron positioning accuracy. PLoS ONE 2014, 9, e88977. [Google Scholar] [CrossRef] [PubMed]
  3. Kłodowski, A. Planar Four-Link Mechanism Analysis for Application in 3D Printing Machines. In New Trends in Mechanism and Machine Science; Springer: Cham, Switzerland, 2015; pp. 99–108. [Google Scholar]
  4. Pavlosky, A.; Glauche, J.; Chambers, S.; Al-Alawi, M.; Yanev, K.; Loubani, T. Validation of an effective, low cost, Free/open access 3D-printed stethoscope. PLoS ONE 2018, 13, e0193087. [Google Scholar] [CrossRef] [PubMed]
  5. Salazar-Serrano, L.J.; Torres, P.J.; Valencia, A. A 3D printed toolbox for opto-mechanical components. PLoS ONE 2017, 12, e0169832. [Google Scholar] [CrossRef] [PubMed]
  6. Tahayeri, A.; Morgan, M.; Fugolin, A.P.; Bompolaki, D.; Athirasala, A.; Pfeifer, C.S.; Ferracane, J.L.; Bertassoni, L.E. 3D printed versus conventionally cured provisional crown and bridge dental materials. Dent. Mater. 2018, 34, 192–200. [Google Scholar] [CrossRef] [PubMed]
  7. Bose, S.; Vahabzadeh, S.; Bandyopadhyay, A. Bone tissue engineering using 3D printing. Mater. Today 2013, 16, 496–504. [Google Scholar] [CrossRef]
  8. Geissmann, Q.; Rodriguez, L.G.; Beckwith, E.J.; French, A.S.; Jamasb, A.R.; Gilestro, G.F. Ethoscopes: An open platform for high-throughput ethomics. PLoS Biol. 2017, 15, e2003026. [Google Scholar] [CrossRef] [PubMed]
  9. Mitsouras, D.; Liacouras, P.; Imanzadeh, A.; Giannopoulos, A.A.; Cai, T.; Kumamaru, K.K.; George, E.; Wake, N.; Caterson, E.J.; Pomahac, B.; et al. Medical 3D printing for the radiologist. Radiographics 2015, 35, 1965–1988. [Google Scholar] [CrossRef] [PubMed]
  10. Garg, B.; Gupta, M.; Singh, M.; Kalyanasundaram, D. Outcome and safety analysis of 3D-printed patient-specific pedicle screw jigs for complex spinal deformities: A comparative study. Spine J. 2018, 19, 56–64. [Google Scholar] [CrossRef] [PubMed]
  11. Chan, H.N.; Tan, M.J.A.; Wu, H. Point-of-care testing: Applications of 3D printing. Lab Chip 2017, 17, 2713–2739. [Google Scholar] [CrossRef] [PubMed]
  12. McMenamin, P.G.; Quayle, M.R.; McHenry, C.R.; Adams, J.W. The production of anatomical teaching resources using three-dimensional (3D) printing technology. Anat. Sci. Educ. 2014, 7, 479–486. [Google Scholar] [CrossRef] [PubMed] [Green Version]
  13. Holmström, O.; Linder, N.; Lundin, M.; Moilanen, H.; Suutala, A.; Turkki, R.; Joensuu, H.; Isola, J.; Diwan, V.; Lundin, J. Quantification of estrogen receptor-alpha expression in human breast carcinomas with a miniaturized, low-cost digital microscope: A comparison with a high-end whole slide-scanner. PLoS ONE 2015, 10, e0144688. [Google Scholar] [CrossRef] [PubMed]
  14. Trenfield, S.J.; Awad, A.; Goyanes, A.; Gaisford, S.; Basit, A.W. 3D printing pharmaceuticals: Drug development to frontline care. Trends Pharmacol. Sci. 2018, 39, 440–451. [Google Scholar] [CrossRef] [PubMed]
  15. Shen, K.; Mei, H.; Li, B.; Ding, J.; Yang, S. 3D Printing Sulfur Copolymer-Graphene Architectures for Li-S Batteries. Adv. Energy Mater. 2018, 8, 1701527. [Google Scholar] [CrossRef]
  16. Gross, B.C.; Erkal, J.L.; Lockwood, S.Y.; Chen, C.; Spence, D.M. Evaluation of 3D Printing and Its Potential Impact on Biotechnology and the Chemical Sciences; ACS Publications: Washington, DC, USA, 2014. [Google Scholar]
  17. Willis, K.; Brockmeyer, E.; Hudson, S.; Poupyrev, I. Printed optics: 3D printing of embedded optical elements for interactive devices. In Proceedings of the 25th Annual ACM Symposium on User Interface Software and Technology, Cambridge, MA, USA, 7–10 October 2012. [Google Scholar]
  18. Mueller, B. Additive manufacturing technologies–Rapid prototyping to direct digital manufacturing. Assem. Autom. 2012, 32. [Google Scholar] [CrossRef]
  19. Berman, B. 3-D printing: The new industrial revolution. Bus. Horiz. 2012, 55, 155–162. [Google Scholar] [CrossRef]
  20. SD3D. SD3D Technical Data Sheet; SD3D Printing: San Diego, CA, USA, 2017. [Google Scholar]
Figure 1. A variety of 3-D printed linear stages. (A) A 2 × 2-inch 1-D stage that provides a stroke of 1.08 mm with one rotation of the knob. (B) Modification of the two combined stages that was uniquely designed for a multispectral imaging system, using a parallel positioning concept. The aim of this stage is to provide 2-D motion while maintaining a low stage profile. (C) XYZ stage assembled by combining three 2 × 2-inch 1-D stages.
Applsci 09 00937 g001
Figure 2. FEM stress analysis for the 3 × 3-in stage and XYZ connector. (A)–(B) Load distribution for the top and bottom plates. Since the load of 10 N was applied on the connecting holes, maximum stress was about 11 psi, much lower than the tensile strength of PLA. (C) Load distribution for the XYZ connecter when a 45° load of 20 N was applied. In this case, the stress was about 10× higher on the connector (~120 psi) but still much lower than the tensile strength of PLA. (D)–(F) Corresponding stress distribution.
Applsci 09 00937 g002
Figure 3. Motion analysis for 2 × 2-inch linear stage. (A) Measurement setup for the laser displacement sensor that tracks the linear movement of the 3-D printed stages. (B) Knob rotation angle versus linear displacement has an R2 value of 0.98.
Applsci 09 00937 g003
Figure 4. A variety of 3-D-printed laboratory scissor jacks. (A) Photograph of 4 × 4-in 3-D printed laboratory scissors jack. (B) Photograph of 4 × 4-in 3-D printed laboratory scissors jack with metal screws, threaded insert, and central threaded rod. (C) Photograph of 2 × 2-in 3-D printed laboratory scissors jack with metal screws, threaded insert, and central threaded rod.
Applsci 09 00937 g004
Figure 5. (A) 100 N load applied to the 4 × 4-in lab scissors jack platform by FEA analysis. (B) 100 N load applied to the 4 in × 4 in lab scissors jack short rod by FEA analysis on both edges of the hole. (C) 100 N load applied to the 4 × 4-in jack scissor by FEA analysis on the surface of end holes, extrudes and edges on front holes. (D) FEA result of 4 × 4-in laboratory scissors jack platform with maximum stress of 68471 psi. (E) FEA result short rod with maximum stress of 1.25 × 10 7   psi . (F) FEA result of scissors with maximum stress of 1.93 × 10 6   psi .
Applsci 09 00937 g005
Figure 6. (A) Schematic diagram of a jack with original height, assuming length of the scissor is L and distance between the two short rods is a. (B) Schematic diagram of a jack after one revolution from the original height with a decrease of 1/18 in the distance between the two short rods on both sides. (C) Line chart of laboratory jack height versus number of revolution comparing real and theoretical height.
Applsci 09 00937 g006
Figure 7. Mass versus percentage deflection for all three types of laboratory jacks. (A) Percent deflection for pure plastic and metal-plastic laboratory jacks when individual height was set at maximum and at 50% of the maximum. Plastic laboratory jacks showed close to 30% changes in height when 0.9 kg was placed on top. (B) Similar relationship for the custom-designed mini laboratory jack for the MSI. Maximum deflection was around 1% of the total height even with a load of 0.9 kg.
Applsci 09 00937 g007
Figure 8. Utilizing the proposed 3-D printed XY stages and laboratory scissor jack with a portable multispectral imaging device. The system consists of a multispectral imaging platform, a low-profile XY stage for lateral sample alignment, and a mini laboratory scissor jack for vertical focusing. (A) System with combination of mini laboratory jack and low-profile XY stage. (B) System with low-profile XY stage only.
Applsci 09 00937 g008
Figure 9. Application of spectral reflectance imaging using 3-D printed stages and laboratory jack. (A) Thumbnail images of fake and real strawberries. (B) Spatially averaged spectral reflectance of the strawberry images. (C) Thumbnail images of fake and real grapes. (D) Spatially averaged spectral reflectance of the grape images. Note that a mini laboratory jack was utilized for the grape images. Shaded color on (B) and (D) represents standard deviation of three repetitions.
Applsci 09 00937 g009
Table 1. Maximum stroke & displacement per revolution.
TypeMax StrokeDisplacement per Revolution
2 in × 2 in± 10 mm1.27 mm
3 in × 3 in± 16 mm1.08 mm

