Article

Potential of Fluorescence Index Derived from the Slope Characteristics of Laser-Induced Chlorophyll Fluorescence Spectrum for Rice Leaf Nitrogen Concentration Estimation

1
Faculty of Information Engineering, China University of Geosciences, Wuhan 430074, Hubei, China
2
State Key Laboratory of Information Engineering in Surveying, Mapping and Remote Sensing, Wuhan University, Wuhan 430079, Hubei, China
3
Collaborative Innovation Center of Geospatial Technology, Wuhan 430079, Hubei, China
*
Author to whom correspondence should be addressed.
Appl. Sci. 2019, 9(5), 916; https://doi.org/10.3390/app9050916
Submission received: 29 December 2018 / Revised: 6 February 2019 / Accepted: 26 February 2019 / Published: 4 March 2019
(This article belongs to the Section Optics and Lasers)

Abstract

:
Leaf nitrogen concentration (LNC) is a major biochemical parameter for estimating photosynthetic efficiency and crop yields. Laser-induced fluorescence, which is a promising potential technology, has been widely used to estimate the growth status of crops with the help of multivariate analysis. In this study, a fluorescence index was proposed based on the slope characteristics of fluorescence spectrum and was used to estimate LNC. Then, the performance of different fluorescence characteristics (proposed fluorescence index, fluorescence ratios, and fluorescence characteristics calculated by principal component analysis (PCA)) for LNC estimation was analyzed based on back-propagation neural network (BPNN) model. The proposed fluorescence index exhibited more stability and reliability for LNC estimation than fluorescence ratios and characteristics calculated by PCA. In addition, the effect of different kernel functions and hidden layer sizes of BPNN model on the accuracy of LNC estimation was discussed for different fluorescence characteristics. The optimal train functions “trainrp,” “trainbr,” and “trainlm” were then selected with higher R2 and lower standard deviation (SD) values than those of other train functions. In addition, experimental results demonstrated that the hidden layer size has a smaller impact on the accuracy of LNC estimation than the kernel function of the BPNN model.

1. Introduction

The photosynthesis ability of vegetation is closely related to vegetation growth status, which is influenced by biochemical concentrations. The leaf nitrogen concentration (LNC) is one of the most important biochemical parameters closely related to the photosynthetic efficiency and crop yields [1]. Therefore, LNC can serve as a major indicator for monitoring crop growth status based on passive or active technology in the field of remote sensing [2,3], wherein related investigations have been conducted by many researchers.
For passive remote sensing technology, the reflectance spectrum of crops was measured, and the relationship between spectral characteristics and LNC or crop status was established. Thus, numerous investigations regarding LNC estimation have been done due to the non-destructive, fast, and large-scale advantages of passive remote sensing technology [4,5,6]. These investigations found that LNC was closely related to the visible and near-infrared regions of reflectance spectrum. Relative metrics (such as vegetation indices and spectral characteristics) based on reflectance spectra were then proposed for LNC estimation [1,7,8]. Kira et al. [9] analyzed the sensitivity of spectral bands for LNC estimation. In addition, Bassanezi et al. [10] discussed the correlation between CO2 and LNC and found that the efficiency of solar energy utilization was influenced by the LNC from the canopy scale. What’s more, the three-dimensional information of crops can be measured by using light detection and ranging (LiDAR), which is an active remote sensing technique. Several metrics calculated based on spatial information can be efficiently applied in the monitoring of crop status. At present, passive and active remote sensing technologies have been maturely applied in the monitoring of crop growth status based on proposed relative metrics, which can provide guidance for precision agricultural management [11,12,13,14].
Laser-induced chlorophyll fluorescence spectrometry (LICFs) serves as another remote sensing technology for crop growth status monitoring and has attracted considerable attention from numerous investigators [15,16,17,18,19,20]. Chlorophyll fluorescence can be efficiently applied in nutrient stress estimation and photosynthetic ability monitoring. Subhash and Mohanan [21] analyzed the performance of chlorophyll fluorescence for nutrient stress monitoring in rice and found that the ratios of fluorescence intensity have considerable potential for remote sensing of stress effects in plants. Gunther et al. [22] used the fluorescence intensity ratio F685/F730 (the fluorescence intensity at 685 nm divided by that at 730 nm) to monitor chlorophyll concentration when evident reduction was not observed. Yang et al. [23,24,25] compared the performance of published fluorescence metrics for LNC estimation and discussed the effect of fluorescence parameters combined with multivariate analysis on the accuracy of LNC monitoring. Buschmann [26] utilized the chlorophyll fluorescence intensity ratio F690/F735 to analyze the changes in chlorophyll concentration and found that it was linearly related to fluorescence concentration. These investigations displayed the potential of chlorophyll fluorescence for LNC monitoring.
However, understanding of the effect of kernel function or internal parameters of multivariate analysis on the LNC estimation is still limited. In addition, the fluorescence index is restricted by the fluorescence intensity ratio chosen. Thus, the main aims of this study are (1) to analyze the effect of kernel function of multivariate analysis on the accuracy of LNC estimation and select the optimal internal parameters; and (2) to discuss the performance of the proposed fluorescence index based on the slope characteristics of fluorescence spectrum for LNC estimation.

2. Materials and Methods

2.1. Materials

Wuhan City in the province of Hubei, China, was selected and served as the experimental area in this study. The variety of paddy rice was Victory Indica, which was seeded on 30 April, 2015. According to the advice of the local farm extension service, the most optimal dose of N fertilization was 180 kg/ha. During the entire growth period, four (0, 120, 180, and 240 kg/ha) N fertilization levels of urea were used in the experimental fields. Each experimental area had an absolute block design so that the ridges of the field were enclosed in plastic films to avoid water leakage, with three replications under the same cultivation conditions. Furthermore, other management processes were conducted according to the advice of the local farm extension service. Paddy rice foliar samples, which were the second leaves from the top, were fully expanded and destructively sampled by randomly cutting nine leaves with three replicates for each experimental field. A total of 81 foliar samples were obtained for each fertilization level, and the number of total samples was 324. Then, the fluorescence spectrum of each foliar sample was measured. All foliar samples were collected on 24 July 2015, which corresponded to the tillering stage [23,27].

2.2. Fluorescence Spectrum Measurement

The laser-induced fluorescence (LIF) system was built in our laboratory and consisted of an excitation light source (excitation light wavelength is 355 nm, frequency is 20 Hz, and pulse width is 5 ns). The fluorescence signal was collected through a convex lens and passed through an optical fiber. Then, it was transferred to the spectrometer for analysis using a linear array ICCD camera for detection. The detailed description of the instrument can be found in our previous study [23]. The spectral range of each foliar sample was 360–800 nm with 0.5 nm sample interval. In addition, the standard Kjeldahl method was used to determine the LNC after the measurement of fluorescence spectra [28]. The detailed standard Kjeldahl process can be found in reference [29].

2.3. Analytical Methods

Chlorophyll fluorescence is closely related to LNC, and the bands were mainly located in the red and far-red regions. Then, some fluorescence intensity ratio indices were proposed to analyze LNC changes. Therefore, a fluorescence index was introduced for LNC monitoring based on the slope characteristics of fluorescence spectrum. The proposed fluorescence index was presented as follows:
K = F ( λ i 1 , λ e x ) F ( λ i 2 , λ e x ) λ i 1 λ i 2 / F ( λ i 3 , λ e x )
where λ e x is the excitation light wavelength, and F ( λ i 1 , λ e x ) , F ( λ i 2 , λ e x ) , and F ( λ i 3 , λ e x ) denote the fluorescence intensities at fluorescence emission wavelengths λ i 1 , λ i 2 , and λ i 3 , respectively. According to previous researches, fluorescence characteristic peaks at 685 nm were mainly contributed by chlorophyll a of Photosystem II, whereas those at 740 nm were contributed by the antenna chlorophyll of Photosystems I and II. The fluorescence characteristics peaks were positively correlated to LNC. In addition, the fluorescence characteristics at 460 nm were mainly denoted by the nicotinamide adenine dinucleotide [23,30]. Therefore, λ i 3 was selected at 460 nm, and the fluorescence peak characteristics were selected at 740 nm and 685 nm. In addition, a reference fluorescence signal was selected at 640 nm. Then, a total of three fluorescence indices were calculated as follows:
K 1 = F 740 F 685 Δ λ 1 / F 460
K 2 = F 740 F 640 Δ λ 2 / F 460
K 3 = F 685 F 640 Δ λ 3 / F 460
Then, the performance of the proposed fluorescence indices was analyzed based on the back-propagation neural network (BPNN) model for LNC estimation. The results were then compared with the fluorescence ratios or extracted fluorescence characteristics through principal component analysis (PCA) analyzed fluorescence spectrum. BPNN serves as a feedforward network and has been widely used to solve non-linear problems due to its self-learning and self-adaption abilities [31,32]. A typical BPNN model comprises three layers including input, output, and hidden layers, each with a few neurons. The BPNN model can modify weights of the neurons in response to the errors between the target output values and truth-value until it is optimal. The detailed description of the BPNN model can be found in this reference [32,33].
In addition, the effect of training function and hidden layer size on the accuracy of LNC estimation was discussed. In this investigation, training functions were “traingd,” “traingdm,” “traingda,” “traingdx,” “trainrp,” “traincgf,” “traincgp,” “traincgb,” “trainscg,” “trainbfg,” “trainoss,” “trainlm,” and “trainbr,” which corresponded to the training methods “gradient descent,” “gradient descent with momentum,” “gradient descent with adaptive learning rate,” “gradient descent with momentum and adaptive learning rate,” “resilient gradient backpropagation,” “conjugate gradient backpropagation with Fletcher–Reeves restarts,” “conjugate gradient with Ploak–Ribiere restarts,” “conjugate gradient with Powell–Beale restarts,” “scaled conjugate gradient,” “Broyden–Fletcher–Goldfarb–Shanno quasi-Newton,” “one step secant,” “Levenberg–Marquardt,” and “Bayesian regulation”, respectively.
In the BPNN model, the fluorescence characteristics were divided into two datasets: 70% as the training dataset to train the BPNN model and the remaining 30% as the testing dataset to validate the BPNN model. The coefficient of determination (R2) between the predicted and measured LNC and standard deviation (SD) were used to assess the performance of the proposed fluorescence index for LNC estimation and the effect of internal parameter of the BPNN model on the accuracy of LNC estimation. Each characteristic’s setting was repeated 60 times based on BPNN, and the average and SD were calculated.

3. Results and Discussion

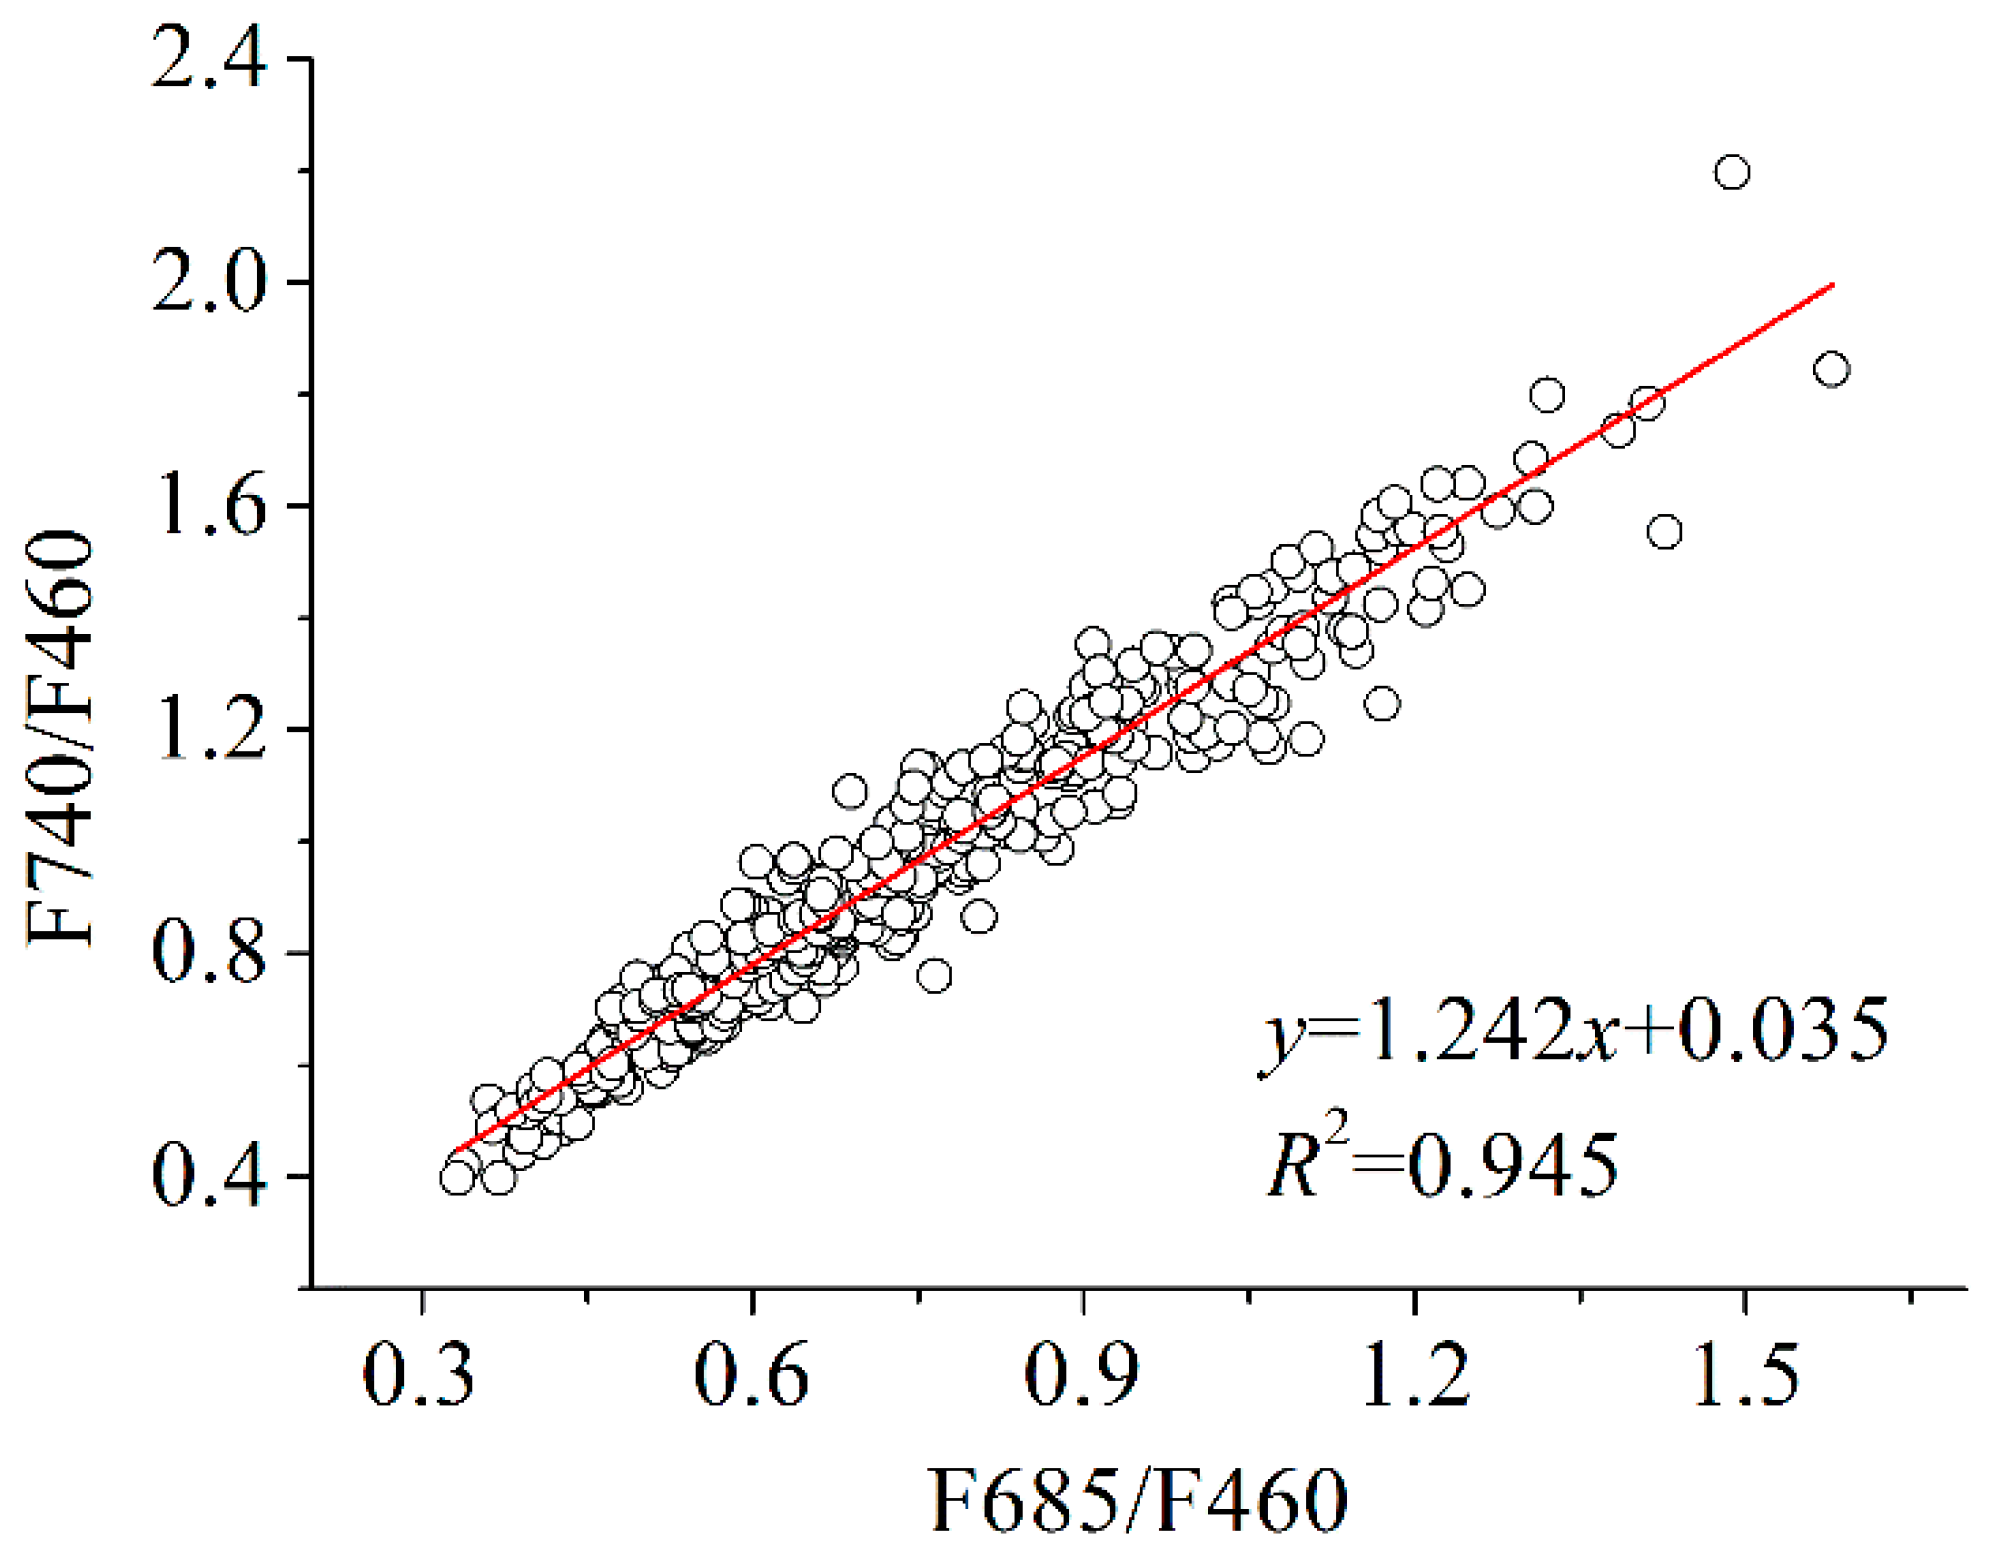
3.1. Relationship between the Proposed Fluorescence Index and LNC

The chlorophyll fluorescence spectrum shows a positive correlation with LNC. Thus, the fluorescence characteristic peaks at 685 nm and 740 nm increased with the increasing of LNC. However, the fluorescence peak at 685 nm is less intensive than that at 740 nm because the reabsorption by the chlorophyll pigment at 685 nm is stronger than that at 740 nm [34]. Thus, the effect of LNC on the fluorescence signal at 740 nm is more apparent than that at 685 nm. The relationship between the fluorescence intensity at 740 nm and at 685 nm with the changing of LNC is shown in Figure 1.
Figure 1 shows the changes of fluorescence peaks at 740 nm and 685 nm with increasing LNC. The results show that the fluorescence peak intensity at 740 nm has a linear positive correlation with fluorescence peak intensity at 685 nm with increasing LNC. R2 can reach up to 0.945. In addition, the slope of linear regression analysis is 1.242, which means that the relative change of fluorescence peak intensity at 740 nm is larger than that at 685 nm when the LNC increased. This shows that the intensity of the fluorescence peaks at 740 nm and 685 nm are related to LNC. Therefore, the result demonstrated that the proposed fluorescence index can be applied in the LNC monitoring. Then, the relationship between the proposed fluorescence indices calculated using Equations (2)–(4) and LNC was established and shown in Figure 2.
Figure 2 demonstrates that the proposed fluorescence index exhibited a closely positive linear correlation with LNC. The R2 values are 0.508, 0.771, and 0.732 for fluorescence indices K1, K2, and K3, respectively. K1 demonstrates that fluorescence intensity at 740 nm increases faster than that at 685 nm with increasing LNC. K2 (R2 = 0.771) and K3 (R2 = 0.732) are superior to K1 (R2 = 0.508) for the detection of a smaller change in LNC because K2 and K3 displayed larger slope and lower scatter than K1. These results are consistent with those obtained by previous studies [35,36]. Therefore, the proposed fluorescence index can be applied in LNC estimation.

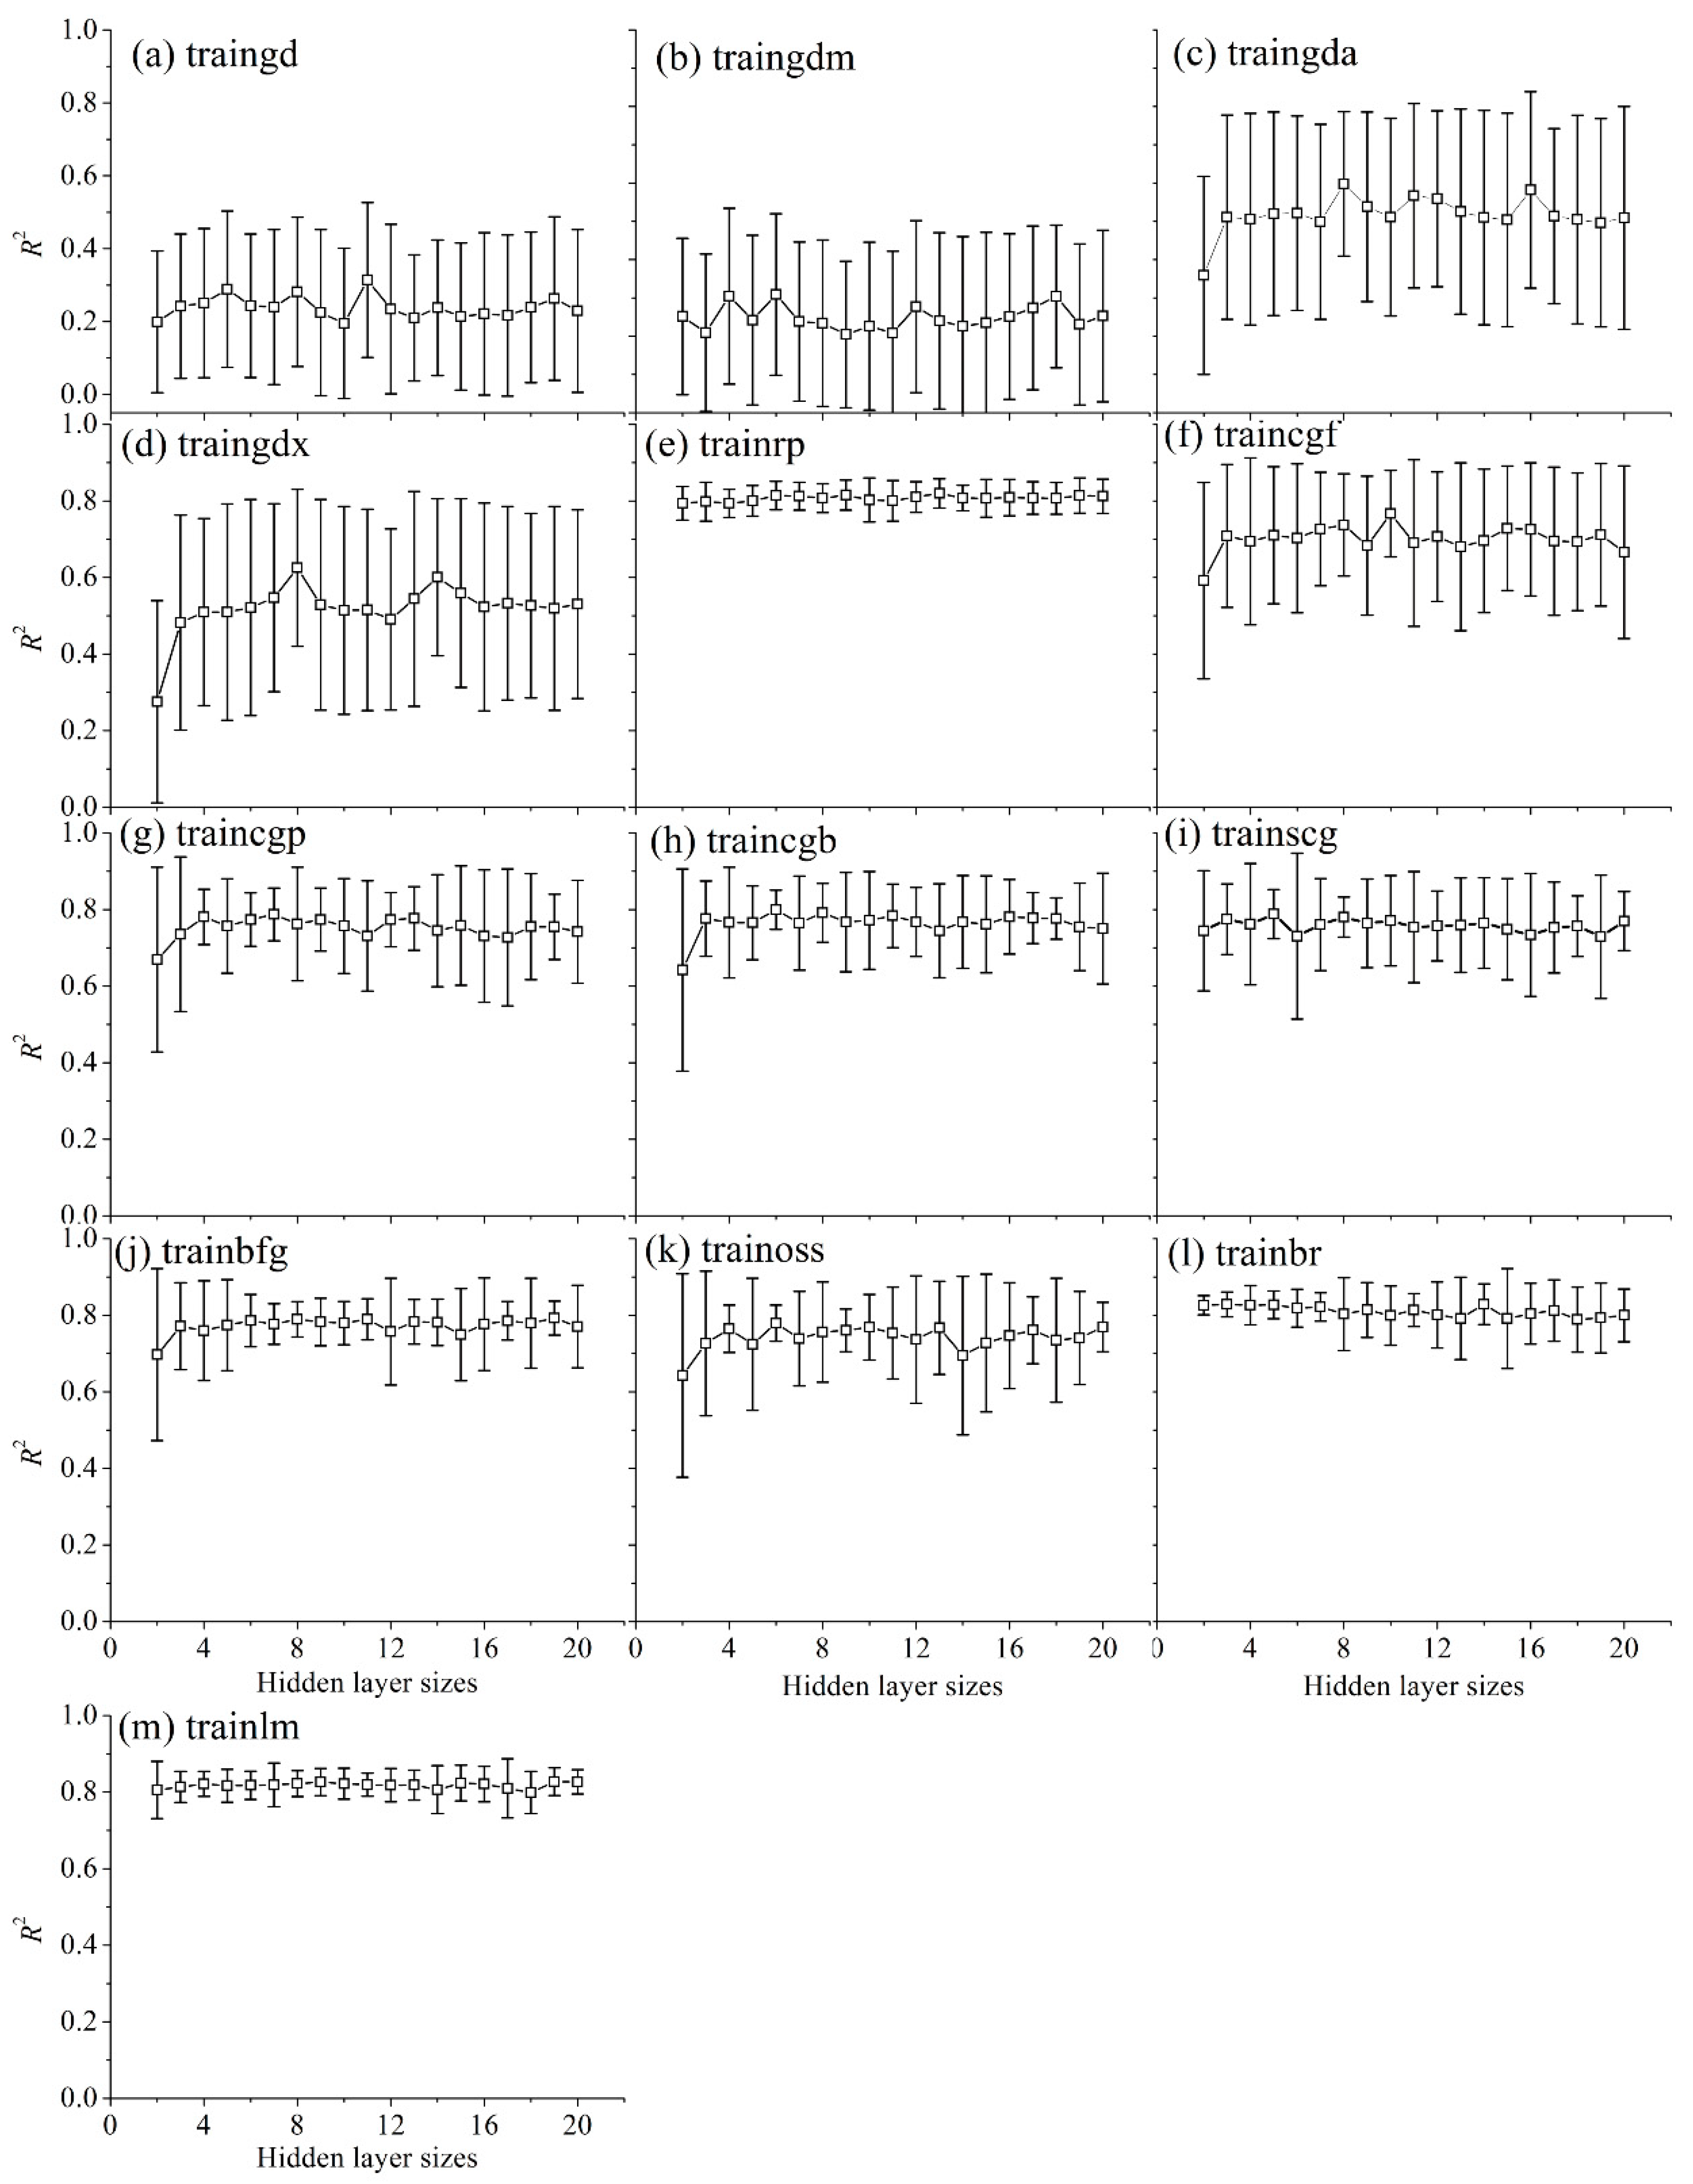
3.2. LNC Estimation Based on PCA

The training process of the BPNN model is to modify and update the weight of each neuron until the average sum squared error is optimal for all samples. However, the training function and the hidden layer size will influence the performance of the BPNN model, which results in the different accuracies of LNC estimation. In addition, different fluorescence characteristics were used to analyze LNC to compare the performance of the proposed fluorescence index for LNC estimation. Thus, the main fluorescence characteristics extracted by PCA were first used to estimate LNC based on the BPNN model, and the changes of R2 between the predicted and measured LNC with hidden layer sizes for different train functions are shown in Figure 3.
Figure 3 shows the changes of R2 between predicted and measured LNC with hidden layer size and different training functions based on fluorescence characteristics extracted through PCA. The black error bar represents one SD of mean values with 60 repetition times for each hidden layer size. The results show that the effect of hidden layer sizes on the LNC estimation can be ignored, and the training function is the major influencing factor by comparing the R2 values. By comparing the R2 and SD values, the “trianrp,” “trainbr,” and “trainlm” are superior to other training functions for LNC estimation. The overall robustness of train function “trianrp” is the best (Figure 3e). However, the BPNN model with the “trainbr” serves as the training function, and the hidden layer size set to three is optimal for LNC estimation based on the fluorescence characteristics extracted through PCA as input parameters. R2 and SD are 0.828, and 0.032, respectively (Figure 3l).

3.3. LNC Estimation Based on Fluorescence Ratio

Fluorescence ratios served as the input parameters to train the BPNN model with different training function and hidden layer sizes. The changes of R2 between the predicted and measured LNC with hidden layer size for different training functions are shown in Figure 4.
Figure 4 shows the changes of R2 with hidden size for different training functions by the BPNN model based on fluorescence ratios. By comparing the R2 and SD values, the “trianrp,” “trainbr,” “trainlm,” and “trainbfg” served as the training function in the BPNN model and exhibited high R2 and low SD. In addition, the hidden layer size will influence the stability of the BPNN model for LNC estimation. For fluorescence ratios serving as input parameter to train the BPNN model, the optimal train function “trainlm” and hidden layer size of 4 are selected. R2 and SD are 0.807 and 0.026, respectively.

3.4. LNC Estimation Based on the Proposed Fluorescence Index

LNC estimation based on the proposed fluorescence index served as input parameter to train the BPNN model. The performance of fluorescence index for LNC estimation is shown in Figure 5.
Figure 5 shows the performance of fluorescence index for LNC estimation based on the BPNN model. The black error bar denotes one SD of mean values with a repetition of 60 times. The effect of hidden layer sizes on the accuracy of LNC estimation cannot be ignored when “traingd,” “traingdm,” “traingda,” “traingdx,” “traincgf,” and “trainoss” were selected as training functions, which belonged to gradient descent methods. The possible interpretation is that the fluorescence characteristics may not be exhibited well as the gradient difference changed with the LNC in this investigation, when the gradient descent methods were selected to train BPNN model. In addition, the selection of training function may need to consider the number of input layers in BPNN model [37], and the detailed causes need to be further studied in future work. Although hidden layer size has a small effect on the accuracy of LNC estimation when the remaining training functions were selected in the BPNN model, it exhibited better performance for LNC estimation with high R2 and low SD. The optimal BPNN model parameter is achieved when “trainlm” serves as training function and the number of hidden layers is set to five. R2 and SD are 0.819 and 0.023, respectively. The results show the promising potential of proposed fluorescence index for LNC estimation.

3.5. Performance Analysis of Models

At present, LIF technology has been widely applied in remote sensing for monitoring the growth status of vegetation. In this study, the effect of hidden layer sizes and train function of BPNN model on the accuracy of LNC estimation was analyzed. The results demonstrated that the effect of the selected training function on the accuracy of LNC estimation is more evident than that of the hidden layer sizes. In this study, the minimum number of hidden layers is varying for different fluorescence characteristics which may be related to the input layer sizes. The “trainrp,” “trainbr,” and “trainlm” of training functions are superior to other training functions based on BPNN model for different fluorescence characteristics. In addition, a fluorescence index based on the slope of fluorescence spectrum was proposed and used to estimate LNC. For “traingd,” “traingdm,” “traingda,” “traingdx,” and “traincgf,” the proposed fluorescence index (the mean of R2 are 0.407, 0.412, 0.626, 0.636, and 0.746 corresponding to Figure 5a–d, and 5f, respectively) is superior to the fluorescence ratios (the mean of R2 are 0.342, 0.337, 0.596, 0.594, and 0.738 corresponding to Figure 4a–d, and 4f, respectively) and fluorescence characteristics calculated by PCA (the mean of R2 are 0.239, 0.248, 0.517, 0.518, and 0.701 corresponding to Figure 3a–d, and 3f, respectively) based on the gradient descent algorithm to train the BPNN model for LNC estimation. In addition, the proposed fluorescence index exhibited better reliability and stability with lower SD values than other fluorescence characteristics. The possible interpretation is that the fluorescence index can efficiently eliminate the effect of background noise on the fluorescence signal [38,39]. Fluorescence will be influenced by the fluctuation of environmental conditions and the leaf or canopy chlorophyll concentration. Although the fluorescence characteristics calculated based on PCA and fluorescence ratios cannot efficiently eliminate these influence factors, they can improve the detection of the differences of the fluorescence characteristics of different LNCs. However, the proposed fluorescence index based on the slope of fluorescence characteristic peaks can eliminate the effect of background noise on fluorescence characteristics to a certain extent [38,40,41]. Thus, the proposed fluorescence index exhibited promising potential due to its stability for LNC estimation.
In this study, the performance of different fluorescence characteristics for LNC estimation was compared based on the BPNN model. In addition, the effect of hidden layer sizes and training function of BPNN model on the accuracy of LNC estimation was analyzed. However, some limitations of this investigation should be considered. For example, a method to confirm the minimum number of hidden layers should be discussed, and as only the BPNN model was used in this research, other algorithms also need to be considered. In addition, whether the proposed fluorescence index can eliminate the effect of crop varieties or growth seasons on the fluorescence characteristics should be discussed in future work.

4. Conclusions

This study analyzed the performance of different fluorescence characteristics for LNC estimation based on the BPNN model. The experimental results demonstrated that the proposed fluorescence index is superior to the fluorescence ratios and fluorescence characteristics calculated by PCA based on the BPNN model due to its stability and the promising potential for LNC estimation. In addition, the effect of hidden layer sizes and training function of BPNN model on the accuracy of LNC estimation was discussed. The results showed that the hidden layer size has a smaller impact on the accuracy of LNC estimation than the selected training function of the BPNN model. The “trainrp,” “trainbr,” and “trainlm” of train functions are the optimal and can be selected to train the BPNN model in this study. However, to obtain a solid conclusion, more studies still need to be conducted with more algorithms, crop cultivars, and a wider variation range of LNC in the forthcoming research.

Author Contributions

This experiment was conducted and designed by J.Y., W.G., L.D., S.S., J.S., and B.W.C. The data processing was performed by J.Y. The manuscript was written by J.Y. All authors reviewed the manuscript.

Funding

This research was funded by the National Key R&D Program of China (Grant No. 2018YFB0504500), the National Natural Science Foundation of China (Grant No. 41801268), the Natural Science Foundation of Hubei Province (Grant No. 2018CFB272), the Open Fund of State Laboratory of Information Engineering in Surveying, Mapping and Remote Sensing, Wuhan University (Grant No. 17R05), Fundamental Research Funds for the Central Universities, China University of Geosciences (Wuhan) (Grant No. CUG170661).

Acknowledgments

The authors wish to thank College of Plant Science & Technology of Huazhong Agricultural University for providing the experimental samples and wish to thank Wuhan Academy of Agricultural Science & Technology for providing the LNCs of samples.

Conflicts of Interest

The authors declare no conflict of interest.

References

  1. Dalla Marta, A.; Orlando, F.; Mancini, M.; Guasconi, F.; Motha, R.; Qu, J.; Orlandini, S. A simplified index for an early estimation of durum wheat yield in Tuscany (Central Italy). Field Crop. Res. 2015, 170, 1–6. [Google Scholar] [CrossRef]
  2. Yao, X.; Zhu, Y.; Tian, Y.; Feng, W.; Cao, W. Exploring hyperspectral bands and estimation indices for leaf nitrogen accumulation in wheat. Int. J. Appl. Earth Obs. Geoinf. 2010, 12, 89–100. [Google Scholar] [CrossRef]
  3. Zhu, Y.; Li, Y.; Feng, W.; Tian, Y.; Yao, X.; Cao, W. Monitoring leaf nitrogen in wheat using canopy reflectance spectra. Can. J. Plant. Sci. 2006, 86, 1037–1046. [Google Scholar] [CrossRef] [Green Version]
  4. Mulla, D.J. Twenty-five years of remote sensing in precision agriculture: Key advances and remaining knowledge gaps. Biosyst. Eng. 2013, 114, 358–371. [Google Scholar] [CrossRef]
  5. Diacono, M.; Rubino, P.; Montemurro, F. Precision nitrogen management of wheat: A review. Agron. Sustain. Dev. 2013, 33, 219–241. [Google Scholar] [CrossRef]
  6. Tian, Y.C.; Yao, X.; Yang, J.; Cao, W.X.; Hannaway, D.B.; Zhu, Y. Assessing newly developed and published vegetation indices for estimating rice leaf nitrogen concentration with ground- and space-based hyperspectral reflectance. Field Crop. Res. 2011, 120, 299–310. [Google Scholar] [CrossRef]
  7. Li, F.; Mistele, B.; Hu, Y.; Chen, X.; Schmidhalter, U. Reflectance estimation of canopy nitrogen content in winter wheat using optimised hyperspectral spectral indices and partial least squares regression. Eur. J. Agron. 2014, 52, 198–209. [Google Scholar] [CrossRef]
  8. Tian, Y.C.; Gu, K.J.; Chu, X.; Yao, X.; Cao, W.X.; Zhu, Y. Comparison of different hyperspectral vegetation indices for canopy leaf nitrogen concentration estimation in rice. Plant Soil 2013, 376, 193–209. [Google Scholar] [CrossRef]
  9. Kira, O.; Linker, R.; Gitelson, A. Non-destructive estimation of foliar chlorophyll and carotenoid contents: Focus on informative spectral bands. Int. J. Appl. Earth Obs. Geoinf. 2015, 38, 251–260. [Google Scholar] [CrossRef]
  10. Bassanezi, R.; Amorim, L.; BERGER, R. Gas exchange and emission of chlorophyll fluorescence during the monocycle of rust, angular leaf spot and anthracnose on bean leaves as a function of their trophic characteristics. J. Phytopathol. 2002, 150, 37–47. [Google Scholar] [CrossRef]
  11. Gaulton, R.; Danson, F.M.; Ramirez, F.A.; Gunawan, O. The potential of dual-wavelength laser scanning for estimating vegetation moisture content. Remote Sens. Environ. 2013, 132, 32–39. [Google Scholar] [CrossRef]
  12. Cendrero-Mateo, M.P.; Moran, M.S.; Papuga, S.A.; Thorp, K.; Alonso, L.; Moreno, J.; Ponce-Campos, G.; Rascher, U.; Wang, G. Plant chlorophyll fluorescence: Active and passive measurements at canopy and leaf scales with different nitrogen treatments. J. Exp. Bot. 2016, 67, 275–286. [Google Scholar] [CrossRef] [PubMed]
  13. Gong, W.; Song, S.L.; Zhu, B.; Shi, S.; Li, F.; Cheng, X. Multi-wavelength canopy lidar for remote sensing of vegetation: Design and system performance. ISPRS J. Photogramm. 2012, 69, 1–9. [Google Scholar]
  14. Wang, J.; Xiao, X.; Qin, Y.; Dong, J.; Zhang, G.; Kou, W.; Jin, C.; Zhou, Y.; Zhang, Y. Mapping paddy rice planting area in wheat-rice double-cropped areas through integration of landsat-8 oli, modis, and palsar images. Sci. Rep. 2015, 5, 10088. [Google Scholar] [CrossRef] [PubMed]
  15. Edner, H.; Johansson, J.; Ragnarsson, P.; Svanberg, S.; Wallinder, E. Remote monitoring of vegetation using a fluorescence lidar system in spectrally resolving and multi-spectral imaging modes. EARSel Adv. Remote Sens. 1995, 3, 198–206. [Google Scholar]
  16. Steinvall, O.; Tulldahl, M. Feasibility study for airborne fluorescence/reflectivity lidar bathymetry. Proc. SPIE Int. Soc. Opt. Eng. 2012, 8379, 837914. [Google Scholar]
  17. Kalaji, H.M.; Jajoo, A.; Oukarroum, A.; Brestic, M.; Zivcak, M.; Samborska, I.A.; Cetner, M.D.; Łukasik, I.; Goltsev, V.; Ladle, R.J. Chlorophyll a fluorescence as a tool to monitor physiological status of plants under abiotic stress conditions. Acta Physiol. Plant. 2016, 38, 1–11. [Google Scholar] [CrossRef]
  18. Zivcak, M.; Brestic, M.; Kunderlikova, K.; Sytar, O.; Allakhverdiev, S.I. Repetitive light pulse-induced photoinhibition of photosystem i severely affects Co2 assimilation and photoprotection in wheat leaves. Photosynth. Res. 2015, 126, 449–463. [Google Scholar] [CrossRef] [PubMed]
  19. Živčák, M.; Brestic, M.; Kalaji, H.M. Photosynthetic responses of sun-and shade-grown barley leaves to high light: Is the lower PSII connectivity in shade leaves associated with protection against excess of light? Photosynth. Res. 2014, 119, 339–354. [Google Scholar] [CrossRef] [PubMed]
  20. Kalaji, H.M.; Schansker, G.; Ladle, R.J.; Goltsev, V.; Bosa, K.; Allakhverdiev, S.I.; Brestic, M.; Bussotti, F.; Calatayud, A.; Dąbrowski, P. Frequently asked questions about in vivo chlorophyll fluorescence: Practical issues. Photosynth. Res. 2014, 122, 121–158. [Google Scholar] [CrossRef] [PubMed]
  21. Subhash, N.; Mohanan, C.N. Laser-induced red chlorophyll fluorescence signatures as nutrient stress indicator in rice plants. Remote Sens. Environ. 1994, 47, 45–50. [Google Scholar] [CrossRef]
  22. Günther, K.; Dahn, H.-G.; Lüdeker, W. Remote sensing vegetation status by laser-induced fluorescence. Remote Sens. Environ. 1994, 47, 10–17. [Google Scholar] [CrossRef]
  23. Yang, J.; Song, S.L.; Du, L.; Shi, S.; Gong, W.; Sun, J.; Chen, B.W. Analyzing the effect of fluorescence characteristics on leaf nitrogen concentration estimation. Remote Sens. 2018, 10, 1402. [Google Scholar] [CrossRef]
  24. Yang, J.; Du, L.; Gong, W.; Shi, S.; Sun, J.; Chen, B.W. Potential of vegetation indices combined with laser-induced fluorescence parameters for monitoring leaf nitrogen content in paddy rice. PLoS ONE 2018, 13, e0191068. [Google Scholar] [CrossRef] [PubMed]
  25. Yang, J.; Sun, J.; Du, L.; Chen, B.; Zhang, Z.; Shi, S.; Gong, W. Effect of fluorescence characteristics and different algorithms on the estimation of leaf nitrogen content based on laser-induced fluorescence lidar in paddy rice. Opt. Express 2017, 25, 3743–3755. [Google Scholar] [CrossRef] [PubMed]
  26. Buschmann, C. Variability and application of the chlorophyll fluorescence emission ratio red/far-red of leaves. Photosynth. Res. 2007, 92, 261–271. [Google Scholar] [CrossRef] [PubMed]
  27. Song, S.; Gong, W.; Zhu, B.; Huang, X. Wavelength selection and spectral discrimination for paddy rice, with laboratory measurements of hyperspectral leaf reflectance. ISPRS J. Photogramm. 2011, 66, 672–682. [Google Scholar] [CrossRef]
  28. Živcak, M.; Olsovska, K.; Slamka, P.; Galambošová, J.; Rataj, V.; Shao, H.; Brestič, M. Application of chlorophyll fluorescence performance indices to assess the wheat photosynthetic functions influenced by nitrogen deficiency. Plant Soil Environ. 2014, 60, 210–215. [Google Scholar] [CrossRef] [Green Version]
  29. Wutzke, K.D.; Heine, W. A century of kjeldahl’s nitrogen determination. Z. Med. Lab. 1985, 26, 383–388. [Google Scholar]
  30. Tremblay, N.; Wang, Z.; Cerovic, Z.G. Sensing crop nitrogen status with fluorescence indicators. A review. Agron. Sustain. Dev. 2012, 32, 451–464. [Google Scholar] [CrossRef]
  31. Goltsev, V.; Zaharieva, I.; Chernev, P.; Kouzmanova, M.; Kalaji, H.M.; Yordanov, I.; Krasteva, V.; Alexandrov, V.; Stefanov, D.; Allakhverdiev, S.I. Drought-induced modifications of photosynthetic electron transport in intact leaves: Analysis and use of neural networks as a tool for a rapid non-invasive estimation. Biochim. Biophys. Acta 2012, 1817, 1490–1498. [Google Scholar] [CrossRef] [PubMed] [Green Version]
  32. Buscema, M. Back propagation neural networks. Subst. Use Misuse 1998, 33, 233–270. [Google Scholar] [CrossRef] [PubMed]
  33. Samborska, A.I.; Alexandrov, V.; Sieczko, L.; Kornatowska, B.; Goltsev, V.; Magdalena, D.C.; Kalaji, H.M. Artificial neural networks and their application in biological and agricultural research. Signpost Open Access J. Nanophotobiosci. 2014, 2, 14–30. [Google Scholar]
  34. Ramos, M.E.; Lagorio, M.G. True fluorescence spectra of leaves. Photochem. Photobiol. Sci. 2004, 3, 1063–1066. [Google Scholar] [CrossRef] [PubMed]
  35. Malenovsky, Z.; Mishra, K.B.; Zemek, F.; Rascher, U.; Nedbal, L. Scientific and technical challenges in remote sensing of plant canopy reflectance and fluorescence. J. Exp. Bot. 2009, 60, 2987–3004. [Google Scholar] [CrossRef] [PubMed] [Green Version]
  36. Farkas, D.L.; Gouveia-Neto, A.S.; Silva, J.E.A.; Costa, E.B.; Bueno, L.A.; Silva, L.M.H.; Granja, M.M.C.; Medeiros, M.J.L.; Câmara, T.J.R.; Willadino, L.G.; et al. Plant abiotic stress diagnostic by laser induced chlorophyll fluorescence spectral analysis of in vivo leaf tissue of biofuel species. Int. Soc. Opt. Photonics 2010, 7568, 75680G–75688G. [Google Scholar]
  37. Sun, J.; Yang, J.; Shi, S.; Chen, B.; Du, L.; Gong, W.; Song, S.L. Estimating rice leaf nitrogen concentration: Influence of regression algorithms based on passive and active leaf reflectance. Remote Sens. 2017, 9, 951. [Google Scholar] [CrossRef]
  38. Ali, K.; Witter, D.; Ortiz, J. Multivariate approach to estimate colour producing agents in case 2 waters using first-derivative spectrophotometer data. Geocarto Int. 2014, 29, 102–127. [Google Scholar] [CrossRef]
  39. Yang, J.; Du, L.; Gong, W.; Shi, S.; Sun, J.; Chen, B. Analyzing the performance of the first-derivative fluorescence spectrum for estimating leaf nitrogen concentration. Opt. Express 2019, 27, 3987–3990. [Google Scholar] [CrossRef]
  40. Ortiz, J.D. Application of visible/near infrared derivative spectroscopy to arctic paleoceanography. IOP Conf. Ser. Earth Environ. Sci. 2011, 14, 221–227. [Google Scholar] [CrossRef]
  41. Gholizadeh, A.; Borůvka, L.; Saberioon, M.M.; Kozák, J.; Vašát, R.; Němeček, K. Comparing different data preprocessing methods for monitoring soil heavy metals based on soil spectral features. Soil Water Res. 2015, 10, 218–227. [Google Scholar] [CrossRef]
Figure 1. Relationship between the fluorescence characteristics peak intensity at 740 and 685 nm with increasing leaf nitrogen concentration (LNC).
Applsci 09 00916 g001
Figure 2. Relationship between the proposed fluorescence characteristics and LNC. The solid line is the linear regression analysis.
Applsci 09 00916 g002
Figure 3. Performance of back-propagation neural network (BPNN) for LNC estimation based on fluorescence characteristics calculated by principal component analysis (PCA) varying with hidden layer sizes for different training functions. The black error bar represents one standard deviation of mean values.
Applsci 09 00916 g003
Figure 4. Performance of BPNN for LNC estimation based on the published fluorescence indices varying with hidden layer sizes for different training function. The black error bar represents one standard deviation of mean values.
Applsci 09 00916 g004
Figure 5. Performance of the proposed fluorescence indices for LNC estimation based on BPNN model with hidden layer sizes for different training function. The black error bar represents one standard deviation of mean values.
Applsci 09 00916 g005

