Article

Sensitivity Analysis of Multi-Temporal Sentinel-1 SAR Parameters to Crop Height and Canopy Coverage

by
Rouhollah Nasirzadehdizaji
1,*,
Fusun Balik Sanli
1,*,
Saygin Abdikan
2,
Ziyadin Cakir
3,
Aliihsan Sekertekin
4 and
Mustafa Ustuner
1
1
Department of Geomatic Engineering, Yildiz Technical University, Esenler, İstanbul 34220, Turkey
2
Department of Geomatics Engineering, Zonguldak Bulent Ecevit University, Zonguldak 67100, Turkey
3
Department of Geology, Faculty of Mines, Istanbul Technical University, Maslak, Istanbul 34469, Turkey
4
Department of Geomatic Engineering, Cukurova University, Ceyhan, Adana 01950, Turkey
*
Authors to whom correspondence should be addressed.
Appl. Sci. 2019, 9(4), 655; https://doi.org/10.3390/app9040655
Submission received: 24 December 2018 / Revised: 8 February 2019 / Accepted: 9 February 2019 / Published: 15 February 2019
(This article belongs to the Section Computing and Artificial Intelligence)

Abstract

:
The Polarimetric Synthetic Aperture Radar technique has provided various opportunities and challenges in agricultural activities mainly on crop management. The aim of this study is to investigate the sensitivity of 10 parameters derived from multi-temporal Sentinel-1 Synthetic Aperture Radar (SAR) data, to crop height and canopy coverage (CC) of maize, sunflower, and wheat. The correlation coefficient values indicate a high correlation for maize during the early growing stage. The coefficient determinations (R2) of 0.82 and 0.81 indicate that there is a strong relationship between the maize height and SAR parameters including VV + VH and VV, respectively. The maize CC is well correlated with VV parameter (R2 = 0.73), but it is observed that at the later growing stage the correlation became weaker. This means that the sensitivity decreases with increasing vegetation cover growth. Compared to maize, the sensitivity of SAR parameters to wheat variables is often good at the early stage. However, the highest correlation with wheat height represented by Alpha (α) decomposition parameter (R2 = 0.67). The sunflower height has an insignificant correlation with the majority of SAR parameters and only VH polarization shows low sensitivity (R2 = 0.31). The sunflower CC shows relatively higher correlation with VV polarization (R2 = 0.46) at the early stage while no considerable correlation is observed at the later stage. It is found that Sentinel-1 has a high potential for estimation of crop height and CC of the maize as a broad-leaf crop. The same is not true for sunflower as another broad-leaf crop.

1. Introduction

Spatio-temporal monitoring and evaluation of crop types as food resources has substantial importance in socio-economic issues of societies and it is essential for the sustainable management of agricultural activities. Thus, decision makers can have accurate and updated information regarding crops management; agricultural production planning, food security stability promotion, crop trading market etc. Besides, farmers also benefit from obtaining timely information of crop growth as well as yield estimation. The superiority of radar remote sensing techniques and capabilities of Synthetic Aperture Radar (SAR) technology have convinced researchers and government officials to apply it as a widely used, practical and efficient tool in such applications [1]. The SAR technique has become increasingly an effective method of providing seasonal agricultural monitoring [1,2]. SAR is a coherent radar system that generates high-resolution remote sensing imagery. A SAR sensor has capability to collect data in different weather conditions where the cloudy sky in most time of the growing season (particularly in rainy climate) is a serious obstacle to the application of optical images. Moreover, it can acquire data in day-or-night; exclusivity makes it suitable for long-term and multi-seasonal agricultural monitoring [3]. The SAR system is sensitive to the vegetation biophysical variables and dynamical characteristics of plant targets, and underlying soil parameters such as plant water content, geometric property, deflection and irregularity, soil surface roughness and moisture content [4,5]. Ka, Ku, X, C, and L are different multi-frequency SAR data acquisition configurations regarding the crop biophysical variables investigation. Ka, Ku, and X bands have high frequencies and short wavelengths in compare with C and L bands [6]. In a review paper by McNairn and Brisco [7], it is discussed that longer wavelength can penetrate into the crop canopy more than the shorter wavelength and therefore it is less affected by soil. Long wavelength such as L-Band (~24 cm) can penetrate subsurface resulting in higher soil scattering contribution while shorter wavelength such as X-Band (~3 cm) and C-band (~6 cm) mainly interacting with upper part of the canopy segment [8]. Therefore, polarimetric SAR C-band data has high potential for biomass and crop coverage estimation [9,10].
Previous studies have demonstrated the sensitivity of polarimetric SAR to crop variables such as crop leaf area index (LAI), and crop biomass [6,11,12]. Processing and analyzing of the radar signals indices at different wavelengths, frequencies, incident angles, and polarization are amongst the techniques used in the studies of the crop biophysical characteristics [6]. In a study of monitoring and estimating wheat yield, Mattia et al. [11] investigated the sensitivity of multi-temporal C-band, polarizations (HH and VV) to biophysical parameters, and the relationship between the radar and biophysical measurements on the wheat development stages. In order to maximize the sensitivity of SAR sensors for the maize growth cycle monitoring and mitigating the soil moisture impact on the signal and in SAR time series, Blaes et al. [13] developed a model by simulating the signal in all possible configurations (polarization and incidence angles at C-band) for ENVISAT, RADARSAT, and ERS SAR images and they found that dual polarizations indices are more sensitive to maize growth and less sensitive to soil moisture variations. Ruiz et al. [5] utilized multi-polarized RADARSAT-2 data to set up indicators of crop condition and yield estimation for corn crop growth stages by obtaining polarization signatures from radar data, and applying related crop parameters and vegetation indices in Central Mexico. The results indicate that the application of RADARSAT-2 polarimetric SAR data isoperational in the agricultural activities. Interactions between radar configuration (frequency, wavelength, polarity, and incident angle) with each other, as well as its interaction with the plant variables, has made the use and interpretation of radar data useful but complicated [9,14,15]. Therefore, in agricultural studies, radar parameters which affect the signal scatter and target parameters that influence the signal propagation should be deliberately investigated. The target parameters mainly depend upon dielectric constant and geometric properties. Dielectric constant is closely related to the plant’s water volume, and the shape, size, and orientation of leaves, stalks, and fruits are relevant to geometric properties. Radar wavelengths are sensitive to target parameters [1]. Hence, the preference of microwave data type is one of the substantial issues in agricultural studies.
According to their leaf size among the various types of agricultural products and their significant role in the world trading market, maize, sunflower (broad-leaf), and wheat (narrow-leaf) crops are investigated to evaluate the potential of multi-temporal Sentinel-1 SAR data in crop development monitoring. In radar vegetation studies among the crop variables, crop height, and canopy coverage (CC) are two main application objectives. In order to obtain the crop status and predict its efficiency, it is necessary to link each of the variations (phenological changes) with the crop-growing conditions (height and coverage) by applying the scattering mechanisms and parameters. Crop height has a close relationship with crop biomass and growth stages, and it is an important variable for crop development observation, crop identification and yield estimation [7,16]. CC is used to estimate the influence area of the plant and defined as the percent of a fixed area covered by the crown of an individual plant species to the bare soil in a unit area. The total CC can reach a hundred percent (fully covered) since plants can overlap. Liao et al. [17] investigated the sensitivity of RADARSAT-2 polarimetric SAR (C-band) data using sixteen parameters to crop height and fractional vegetation cover (FVC) variables of corn and wheat. They explored that the corn height and FVC are strongly correlated with SAR parameters at the early growing stage but the correlation is low at the later growing stages. Furthermore, they observed that the sensitivity of SAR parameters to wheat variables (height and FVC) is very low. The study concluded that RADARSAT-2 polarimetric SAR (C-band) data has high potential in crop variables estimation for broad-leaf crops.
The Sentinel-1 mission is designed as a two-satellite constellation (Sentinel-1A and -1B) that equipped with a dual-polarized C-band SAR 20 m spatial resolution, and six days revisit time. Besides, the data can be acquired in different operational modes which enable users to access freely available long-term data archive for applications requiring long-range time series analyses. Abdikan et al. [3] utilized Sentinel-1 dual polarimetric C-band SAR images to study the efficiency of the sensor backscatter patterns for crop growth of maize in Turkey and revealed that the Sentinel-1 dual-polarized data provides useful information regarding plant development for agriculture monitoring and valid crop mapping. The potential use of Sentinel-1 radar data has been studied by Bousbih et al. [18] to estimate the soil characteristics and vegetation variables in agricultural areas. They reported that the sensitivity of the Sentinel-1 measurements to crop parameters decreases with increasing crop cover growth and variation in vegetation parameters.
This study investigates the potential of Sentinel-1 dual polarimetric SAR in estimation and monitoring of crop parameters, namely crop height and CC in an agricultural area. The objective of this study is to evaluate the sensitivity of different Sentinel-1 dual polarimetric SAR parameters to crop height and CC of maize, sunflower and wheat, and to investigate the changes in SAR backscatter arising from crop height and CC during crop phenological stages.

2. Materials and Methods

Within this framework, we have investigated the sensitivity of 10 parameters including linear polarization backscattering coefficients, H-A-α decompositions, polarization intensity ratios (VH/VV, VV/VH and VV − VH/VV + VH), Radar Vegetation Index (RVI) and intensity arithmetic calculations (VH − VV and VV + VH) derived from multi-temporal C-band Sentinel-1 SAR data, to crop height and Canopy Coverage (CC) of maize, sunflower, and wheat. For this purpose, field measurements were carried out simultaneously with SAR data acquisitions. For backscattering analysis four Sentinel-1 SAR images in descending orbit direction were acquired throughout the same growth season of the study area.

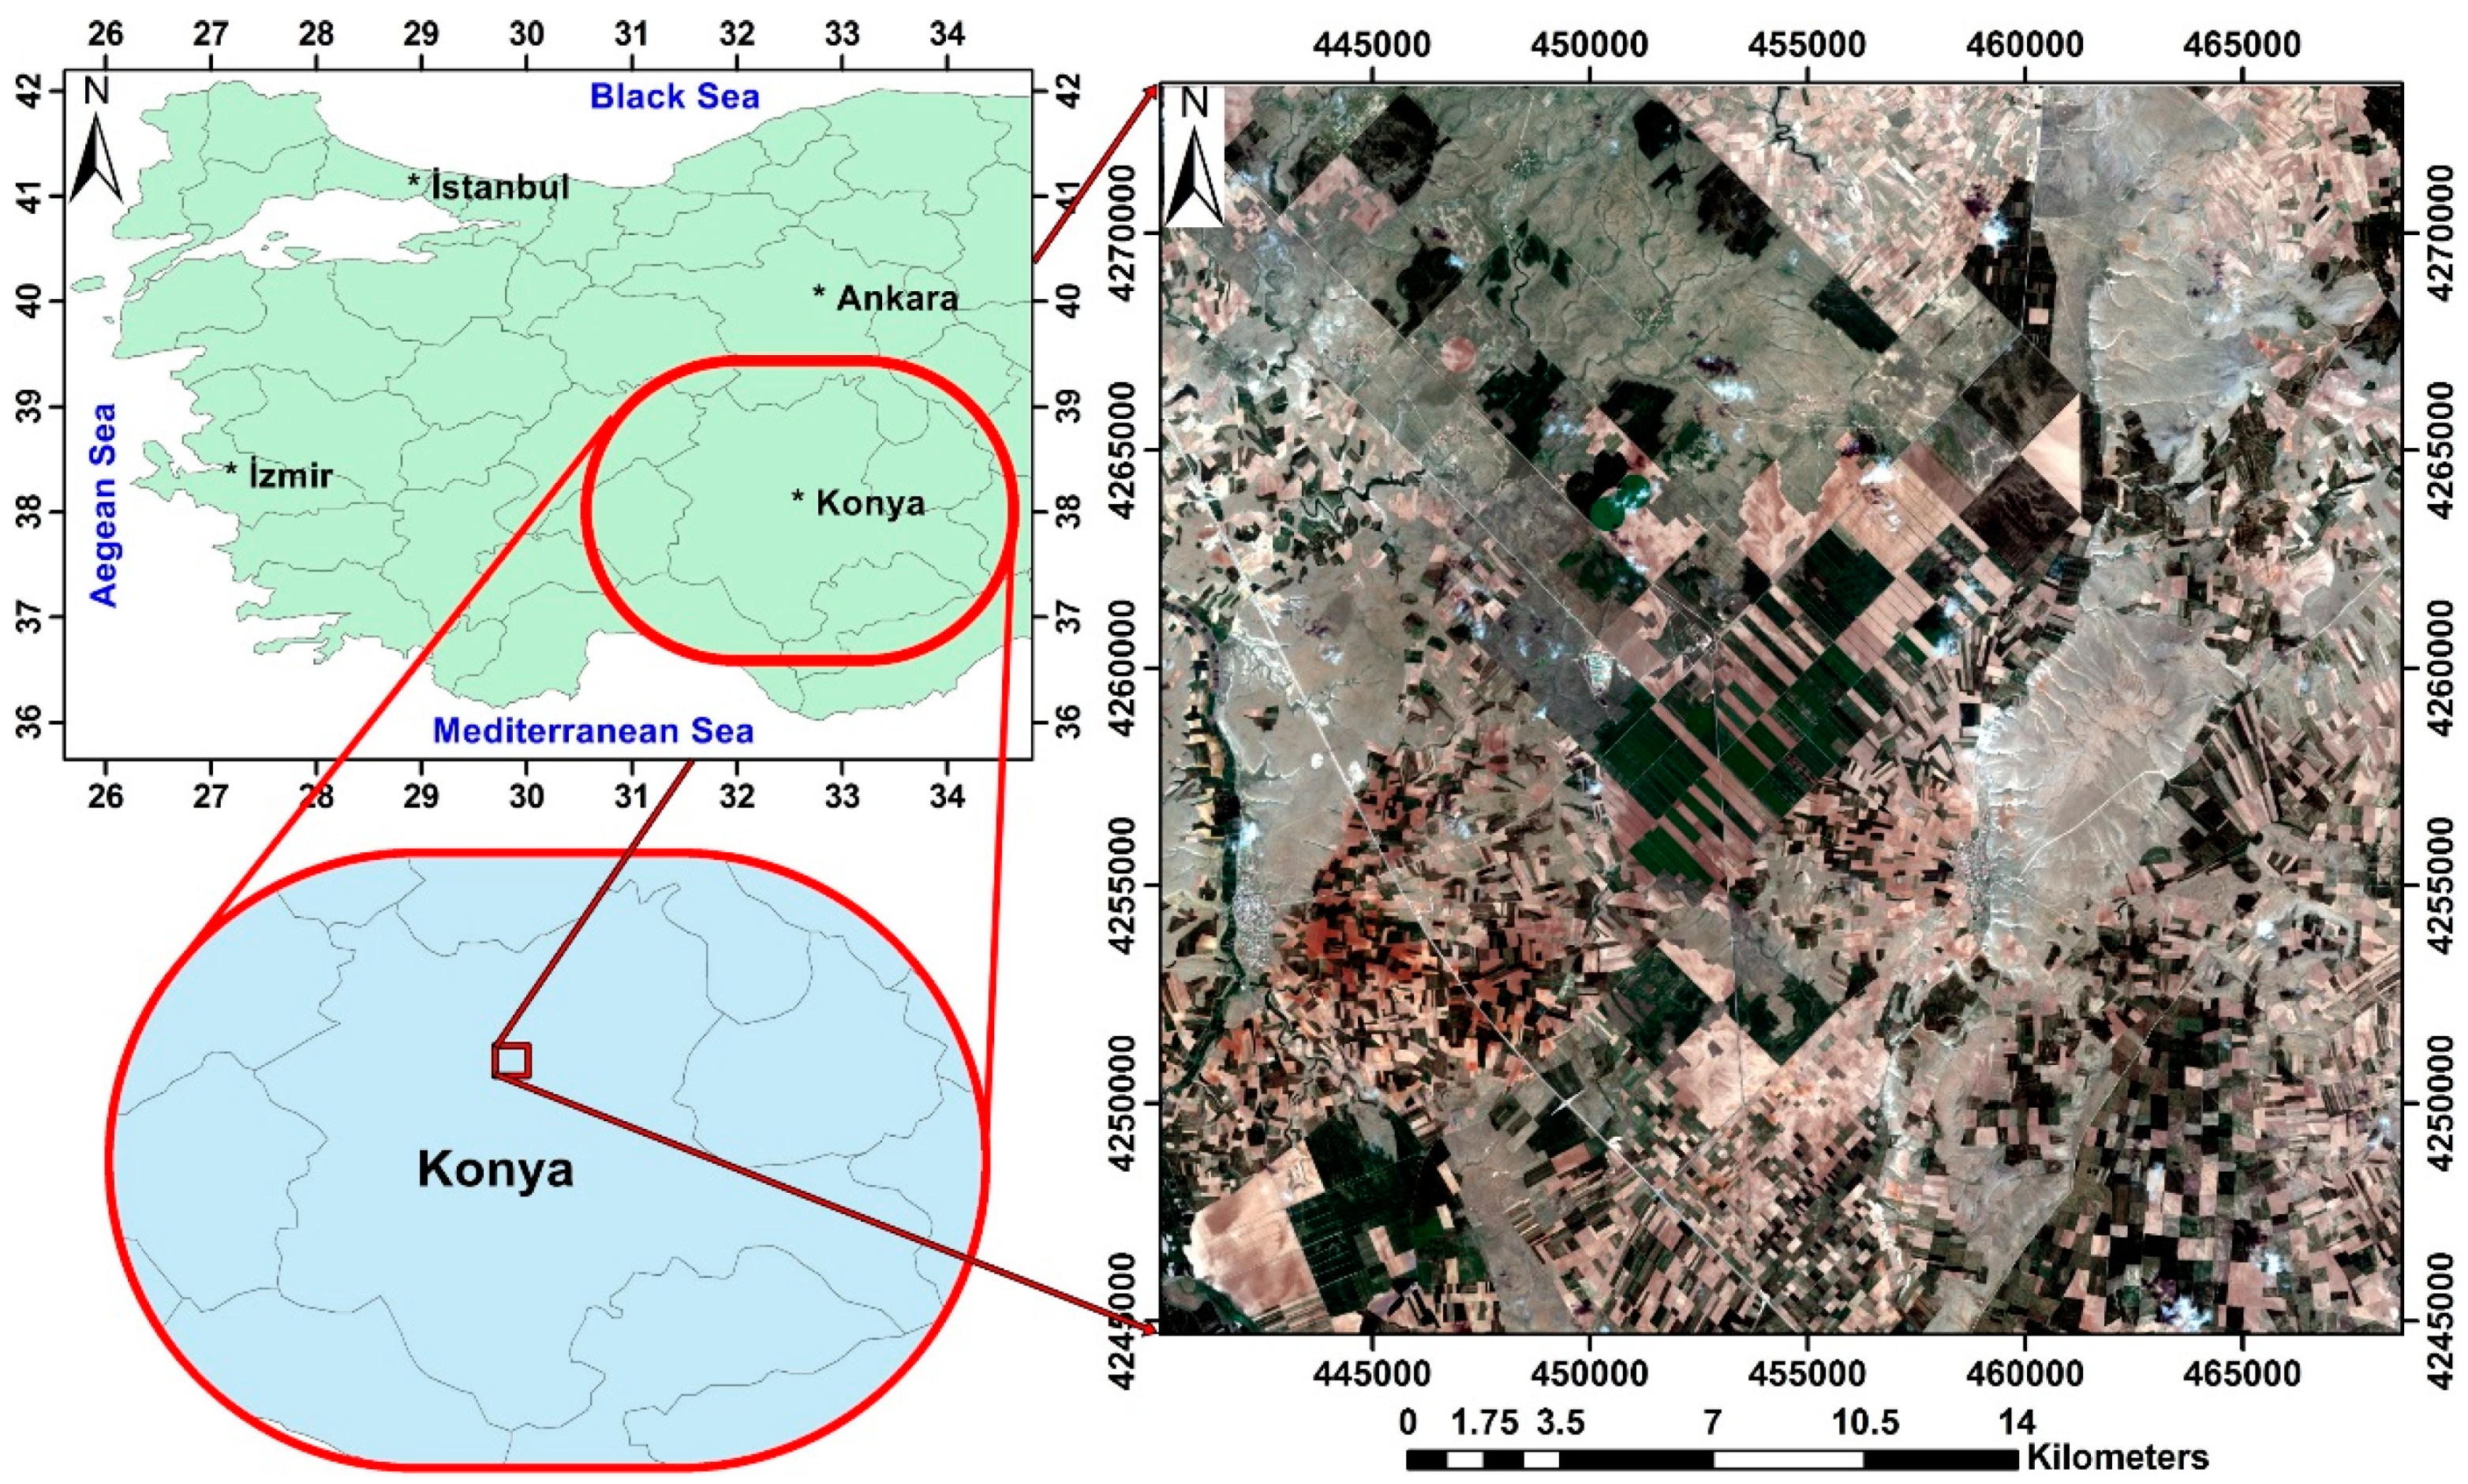
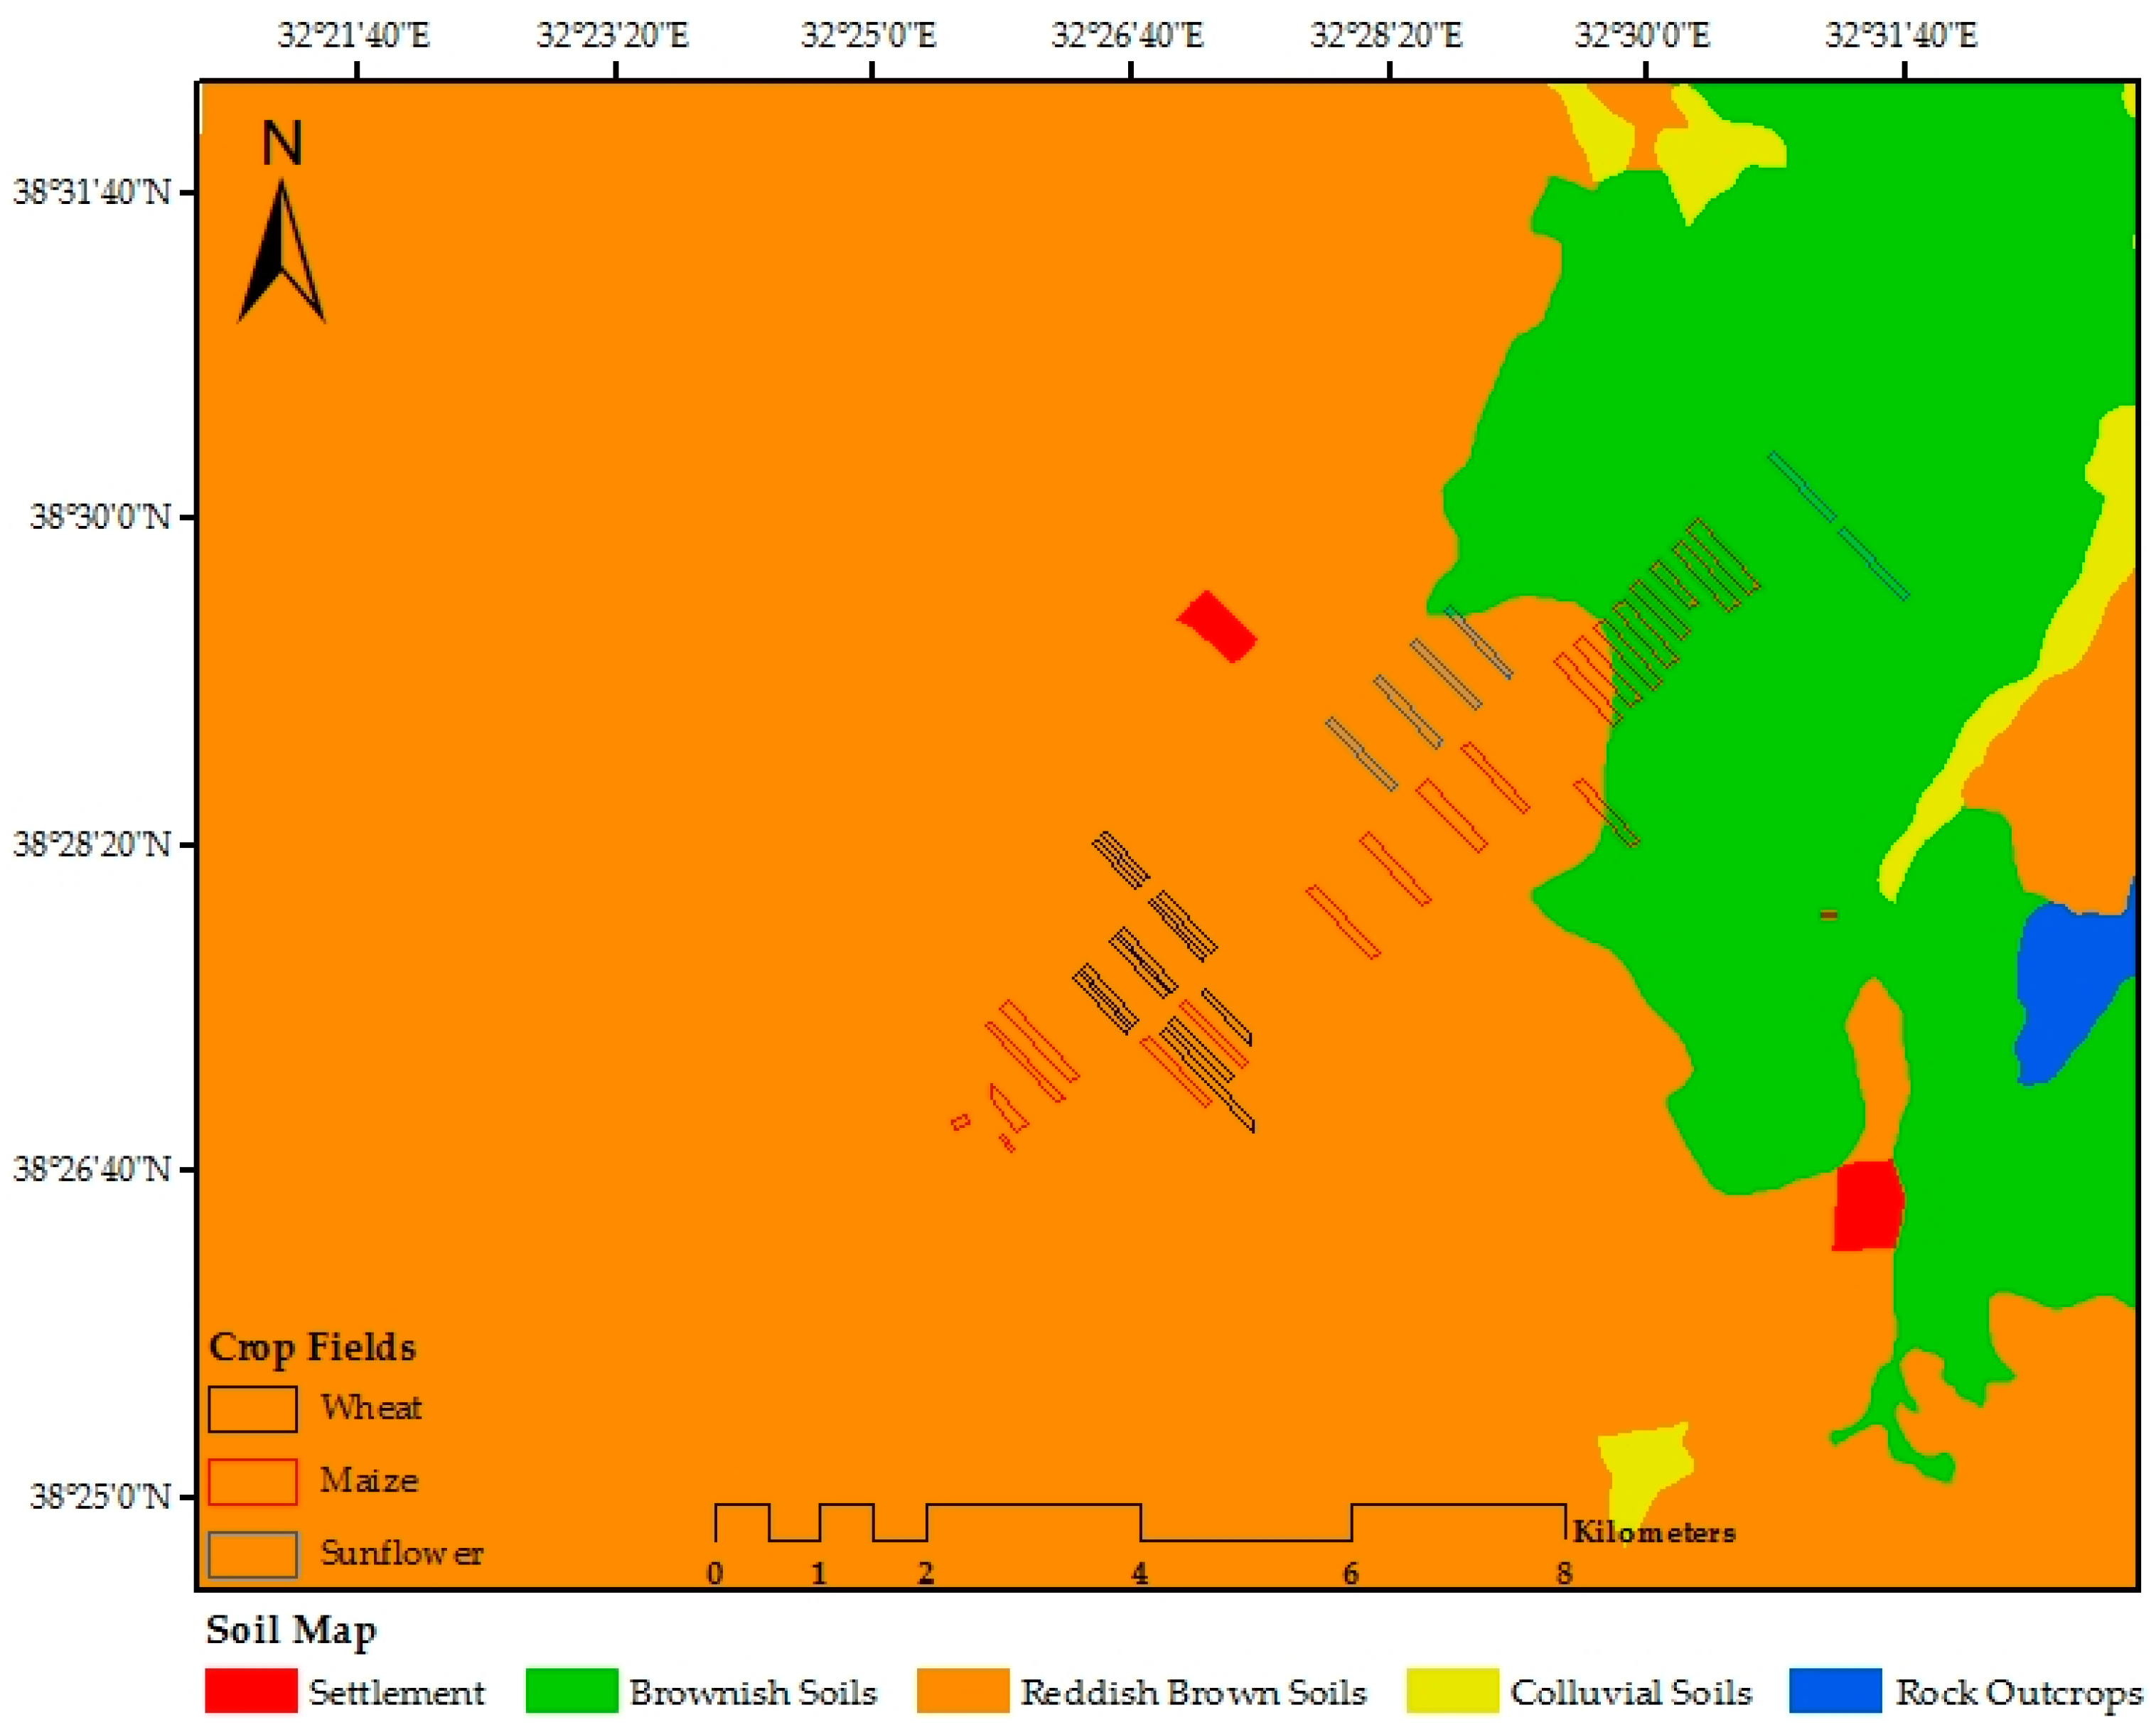
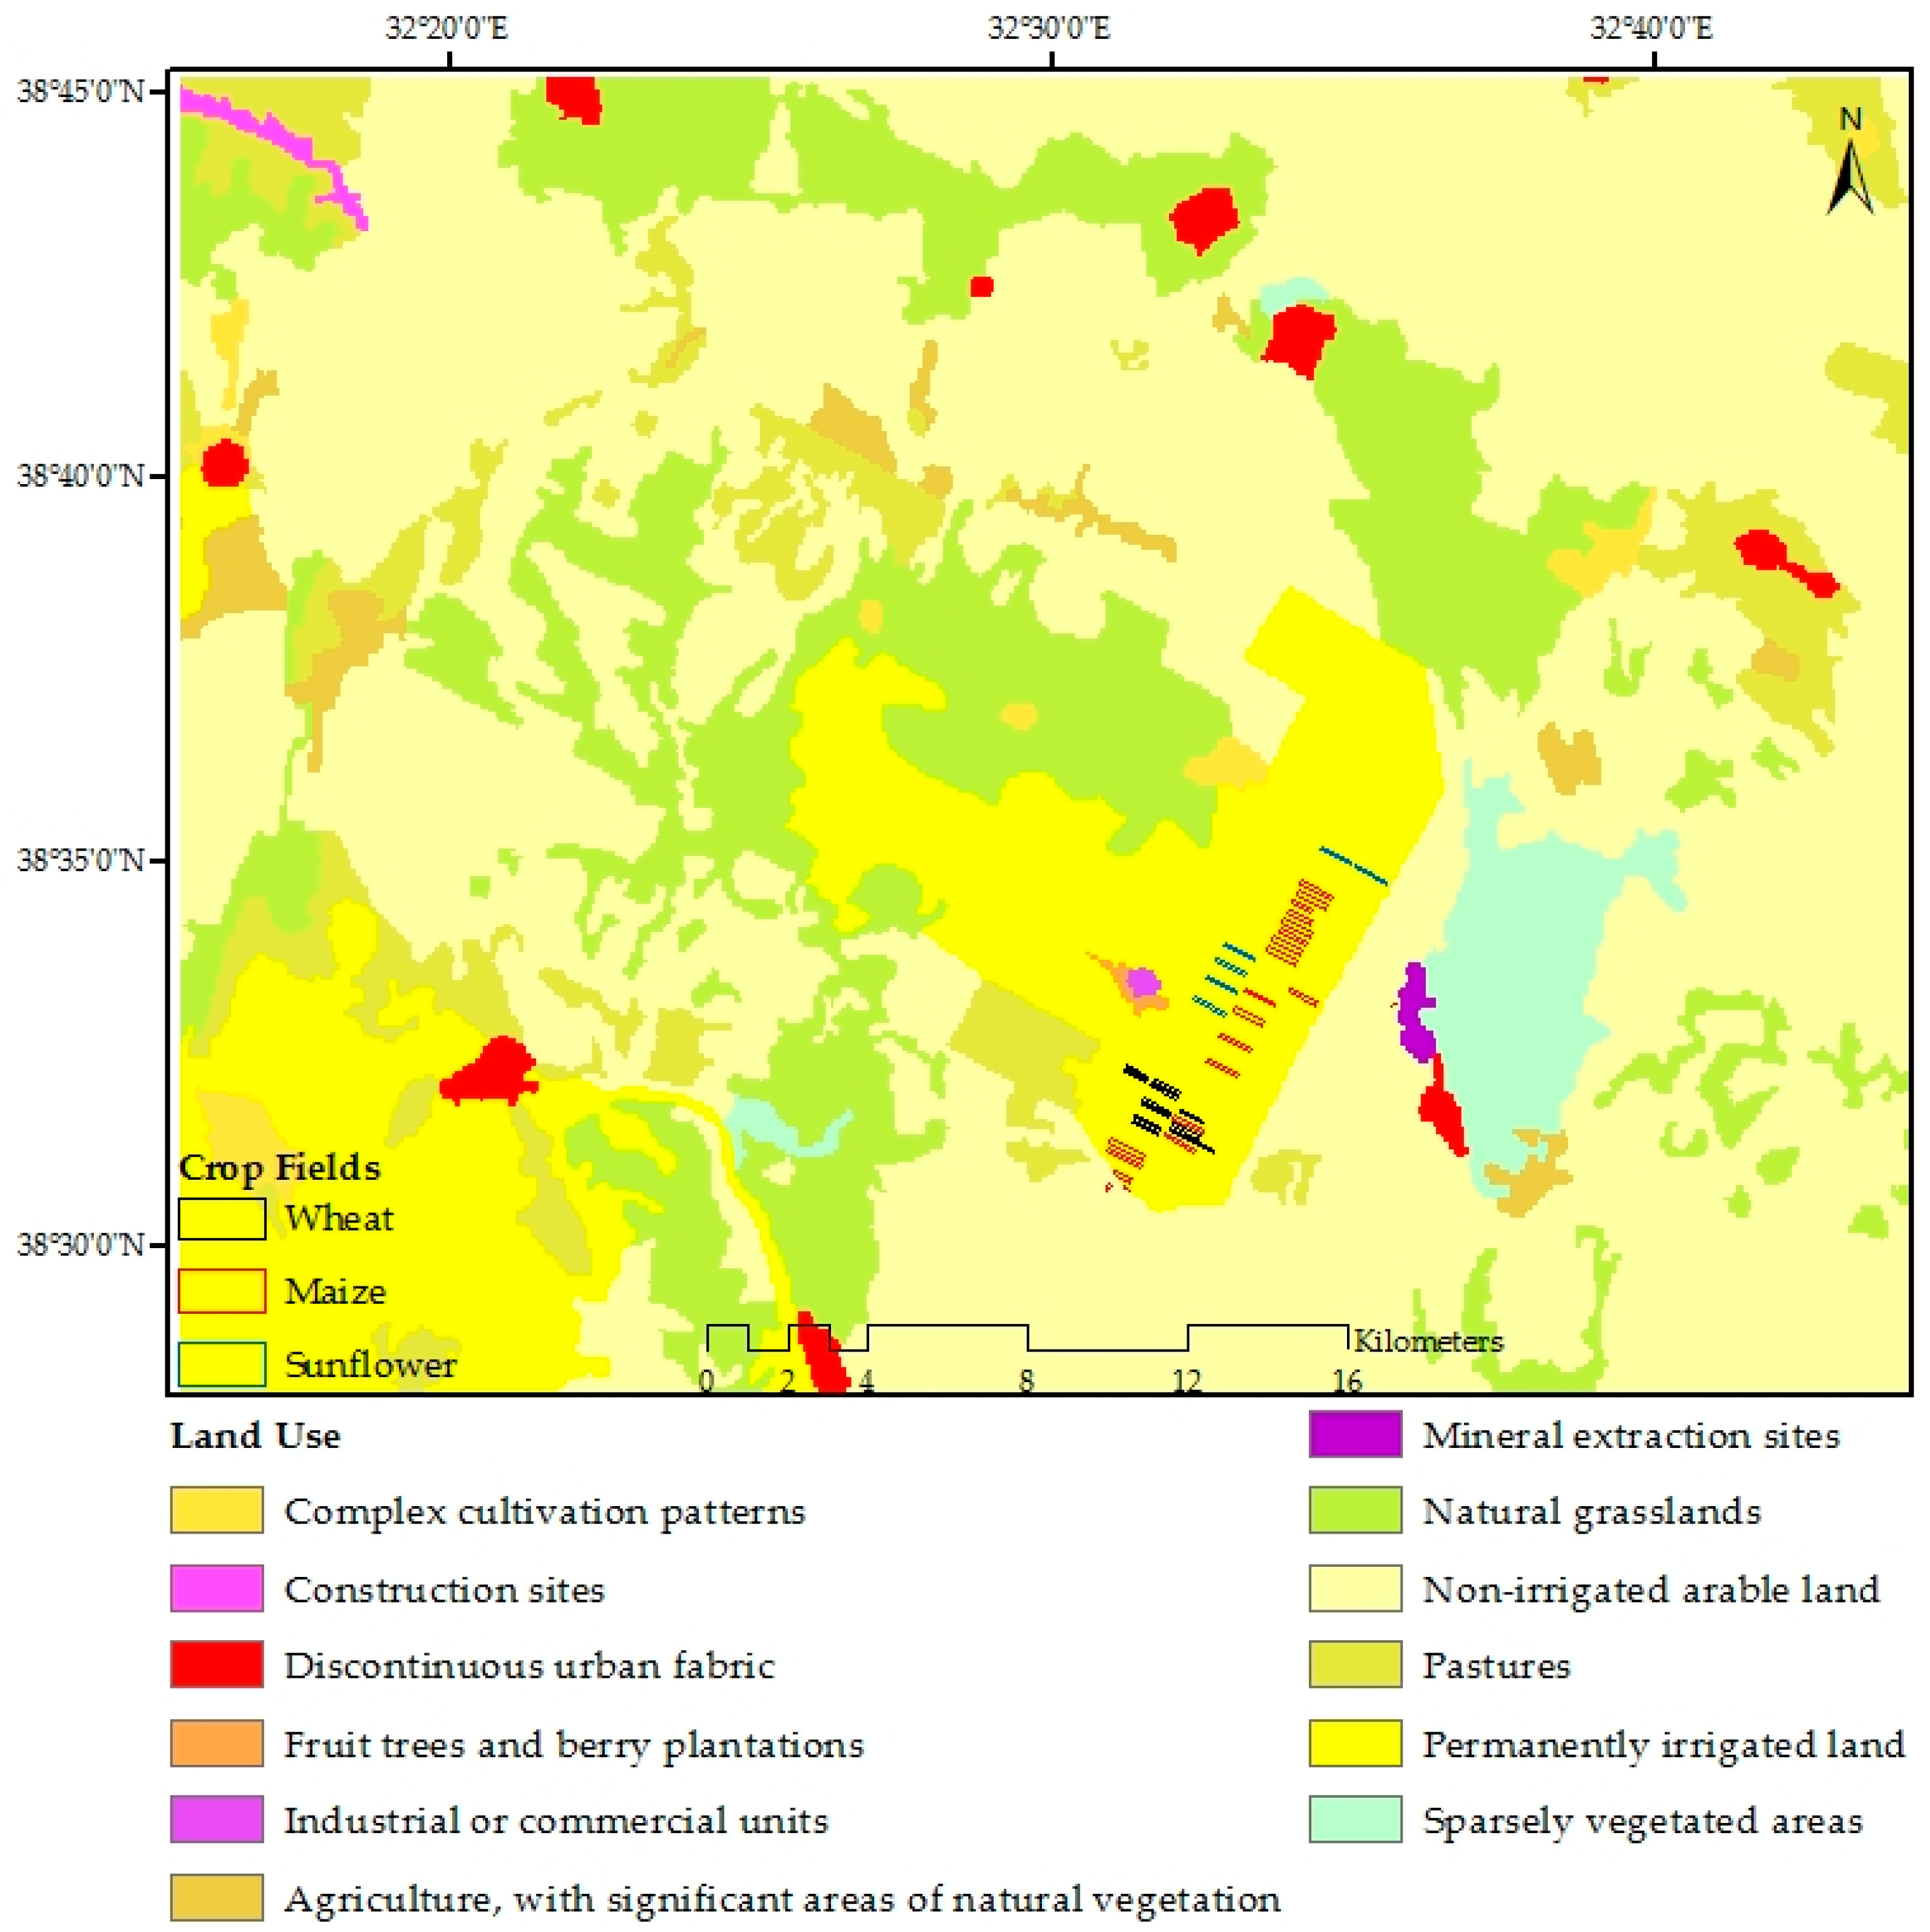
2.1. Site Description
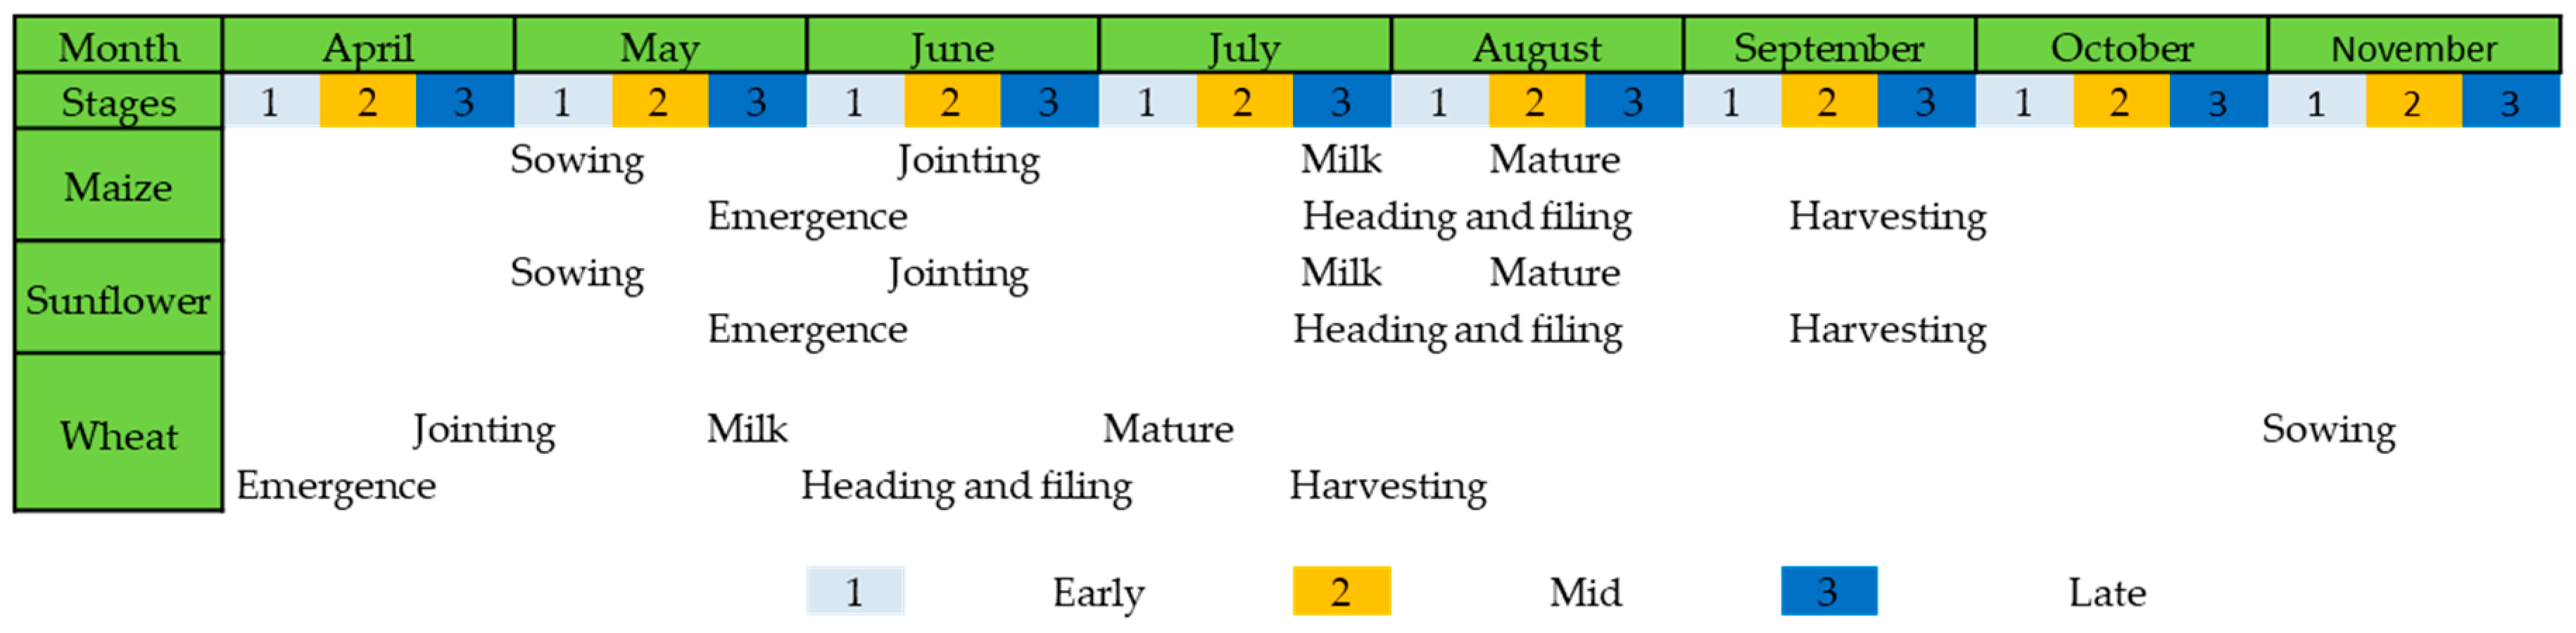
The Konya basin (38° 40′ N, 32° 26′ E) in central Turkey is selected for field measurements and satellite images collection (Figure 1). The terrain of the study area is partly flat with a gently sloping (2%–6%) and, the smallest field area of approximately 0.5 and the largest 18 ha. in size. According to the Ministry of Agriculture and Forestry of Turkey, the distribution of major soils in the study region is Reddish Brown and Brownish soils Figure 2. The soil texture in the study area consists of clayed loam and loamy (medium structure), slightly alkaline, salt-free, and low contents of organic matter (1.30–2.08%).
The region has an arid to semi-arid predominant weather conditions. The land use type is mainly agricultural land in the study site (Figure 3). Therefore, the demand for water consumption for irrigation is increasing due to the extent and dense of agricultural activities. Maize, sunflower, and wheat are three investigated crops patterns as they have different structures. Maize and sunflower based on field campaign, generally are planted at the beginning of May, and harvested at the end of August or the beginning of September in this study area. Winter wheat is seeded in previous November and harvested at the end of July.

2.2. Field Surveys

In situ measurements were conducted for maize, sunflower and wheat fields in the spring–summer agricultural season of the year 2016. Crop variables and parameters which indicate the growth rate including crop height and CC were collected simultaneously with the SAR data acquisition, and recorded during the field works. Field data collection includes measuring the row and plant cover by still tape in unit area, taking photographs by the camera and recording field characteristics such as soil properties and irrigation status. For calculating CC, photographs were taken in downward position and perpendicular to the ground with 100 cm distance from camera and canopy outmost in the tillering stage when the crop height was less than 100 cm. Considering the study area, 36 test fields that consist of 19 maize, 6 sunflower fields, and 11 wheat fields were dedicated for this research. The variability of development stages for maize, sunflower and wheat has been defined by applying the “Biologische Bundesanstalt, Bundessortenamt, and CHemische” (BBCH) [20] indicator for each field that generally consist of vegetative and reproductive stages. Seasonal maize, sunflower, and wheat crop calendar of the study area is presented in Figure 4. According to the defined height and CC thresholds, derived from SAR backscattering and BBCH-scale, we call two stages for crops growth season; the early stage and the later stage.
Four field surveys were conducted to obtain accurate ground measurements in late May–mid June, early July, late July, and late August 2016. General growth stages categories (leaf development, stem elongation, heading and flowering), are defined according to the BBCH-scale (Table 1). For calculating the crop height of each test site, five height measurements were obtained and their mean value was calculated to represent the crop height of the relevant test field. From the test sites, plant cover and row were measured and also photographs were captured to determine and evaluate the CC percentage. A synopsis of the maize, sunflower and wheat of different growing stages is given in Figure 5.
In this study site, the BBCH-scale is considered as 53 when the maize height was in range of 120–150 cm. This growth stage of the maize is at the inflorescence emergence and heading stage. When maize height was greater than 220 cm, the BBCH-scale was 69 and represented the end of flowering. Once the sunflower height was greater than 92 cm, the BBCH-scale is found as 79, indicating the end of flowering and the inflorescence reaches full size. The BBCH-scale is considered as 59 after that wheat height reached to 53 cm and inflorescence fully emerged. We observed that different wheat height could have the similar wheat BBCH due to variation of wheat growth conditions which cause to distinction even though they are at the same phenology, in agreement with the study of Liao et al. [17]. Figure 6 shows the relationship between crop height and the BBCH-scale corresponding to the each crop principal growth stages.
Scatterplots (d–f) in Figure 6 show SAR response to crop heights. Note that the sensitivity of the SAR backscatter to CC of three different crops has been changed in different height and CC in each crop. For maize, the variation of correlation was determined when the maize CC threshold is 75%. This threshold is 85% and 60% for sunflower and wheat respectively.

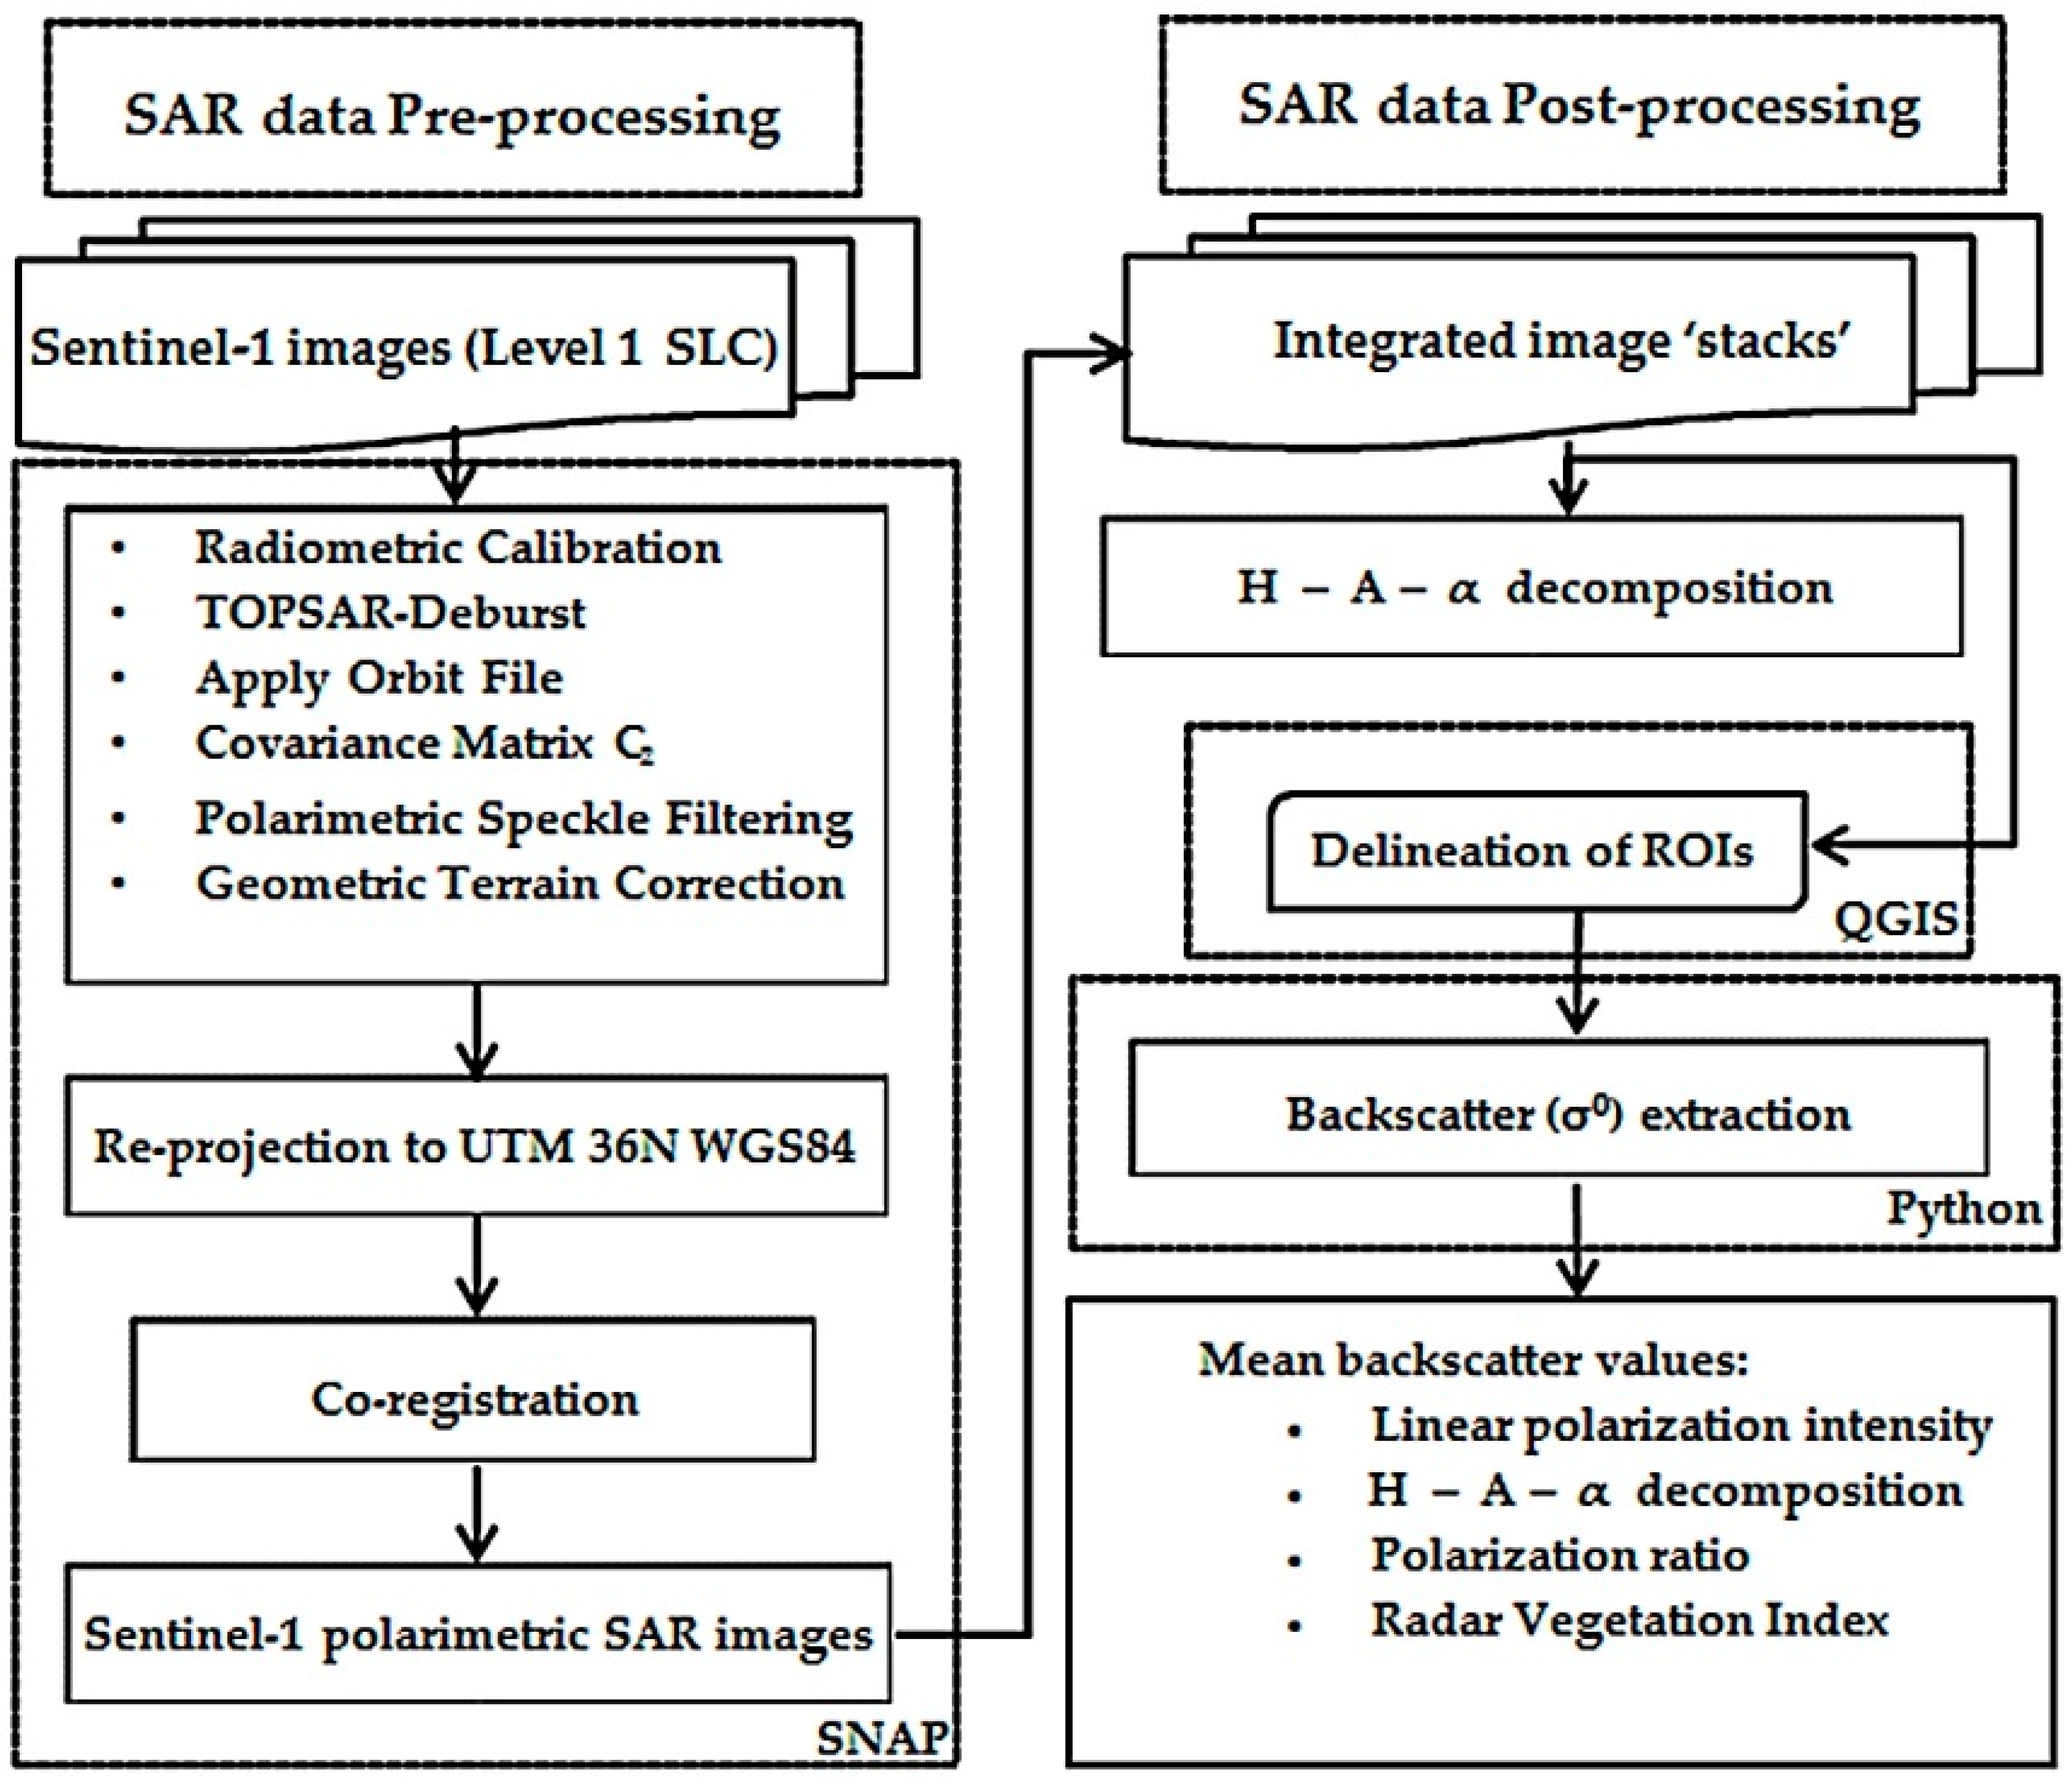
2.3. Sentinel-1 Dual Polarimetric SAR Data Statement and Processing

We used Single Look Complex (SLC) Sentinel-1A interferometric wide swath (IW) data in descending pass direction (Table 2). Sentinel-1 satellites are equipped with C-band sensor with an incidence angle range between 29.1° and 46.0° at 5405 MHz radar frequencies. The satellite obtains data with dual polarization (VV and VH) backscatter where electromagnetic waves have polarized vertically (V) for transmission and H/V for reception [21]. Data can be acquired in both ascending and descending orbit pass directions, which means that any object on the earth surface can be evaluated as two independent sights. The difference is that due to steeper incident angle of the ascending orbit therefore the mean backscatter values are rather higher in compare with descending orbit [22]. For time series analysis of SAR backscatter, four C-band polarimetric SAR data during the growth stages of the selected crops from mid-June to late August were acquired for investigation of the sensitivity of Sentinel-1 data to the crops.

2.4. SAR Backscatter

Several studies on the processing of radar data indicate that the phenological stages of the plant have an effect on the backscatter of the signal, and there is a significant correlation between the biophysical parameters of the plants, including height, leaf area index, vegetation mass, plant water content, and radar signal backscatter [15,23,24,25]. Radar backscattering from vegetation is a function of both wavelengths polarization and frequency. Different frequencies and polarizations enable one to infer various and supplementary information from the single object. In agricultural radar applications, combination of polarizations (co-polarization and cross-polarization) allows analyst to extract extra information about crop characteristics.
The polarization of backscattering microwaves indicates the target structural properties and visualizes scattering characteristics of observed features [1,5]. A majority of the space borne radar systems often transmit only one polarization and receives both polarization giving rise to dual polarimetric SAR data (e.g., Sentinel-1 with VH and VV polarizations), while some collecting full polarimetric so-called quad polarization (HH, VV, HV, and VH) imagery (e.g., PALSAR, TerraSAR-X, and RADARSAT-2). Fully polarimetric SAR data is acquired using the H and V polarizations which extracted from SLC data and can be represented by a 2 × 2 scattering matrix S (Equation (1)) including polarimetric information for each individual resolution cell [26,27,28].
S = [ S H H S H V S V H S V V ] ,
Scattering matrix which depends on incident and the scattered field, has four components, each representing the received and transmitted polarizations [29,30]. The scattering matrix consists of information on the nature and characteristic of the observed media and features. Full polarimetric SAR data set which is described as scattering matrix is foundation for several coherent polarimetric decomposition and analysis. For polarimetric analysis an alternative procedure is derived from a covariance matrix (C3) that represents the average polarimetric information extracted from a set of neighboring pixels to produce the mean polarimetric response. The covariance matrix C3, (Equation (2)), is determined from the outer element of the vector form of the scattering matrix with its Hermitian conjugate, KC [17,27]. The averaged target vector (covariance matrix) for fully polarimetric data is given by Equation (3).
C 3 = K C . K C   * T = [ C 11 C 12 C 13 C 21 C 22 C 23 C 31 C 32 C 33 ] ,
C f u l l = S ( i ) S   ( i ) H ,
= [ S H H S *   H H S H H S *   H V S H H S *   V V S V H S *   H H S H V S *   H V S V H S *   V V S V V S *   H H S V V S *   H V S V V S *   V V ] ,
= [ | S H H | 2 2 S H H S H V   * S H H S V V   * 2 S H V S H H   * 2 | S H V | 2 2 S H V S V V   * S V V S H H   * 2 S H V ( S H V S V V ) * | S V V | 2 ] ,
where ensemble averaging is shown by the | | represents the modulus, the * indicates complex conjugation and the complex conjugate transpose shown by superscript H. For natural targets, in case of monocratic radar, SHV ≈ SVH when Srt indicates the complex scattering amplitude for received and transmitted polarization (r, t ∈ {h, v}) for horizontal and vertical polarization and the scattering matrix is defined by three-element complex target vector, KC = [ S H H 2 S H V S V V ] T , where superscript T indicates the matrix transpose [29,30]. In the covariance matrix, diagonal elements (C11 = σ0HH, C22 = σ0HV, and C33 = σ0VV) define backscattering coefficients and the upper or lower triangular components represent complex numbers. The backscattering coefficients have correlation with the structural characteristics of the features [17,31].
In comparison to the quad polarization, dual polarimetric SAR sensors collect a fraction of total (precisely half of the scattering matrix components) polarimetric information involved in fully polarimetric imagery [27]. It means that each resolution cell at each time point is defined by a 2 × 2 covariance matrix (C2) that is obtained from C3. The resulting covariance matrix which is for dual polarization (e.g., Sentinel-1) is represented by Equation (4).
C 2 = [ C 11 C 12 C 21 C 22 ] ,
C d u a l = [ S V V S * V V S V V S * V H S V H S * V V S V H S * V H ] ,
Since dual polarization has only diagonal elements, the matrix with off-diagonal components are set to zero and do not follow a complex Wishart distribution; however, the two diagonal blocks (1 by 1) do [30,32].
Polarimetric Synthetic Aperture Radar (PolSAR) technique has resulted many different investigations and improvements in crop growth monitoring, yield estimation, crop disaster prediction and prevention and in more general terms providing accurate information for precision farming. PolSAR products, such as Entropy (H), Alpha (α) and Anisotropy (A) decompositions are calculated from the covariance matrix. The H-α-A decompositions are used to extract average parameters from experimental data suggested by Cloude and Pottier [33]. This approach is based on second-order statistics using a smoothing algorithm [34]. Natural measure of the inherent reversibility of the backscattering data is defined by entropy (H), and indicates the randomness of the scatter, while the underlying average scattering mechanisms, scattering type (surface, double-bounce and volume scattering) can be identified using Alpha parameters. The relative power the second and third eigenvectors is described by Anisotropy (A), which represents being of different properties in different directions when measured along different axes [33,35]. The Entropy (H) decomposition parameter has more sensitivity to the crop parameters and the density and randomness of some vegetation canopy than Alpha and Anisotropy [28,36].
In agricultural radar monitoring, Radar Vegetation Index (RVI) is a method for observation of the level of the vegetation growth in time series data analysis as an alternative to NDVI (Normalized Difference Vegetation Index) method used in optical image processing studies [37]. Ranging between 0 and 1, RVI is used for measuring the randomness of scattering in microwave signal [38]. It is close to 0 for a smooth bare surface and as vegetation grows the value increases till the crop reaches to the end of growth cycle and it is affected by vegetation water content and sensitive to the biomass [39]. RVI calculation needs quad-polarized data, thus for full polarization, RVI is retrieved by the Equation (5).
RVI   = 8 σ 0   H V σ 0   H H + σ 0   V V + 2 σ 0   H V ,
where σ0HH and σ0VV are co-polarized backscattering coefficients and σ0HV is cross-polarized backscattering coefficient in power units. According to the Charbonneau et al. [40] the assumption that supposes σ0HH ≈ σ0VV then Equation (5) can be reduced to the form as Equation (6).
RVI HH = 4 σ 0   H V σ 0   H H + σ 0   H V ,
Melanie et al. [41] studied the RVI and concluded that RVIHH is useful when just two polarizations are available and can be an appropriate approximation of the surface scattering if the interaction between the surface plane and vegetation is insignificant.
Since Sentinel-1 is dual polarization and has VH and VV polarizations, following Charbonneau et al. [40] assumption of possibility to modification of RVI in case of availability of two polarizations we assume an alternative to RVI for dual polarization as shown in Equation (7).
RVI   = 4 σ 0   V H σ 0   V V + σ 0   V H ,
The index is about the contribution of volume scattering which is indicated by cross-polarized response. Pre-processing steps of satellite images were carried out using open source tools of Sentinel Application Platform (SNAP) software [42]. Mean backscatter values and temporal variation of backscatter for each field for three different crop types relying on backscatter statistic results are extracted using rasterstats zonal statistics and interpolated point queries function with a Python module [43]. The module is used to summarize geospatial raster datasets to extract information based on vector geometries [44]. Quantum GIS [45], an open source GIS software is applied to draw the region of interest (ROI) polygons as vector geometries used in rasterstats zonal statistics function. To decrease the effects of mix of the classes, the polygons are set at proper interval from the edges of the field boundary and homogeneous pixels are selected for the evaluation. Figure 7 shows the flowchart of Sentinel-1 dual polarimetric SAR data processing.

3. Results

Different Sentinel-1 dual polarimetric SAR parameters including linear polarization backscattering coefficients, H-A-α decompositions, polarization intensity ratios (VH/VV, VV/VH and VV − VH/VV + VH), Radar Vegetation Index (RVI), intensity arithmetic calculations and crop variables (crop height and CC) are investigated. Mean backscattering coefficient values for each sample site for different crops are defined and the correlation between the in situ measurements are analyzed. The results show that responses of polarimetric SAR parameters to the crop variables (crop height and CC) vary for different crop types at different phenological stages of the crops. For maize, SAR backscatter coefficient is more sensitive to crop height at the early stage of crop growth compared to the later stage, while the same situation is not true for sunflower and wheat.

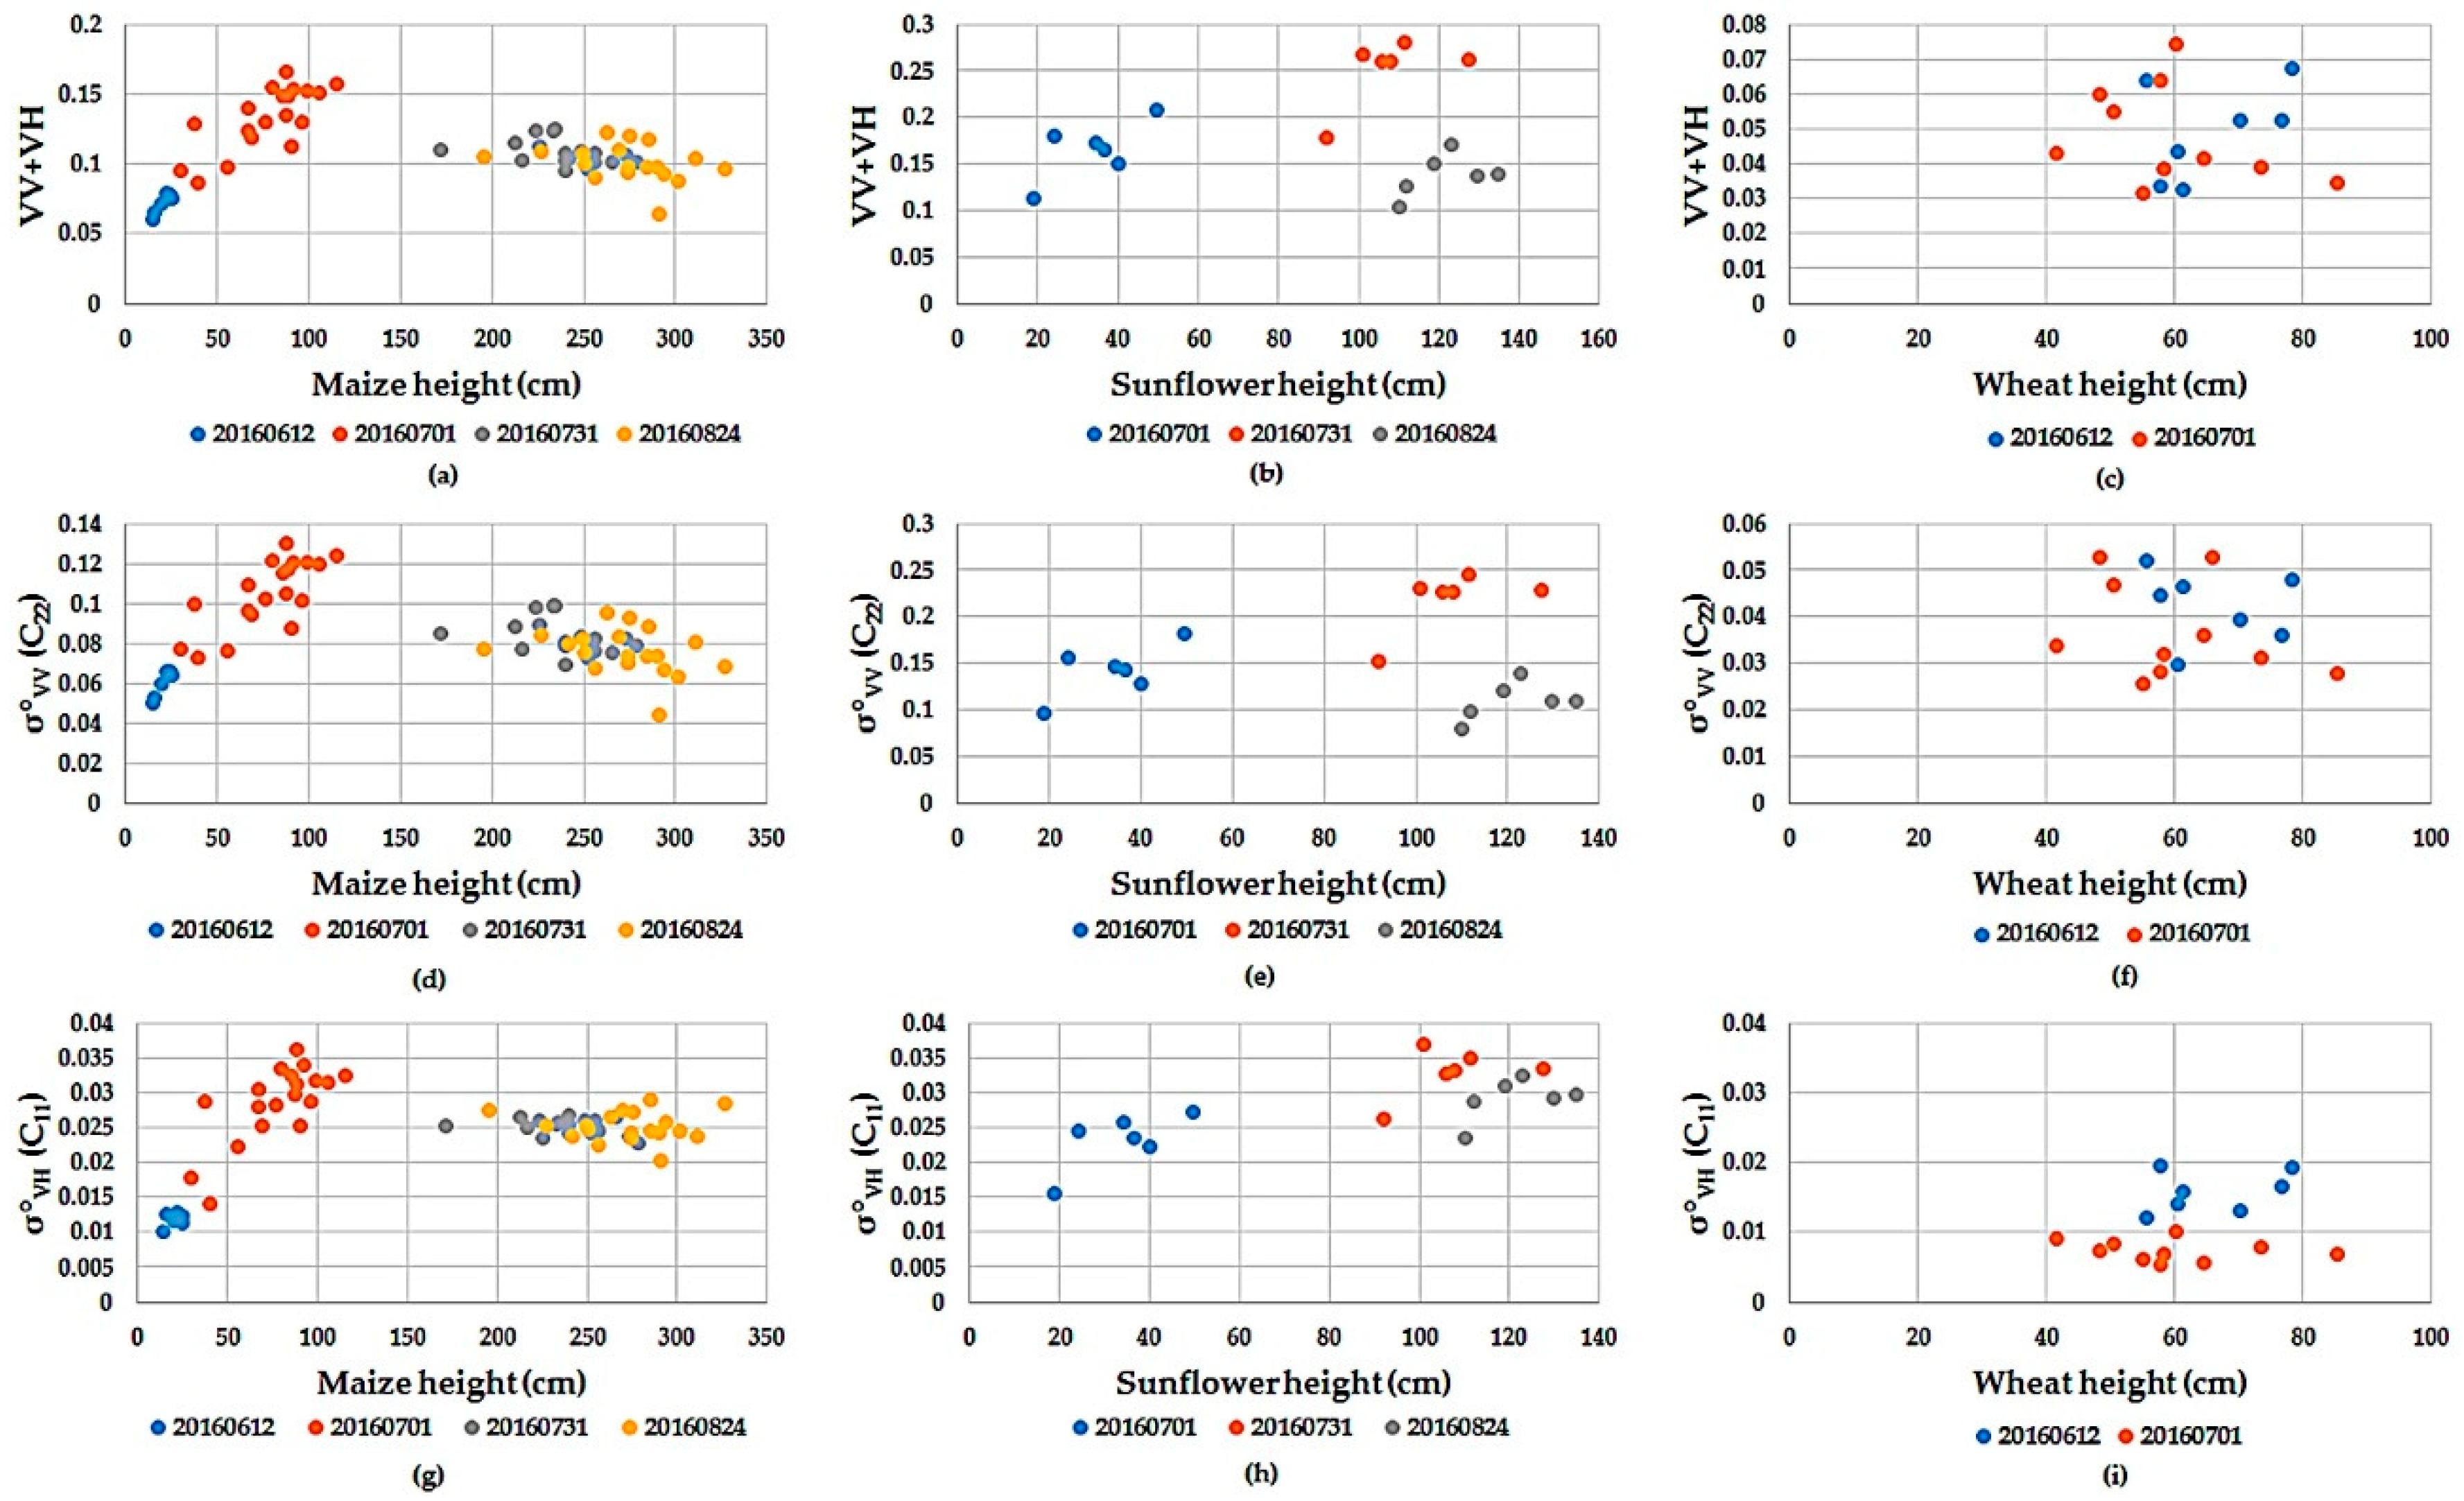
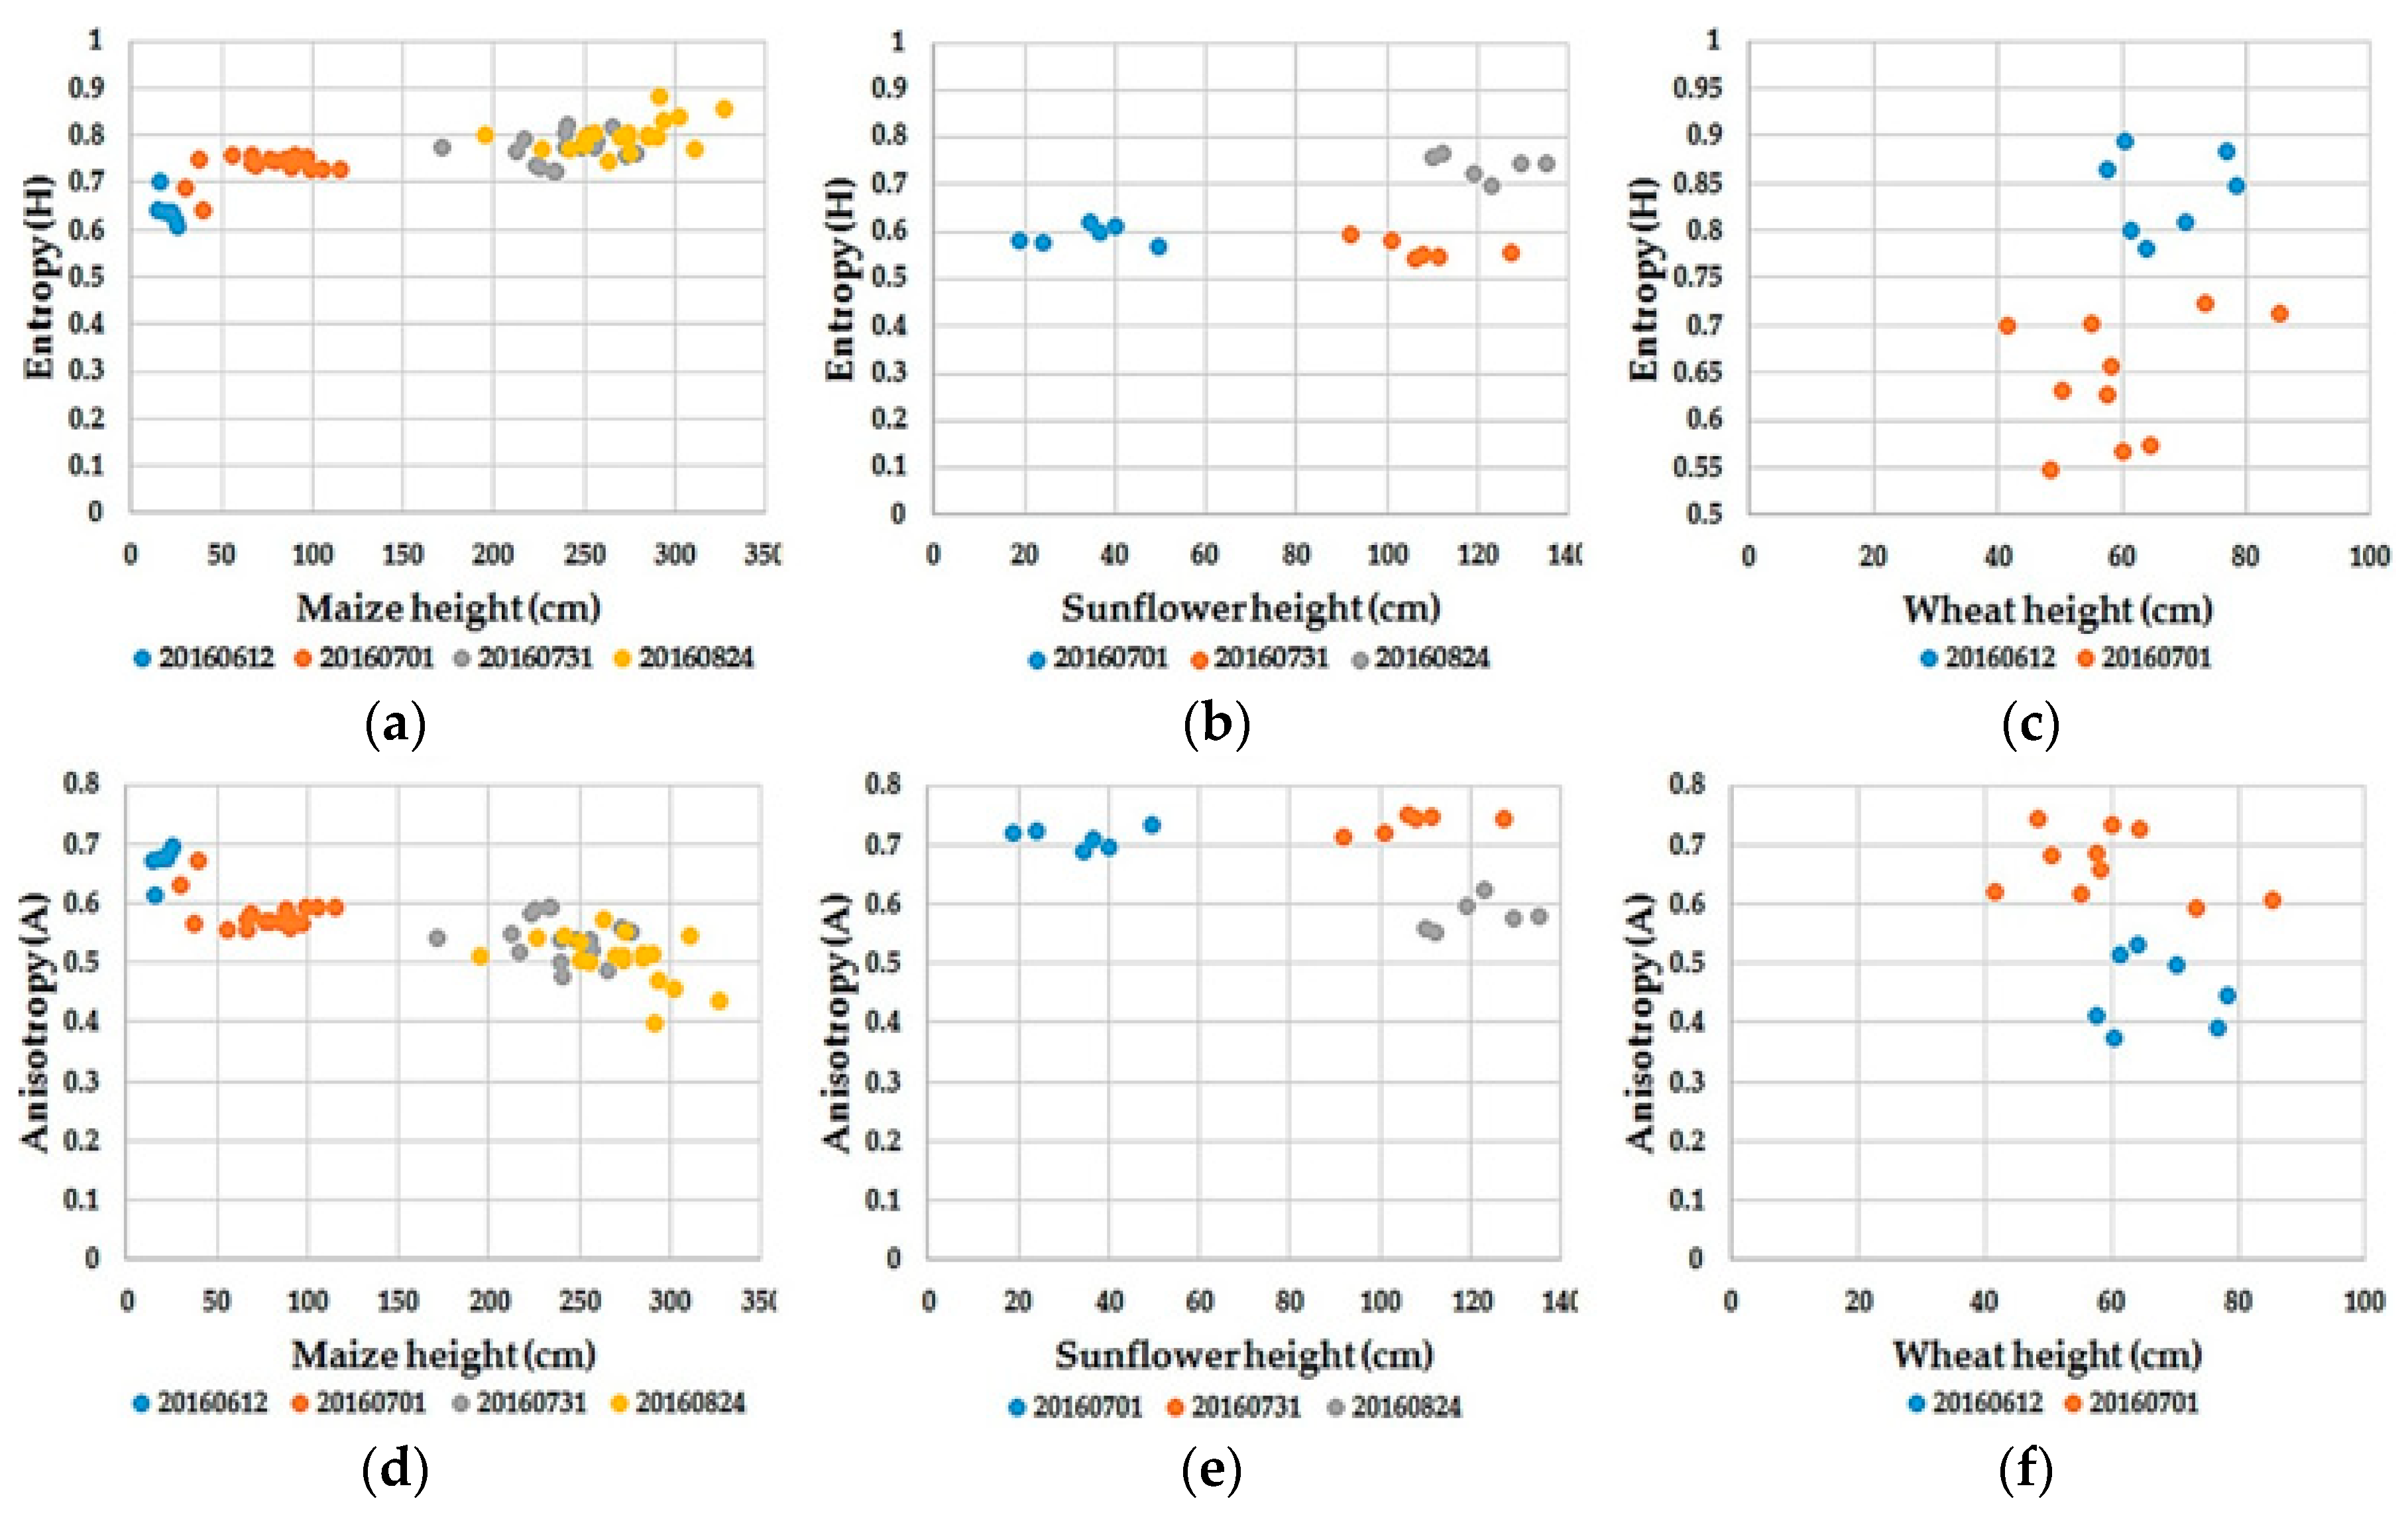
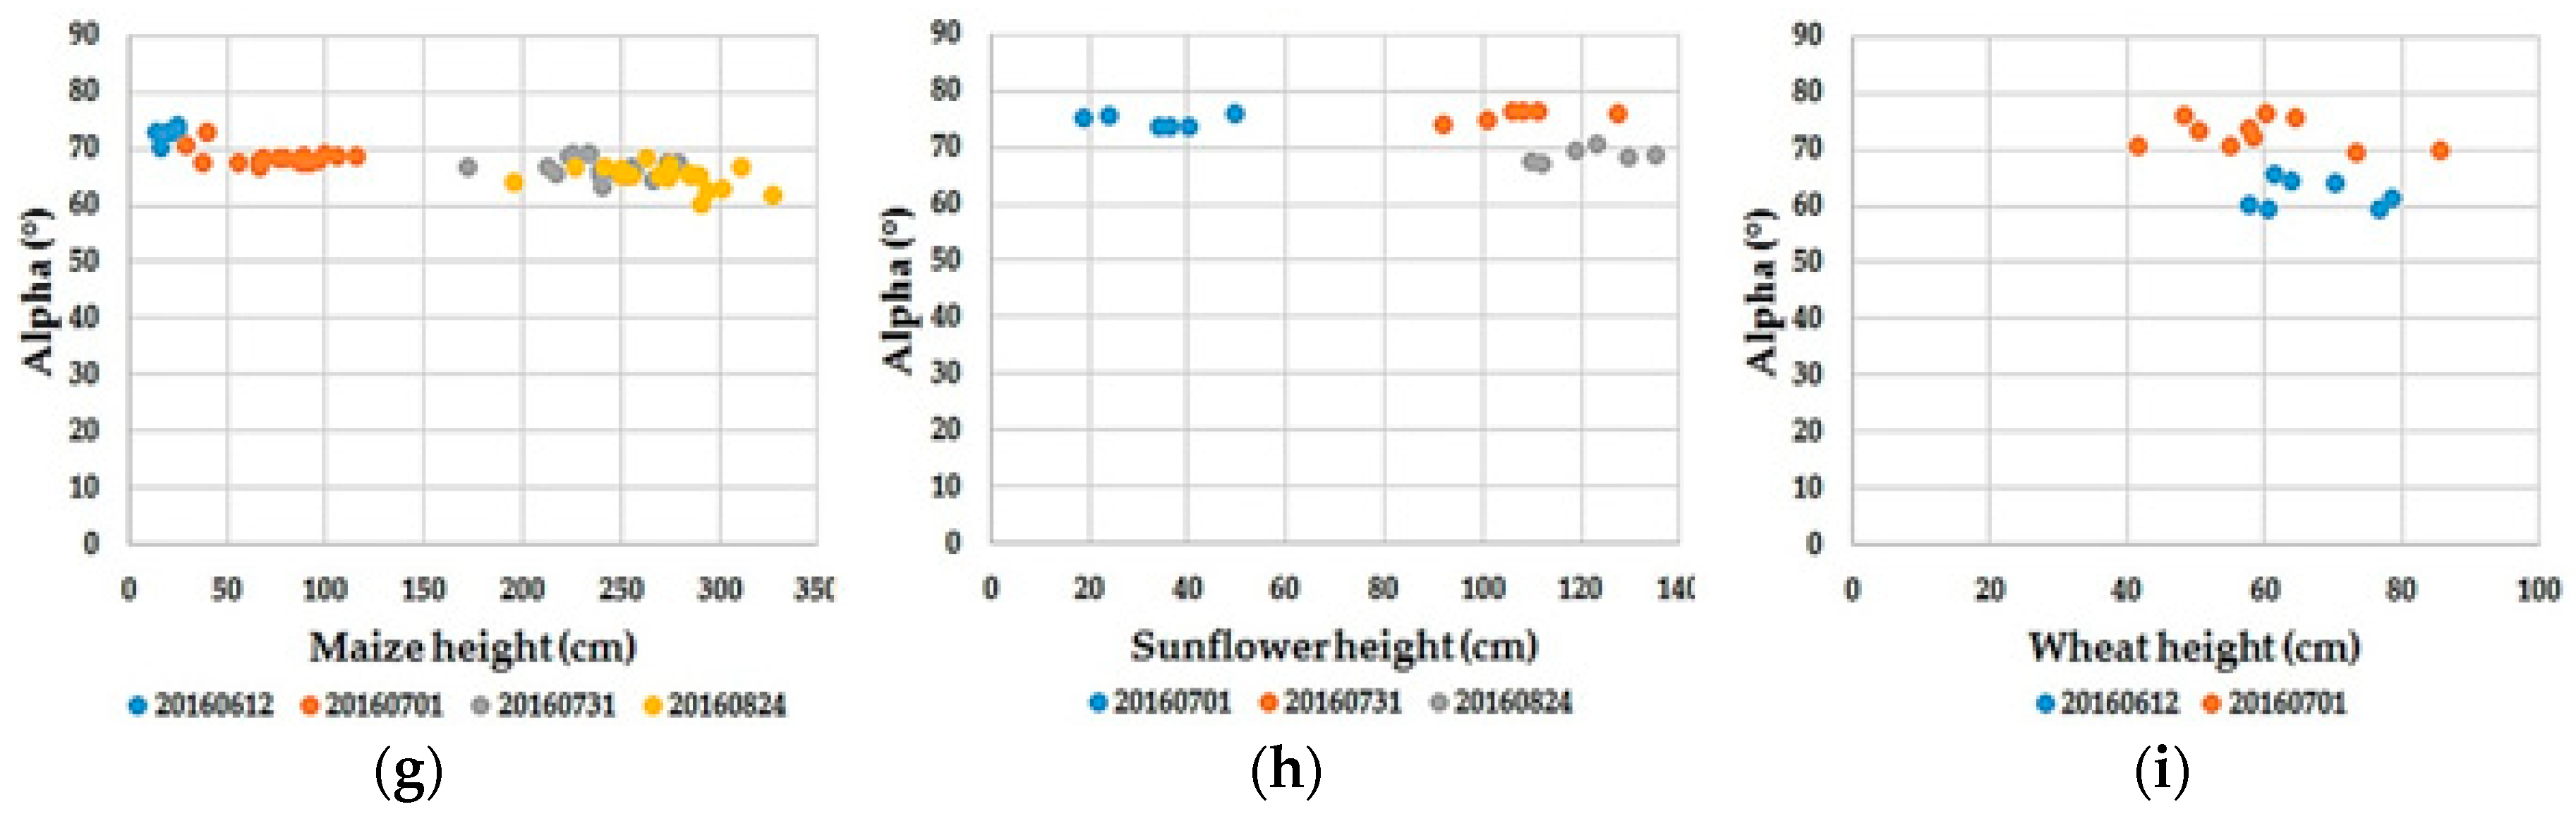
3.1. SAR Parameters and Their Correlation with Crop Height

Almost in all visited fields, the mean backscatter values indicated similar tendency in four stages of crop growth. In Figure 8, mean backscatter coefficient (σVV and σVH and VV + VH) values of each sample site are determined and the correlation between the field measurements are presented. It is observed that the maize had high sensitivity at the beginning but starts to decrease when the maize height is higher than 150 cm at inflorescence emergence and heading stages. Sunflower is not sensitive to the crop height only when the sunflower height is greater than 90 cm. At the end of flowering and the inflorescence, it shows low sensitivity compared to its early and later stages. In comparison with maize and sunflower, wheat had relatively good sensitivity at the end of heading. Regarding wheat full inflorescence which is varying in different heights, the correlation between SAR backscattering (VV VH and σ⁰VV) and wheat height is considerably less as in inferred from Figure 8c,f in growing stage.
Table 3 gives the coefficient of determination (R2) between Sentinel-1 dual polarimetric SAR parameters and measured crop height for maize, sunflower and wheat. Both σ⁰VV and σ⁰VH showed high correlation (R2 = 0.81 and 0.80 respectively) and VV + VH had highest correlation (R2 = 0.82) with maize height at the early stage. Whereas the correlation between SAR parameters to sunflower height is very low (R2 = 0.31) at the same stage. Almost all SAR parameters show relatively good correlation at the early stage of wheat. For instance, a good negative correlation with VH/VV intensity ratio and σ⁰VH are obtained at the early stage of wheat (R2 = 0.66, and 0.65 respectively). However, all of the crops have very weak correlation or even they are not correlated and sensitive to plant height in the later stage.
Amongst the H-Alpha decomposition parameters, Alpha (α) decomposition parameter represents the highest correlation (R2 = 0.67) with wheat height during the early growth stage. The maize height is relatively correlated with H-Alpha decomposition parameters at the early stage, although no considerable correlation is observed during the early stage of sunflower and at the later stage of wheat. Figure 9 shows the correlation between the H-Alpha decomposition parameters and crops height of maize, sunflower and wheat.

3.2. SAR Parameters and Their Correlation with Crop Coverage

The CC measured in field includes measuring the row and plant cover by steel tape in unit area. For validation of the CC calculated from measured data, photographs were taken using the camera in downward position and perpendicular to the ground with 100 cm distance from the camera lens. The CC extraction process is done by application of Python glob image processing package [46]. The photos are first converted to HSV (Hue, Saturation, and Value) model and used as a detector for the type and shape and to do color constancy processing by grouping or classifying the image. Following the HSV conversion green mask is applied to slice the green areas as white ratio and black to the bare soil. The sample classified green area for wheat is given in Figure 10. The unit area from the photograph is calculated using the ground sampling distance (GSD) formula and setting calibration derived from images. The contributing parameters for determination of ground resolution are the camera’s height above the ground, the camera’s pixel size, and the lens’ focal length.
The coefficient of determination (R2) between Sentinel-1 polarimetric SAR parameters and the measured CC for maize, sunflower and wheat for early and later growing stages are given in Table 4. According to the principle growth stage [20] when the maize reaches to the end of its stem elongation, leaves completely unfold and have full size. When the BBCH-scale is greater than 39 for maize, CC is measured 75%. The CC for sunflower and wheat is measured as 85% and 60%, respectively when the BBCH-scale is greater than 51 and 49.
Considering Sentinel-1 dual polarimetric SAR parameters and measured CC, the highest correlation is obtained for the VV polarization (R2 = 0.73) and VV+VH (R2 = 0.73) when the CC is lower than 75% for maize while with increasing CC the correlation decreased (R2 = 0.49) for both crops. This is contrary to the findings of Liao et al. [17] where the sensitivity of RADARSAT-2 polarimetric SAR and its correlation with fractional vegetation cover (FVC) in HV polarization is high for maize, and they suggest that VV polarization is not a useful parameter for monitoring broad-leaf crops. Their findings may have conflict with our results due to the sensors properties. Regarding the sunflower, in its early stage (i.e., CC < 85%), again the higher coefficient of determinations are obtained for VV polarization (R2 = 0.46) and VV + VH (R2 = 0.47). However, comparing the maize and the sunflower as two different broad-leaf crops in our study, R2 of the sunflower is lower than the maize. The discrepancy in correlations might be due to the difference in leaves geometry of maize and sunflower. In other respects, similar to the findings of Liao et al. [17], no correlation is observed for wheat at both stages in our study. This may be due to the wheat structure and leaves geometry as narrow-leaf crop. Wheat can reach its full development at early stage and penetrating from biomass occurs due to narrow leaves, stem affectation and contributing of underlying soil resulting attenuation of SAR backscatter [47]. Figure 11 depicts the parameters which have highest correlation with CC during the growth stage for maize and sunflower.

4. Conclusions

In this study, three different crop types that have “broad” and “narrow” leaves were selected to investigate the sensitivity of the Sentinel-1 dual polarimetric SAR parameters to plant height and CC. Maize and sunflower is selected as broad leaf and wheat as narrow leaf crop. The reason for studying two broad-leave crops was to validate the high sensitivity of SAR polarimetric data to early stages of broad-leave crops and then comparing the findings for wheat as narrow-leave crop. We demonstrate that maize presents higher correlation during the early stages of the crop growth when the crop height is less than 150 cm. It is strongly correlated with the SAR parameters including VV + VH (R2 = 0.82), VV (R2 = 0.81), and VH (R2 = 0.80). Besides, CC of maize was well correlated with VV polarization (R2 = 0.73) at the early stage before the heading stage although at the later growing stage the correlation becomes weaker after the heading stage. From the backscatter analysis, the same result is not observed in the sunflower. The sunflower height has very low correlation with the most of SAR parameters. Only VH polarization shows slightly better sensitivity when its height is below 92 cm before the ending of flowering and the inflorescence reaches to full size. The sunflower CC is relatively correlated with VV polarization at the early stage (during the flowering stage) while any considerable correlation between SAR parameters and sunflower height and CC is observed at the later stage. The sensitivity of SAR parameters to wheat variables is often low compared to maize and sunflower. The high, but negative correlations are related to the VH/VV intensity ratio and VH polarization. However, Alpha (α) decomposition parameter shows highest correlation at the beginning stage and represents absence of SAR parameters sensitivity with wheat height at the later growing stage and CC at both stages. The results we have obtained reveals that Sentinel-1 dual polarimetric SAR (C-band) has a high potential for identifying growth stages and estimation of crop height, canopy coverage of maize as a broad-leaf crops. However, this is not proven for sunflower, that may be due to the crop structure and leaves geometry since they may change the SAR backscatter value in any stages of crops. This study also demonstrates that Sentinel-1 dual polarimetric SAR data can be a good alternative to other commercial data which enables users to access freely available of a constant long-term data archive for applications requiring long-range time series.
Although the use of single orbit direction (descending) provides possibility of monitoring and investigating agricultural growth stages, future studies should use both the ascending and descending orbits to have independent results from different angles of view. In addition, the relationship between backscatter values of multi-temporal Sentinel-1 data and vegetation variables will be incorporated to improve the crops mapping and classification accuracy as a future work.

Author Contributions

Conceptualization, R.N. and F.B.S.; Formal analysis, R.N.; Investigation, R.N., F.B.S., S.A, Z.C, A.S. and M.U; Methodology, R.N., F.B.S., S.A and Z.C; Software, R.N. and Z.C; Supervision, R.N., F.B.S. and Z.C; Validation, R.N., F.B.S. and S.A; Visualization, R.N., Writing—original draft, R.N.; Writing—review and editing, R.N., F.B.S., S.A, Z.C, A.S and M.U.

Funding

This research received no external funding.

Acknowledgments

The authors would like to thank Yildiz Technical University Remote Sensing and Istanbul Technical University National Innovation and Research Center for Geographical Information Technologies labs for providing the entire hardware and software theme required for this research. This study is part of first author’s Ph.D. thesis.

Conflicts of Interest

The authors declare no conflict of interest.

References

  1. Soria-Ruiz, J.; Fernandez-Ordonez, Y.; McNairn, H. Corn Monitoring and Crop Yield Using Optical and Microwave Remote Sensing. Geosci. Remote Sens. 2009, 405–419. [Google Scholar] [CrossRef]
  2. Canisus, F.; Shang, J.; Liu, J.; Huang, X.; Jiao, X.; Geng, X.; Kovacs, J.M.; Walters, D. Tracking crop phenological development using multi-temporal polarimetric Radarsat-2 data. Remote Sens. Environ. 2017. [Google Scholar] [CrossRef]
  3. Abdikan, S.; Sekertekin, A.; Ustuner, M.; Sanli, F.B.; Nasirzadehdizaji, R. Backscatter Analysis Using Multi-Temporal Sentinel-1 SAR Data for Crop Growth of Maize in Konya Basin, Turkey. The International Archives of the Photogrammetry, Remote Sensing and Spatial Information Sciences. In Proceedings of the 2018 ISPRS TC III Mid-Term Symposium “Developments, Technologies and Applications in Remote Sensing”, Beijing, China, 7–10 May 2018. [Google Scholar]
  4. Zhang, W.; Yan, T. Analysis of advantage on radar remote sensing for agricultural application. In Proceedings of the Asian Conference on Remote Sensing, Hong Kong, China, 22–25 November 1999. [Google Scholar]
  5. Ruiz, J.S.; McNairm, H.; Fernandez-Ordonez, Y.; Bugden-Storie, J. Corn Monitoring and Crop Yield Using Optical and RADARSAT-2 Images. In Proceedings of the 2007 IEEE International Geoscience and Remote Sensing Symposium, Barcelona, Spain, 23–28 July 2007. [Google Scholar]
  6. Jiao, X.; McNairn, H.; Shang, J.; Pattey, E.; Liu, J.; Champagne, C. The Sensitivity of RADARSAT-2 Polarimetric SAR Data to Corn and Soybean Leaf Area Index. Can. J. Remote Sens. 2011, 37, 69–81. [Google Scholar] [CrossRef]
  7. McNairn, H.; Brisco, B. The Application of C-Band Polarimetric SAR for Agriculture: A Review. Can. J. Remote Sens. 2004, 30, 525–542. [Google Scholar] [CrossRef]
  8. Ulaby, F.T.; Allen, C.T.; Iii, E.G.; Kanemasu, E. Relating the microwave backscattering coefficient to leaf area index. Remote Sens. Environ. 1984, 14, 113–133. [Google Scholar] [CrossRef]
  9. Ferrazzoli, P.; Paloscia, S.; Pampaloni, P.; Schiavon, G.; Sigismondi, S.; Solimini, D. The potential of multi frequency polarimetric SAR in assessing agricultural and arboreous biomass. IEEE Trans. Geosci. Remote Sens. 1997, 35, 5–17. [Google Scholar] [CrossRef]
  10. Lin, H.; Chen, J.; Pei, Z.; Zhang, S.; Hu, X. Monitoring Sugarcane Growth Using ENVISAT ASAR Data. IEEE Trans. Geosci. Remote Sens. 2009, 47, 2572–2580. [Google Scholar] [CrossRef]
  11. Mattia, F.; Picard, G.; Posa, I.F.; D’Alessio, A.; Notarnicola, C.; Gatti, A.M.; Rinaldi, M.; Satalino, G.; Pasquariello, G. Multitemporal C-Band Radar Measurements on Wheat Fields. IEEE Trans. Geosci. Remote Sens. 2003, 41, 1551–1560. [Google Scholar] [CrossRef]
  12. Wiseman, G.; Mcnairn, H.; Homayouni, S.; Shang, J. RADARSAT-2 Polarimetric SAR Response to Crop Biomass for Agricultural Production Monitoring. IEEE J. Sel. Top. Appl. Earth Obs. Remote Sens. 2014, 7, 4461–4471. [Google Scholar] [CrossRef]
  13. Blaes, X.; Defourny, P.; Wegmuller, U.; Della, V.A.; Guerriero, L.; Ferrazzoli, P. C-band polarimetric indexes for maize monitoring based on a validated radiative transfer model. IEEE Trans. Geosci. Remote Sens. 2006, 44, 791–800. [Google Scholar] [CrossRef]
  14. Ulaby, F.T.; Moore, R.K.; Fung, A.K. Radar Remote Sensing and Surface Scattering and Emission Theory. In Microwave Remote Sensing: Active and Passive; Artech House: Norwood, MA, USA, 1982; Volume 2. [Google Scholar]
  15. Karjalainen, M.; Kaartinen, H.; Hyyppä, J. Agricultural Monitoring Using Envisat Alternating Polarization SAR Images. J. Am. Soc. Photogramm. Remote Sens. 2008, 74, 117–128. [Google Scholar] [CrossRef]
  16. Srivastava, H.S.; Patel, P.; Navalgund, R.R. Application Potentials of Synthetic Aperture Radar Interferometry for Land-Cover Mapping and Crop-Height Estimation. Curr. Sci. 2006, 91, 783–788. [Google Scholar]
  17. Liao, C.; Wang, J.; Shang, J.; Huang, X.; Liu, J.; Huffman, T. Sensitivity study of Radarsat-2 polarimetric SAR to crop height and fractional vegetation cover of corn and wheat. Int. J. Remote Sens. 2018, 39, 1475–1490. [Google Scholar] [CrossRef]
  18. Bousbih, S.; Zribi, M.; Lili-Chabaane, Z.; Baghdadi, N.; El Hajj, M.; Gao, Q.; Mougenot, B. Potential of Sentinel-1 Radar Data for the Assessment of Soil and Cereal Cover Parameters. Sensors 2017, 17, 2617. [Google Scholar] [CrossRef] [PubMed]
  19. European Union, Copernicus Land Monitoring Service, European Environment Agency (EEA). Available online: https://land.copernicus.eu/pan-european/corine-land-cover (accessed on 8 February 2019).
  20. Meier, U. Growth Stages of Mono- and Dicotyledonous Plants; BBCH Monograph, Federal Biological Research Centre for Agriculture and Forestry: Bonn, Germany, 2001; p. 158. [Google Scholar]
  21. Li, L.; Kong, Q.; Wang, P.; Xun, L.; Wang, L.; Xu, L.; Zhao, Z. Precise identification of maize in the North China Plain based on Sentinel-1A SAR time series data. Int. J. Remote Sens. 2018. [Google Scholar] [CrossRef]
  22. Koppel, K.; Zalite, K.; Voormansik, K.; Jagdhuber, T. Sensitivity of Sentinel-1 backscatter to characteristics of buildings. Int. J. Remote Sens. 2017, 38, 6298–6318. [Google Scholar] [CrossRef]
  23. Smith, A.M.; Bughen-Storie, J.; Pattey, E.; McNairn, H.; Nolin, M.; Perron, I.; Hinther, M.; Miller, J.; Haboudane, D. Multipolarized radar for delineating within-field variability in corn and wheat. Can. J. Remote Sens. 2006, 32, 300–313. [Google Scholar] [CrossRef]
  24. Satalino, G.; Dente, L.; Mattia, F. Integration of MERIS and ASAR data for LAI estimation of wheat fields. In Geoscience and Remote Sensing Symposium, Proceedings of the International Geoscience and Remote Sensing Symposium, Denver, CO, USA, 31 July–4 August 2006; IEEE: Denver, CO, USA, 2007; pp. 2255–2258. [Google Scholar]
  25. Baghdadi, N.; Boyer, N.; Todoroff, P.; El Hajj, M.; Begue, A. Potentiel of SAR sensors TerraSAR-X, ASAR/ENVISAT, and PALSAR/ALOS for monitoring sugarcane crops on Reunion Island. Remote Sens. Environ. 2009, 113, 1724–1738. [Google Scholar] [CrossRef]
  26. Santalla, V.; Antar, Y.; Pino, A. Polarimetric Radar Covariance Matrix Algorithms and Applications to Meteorological Radar Data. IEEE Trans. Geosci. Remote Sens. 1999, 37, 1128–1137. [Google Scholar] [CrossRef]
  27. Ainsworth, T.L.; Kelly, J.; Lee, J. Polarimetric Analysis of Dual Polarimetric SAR Imagery. In Proceedings of the 7th European conference on Synthetic Aperture Radar, Friedrichshafen, Germany, 2–5 June 2008. [Google Scholar]
  28. Lee, J.; Pottier, E. Electromagnetic Vector Scattering Operators. In Polarimetric Radar Imaging: From Basics to Applications; CRC Press: New York, NY, USA, 2009. [Google Scholar]
  29. Van, J.J.; Ulaby, F.T. Scattering matrix representation for simple targets. In Radar Polarimetry for Geoscience Applications; Artech House: Norwood, MA, USA, 1990. [Google Scholar]
  30. Conradsen, K.; Nielsen, A.A.; Skriver, H. Determining the Points of Change in Time Series of Polarimetric SAR Data. IEEE Trans. Geosci. Remote Sens. 2016, 54, 3007–3024. [Google Scholar] [CrossRef]
  31. Duguay, Y.; Bernier, M.; Lévesque, E.; Tremblay, B. Potential of C and X Band SAR for Shrub Growth Monitoring in Sub-Arctic Environments. Remote Sens. 2015, 7, 9410–9430. [Google Scholar] [CrossRef] [Green Version]
  32. Nilesen, A.A.; Conradsen, K.; Skriver, H.; Canty, J.M. Change detection in a series of Sentinel-1 SAR data. In Proceedings of the 9th International Workshop on the Analysis of Multitemporal Remote Sensing Images, Brugge, Belgium, 27–29 June 2017. [Google Scholar]
  33. Cloude, S.R.; Pottier, E. A review of target decomposition theorems in radar polarimetry. IEEE Trans. Geosci. Remote Sens. 1996, 34, 498–518. [Google Scholar] [CrossRef]
  34. Cloude, S.R.; Pottier, E. An entropy based classication scheme for land applications of polarimetric SAR. IEEE Trans. Geosci. Remote Sens. 1997, 35, 68–78. [Google Scholar] [CrossRef]
  35. Li, K.; Brisco, B.; Yun, S.; Touzi, R. Polarimetric decomposition with RADARSAT-2 for rice mapping and monitoring. Can. J. Remote Sens. 2012, 38, 169–179. [Google Scholar] [CrossRef]
  36. McNairn, H.; Shang, J.L.; Jiao, X.F.; Champagne, C. The contribution of ALOS PALSAR multipolarization and polarimetric data to crop classification. IEEE Trans. Geosci. Remote Sens. 2009, 47, 3981–3992. [Google Scholar] [CrossRef]
  37. Kumar, D.; Rao, S.; Sharma, J. Radar Vegetation Index as an Alternative to NDVI for Monitoring of Soyabean and Cotton. In Proceedings of the XXXIII INCA International Congress (Indian Cartographer), Jodhpur, India, 19–21 September 2013. [Google Scholar]
  38. Kim, Y.; van Zyl, J. Vegetation effects on soil moisture estimation. Geoscience and Remote Sensing Symposium. In Proceedings of the IEEE International 2004, IGARSS ’04, Anchorage, AK, USA, 20–24 September 2004; Volume 2, pp. 800–802. [Google Scholar]
  39. Kim, Y.J.; VanZyl, J. A time-series approach to estimate soil moisture using polarimetric radar data. IEEE Trans. Geosci. Remote Sens. 2009, 47, 2519–2527. [Google Scholar]
  40. Charbonneau, F.; Trudel, M.; Fernandes, R. Use of Dual Polarization and Multi-Incidence SAR for Soil Permeability Mapping; Advanced Synthetic Aperture Radar (ASAR): St-Hubert, QC, Canada, 2005. [Google Scholar]
  41. Melanie, T.; Charbonneau, F.; Leconte, R. Using RADARSAT-2 polarimetric and ENVISAT-ASAR dual-polarization data for estimating soil moisture over agricultural fields. Can. J. Remote Sens. 2012, 38, 514–527. [Google Scholar]
  42. SNAP Development Team. Sentinel Application Platform Software. Available online: http://step.esa.int/main/toolboxes/snap/ (accessed on 20 July 2018).
  43. Rasterstats, Python Module for Summarizing Geospatial Raster Datasets Based on Vector Geometries. Available online: https://github.com/perrygeo/python-rasterstats (accessed on 3 August 2018).
  44. GitHub Repository. Available online: https://github.com/perrygeo/python-rasterstats (accessed on 9 September 2018).
  45. QGIS Development Team, QGIS Geographic Information System, Open Source Geospatial Foundation Project. Available online: http://qgis.osgeo.org (accessed on 16 August 2018).
  46. Opencv-Python. Available online: https://pypi.org/project/opencv-python/ (accessed on 15 October 2018).
  47. Macelloni, G.; Paloscia, S.; Pampaloni, P.; Marliani, F.; Gai, M. The Relationship between the Backscattering Coefficient and the Biomass of Narrow and Broad Leaf Crops. IEEE Trans. Geosci. Remote Sens. 2001, 39, 873–884. [Google Scholar] [CrossRef]
Figure 1. The location map of the study area; general overview (left) and Sentinel-2 RGB image of the study site (right).
Applsci 09 00655 g001
Figure 2. Soil map of the study area.
Applsci 09 00655 g002
Figure 3. Land use map of the study area (Source: Copernicus Land Monitoring Service [19]).
Applsci 09 00655 g003
Figure 4. Seasonal maize, sunflower and wheat calendar of the region.
Applsci 09 00655 g004
Figure 5. Different growth stages of crops in the study area.
Applsci 09 00655 g005
Figure 6. BBCH-scale relationship with crop height (ac), and Correlation between canopy coverage (CC) and crop height (df) for maize, sunflower, and wheat.
Applsci 09 00655 g006
Figure 7. Flowchart of Sentinel-1 dual polarization SAR data processing.
Applsci 09 00655 g007
Figure 8. Correlation between (ac) intensity arithmetic calculation of VV + VH, (df) σ⁰VV backscatter, and (gi) σ⁰VH backscatter values of maize, sunflower and wheat with their height during growing stages.
Applsci 09 00655 g008
Figure 9. Correlation between Entropy (ac), Anisotropy (df) and Alpha (gi) decompositions of maize, sunflower and wheat with their height during growing stages.
Applsci 09 00655 g009aApplsci 09 00655 g009b
Figure 10. Canopy coverage extraction from in-situ photo taken using python image processing packages. Left panel (a) is the original photo and the right panel (b) shows white ratio calculated as green areas and black to the bare soil in wheat sample field.
Applsci 09 00655 g010
Figure 11. Correlation between σ⁰VV (a), and VV + VH (b), backscatter values of maize, and VV + VH (c) backscatter value of sunflower with their CC during growing stages.
Applsci 09 00655 g011
Table 1. Biologische Bundesanstalt, Bundessortenamt, and CHemische (BBCH)-identification keys for field measurements and Synthetic Aperture Radar (SAR) data acquisitions of the study area.
Field SurveysCrop Growth Stages (BBCH)SAR Acquisitions Dates
19 May–12 June 2016leaf development 13 June 2016
01–02 July 2016stem elongation07 July 2016
31 July 2016heading 131 July 2016
24–25 August 2016flowering24 August 2016
1 Due to variation in wheat growth conditions in different fields, in general heading stage starts at late May and lasts until mid-June.
Table 2. Specifications of acquired Sentinel-1 datasets over Konya basin, Turkey.
Acquisition DateIncidence Angle (°)Satellite Pass PolarizationNominal Resolution(m) Orbit Number
NearFarRangeAzimuth
13 June 201630.7249.09DescendingVH and VV2.3313.9365
07 July 201630.7249.11DescendingVH and VV2.3313.9365
31 July 201630.7249.11DescendingVH and VV2.3313.9365
24 August 201630.7249.11DescendingVH and VV2.3313.9365
Table 3. Coefficient of determination (R2) between crop height and Sentinel-1 SAR parameters.
SAR Parameters Maize Height (H)Sunflower Height (H)Wheat Height (H)
H < 150 cmH > 150 cmH < 92 cmH ≥ 92 cmH < 53 cmH ≥ 53 cm
Linear Polarization
C11_Intensity (VH)0.80−0.010.31−0.060.650.03
C22_Intensity (VV)0.81−0.200.17−0.190.62−0.01
H-Alpha Decomposition
Entropy (H)0.530.200.010.20−0.610.06
Anisotropy (A)−0.54−0.230.00−0.18−0.65−0.05
Alpha (α)−0.52−0.19−0.05−0.170.67−0.07
Radar Vegetation Index
RVI0.530.210.110.18−0.650.03
Intensity Ratio
VH/VV0.520.210.110.170.660.05
(VV − VH)/(VV + VH)−0.53−0.21−0.11−0.180.65−0.05
Intensity Arith. Oper.1
VH − VV0.77−0.21−0.140.200.63−0.03
VV + VH0.82−0.180.19−0.180.610.00
1 Intensity Arithmetic Operation. The minus indicates negative correlation.
Table 4. Coefficient of determination (R2) between CC and Sentinel-1 SAR parameters.
SAR Parameters Maize CC Sunflower CCWheat CC
CC < 75%CC ≥ 75%CC < 85%CC ≥ 85%CC < 60%CC ≥ 60%
Linear Polarization
C11_Intensity (VH)0.25−0.410.070.18−0.01−0.15
C22_Intensity (VV)0.73−0.490.460.090.10−0.06
H-Alpha Decomposition
Entropy (H)−0.280.36−0.06−0.01−0.09−0.01
Anisotropy (A)0.30−0.310.060.010.050.02
Alpha (α)0.29−0.320.070.000.070.04
Radar Vegetation Index
RVI−0.290.29−0.070.01−0.08−0.03
Intensity Ratio
VH/VV−0.300.28−0.070.00−0.06−0.05
(VV − VH)/(VV + VH)0.29−0.290.070.000.070.04
Intensity Arith. Oper. 1
VH − VV−0.690.48−0.41−0.07−0.150.02
VV + VH0.73−0.490.470.100.05−0.11
1 Intensity Arithmetic Operation. The minus indicates negative correlation.

