Study on the Reduction Effect of Stereo Depth Caused by Lens Aberration in Lenticular-Based Autostereoscopic Displays


1
Graduate School at Shenzhen, Tsinghua University, Shenzhen 518055, China
2
Department of Precision Instrument, Tsinghua University, Beijing 100084, China
3
Department of Electrical and Computer Engineering, Seoul National University, Seoul 08826, Korea
*
Author to whom correspondence should be addressed.
Appl. Sci. 2019, 9(3), 380; https://doi.org/10.3390/app9030380
Submission received: 28 November 2018
/
Revised: 14 January 2019
/
Accepted: 15 January 2019
/
Published: 22 January 2019
Abstract
:Autostereoscopic displays employing lenticular sheets have broad applications due to the high transmittance of lenticular sheet. However, due to the restriction of lens array design and processing, the imperfect image of lenses can reduce the quality experience of autostereoscopic displays. Stereo depth is one of the qualities of experience parameters, which relates to the three-dimensional effect. Therefore, to quantize the reduction effect of stereo depth caused by lens aberration is of great value. In this paper, we implement a binocular model of an autostereoscopic display system with lens array to analyze this effect, which is different from the previously used monocular model. Two receivers in the positions of viewer’s eyes are set on the viewing plane, and a similar factor is defined to evaluate the difference of light spots perceived by the two receivers. When the similar factor exceeds a certain value, the two spots cannot be fused in the brain, thus restricting the perceived stereo depth. Both in simulation and experiment, a sudden decrease of the similar factor is observed when the viewing angle exceeds 16°. In the subjective experiment, all the sixteen viewers feel a sudden decrease of stereo depth when the viewing angle exceeds 16°, which further verifies the validity of the model. The model and the method are significant for improving the viewing experience of autostereoscopic displays and providing a guidance on autostereoscopic display system designing.
1. Introduction
Three-dimensional (3D) display provides vivid viewing experiences and is expected to be widely used in areas such as entertainment, advertising, national defense, and scientific research [1,2]. Viewing through parallax barriers and lenticular sheets are the dominant autostereoscopic technologies [3,4,5]. Compared to the low transmittance of parallax barrier, lenticular sheet-based technique is better for outdoor use [6]. Pixels in autostereoscopic displays (ADs) are classified to display stereo images of different views, and every view of stereo images are directed into different regions by parallax barriers or lenticular sheet. A viewer at a right viewing point can perceive two stereo views by his eyes, and a 3D effect is achieved by the fusion of the stereo images in his brain. According to the theory of Panum’s fusional area [7] and a previous study on visual fatigue of lenticular-based ADs [8], the fusion fails if the maximum horizontal disparity angle of the stereo image pair is larger than 0.2°. Therefore, theoretically, the perceived maximum stereo depth (SD) performed by an AD is limited by the finite small pixel pitch of the display screen. It is worse for lenticular-based ADs, most of them cannot perform the maximum SD, and are theoretically limited by their pixel pitch, because of the unperfect lenslets employed in the lenticular sheets. Due to the limitation of design and processing, most of the lenticular sheets employ simple cylindrical lenslets with low processing accuracy. Furthermore, the lenslets in the margin area of an AD suffer from large incident light beams and long imaging distance. This aberration may greatly reduce the viewer’s depth sensation. The quantification of this effect is essential to both the design and evaluation of the ADs.
SD is one of the three quality of experience parameters of a stereoscopic display, and the only one that relates to the 3D effect. Generally, the SD is considered to be a synthesized effect that can be affected by many factors together [9]. Several groups have studied the factors that impact the SD of ADs. A previous study shows that, although human depth perception can be obtained from different depth cues, binocular disparity is the most important one when viewing stereoscopic 3D displays [10]. Therefore, the reduction and disturbance to binocular disparity decrease the perceived SD. The influence of crosstalk to stereopsis was theoretically and experimentally studied [11]. The experimental results show that reducing crosstalk can improve the perceived SD [12,13,14,15]. Crosstalk is a synthesized effect, which can be caused by installation errors, lens problems, etc. Therefore, it is difficult to derive the specific relationship between crosstalk and SD. In addition, the enhancement of angular resolution was reported to improve perceived SD [16], but the explicit relationship between angular resolution and the SD was not reported. It is of great significance if one influence factor on perceived SD can be analyzed quantitatively.
The reduction effect of lens aberration on SD was quantitatively studied by using wave optics [17,18]. A monocular model of the display system was implemented. In the model, a stereo point, represented by one pixel, was imaged by a lenslet in the lenticular sheet with aberration at the expected 3D point position. The work in References [17,18] used the hypothesis that, if the image spot can be distinguished by the viewer’s eye, the 3D point can be formed in the viewer’s brain. It can be deduced that, when different 3D contents are loaded on an AD, the positions of the 3D point formed by a lenslet are different. The problem that a lenslet cannot adjust its focal length to image the corresponding pixel in different positions arises here, because it is hard to detect the 3D position before the 3D point is formed. While there are lenticular sheets with adjustable lenslets [19,20,21,22], the focal length of the lenslets is adjusted for extending the viewing distance of the AD, not for imaging the corresponding pixels. As we know, lenslets in the lenticular sheet are used for collimating and redirecting the light beams emitted from the pixels on the AD, not for imaging the pixels at the expected 3D point positions. Actually, there is no point imaged at the expected 3D point position. The 3D point is only virtually formed in the viewer’s brain due to the fusion of the stereo pair. Therefore, the monocular models in References [17,18] are far more than sufficient to quantify the effect of lens aberration on SD.
We believe that the binocular vision theory is the right way to solve the problem. The key point to the fusing in the brain is the disparity formed in the left and right eyes. Therefore, we propose a binocular model to sidewise assess the perceived SD by using the similar factor of spots at the viewing plane.
In this paper, based on the principle of binocular vision, we implement a theoretical model to quantize the reduction effect of lens aberration to SD in ADs. A stereo pair of spots, represented by two pixels in the display panel and emits light rays through two different lenslets, and the two light beams reach the viewing plane and form two light spots with an interpupillary distance. By comparing the disparity of the two light spots in the viewing position, the reduction effect of SD caused by lens aberration can be obtained. We only consider the stereoscopic vision and neglect the psuedoscopic vision that can cause the object flip inside out.
The rest of the paper is organized as follows. In Section 2, the models of SD for ADs are presented by using the principle of binocular vision, and in Section 3, simulations are performed to investigate the relationships between each parameter and SD. Section 4 presents the experiments to verify the influence of the viewing distance and viewing angle by SD reduction. Finally, the conclusions are presented in Section 5.
2. The Model of Stereo Depth for Lenticular-Based Autostereoscopic Displays
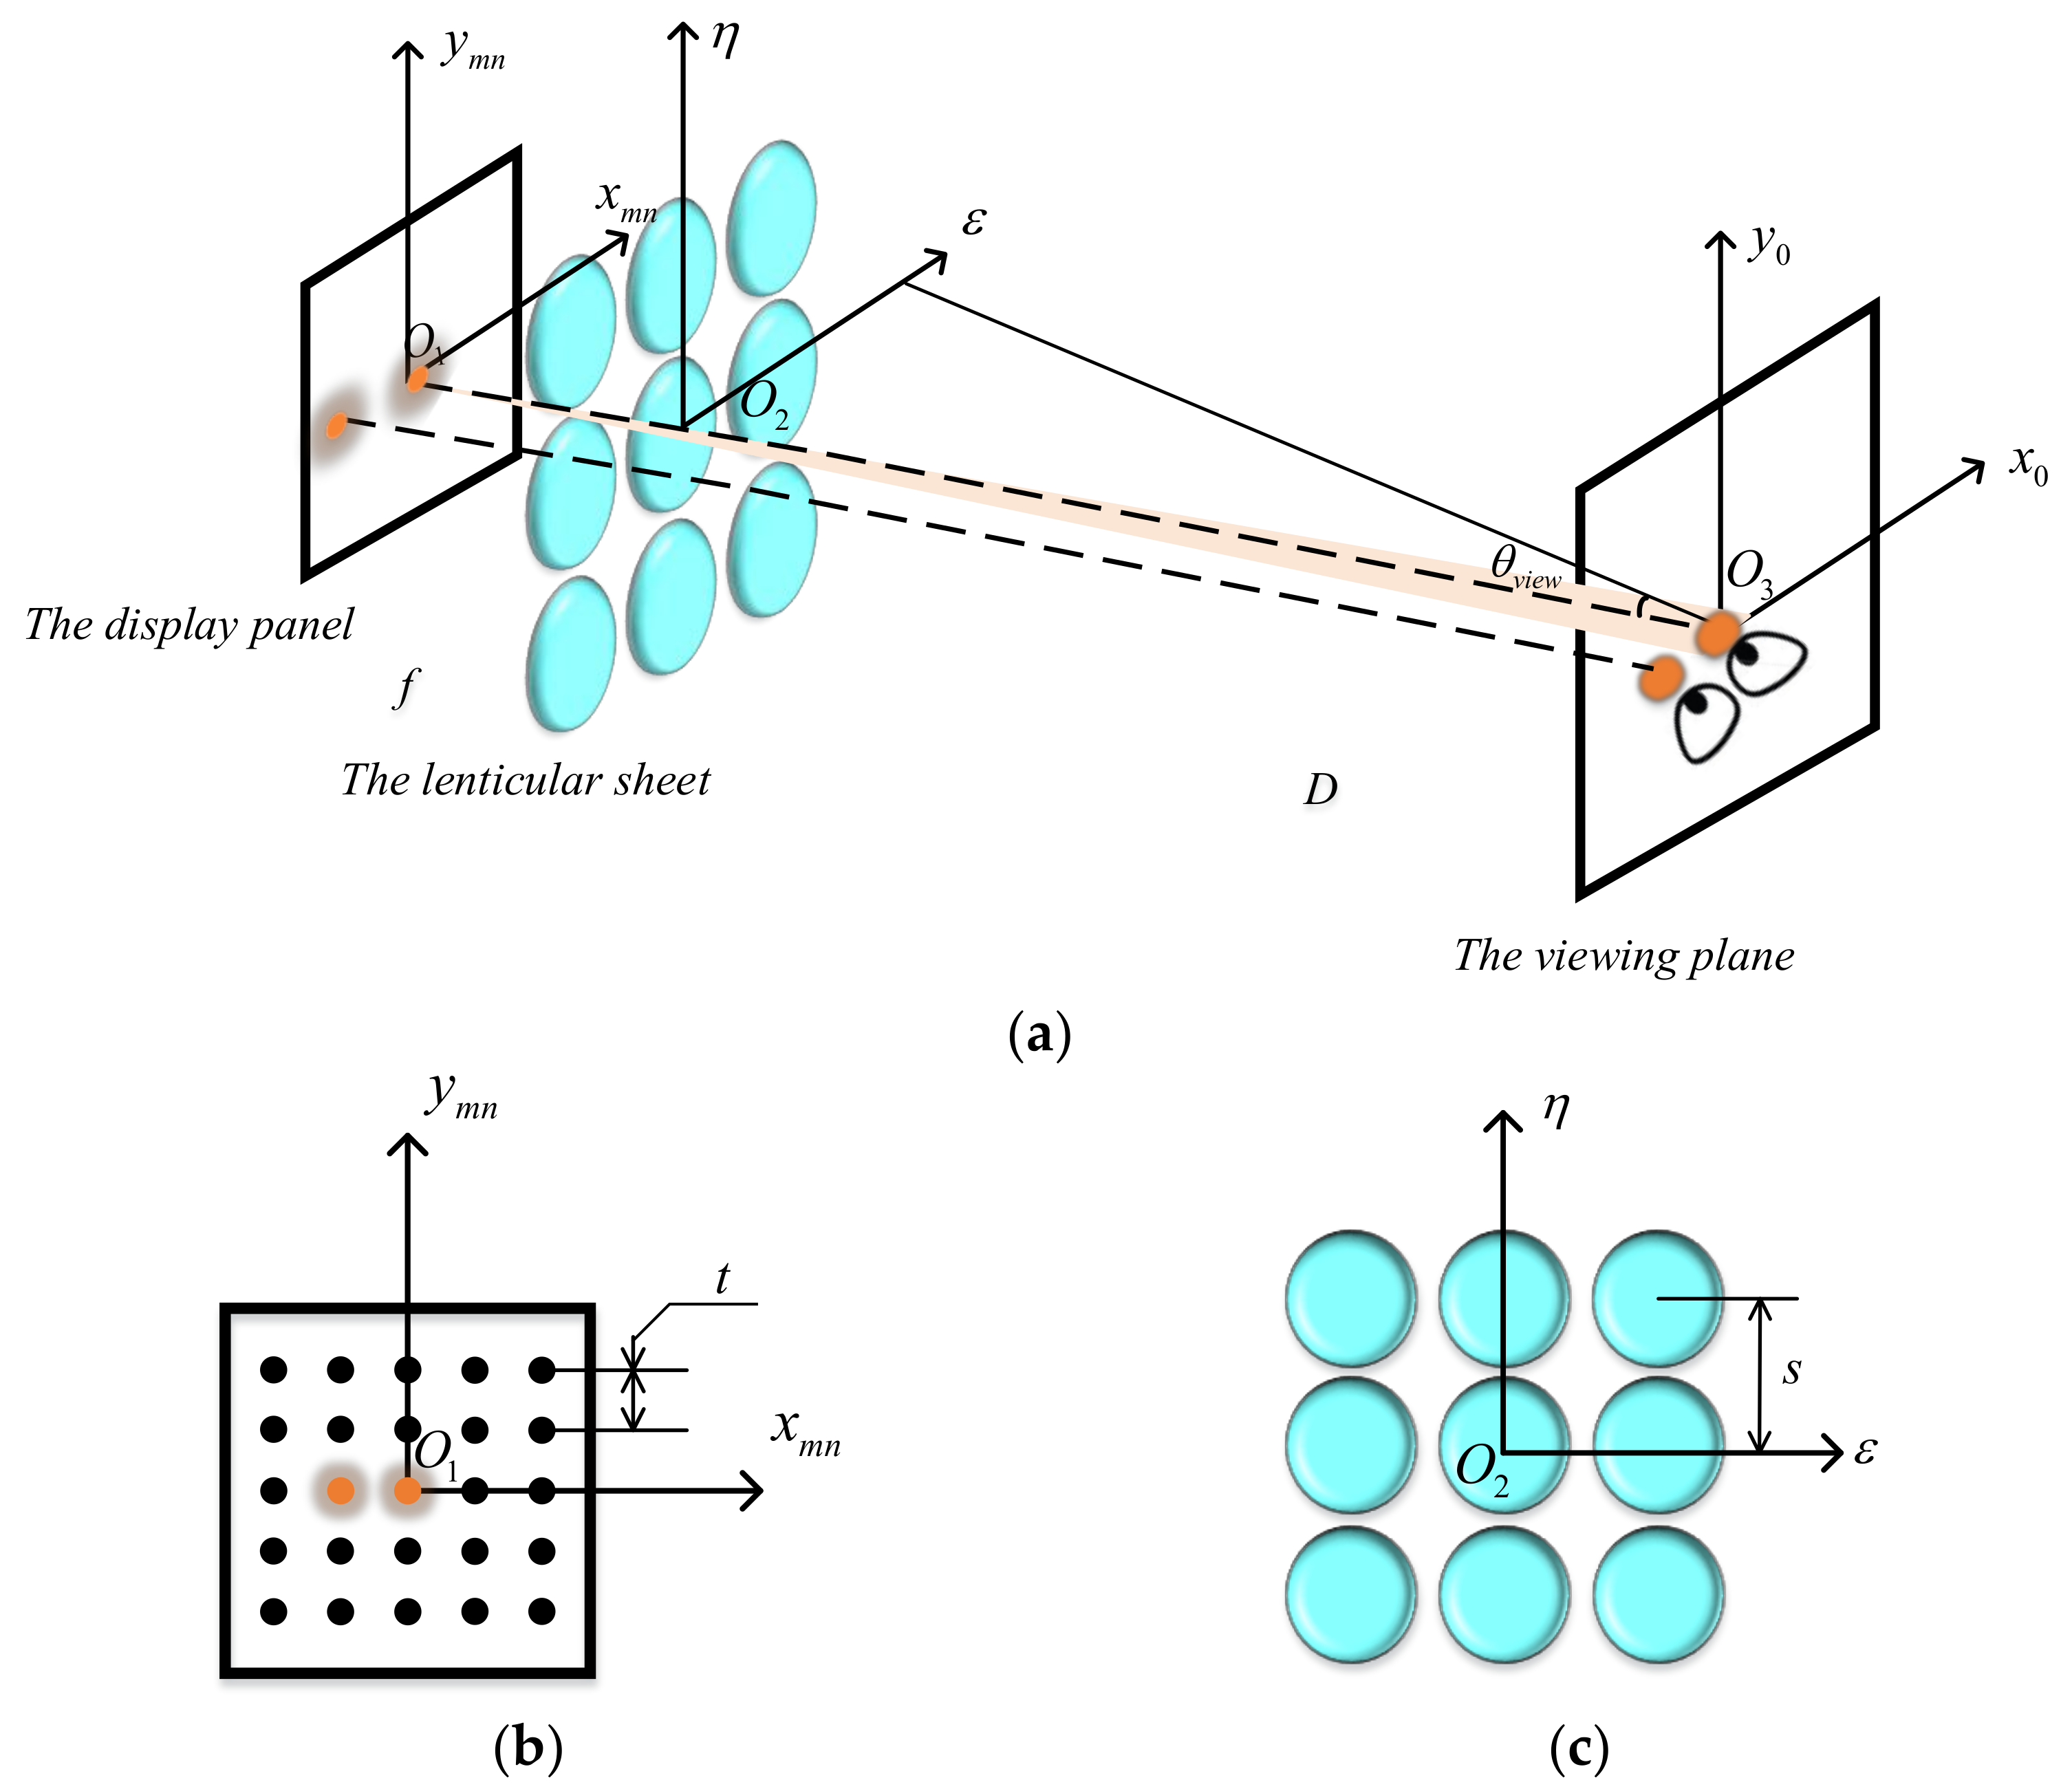
We implement a light propagation model of a typical AD system shown in Figure 1 in this section and analyze the influence of the lens aberration to the SD, accordingly in the following part.
As shown in Figure 1, two pixels in the display panel, represented by two orange spots, are loaded a stereo pair of points, which can be considered to be two point light sources. The display panel is in the plane. The lenticular sheet is in the ε − η plane. The viewing plane is the x0 − y0 plane. Light emitted by the two-point light sources are redirected by the lenticular sheet and form two spots at the viewing plane, which are represented by the two orange spots in the x0 − y0 plane. The positions of the viewer’s eyes must be superposed with the two orange spots in the x0 − y0 plane to let the viewer perceive 3D effect. The distance between the panel and the lenticular sheet is equal to the focal length f of the lenslets in the lenticular sheet, and the distance between the lenticular sheet and the viewing plane is the designed viewing distance of the AD, which is defined as D. The pitch of the lenslets is s. A lenslet in the lenticular sheet can be located by the center point of the lenslet, named (ms, ns), wherein m and n are integers. A pixel in the display panel can be defined by its position, named as (kt, lt), wherein k and l are integers, and t is the pitch of the display panel. The viewing angle is defined as the angle between the line through the pixel and the viewer’s eye and the line perpendicular to the display panel.
A pixel (kt, lt) emits a spherical wave with the wavelength of λ through a lenslet (ms, ns) in the lenticular sheet, and the light wave reaches the viewing plane and forms a light spot with the intensity distribution Emn. According to the scalar diffraction theory [23], Emn can be expressed as:
where is the complex amplitude transmittance function of the lens (ms, ns), with the expression of
and is the pupil function of the lens (ms, ns) and is defined as:
R is the amplitude transmittance of the lens substrate at the wavelength of λ, and is the surface function of the lens. If the shape of the lenslet is spherical, there is
Equation (1) only considered the paraxial incident light beam to the viewing point. However, in most cases, the wave from the pixel to the viewing point is slant, which makes Equation (1) invalid. To solve this problem, an inclination factor [24] is introduced into Equation (1), which is related to the viewing angle , as expressed by:
With the incline factor , Equation (1) is modified into a general form:
To fuse a 3D point in the viewer’s brain, the sizes of the beam spots perceived by left and right eyes should be similar. The diameter of the light spot at the viewing plane can be obtained according to the intensity distribution Emn calculated by Equation (6). We define a similar factor, which is represented by to evaluate the difference of left and right spots, as shown in Equation (7), and the average interpupillary distance value 65 mm [25] is used in the simulation in the following sections.
where and are the diameter of the left and right spots formed in the viewing plane, respectively. When the similar factor exceeds some certain value, the two spots cannot be fused in the brain; thus, the corresponding SD cannot be performed by the AD system. We will discuss the threshold value of the similar factor by simulation and experiments in the following section.
3. Simulation
An AD prototype developed by our lab [6] is employed to verify our theory. This prototype is based on a light emitting diode (LED) display. Every pixel of the LED display is composed of a red, a green, and a blue LED chips in a vertical line, with the size of 0.18–0.23 mm. The size of every pixel is 2 mm. Other specifications of the prototype are shown in Table 1.
Note that our prototype employs cylindrical lenslets as the light splitting elements; thus, the surface function of the lens ms is:
According to the parameters of the prototype and the Panum theory [7], the maximum SD that can be performed by this prototype is 1420 mm and the corresponding maximum screen parallax of this prototype is 18.5 mm. However, as there is imaging aberration by lenslets, viewers in margin areas may not experience the SD of 1420 mm. We can find the maximum viewing angle by using the model in Section 2.
First, we calculate the diameter of light spots in the viewing plane. We study the light spots formed by two pixels in the display panel as a stereo pair with the maximum screen parallax 18.5 mm. Each pixel emits a spherical wave to the corresponding lenlets, and two light spots are formed in the viewing plane, with the distance of 65 mm. After being multiplied by the transmittance function of the lenlets (R = 1), a diffraction integral is done to obtain the light intensity at a single point in the viewing plane according to Equation (6). In the simulation, only the light with the wavelength of 550 nm is considered. We calculated 512 × 512 points in the area of 265 mm × 265 mm in the viewing plane for each stereo pixel. The full width at half maximum (FWHM) value of the spot intensity is considered to be the width of the spot. We calculate the spots with the viewing angles from 0°~20°, with an interval of 2°. Some of the spots’ shapes are shown in Figure 2, and to show the width difference of the spots at different viewing angles, we present their horizontal cross section of the spots’ intensity in Figure 2. As we use cylindrical lenslets in the AD prototype, “spots” are actually lines, as shown in Figure 2. However, for convenience, we still use the name “spot” in the following parts.
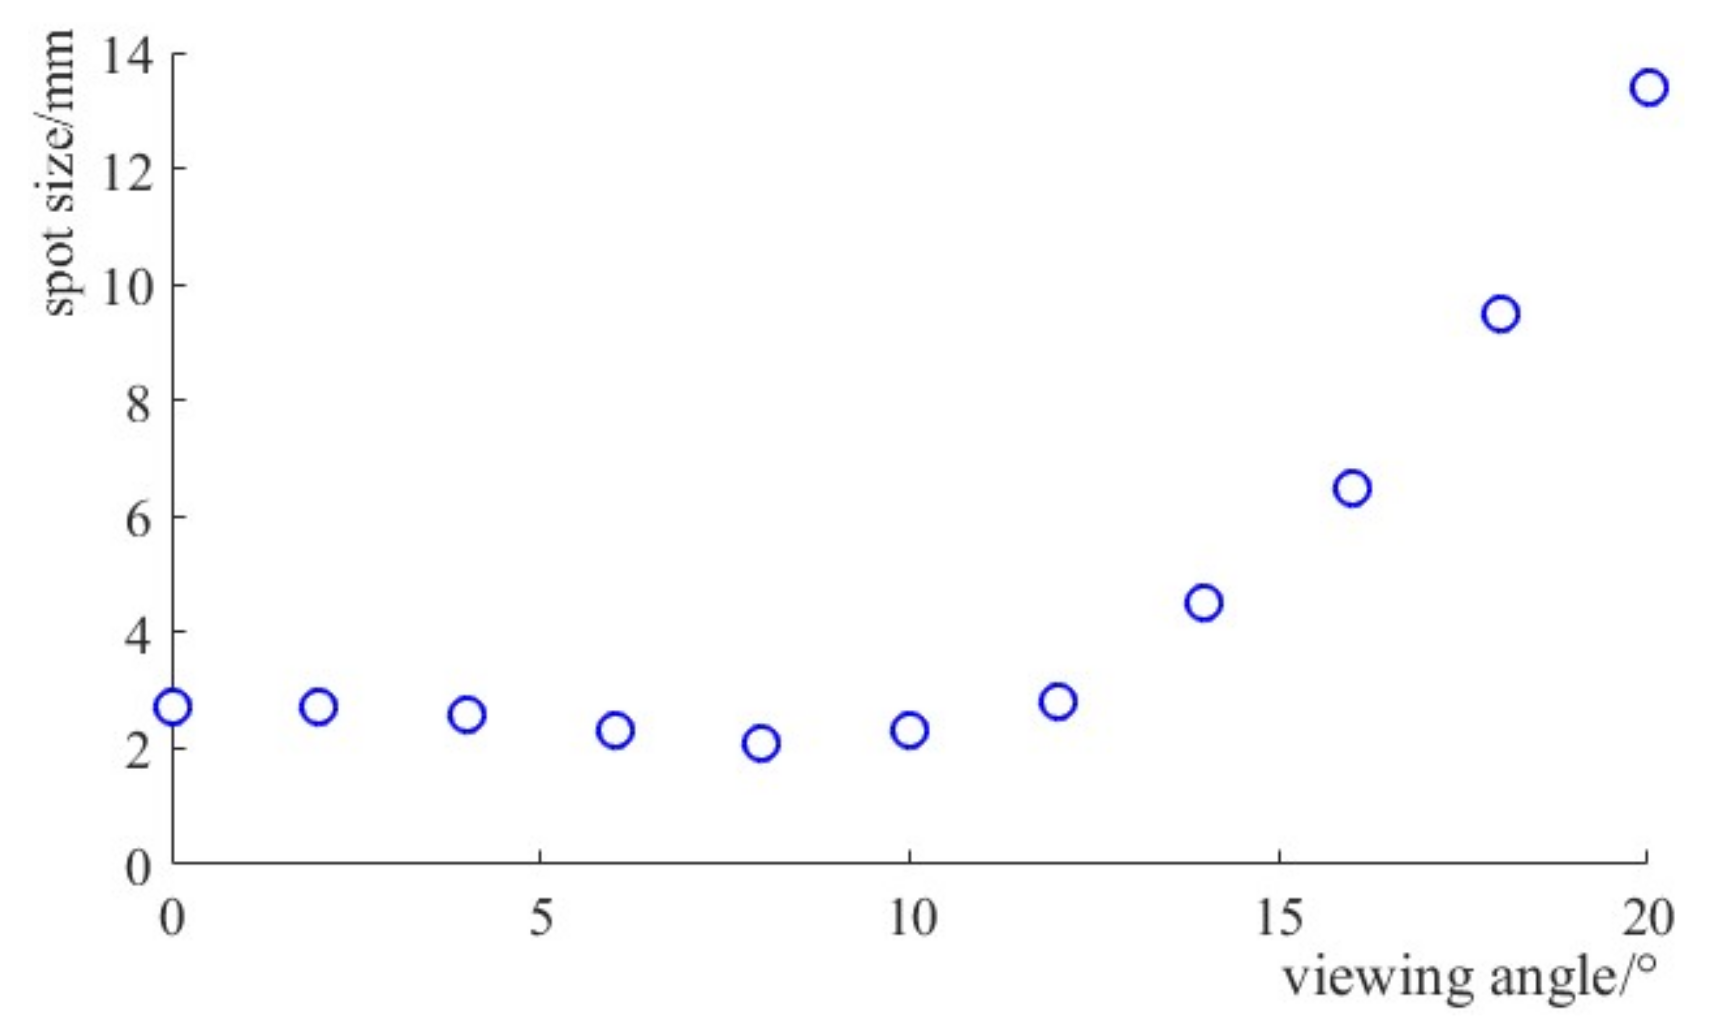
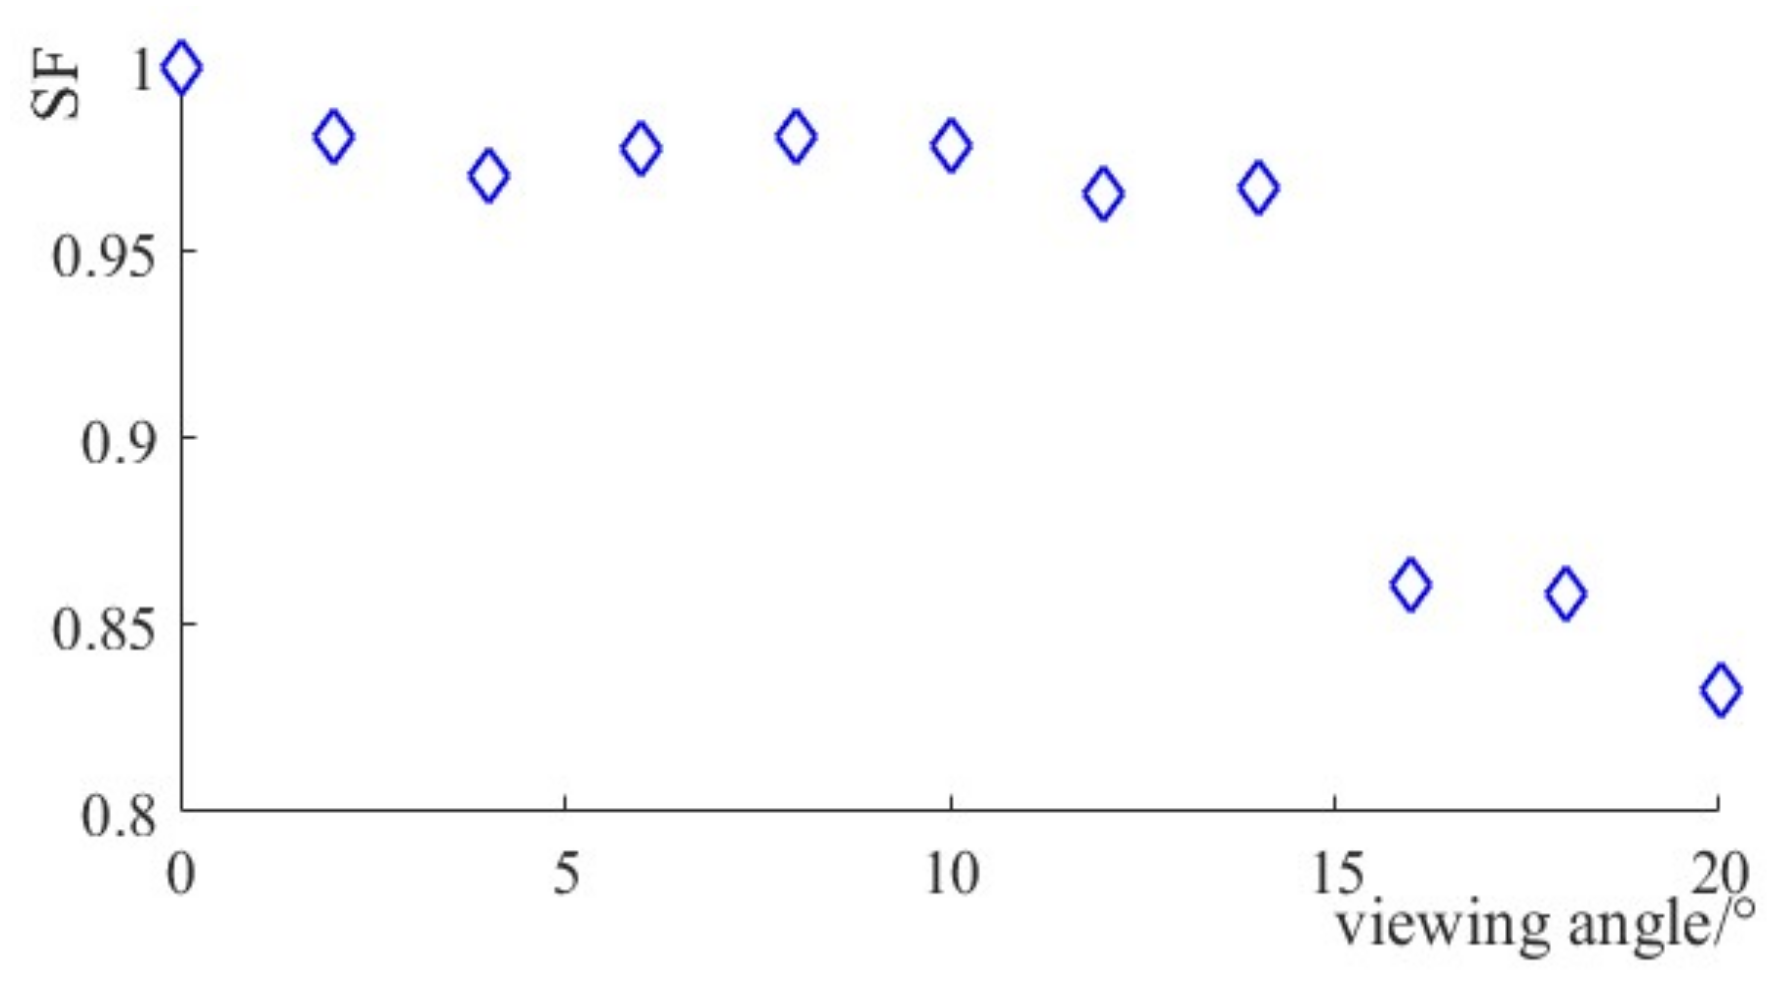
We further show the relationship between spot sizes and viewing angles in Figure 3. The similar factors of the perceived stereo pair at each viewing angle are calculated according to Equation (7). The relationship between the similar factors and the viewing angles are shown in Figure 4. As seen in Figure 4, the similar factor value remains larger than 0.95 when viewing angles increase from 0° and decreases sharply at the viewing angle of 16°, which shows the distinct SD reduction effect of imperfect lenlets. This breaking point shows the viewing angle limitation caused only by lens aberration.
According to the simulation result, with the sudden decrease of the similar factor when the viewing angle exceeds 16°, viewers are expected to feel a sudden decrease of SD. A similar result can be obtained if the positions of the stereo pair pixels are fixed and the viewer moves along the x0 axis on the viewing plane. According to the geometrical relationship, if the viewer stands at point O3, he/she will experience a full SD (the maximum stereo depth of the AD system) within the full width of the display panel, and the SD decreases sharply from the outside area of the screen. Concerning the SD effect provided by the center of the screen, then the viewer should not deviate point O3 more than 1200 mm. The conclusion of the simulation experiment will be further proved in the experiment part.
4. Experimental Verification
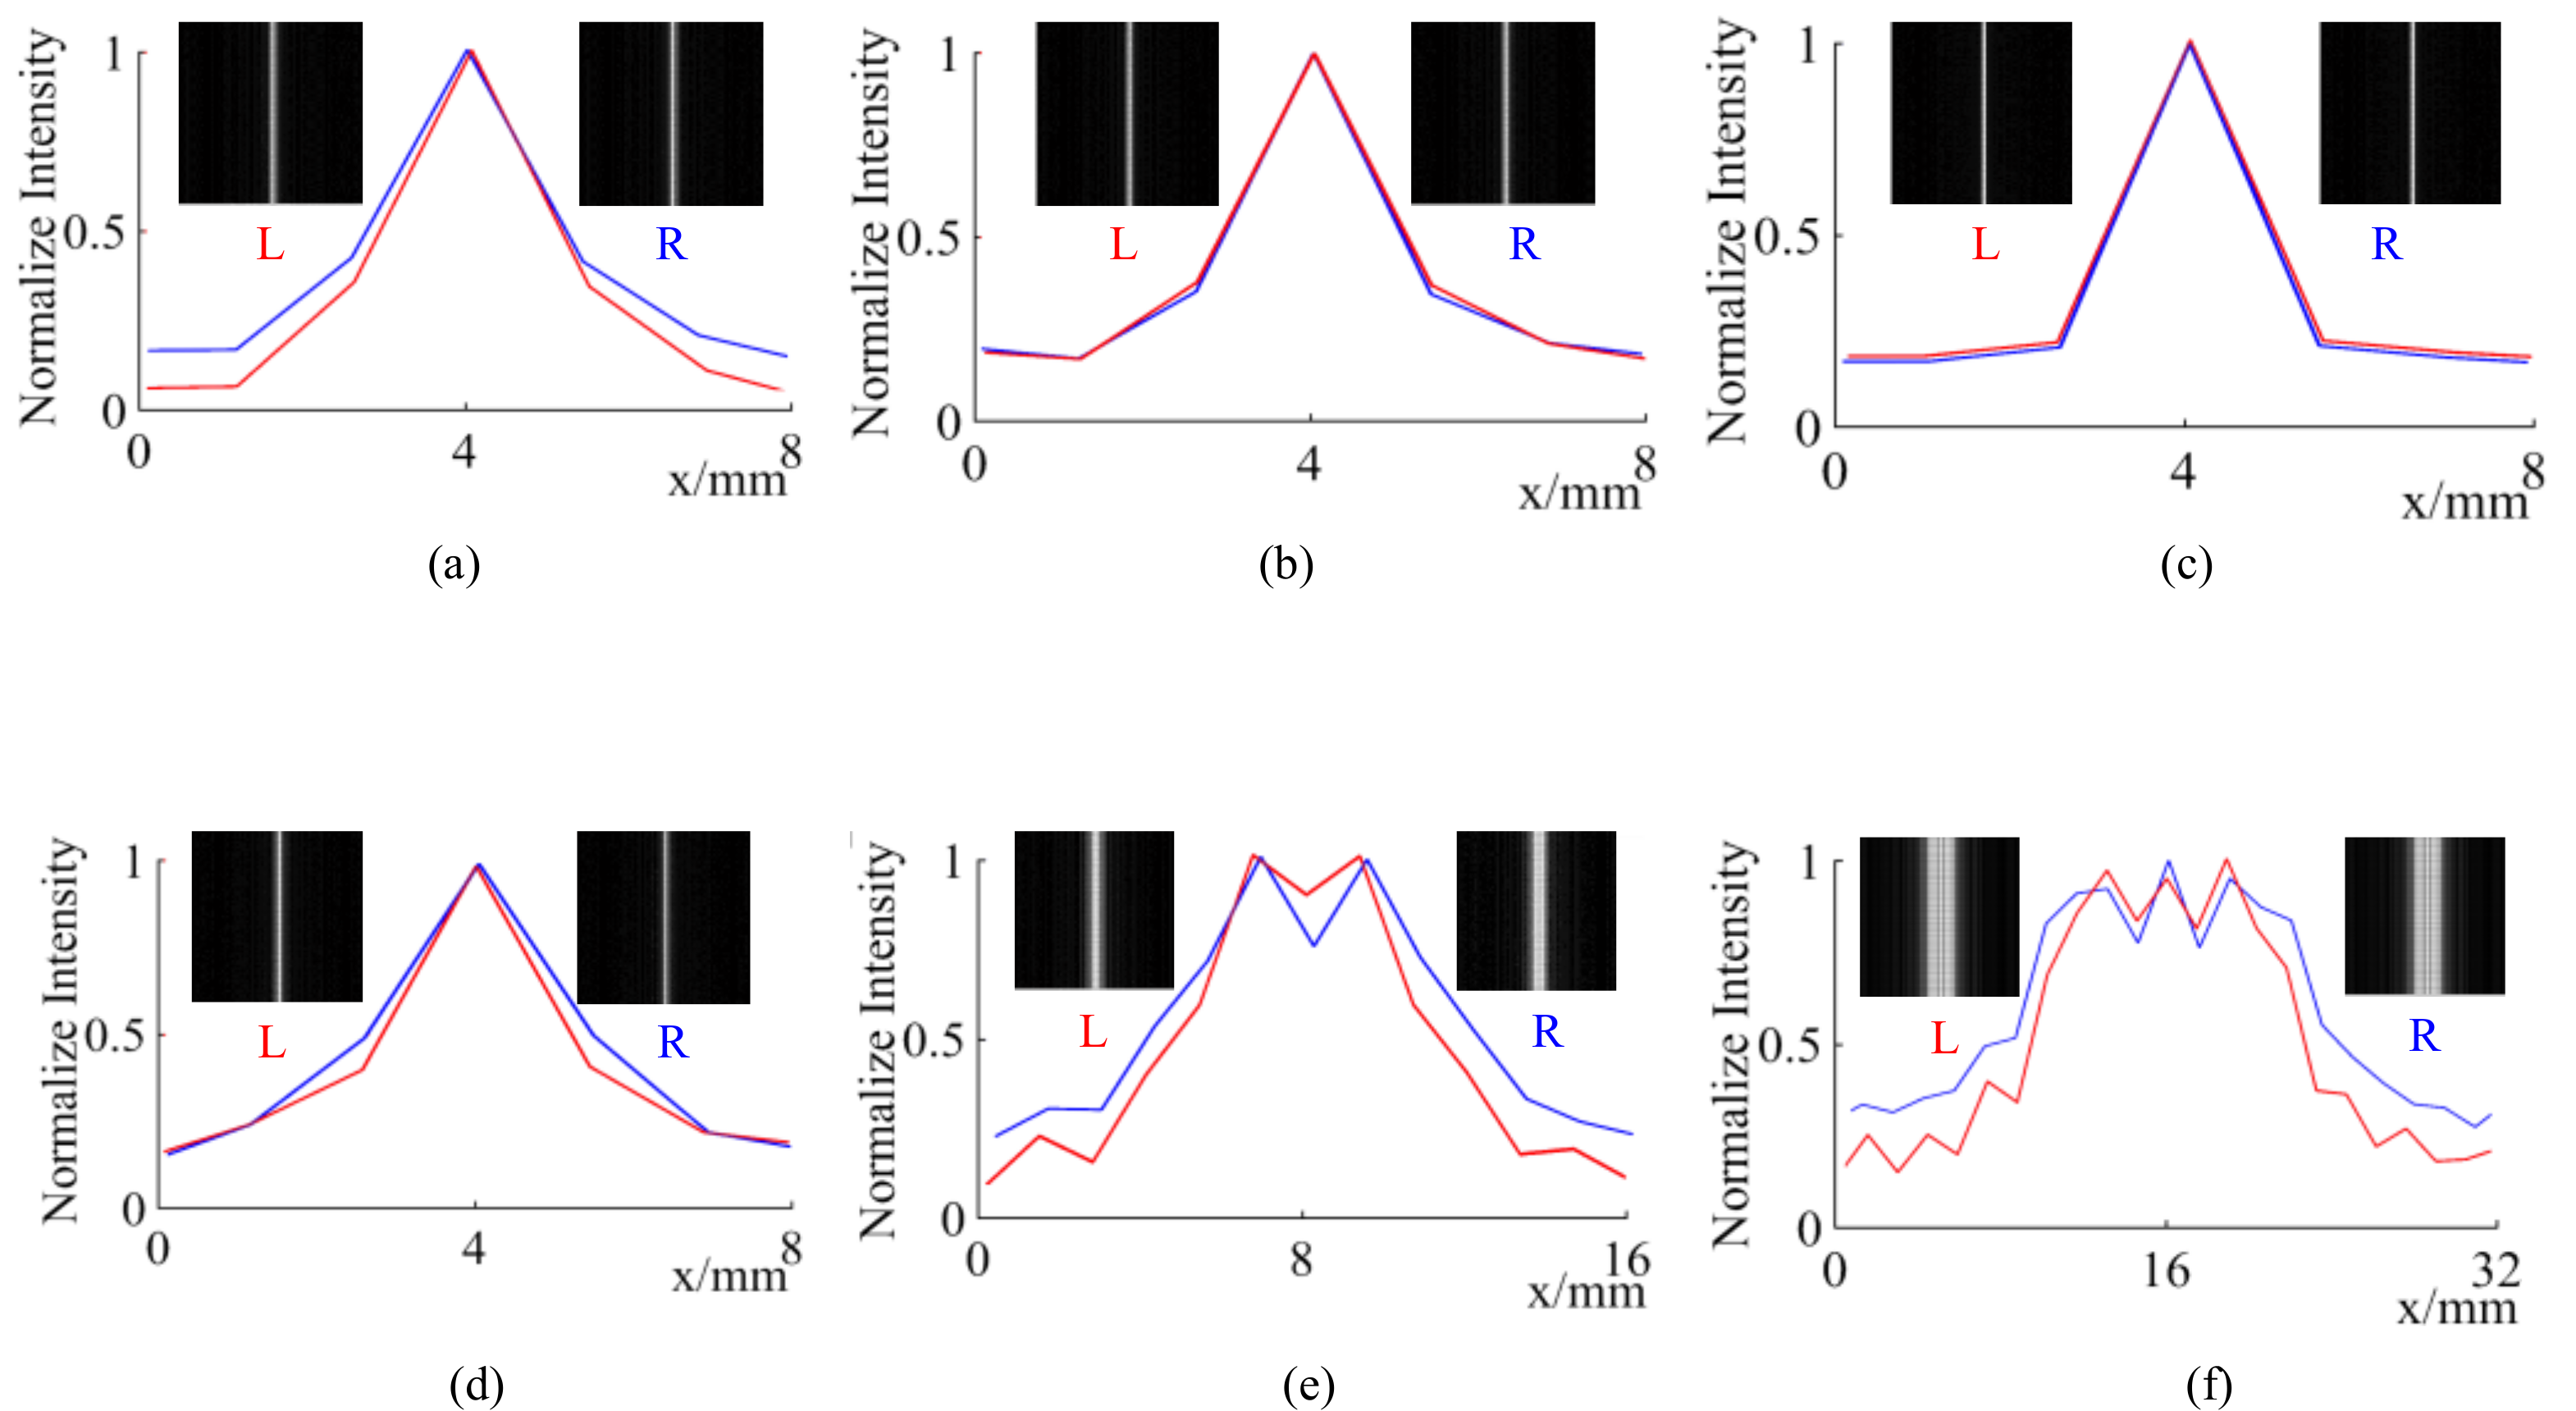
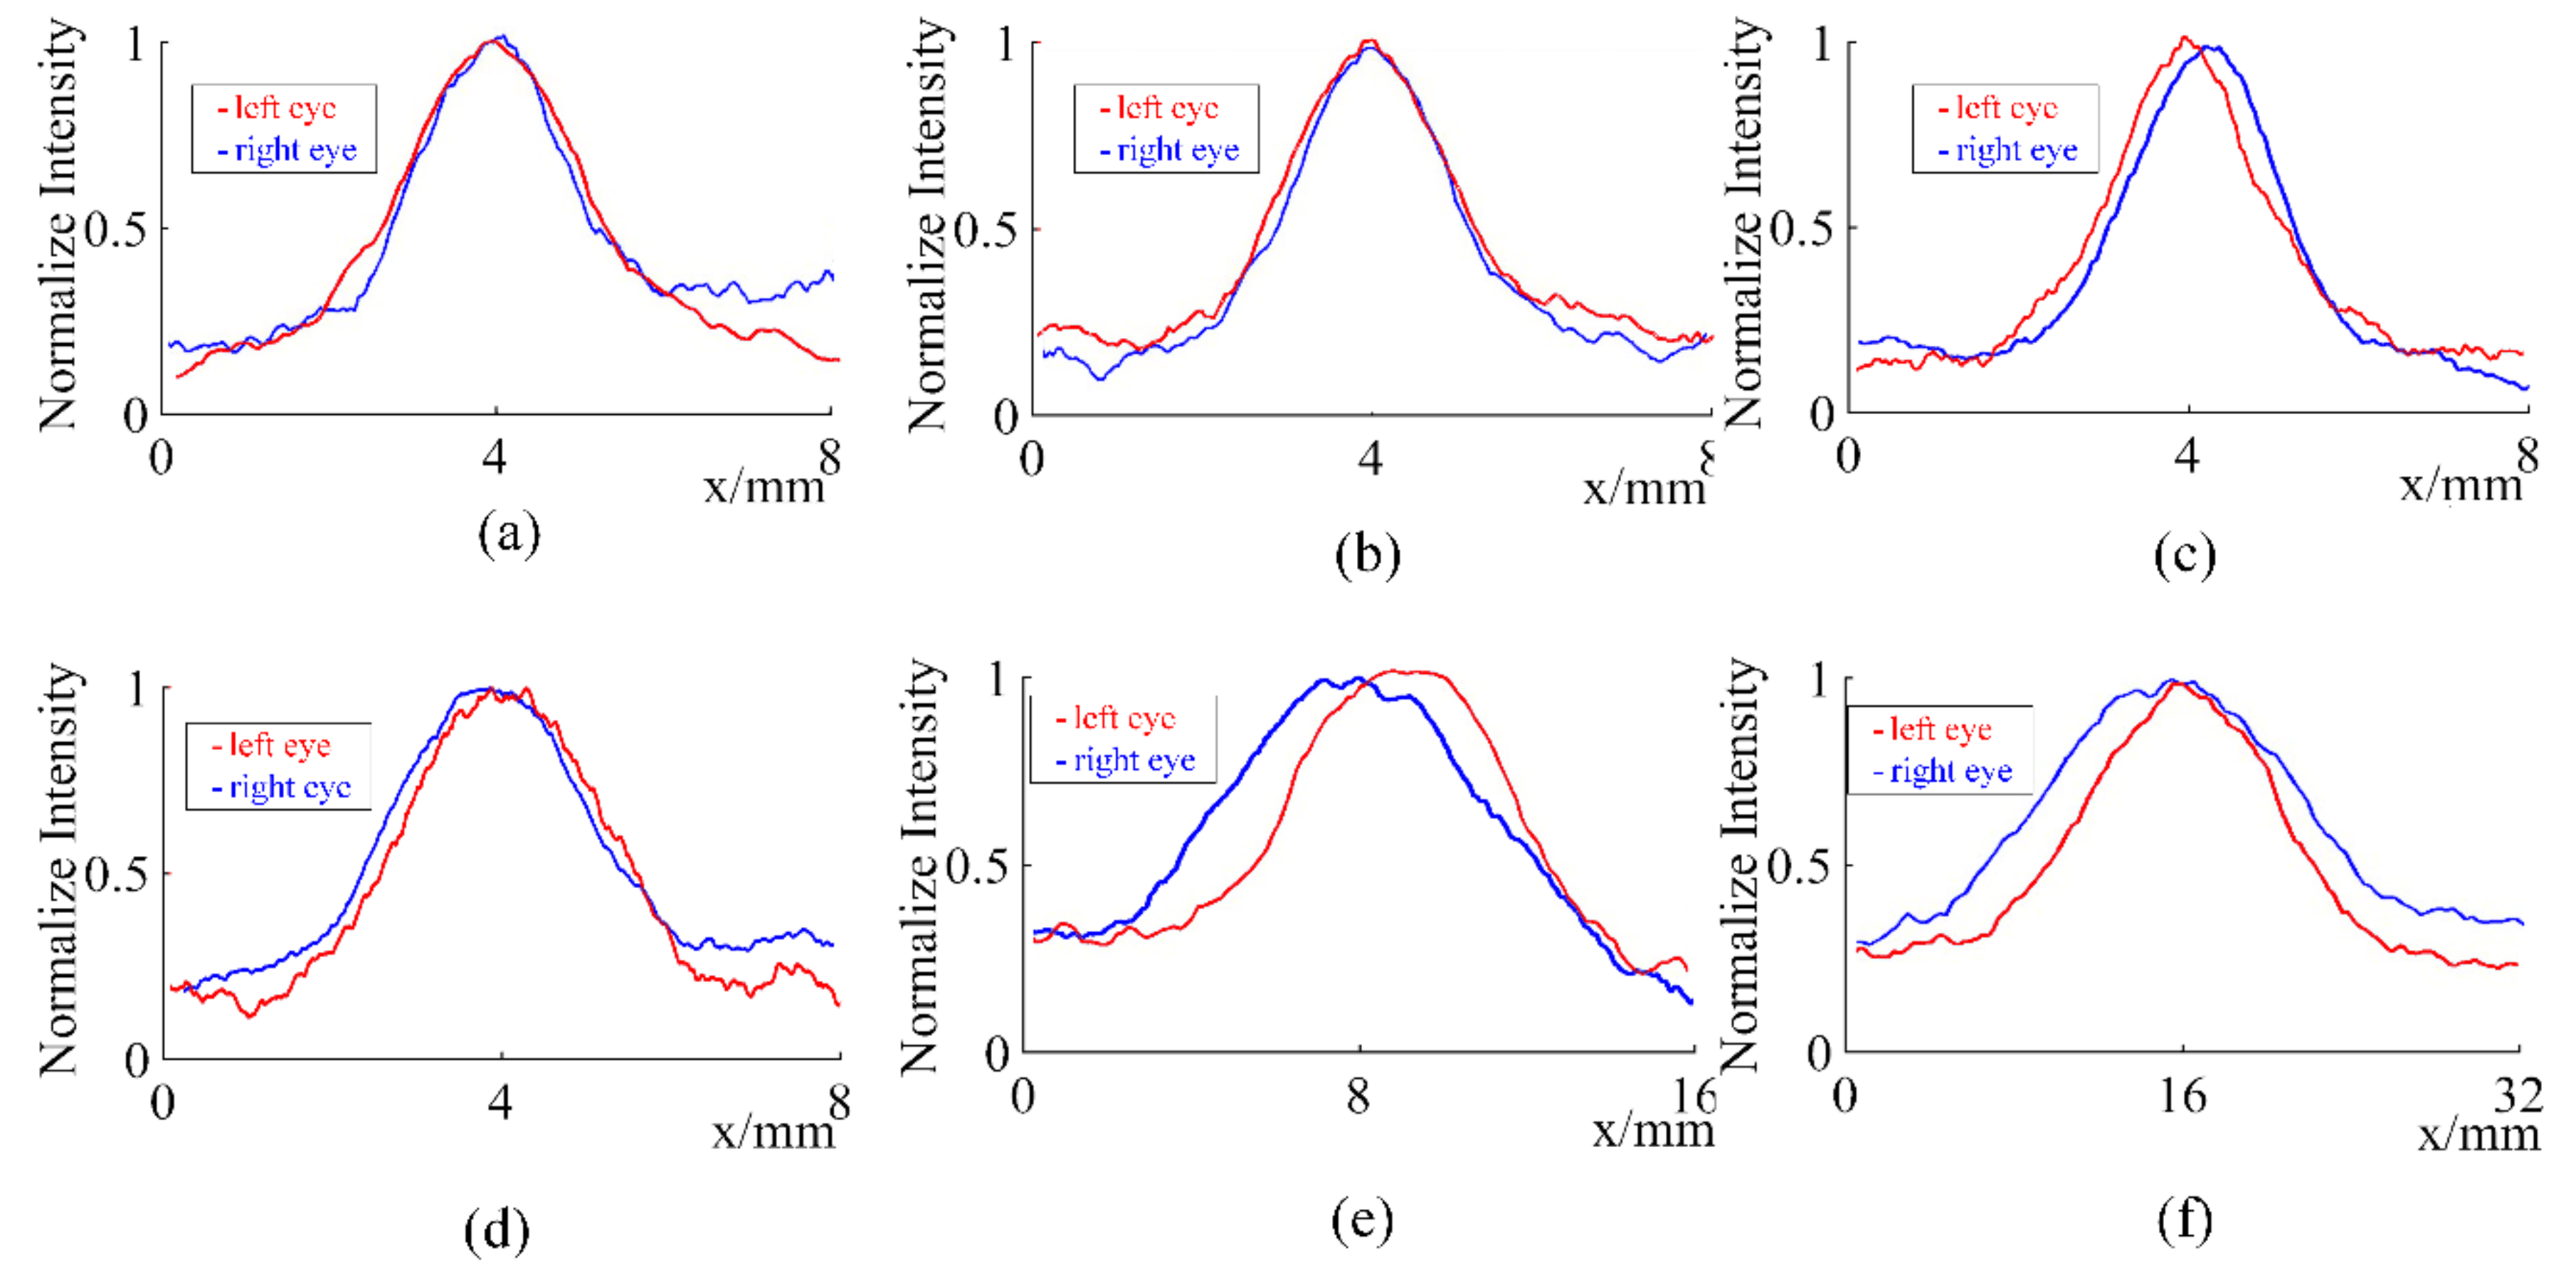
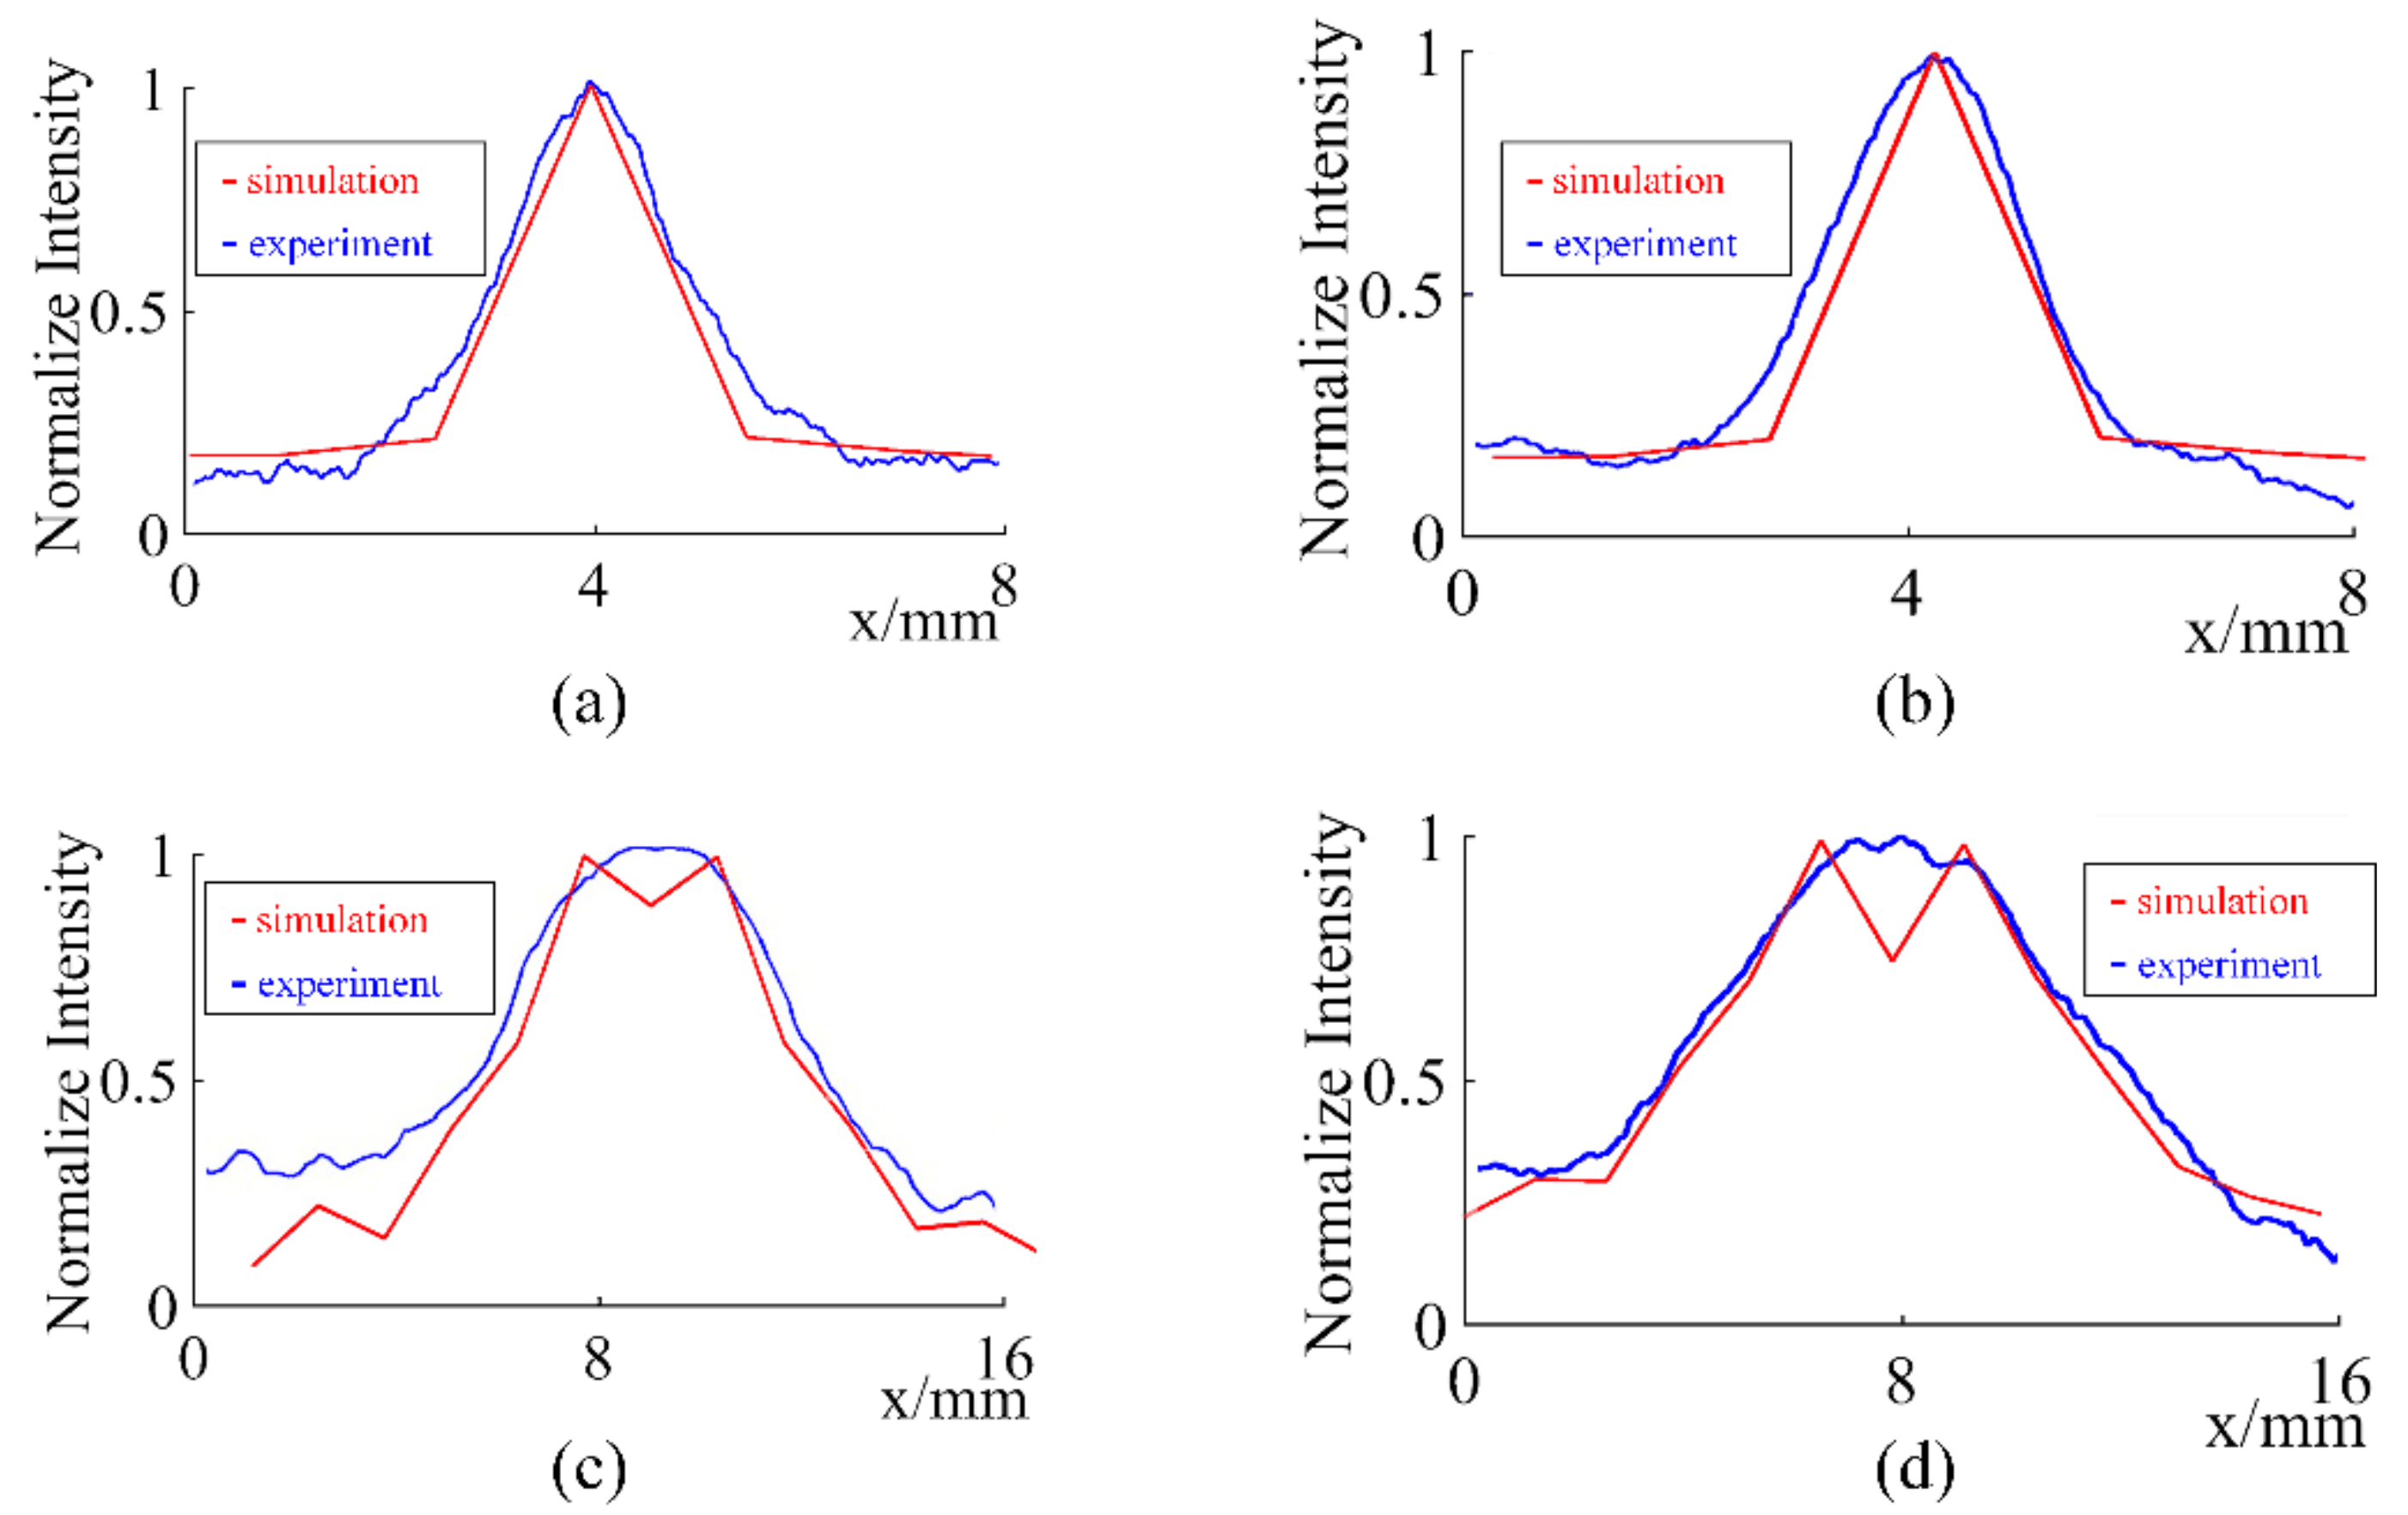
To verify the simulation result, we conduct objective and subjective experiments. First, we adopt a camera set (Canon 600D) at different positions in the viewing plane, each time with a single pixel lightened, to capture the light spot formed at viewing angles from 0° to 20° with a 2° interval in the viewing plane. According to the designed viewing distance of 5 m, the 2° interval means translate the camera about 174 mm along the x0 axis. Each location of the camera is pre-marked in the line, and we just take the camera from one point to another. Subsequently, the FWHM of every spot is calculated from the captured pictures, as shown in Figure 5. We compare the experimental and simulated results at viewing angles of 8° and 16° in Figure 6. It can be concluded that the results are quite in accordance with the simulation results. In addition, as can be seen from the simulation results shown in Figure 2 and the experimental results shown in Figure 5, the difference in spot shape distortion is much less than the difference in FWHM of spots. Thus, we only used the difference of FWHM to evaluate the disparity, which is how the similar factor is defined in Equation (7).
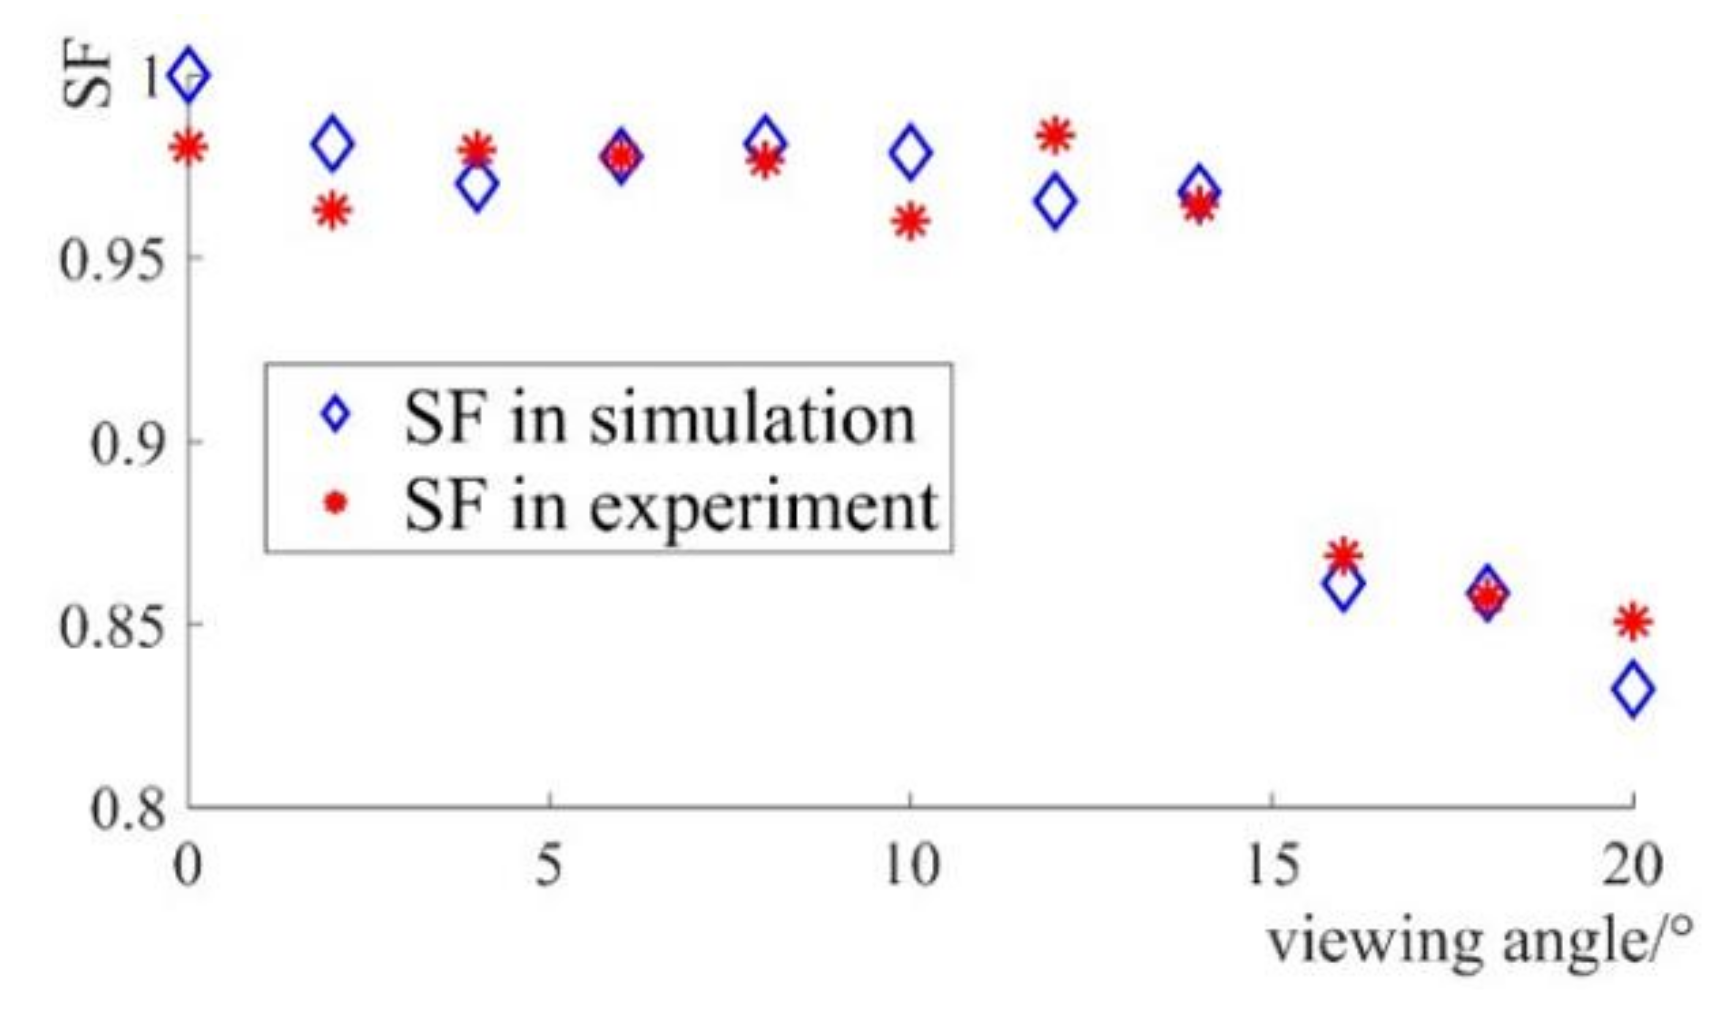
The similar factor values at every viewing angle are calculated and compared with the simulation results, as shown in Figure 7. The maximum deviation of the experimental and simulated similar factor is 0.03, and the average deviation is 0.015, which proves the validity of the simulation method.
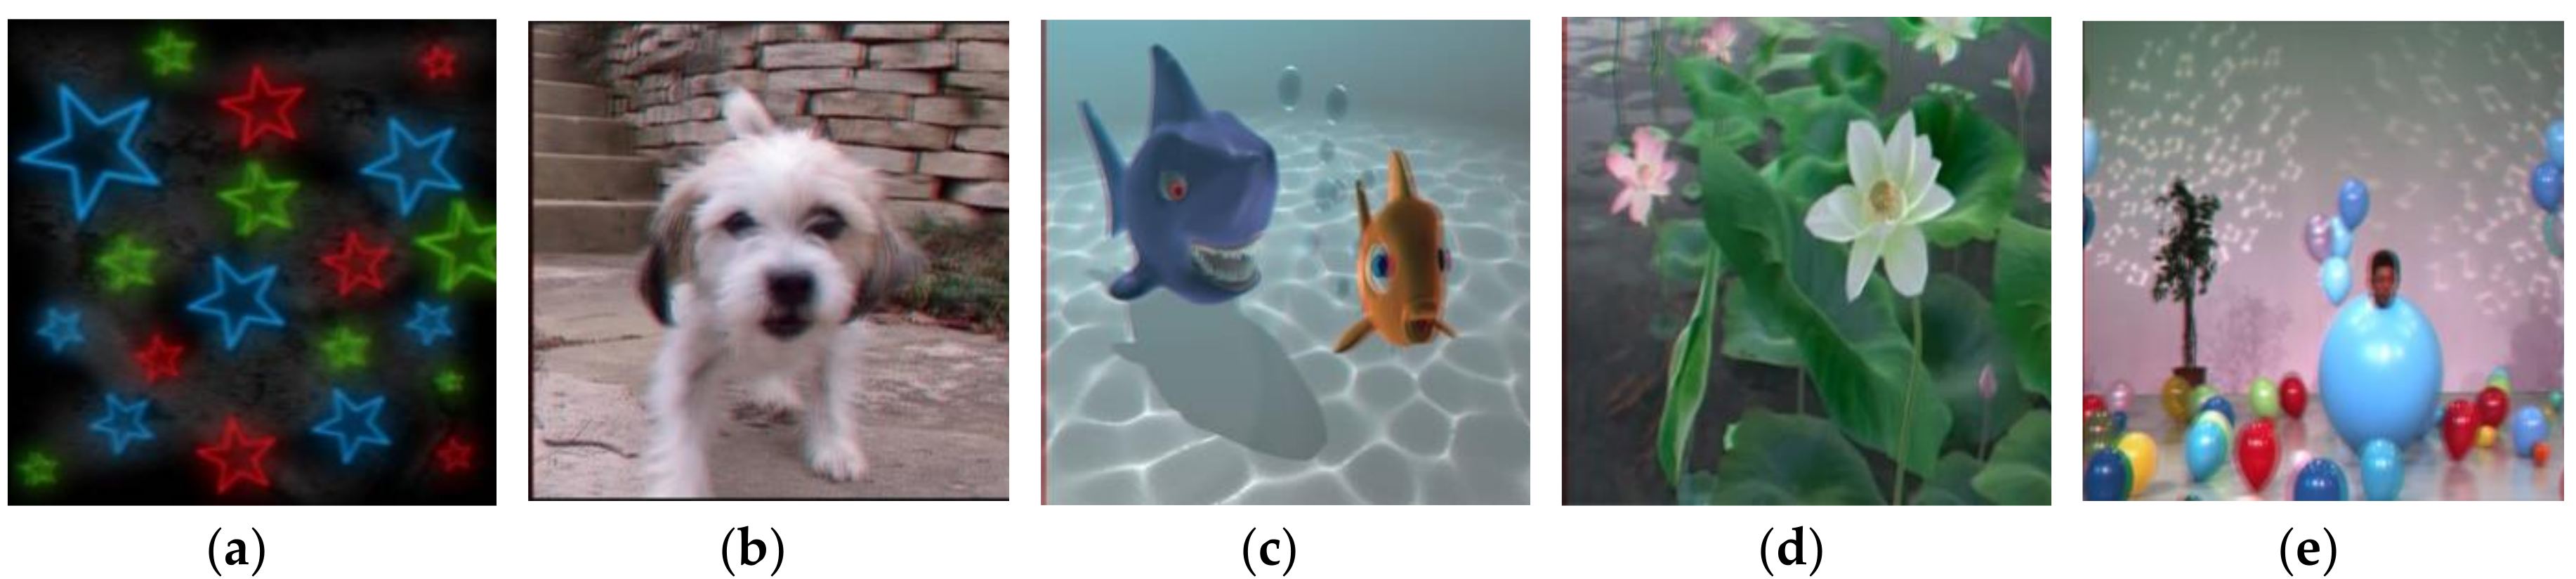
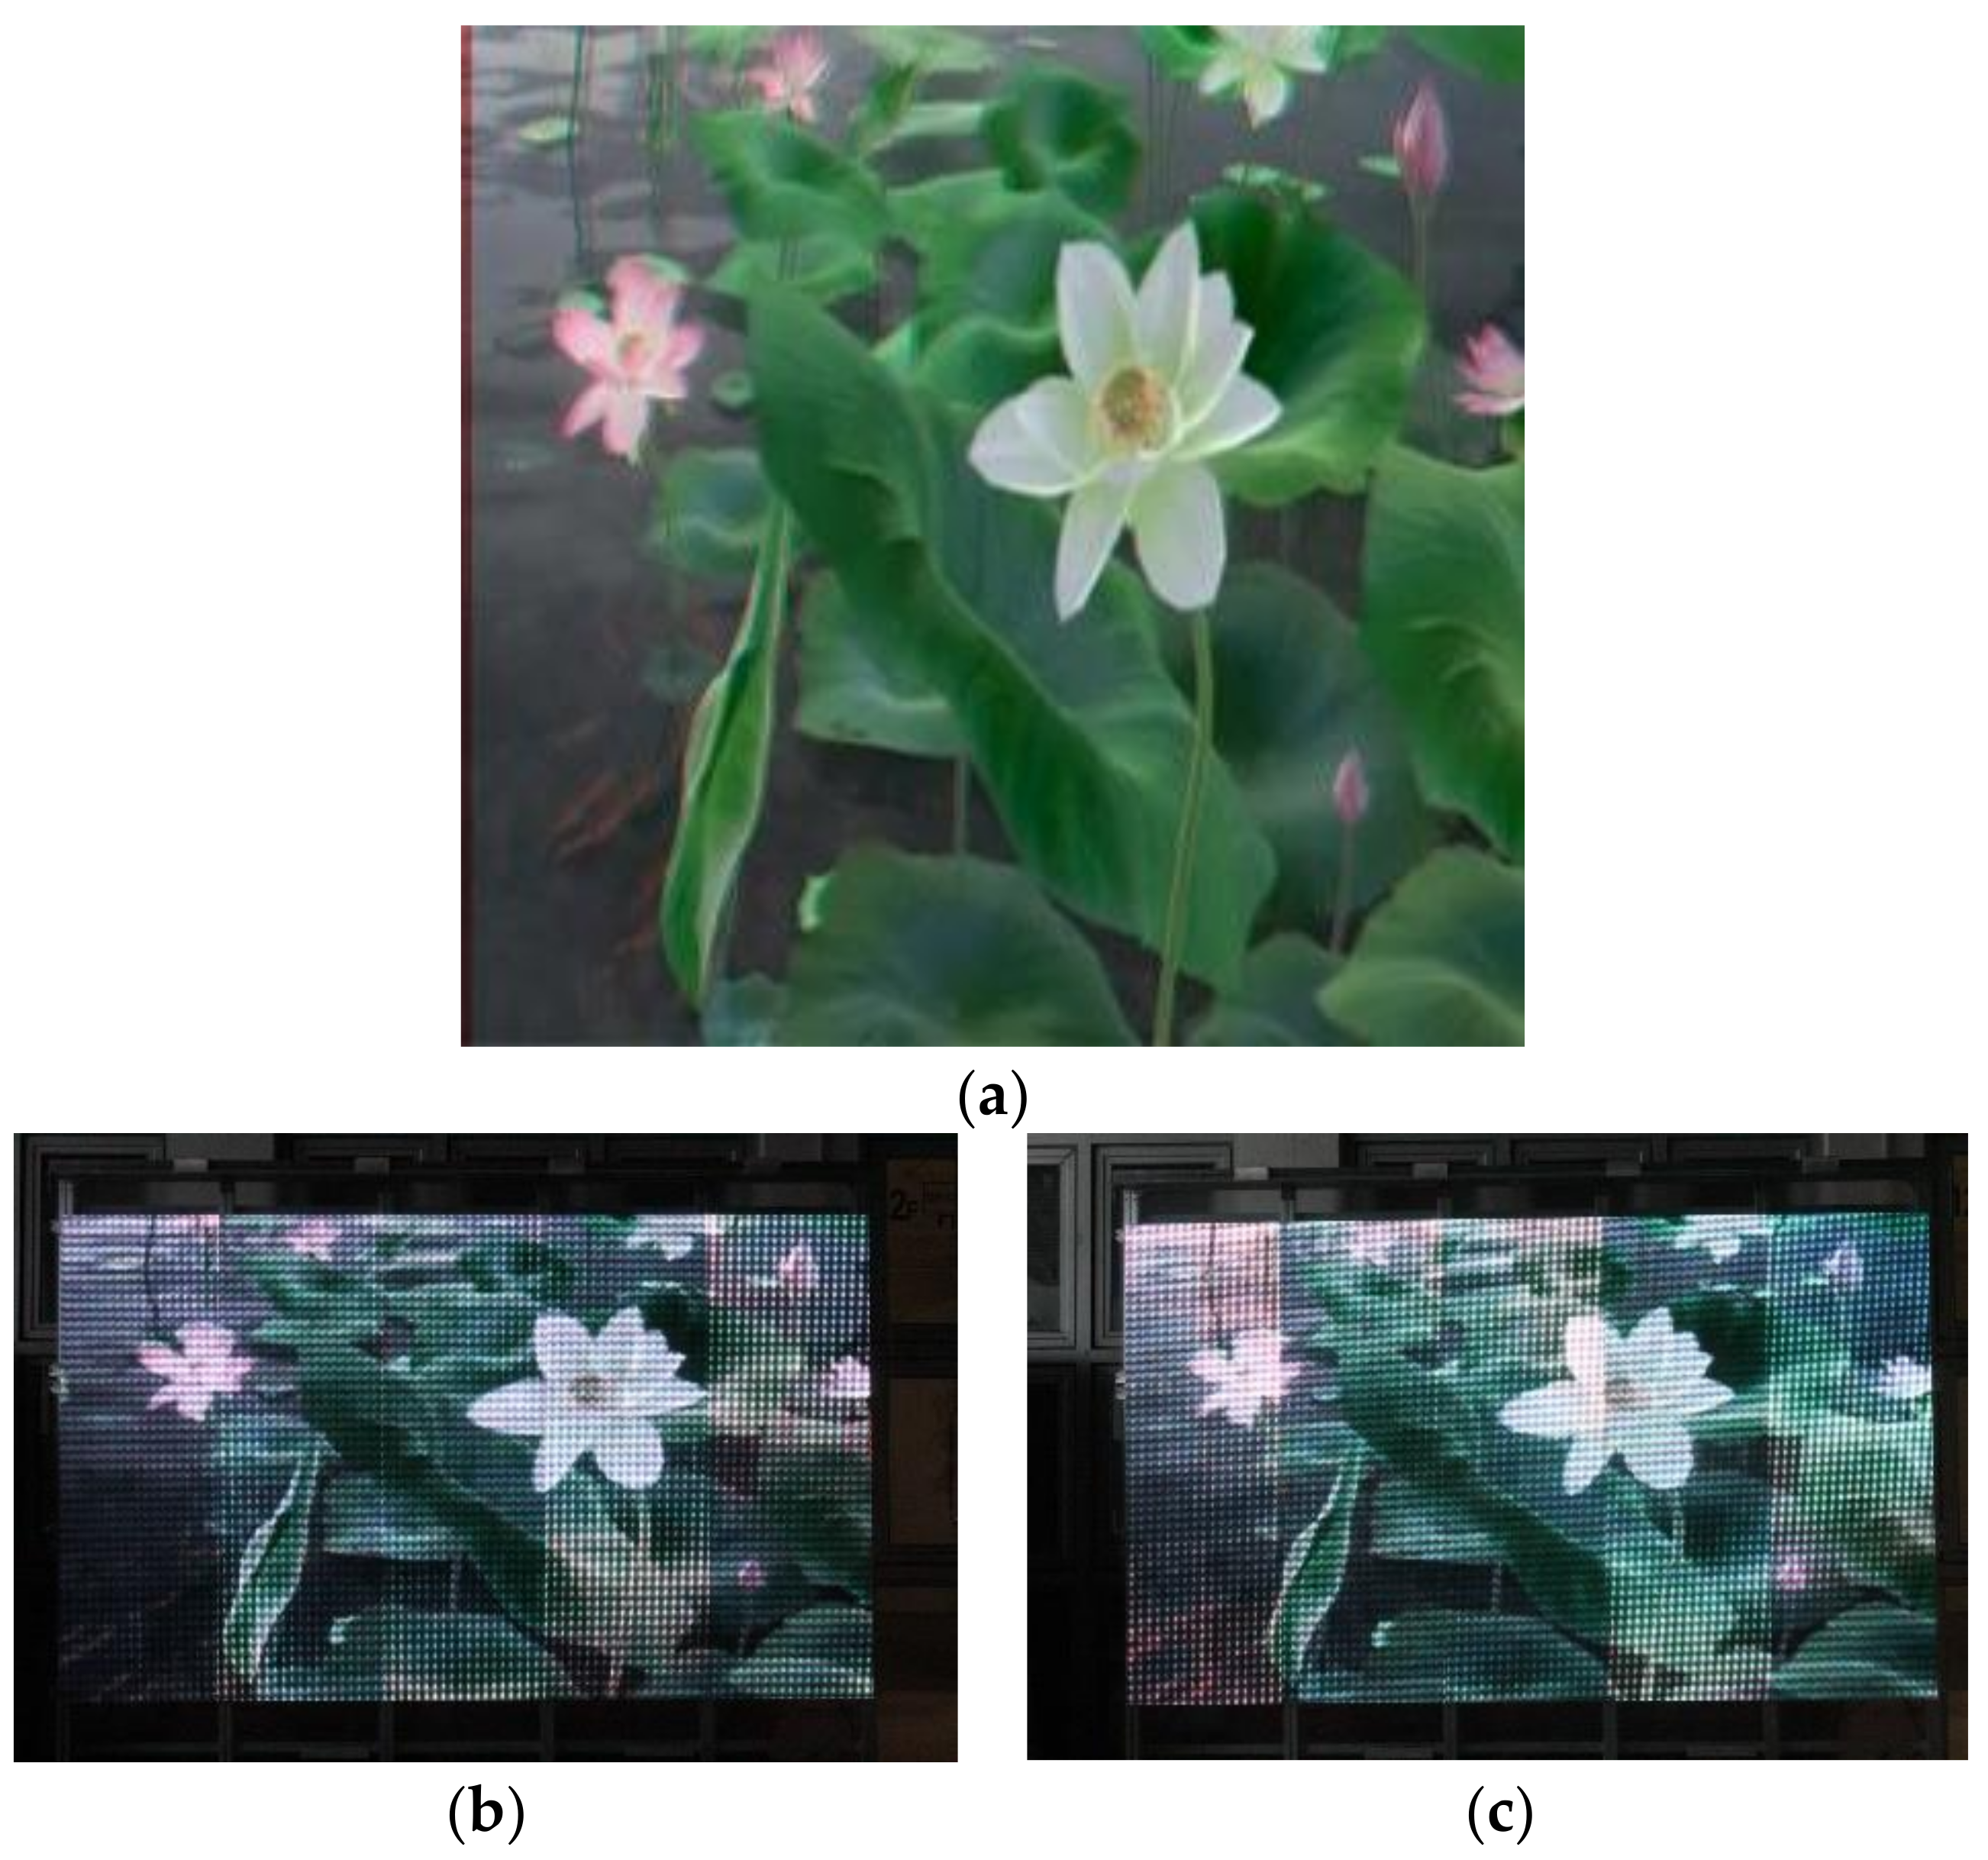
Secondly, a subjective experiment is conducted. Before the experiment, we tested five stereo images shown in Figure 8 by four volunteers. The maximum horizontal disparities of the five stereo images are adjusted to three pixels, which correspond to the maximum SD 1420 mm of the prototype at the viewing distance of 5 m. The farthest 3D point from the display was marked by an indicator, the position of which was decided by the viewer, and the distance from the indicator to the display was measured to be the SD. The average SD value perceived by the four volunteers from the five stereo images shown in Figure 8 are 900 mm, 1000 mm, 710 mm, 1200 mm, and 850 mm, respectively. When loaded the ‘lotus’, the volunteers can experience the largest SDs, the mean value of which is 1200 mm. The reason is that the ‘lotus’ pattern has strong geometrical depth feature of occlusion. Thus, we chose the ‘lotus’ pattern for our subjective experiment.
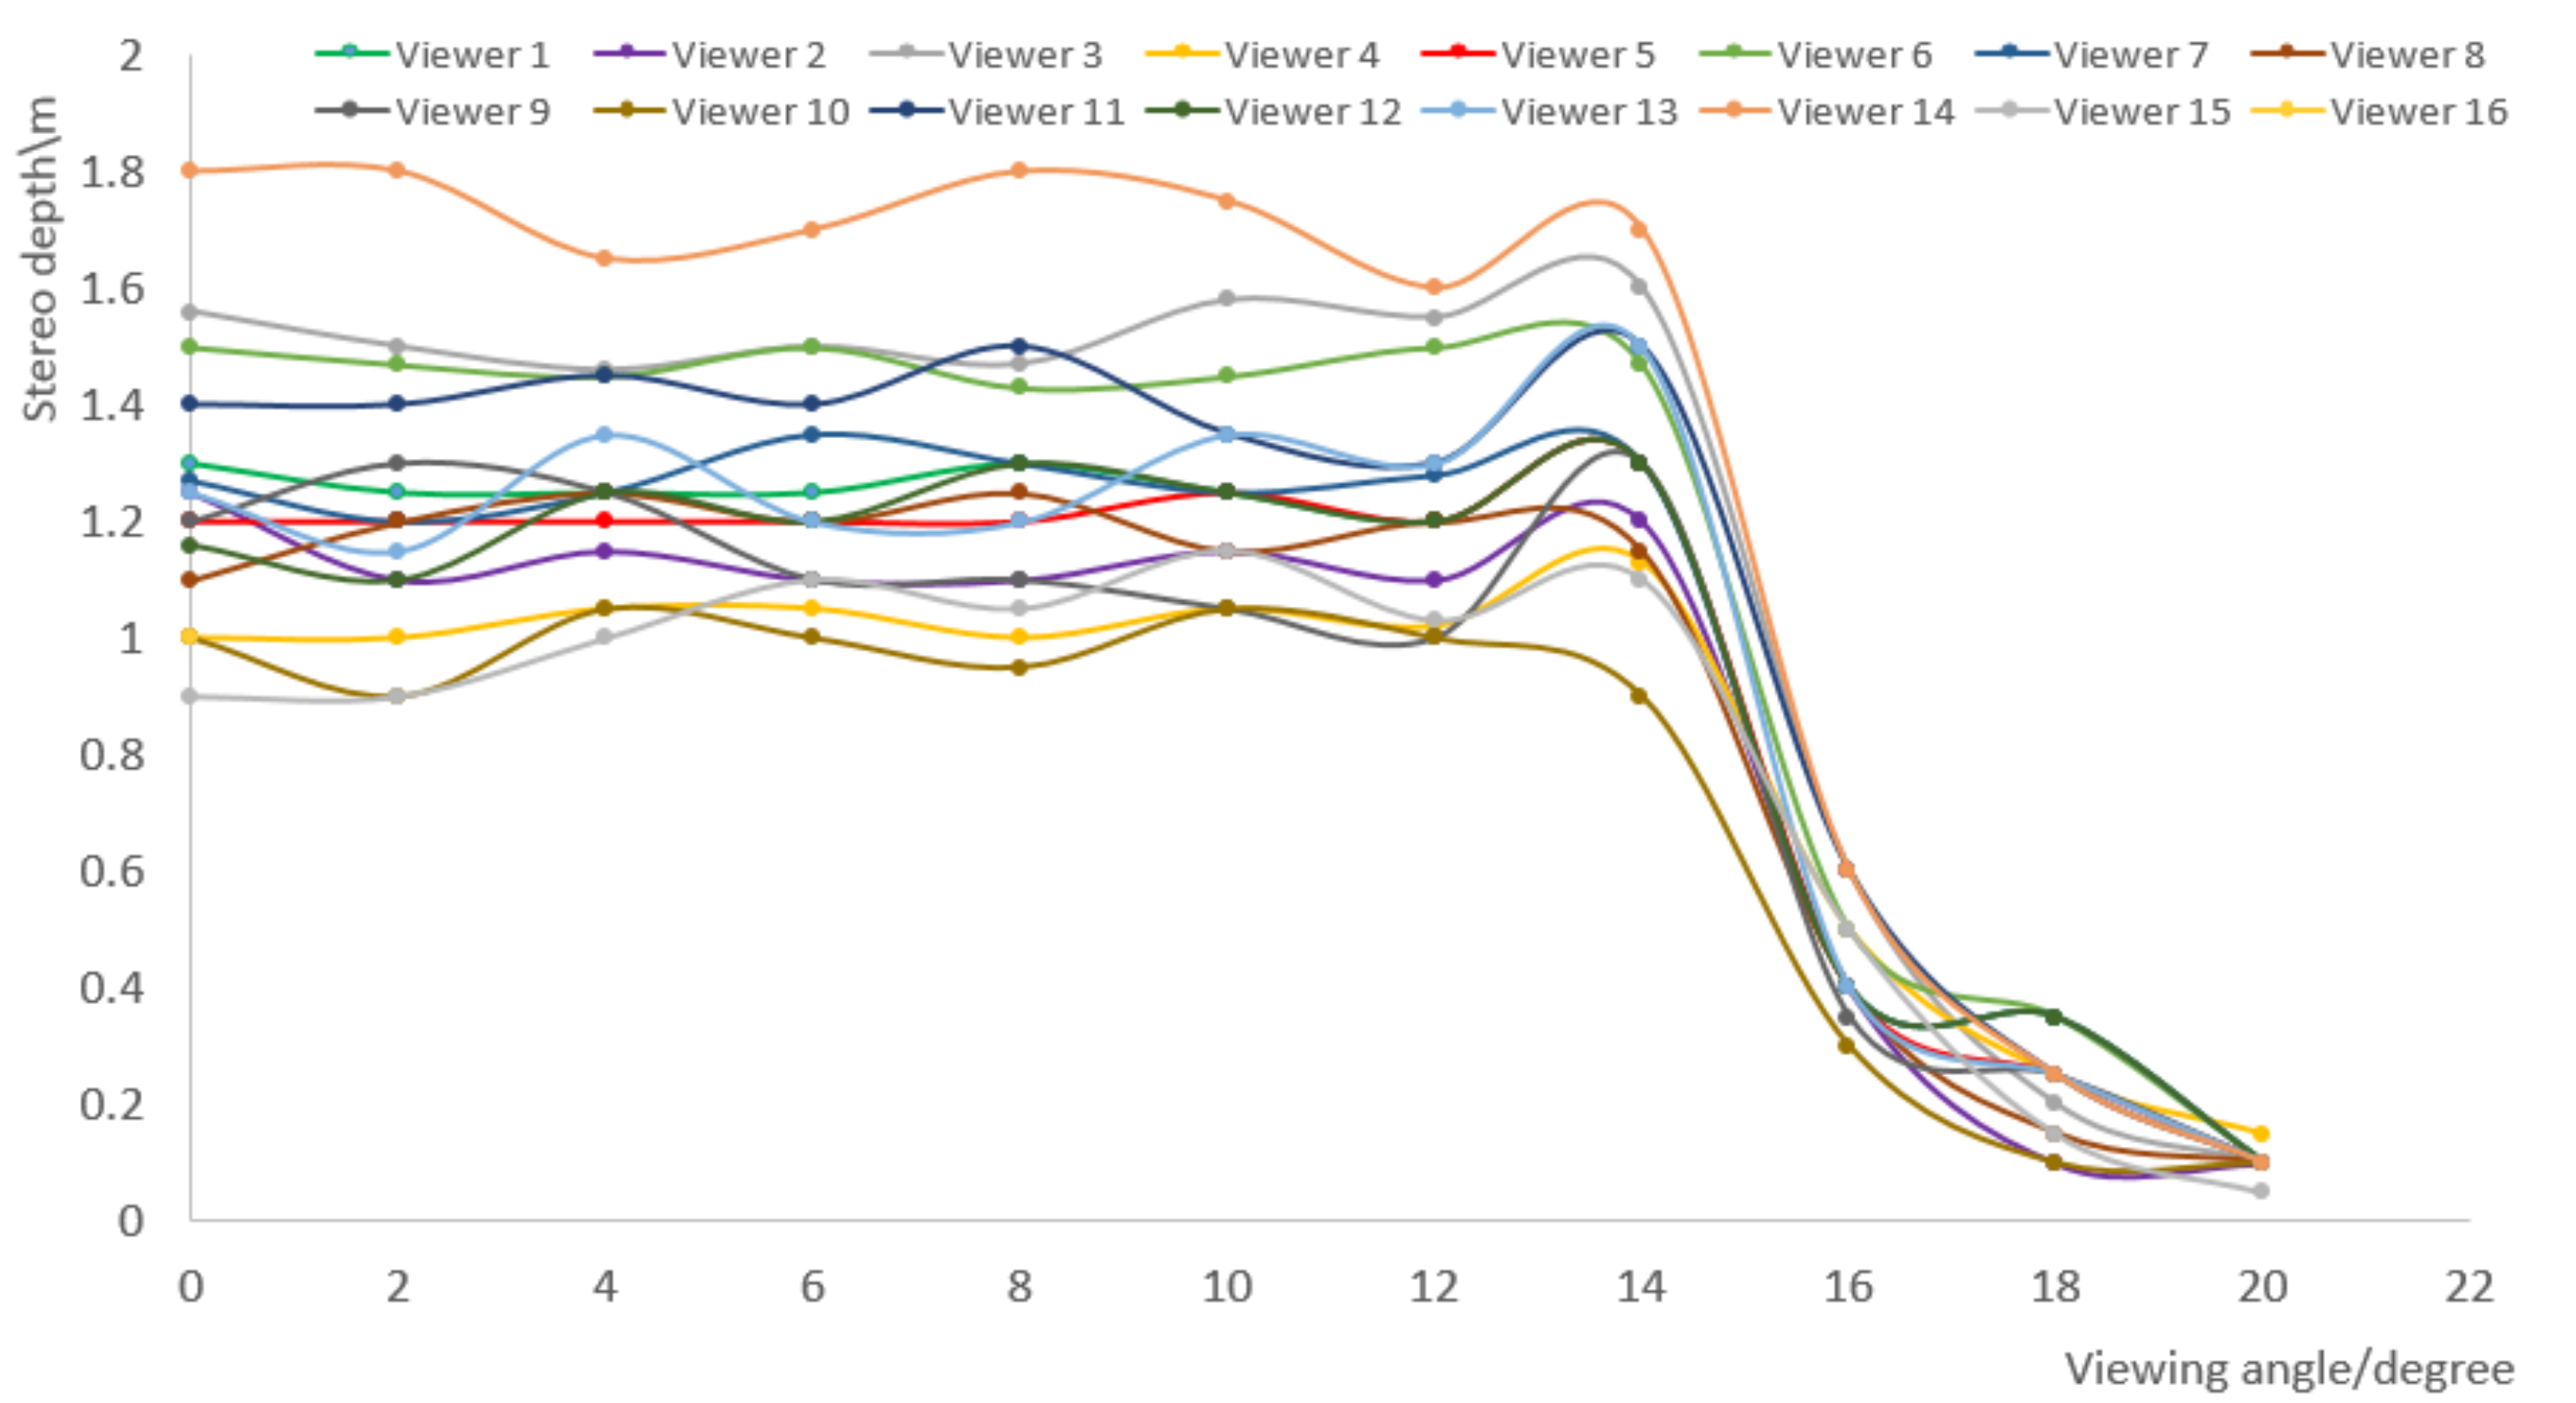
Sixteen viewers of 20 to 25-year-olds moved into different positions along x0 axis as in the simulation part, watching the same stereoscopic picture “lotus” (as shown in Figure 9). The mean value of the interpupillary distances of the volunteers is 64.9 mm and the standard deviation is 1.9 mm. The viewing angles at each position are from 0° to 20° with a 2° interval. The experiment results are shown in Figure 10.
We can conclude from Figure 10 that different viewers have different 3D feelings for the same picture. Viewer 14 has the strongest ability to fuse two images into a 3D picture, while the fuse ability of viewer 9 and viewer 10 is weak. Though the fuse ability is different, the perceived SD of every viewer decreases suddenly when the viewing angle is approximately 16°. In addition, there is almost no 3D effect when the viewing angle is larger than 20°. Although the similar factor becomes larger when the viewing angle is larger than 16°, the lenslet aberration makes the two spots less similar and have larger size, which disturbs the fusion in the brain, thus reducing the perceived SD value. The results of the objective and subjective experiments show that the threshold value of similar factor is around 0.9. The experiment results agree well with the simulation results, which both prove the validity of our binocular model to analyze the influence of lens aberration on the SD.
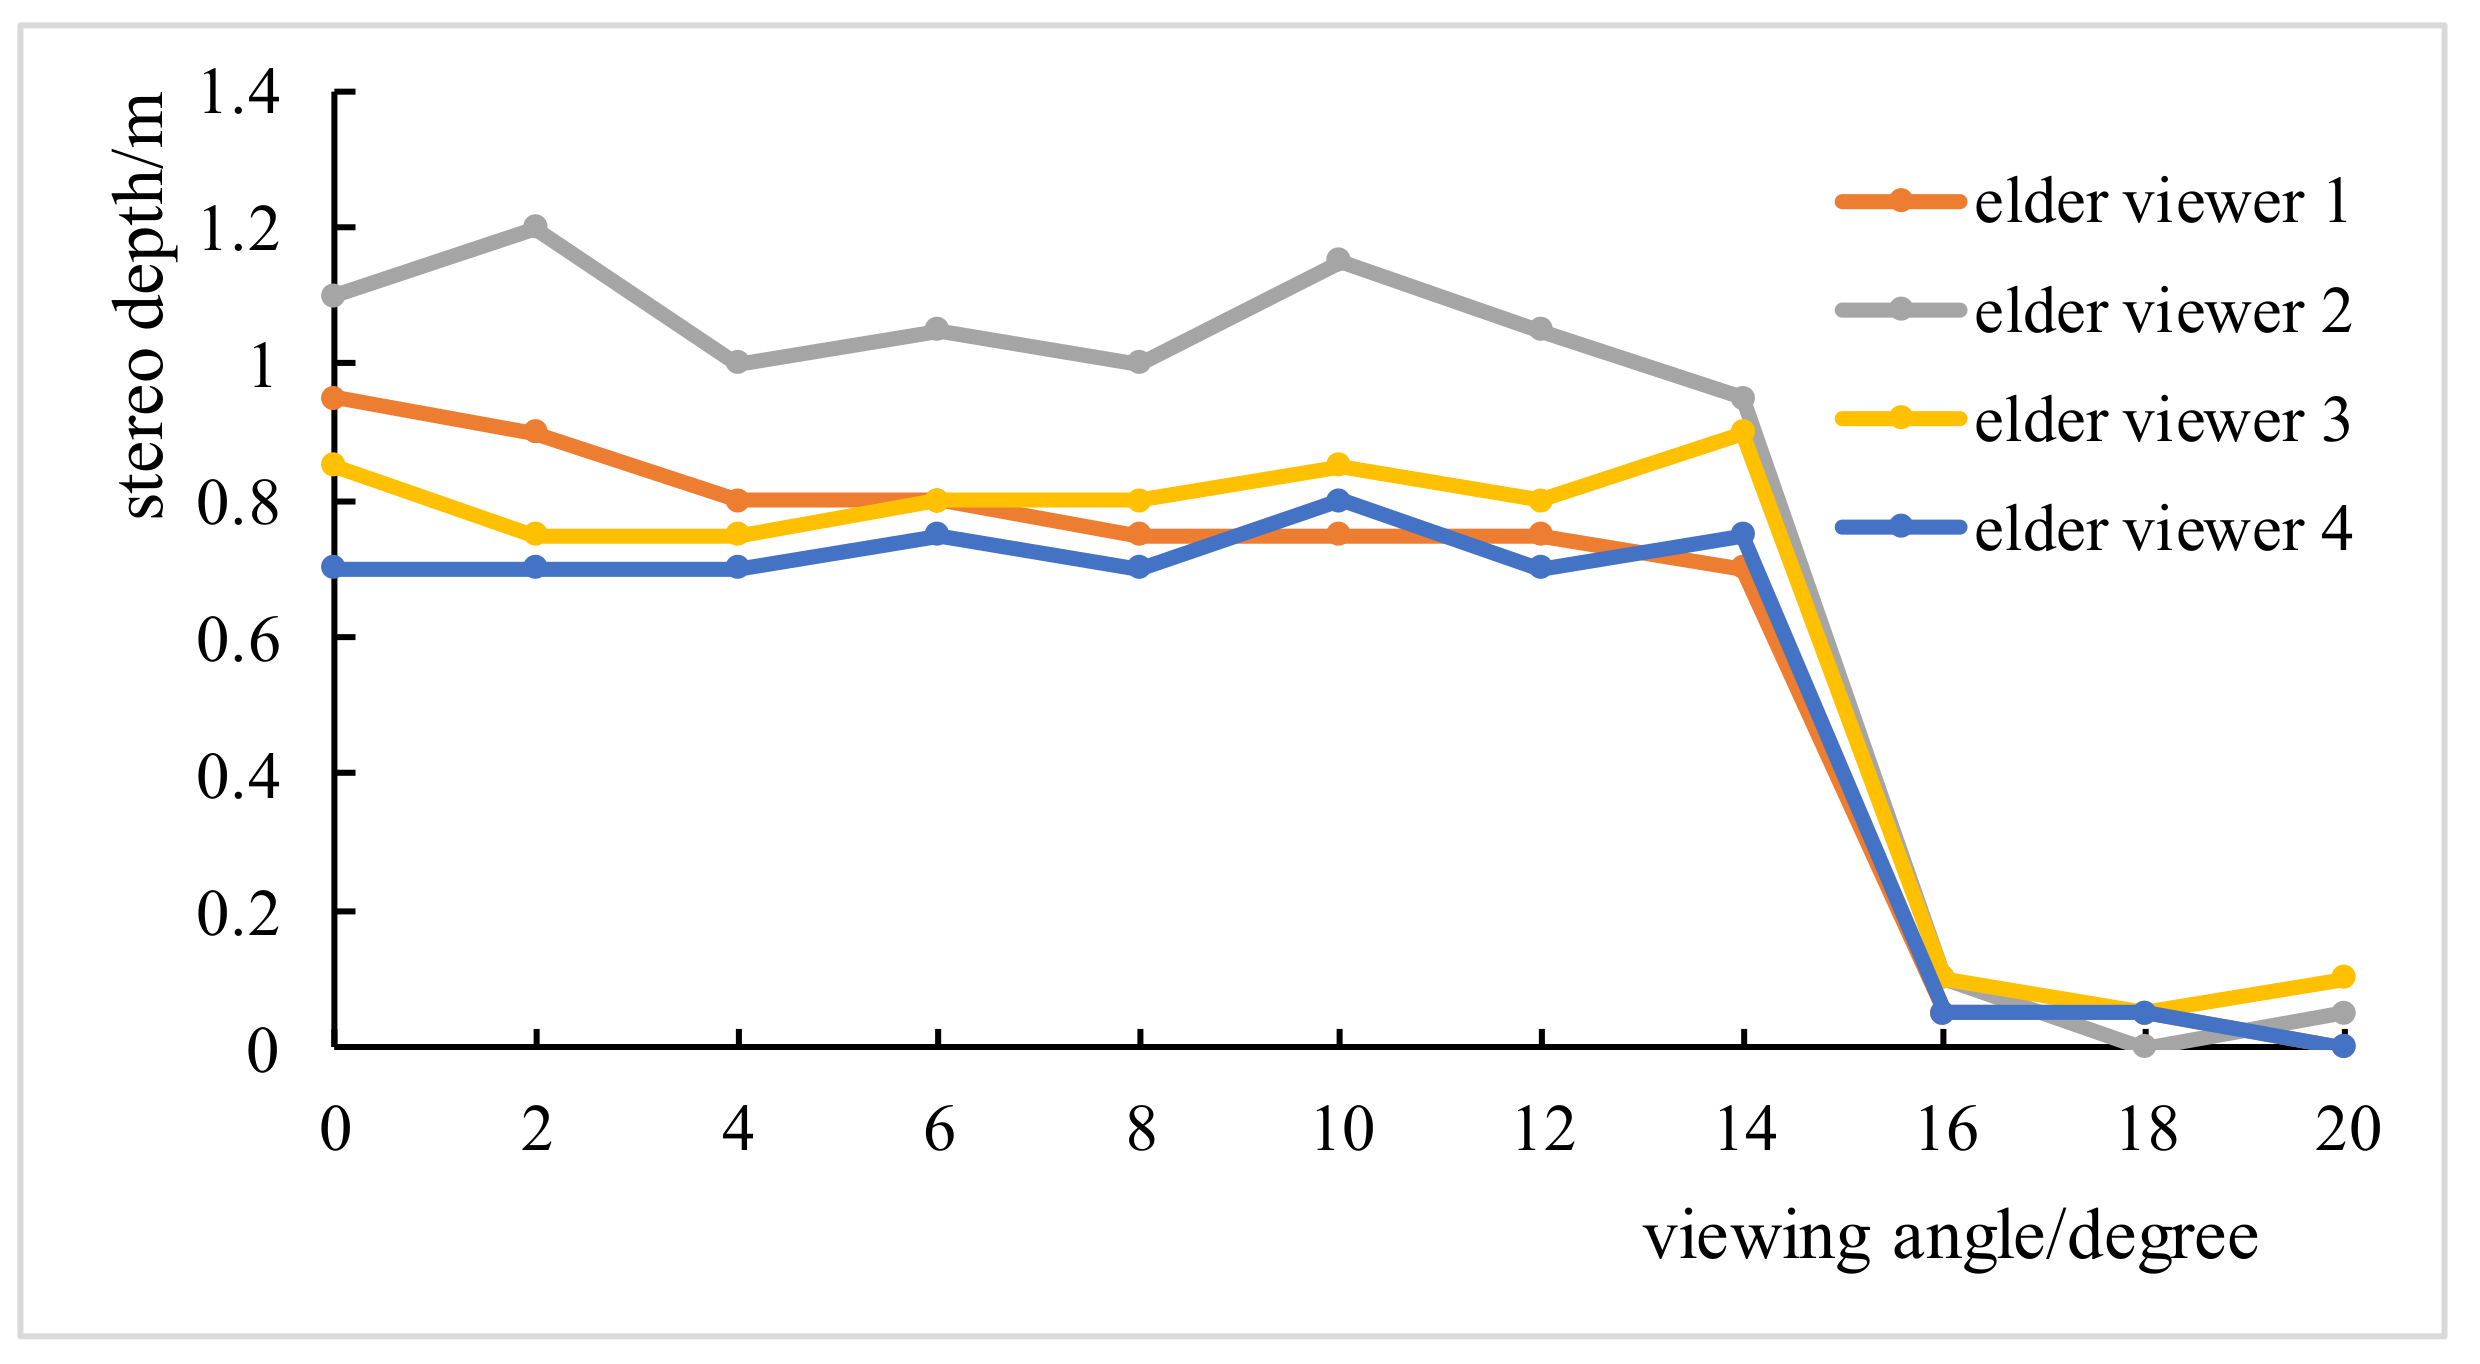
Four elder viewers of 54 to 57-year-olds who claimed they were with presbyopia watched the ‘lotus’ pattern in the same condition as the young viewers. The results are shown in Figure 11. The average perceived SD of elder viewers is about 100 mm lower than the mean perceived SD by the young volunteers. The variation trends of perceived SD to viewing angle is almost the same, particularly the threshold value of similar factors for both the elder and young viewers is around 0.9. It can be concluded that, although the stereovision of elder viewers degrades, the fusion mechanism of elder people is still the same as that of young people.
5. Conclusions and Discussions
The perceived stereo depth of a lenticular based autostereoscopic display system is reduced because of the lens aberration. In this paper, we present a new method based on human vision to evaluate the SD reduction effect caused by lens aberration for lenticular based autostereoscopic display system. Compared to the monocular models, our model simulates the true function of lenslets in autostereoscopic display systems, and the 3D fusion in human vision.
To analyze the effect of lens aberration, we used wave optics theory to set up a binocular model and calculate the sizes of both light spots on the viewing plane formed by the light beams emitted by a pair of pixels and refracted by the corresponding lenslets with aberration. The two receivers on the viewing plane have a distance of 65 mm, which is the human average interpupillary distance, to simulate a viewer’s eyes. Different from previous work, we believe that reduction of stereo depth by lens aberration happens because the images of two homonymy points in the corresponding eyes have large disparity, which makes the brain fail to fuse the points into a 3D point. Therefore, we define a similar factor to evaluate the width difference of the two stereo spots on the viewing plane. We explore the influence of viewing angle on the similar factor by simulation and experiment. It is found that the simulation keeps stable within a certain range and reduce sharply when the viewing angle is larger than 16°, both in simulation and experiment. Finally, we conduct a subjective experiment to verify our theory. All the observers experience a sudden decrease in 3D effect when the viewing angle achieves the break point 16°, which proves our theory.
However, our model is only with monochromatic illumination. That’s because the influence of color on human 3D vision is a very complex mechanism. We cannot simulate the color human 3D vision by our model, which employs a similar factor to simulate the fusion of stereo images. To focus on the lens aberration, we must limit the simulation into a monochromatic situation. For the same reason, we cannot do subjective experiments by using monochromatic stereo images simply extracted from color stereo images.
The research is still of importance for evaluating the parameters and improving the viewing experience of lenticular-based autostereoscopic displays. The largest viewing angle can be calculated according to the proposed model with the specifications of a lenticular-based autostereoscopic display. Optimization of the lens shape by minimizing the lens aberration at large viewing angles can improve the similar factor and expand the viewing angles accordingly, although the result cannot be predicted.
Author Contributions
J.M. provided conceptualization and resources. P.S. was the supervisor providing fundings and administrating the project, and she wrote the original draft and did the formal analysis. S.A. did the investigation, methodology and the validation, wrote the software. N.C. did the formal analysis and reviewed and edited the manuscript.
Funding
This work was supported by Basic Research Program of Shenzhen (JCYJ20170412171744267, JCYJ20160428182212366) and National Basic Research Program of China (2015AA043302). Ping Su also appreciates the State Scholarship Fund (201808440080) from China Scholarship Council. The APC was funded by JCYJ20160428182212366.
Acknowledgments
The authors thanked Xinnan Wang and Yuming Song for conducting the subjective experiment by elder volunteers and edited some pictures.
Conflicts of Interest
The authors declare no conflict of interest.
References
- Hong, J.; Kim, Y.; Choi, H.-J.; Hahn, J.; Park, J.-H.; Kim, H.; Min, S.-W.; Chen, N.; Lee, B. Three-dimensional display technologies of recent interest: Principles, status, and issues. Appl. Opt. 2011, 50, H87–H115. [Google Scholar] [CrossRef] [PubMed]
- Park, S.-G.; Yeom, J.; Jeong, Y.; Chen, N.; Hong, J.-Y.; Lee, B. Recent issues on integral imaging and its applications. J. Inf. Disp. 2014, 15, 37–46. [Google Scholar] [CrossRef]
- Geng, J. Three-dimensional display technologies. Adv. Opt. Photonics 2013, 5, 456–535. [Google Scholar] [CrossRef] [PubMed]
- Zhao, W.; Wang, Q.; Wang, A.; Li, D. Autostereoscopic display based on two-layer lenticular lenses. Opt. Lett. 2010, 35, 4127–4129. [Google Scholar] [CrossRef] [PubMed]
- Algorri, J.; Urruchi, V.; García-Cámara, B.; Sánchez-Pena, J. Liquid crystal microlenses for autostereoscopic displays. Materials 2016, 9, 36. [Google Scholar] [CrossRef] [PubMed]
- Su, P.; An, P.; Ma, J.; Han, L.; Ren, Z.; Mao, J.; Cao, L.; Jin, G. Demonstration of an autostereoscopic three-dimensional light-emitting diode display using diffractive optical elements sheet. J. Disp. Technol. 2015, 11, 953–958. [Google Scholar] [CrossRef]
- Krol, J.; van de Grind, W. Rehabilitation of a classical notion of Panum’s fusional area. Perception 1982, 11, 615–619. [Google Scholar] [CrossRef]
- Li, X.; Wang, Q.; Li, D.; Wang, Q. Research on relation between the range of binocular parallax and visual fatigue in 3D display based on lenticulation lens. J. Optoelectron. Laser 2012, 23, 873–877. [Google Scholar]
- Urvoy, M.; Barkowsky, M.; le Callet, P. How visual fatigue and discomfort impact 3D-TV quality of experience: A comprehensive review of technological, psychophysical, and psychological factors. Ann. Telecommun.-Ann. Des Télécommun. 2013, 68, 641–655. [Google Scholar] [CrossRef]
- De Silva, V.; Fernando, A.; Worrall, S.; Arachchi, H.K.; Kondoz, A. Sensitivity analysis of the human visual system for depth cues in stereoscopic 3-D displays. IEEE Trans. Multimed. 2011, 13, 498–506. [Google Scholar] [CrossRef]
- Huang, K.C.; Yuan, J.-C.; Tsai, C.-H.; Hsueh, W.-J.; Wang, N.-Y. How crosstalk affects stereopsis in stereoscopic displays. In Proceedings of the SPIE, Stereoscopic Displays and Virtual Reality Systems X, Santa Clara, CA, USA, 30 May 2003; Volume 5006. [Google Scholar]
- Hanhart, P.; di Nolfo, C.; Ebrahimi, T. Active crosstalk reduction system for multiview autostereoscopic displays. In Proceedings of the 2015 IEEE International Conference on Multimedia and Expo (ICME)(IEEE2015), Turin, Italy, 29 June–3 July 2015; pp. 1–6. [Google Scholar]
- Peng, Y.; Li, H.; Zheng, Z.; Xia, X.; Yao, Z.; Liu, X. Crosstalk evaluation in multiview autostereoscopic three-dimensional displays with an optimized diaphragm applied. J. Inf. Disp. 2012, 13, 83–89. [Google Scholar] [CrossRef]
- Tsirlin, I.; Wilcox, L.M.; Allison, R.S. Effect of crosstalk on depth magnitude in thin structures. J. Electron. Imaging 2012, 21, 011003. [Google Scholar] [CrossRef] [Green Version]
- Lee, C.; Seo, G.; Lee, J.; Han, T.H.; Park, J.G. Auto-stereoscopic 3D displays with reduced crosstalk. Opt. Express 2011, 19, 24762–24774. [Google Scholar] [CrossRef] [PubMed]
- Yu, X.; Sang, X.; Chen, D.; Wang, P.; Gao, X.; Zhao, T.; Yan, B.; Yu, C.; Xu, D.; Dou, W. Autostereoscopic three-dimensional display with high dense views and the narrow structure pitch. Chin. Opt. Lett. 2014, 12, 060008. [Google Scholar]
- Luo, C.; Xiao, X.; Martínez-Corral, M.; Chen, C.; Javidi, B.; Wang, Q. Analysis of the depth of field of integral imaging displays based on wave optics. Opt. Express 2013, 21, 31263–31273. [Google Scholar] [CrossRef] [PubMed] [Green Version]
- Gao, X.; Sang, X.; Yu, X.; Chen, D.; Chen, Z.; Zhang, W.; Yan, B.; Yuan, J.; Wang, K.; Yu, C. Display depth analyses with the wave aberration for the auto-stereoscopic 3D display. Opt. Commun. 2016, 370, 68–74. [Google Scholar] [CrossRef]
- Del Pozo, V.U.; Genaro, J.A.; Sánchez-Pena, J.; Geday, M.A.; Arregui, X.Q.; Bennis, N. Lenticular arrays based on liquid crystals. Opto-Electron. Rev. 2012, 20, 260–266. [Google Scholar] [Green Version]
- Algorri, J.; del Pozo, V.U.; Sánchez-Pena, J.; Otón, J. An autostereoscopic device for mobile applications based on a liquid crystal microlens array and an OLED display. J. Disp. Technol. 2014, 10, 713–720. [Google Scholar] [CrossRef]
- Algorri, J.; del Pozo, V.U.; Bennis, N.; Sánchez-Pena, J.; Otón, J. Cylindrical liquid crystal microlens array with rotary optical power and tunable focal length. IEEE Electron Device Lett. 2015, 36, 582–584. [Google Scholar] [CrossRef]
- Kim, C.; Kim, J.; Shin, D.; Lee, J.; Koo, G.; Won, Y.H. Electrowetting lenticular lens for a multi-view autostereoscopic 3D display. IEEE Photonics Technol. Lett. 2016, 28, 2479–2482. [Google Scholar] [CrossRef]
- Goodman, J. Introduction to Fourier Optics, 2nd ed.; McGraw-Hill: New York, NY, USA, 1968. [Google Scholar]
- Takada, A.; Shibuya, M.; Saitoh, T.; Nishikata, A.; Maehara, K.; Nakadate, S. Incoming inclination factor for scalar imaging theory. Opt. Eng. 2010, 49. [Google Scholar] [CrossRef]
- Quant, J.; Woo, G. Normal values of eye position in the Chinese population of Hong Kong. Optom. Vis. Sci. 1992, 69, 152–158. [Google Scholar] [CrossRef] [PubMed]
Figure 1.
(a) A typical autostereoscopic display system using lenticular sheet; (b) the display panel plane; and (c) the lenticular sheet plane.
Figure 1.
(a) A typical autostereoscopic display system using lenticular sheet; (b) the display panel plane; and (c) the lenticular sheet plane.

Figure 2.
Simulated eye images (a–f), of spots and horizontal cross section of spot intensity distributions at viewing angles of 0°, 4°, 8°, 12°, 16°, and 20°.
Figure 2.
Simulated eye images (a–f), of spots and horizontal cross section of spot intensity distributions at viewing angles of 0°, 4°, 8°, 12°, 16°, and 20°.

Figure 3.
The relationship between viewing angle and spot sizes in simulation.

Figure 4.
Similar factors at different viewing angles in simulation.

Figure 5.
Experimental horizontal cross-section of spots intensity distributions (a–f) viewing angles of 0°, 4°, 8°, 12°, 16°, and 20°. Red: Left eye; and blue: Right eye.
Figure 5.
Experimental horizontal cross-section of spots intensity distributions (a–f) viewing angles of 0°, 4°, 8°, 12°, 16°, and 20°. Red: Left eye; and blue: Right eye.

Figure 6.
Comparison of simulated (red) and experimental (blue) left (a,c) and right (b,d) horizontal cross-section of spots intensity distributions at viewing angles of 8° and 16°. Red: Simulation; and blue: Experiment.
Figure 6.
Comparison of simulated (red) and experimental (blue) left (a,c) and right (b,d) horizontal cross-section of spots intensity distributions at viewing angles of 8° and 16°. Red: Simulation; and blue: Experiment.

Figure 7.
Comparison of similar factors by simulation and experiment.

Figure 8.
The tested five stereo images: (a) ‘stars’; (b) ‘dog’; (c) ‘fish’; (d) ‘lotus’; (e) ‘balloons’.
Figure 8.
The tested five stereo images: (a) ‘stars’; (b) ‘dog’; (c) ‘fish’; (d) ‘lotus’; (e) ‘balloons’.

Figure 9.
(a) The original stereo anaglyph of “lotus”; the left (b) and right (c) stereo image displayed on the prototype.
Figure 9.
(a) The original stereo anaglyph of “lotus”; the left (b) and right (c) stereo image displayed on the prototype.

Figure 10.
Perceived stereo depth of “lotus” on the prototype at different viewing angle by different viewers.
Figure 10.
Perceived stereo depth of “lotus” on the prototype at different viewing angle by different viewers.

Figure 11.
Perceived stereo depth of “lotus” on the prototype at different viewing angle by 4 different elder viewers.
Figure 11.
Perceived stereo depth of “lotus” on the prototype at different viewing angle by 4 different elder viewers.


Table 1.
Specifications of the autostereoscopic display prototype.
| Parameters | Value |
|---|---|
| Viewing Distance (D) | 5000 mm |
| Pixel Pitch (t) | 2.5 mm |
| Lens Aperture (s) | 2 mm |
| Focal Length (f) | 38.46 mm |
| Number of views | 4 |
| 3D Resolution | 288 × 300 |
| Size | 2400 mm × 1440 mm |
© 2019 by the authors. Licensee MDPI, Basel, Switzerland. This article is an open access article distributed under the terms and conditions of the Creative Commons Attribution (CC BY) license (http://creativecommons.org/licenses/by/4.0/).
Share and Cite
MDPI and ACS Style
Su, P.; An, S.; Ma, J.; Chen, N. Study on the Reduction Effect of Stereo Depth Caused by Lens Aberration in Lenticular-Based Autostereoscopic Displays. Appl. Sci. 2019, 9, 380. https://doi.org/10.3390/app9030380
AMA Style
Su P, An S, Ma J, Chen N. Study on the Reduction Effect of Stereo Depth Caused by Lens Aberration in Lenticular-Based Autostereoscopic Displays. Applied Sciences. 2019; 9(3):380. https://doi.org/10.3390/app9030380
Chicago/Turabian StyleSu, Ping, Shu An, Jianshe Ma, and Ni Chen. 2019. "Study on the Reduction Effect of Stereo Depth Caused by Lens Aberration in Lenticular-Based Autostereoscopic Displays" Applied Sciences 9, no. 3: 380. https://doi.org/10.3390/app9030380
Note that from the first issue of 2016, this journal uses article numbers instead of page numbers. See further details here.