Small Infrared Target Detection via a Mexican-Hat Distribution


College of Computer Science and Technology, Harbin Engineering University, Harbin 150001, China
*
Author to whom correspondence should be addressed.
Appl. Sci. 2019, 9(24), 5570; https://doi.org/10.3390/app9245570
Submission received: 27 November 2019
/
Revised: 10 December 2019
/
Accepted: 13 December 2019
/
Published: 17 December 2019
Abstract
:Although infrared small target detection has been broadly used in airborne early warning, infrared guidance, surveillance and tracking, it is still an open issue due to the low signal-to-noise ratio, less texture information, background clutters, and so on. Aiming to detect a small target in an infrared image with complex background clutters, this paper carefully studies the characteristics of a target in an IR image filtered by the difference of Gaussian filter, concluding that the intensity of the adjacent region around a small infrared target roughly has a Mexican-hat distribution. Based on such a conclusion, a raw infrared image is sequentially processed with the modified top-hat transformation and the difference of Gaussian filter. Then, the adjacent region around each pixel in the processed image is radially divided into three sub-regions. Next, the pixels that distribute as the Mexican-hat are determined as the candidates of targets. Finally, a real small target is segmented out by locating the pixel with the maximum intensity. Our experimental results on both real-world and synthetic infrared images show that the proposed method is so effective in enhancing small targets that target detection gets very easy. Our method achieves true detection rates of 0.9900 and 0.9688 for sequence 1 and sequence 2, respectively, and the false detection rates of 0.0100 and 0 for those two sequences, which are superior over both conventional detectors and state-of-the-art detectors. Moreover, our method runs at 1.8527 and 0.8690 s per frame for sequence 1 and sequence 2, respectively, which is faster than RLCM, LIG, Max–Median, Max–Mean.
1. Introduction
Small infrared (IR) target detection has been widely used in airborne early warning, IR guidance, surveillance and tracking, and others. Usually, the earlier we detect a small IR target, the more time we get for dealing with it, and thus the more suitable decision can be made. However, factors such as low signal-to-noise ratio (SNR), variable target sizes, variable target intensity, less shape and texture information, blurred edges, and serious background clutters, cause small IR target detection to be a challenging task.
So far, many IR target detection algorithms have been developed ranging from recursive estimation techniques [1] to partial sum of the tensor nuclear norm [2]. Among them, morphology filtering such as the top-hat transform and its variants plays an important role [3,4]. Top-hat transforms are also combined with other techniques such as genetic algorithm [5] to improve the detection performance. Though these methods can detect targets to a certain degree, their performance is greatly degraded under complex background clutters.
Over the last few years, it is widely shared that algorithms derived from visual attention mechanics work well for detecting a small target. The early work in 1998 made intellectuals pour attention into visual attention distribution [6], and then saliency estimation methods corresponding to visual attention became popular in small IR target detection [7]. Wang et al. are the early researchers to use the Difference of Gaussian (DoG) filters to get a saliency map for detecting real targets [8]. However, due to problems like signal interference, a small target does not strictly obey the 2D Gaussian distribution, and thus cannot be successfully detected by merely adopting DoG filters. Further studies on visual attention focus on the relationship between a target and its neighborhoods. The local contrast method [9,10], the multiscale patch-based contrast measure [11], weighted local difference measure [12], human visual mechanism detectors [13,14], variance difference detector [15], entropy-based contrast measure [16], weighted local contrast detector [17], local intensity and gradient detector [18], visual saliency guided detector [19], local difference adaptive measure [20], the adaptive local measurement contrast, and salient region extraction and gradient vector processing [21] are reported successively, demonstrating that the contrast between a target and its neighbor is helpful for small IR target detection.
Though many improved algorithms have been reported, it is still challenging to detect a small IR target in images with low SNR, low contrast, and serious background clutters. This paper presents an effective detection method based on the Mexican-hat distribution. A raw IR image is first processed by the modified top-hat transformation [22] and the DoG filter, getting a filtered IR image. Then, the adjacent region around a pixel of the filtered image is radially divided into three sub-regions. Next, the pixels whose adjacent regions have the Mexican-hat distribution are determined as candidate targets. Finally, a small target is segmented out by locating the brightest pixel. Experimental results show that the adoption of the Mexican-hat distribution benefits our method with higher detection rate, lower false alarm rate, and faster detection speed than existing detectors. Though the existing detector in [15] is resemble to our method, it performs on raw IR images and only compares the relationship between two regions. On contrast, we operate on the filtered image and detect an IR target based on the Mexican-hat distribution, and our experimental results show that such strategy can effectively enhance the small IR target and improve the detection rate.
The rest of the paper is organized as follows. Section 2 analyzes the characteristics of the adjacent region of a target in a DoG-filtered image. Section 3 describes the details of the proposed method. Section 4 presents experimental results along with some analysis. Finally, Section 5 gives some conclusions.
2. Mexican-Hat Distribution of the Adjacent Region around an IR Target
Let I(x, y) be an image. Then its DoG-filtered image, , is formed by (1) [23]:
where and are the standard deviations of the two Gaussian kernels, ‘*’ is the convolution operation given by (2).
After careful observation, we find the pixel intensity of the adjacent region around an IR target shows a regular bright-dark-bright pattern along the radial direction. Specifically, Figure 1 illustrates such bright-dark-bright pattern. The center pixel of a target patch is the brightest, and then the intensity decreases gradually along the radial direction until reaching the lowest value. After that, the intensity increases again. As shown in Figure 1c, the profile of such bright-dark-bright pattern is like a Mexican hat, and thus we call it Mexican-hat distribution in this paper.
Based on the above observations, we propose to detect small targets in IR images via the Mexican-hat distribution. As shown in Figure 2, we first divide the adjacent region of a small target into three sub-regions along the radial direction that are respectively termed as , , and . For a small target positioned at (r, c), is a (2L + 1) × (2L + 1) square image region centered at (r, c), and is one-pixel square border just outside , and is one-pixel square border without four corner pixels outside . According to the Mexican-hat distribution, we know that the intensity relationship between the three sub-regions of a target roughly meets the bright-dark-bright pattern, and thus have the following rule:
Rule 1: If the mean intensity of is both larger than and , and the mean intensity of is smaller than , then the center of can be a candidate target center.
3. The Proposed Method
As shown in Figure 3, the proposed four-step method for detecting a small IR target is based on the Mexican-hat distribution. To increase the contrast between small targets and the background, the modified top-hat transformation [22] is first applied to a raw IR image, followed by DoG filtering. Then, the Mexican-hat-distribution based Rule 1 is applied to the DoG image, getting candidate targets. Finally, a small IR target is detected by locating the brightest pixel.
Here, to deal with the variable size of small IR targets, the following iteration strategy is adopted when applying Rule 1 to a DoG image. First, let the half-width, L, of region ranges from 1 to 5, implying the size of region varies from to that is consistent to the recognition that a small target usually occupies less than 80 pixels [24]. Then for each L, Rule 1 is applied to the adjacent of each pixel of the DoG-filtered image. Those pixels that meet Rule 1 are labeled as candidates, and their intensity is emphasized by the mean intensity of . Meanwhile, the corresponding size of , i.e., (2L + 1) × (2L + 1) are recorded as the target size.
Algorithm 1 presents the details for finding candidate targets as well as their sizes. Considering small IR targets are usually brighter than the background, Rule 1 is merely applied to the patches whose center pixel is brighter than with and being the mean intensity and the standard variance of the DoG-filtered image.
| Algorithm 1 Candidate target detection. |
|
Next, to further remove false targets, the statistics of sub-regions , and are calculated. For real small IR targets, their intensity might not strictly meet the Mexican-hat distribution. For example, the first row of Figure 4 shows that the center pixel of a target is not the brightest, and the second row shows that nearly half of pixels in region and in region don’t meet the Mexican-hat distribution. Therefore, for a candidate target located at (r, c), (3) is adopted to calculate the ratio of the number of pixels in being darker than the mean intensity of to the total pixels of .
where is the mean intensity of , and represents the cardinality of a set.
Then the pixel by pixel differences between and are calculated along the row direction and the column direction, respectively, followed by the computation of the ratio of the number of pixels in being darker than the corresponding pixels in to the total pixels with (4) and (5).
where and represent pixels of the first and the last columns in R1, and and are the pixels of the first and the last rows in . Equation (5) indicates that each corner element in has been compared two times, so the total number of pixels in (4) is given by Card() + 4 rather than Card().
Having the ratios of and , we compare them with two predetermined thresholds and , and use Rule 2 to detect a true small target. Finally, Rule 3 is applied to both target regions and non-target regions to further enhance targets while suppressing non-targets.
Rule 2: If and , then the corresponding pixel position (r, c) is the center of a small target.
Rule 3: If (r, c) is the center of a small target, then use (6) to enhance it; otherwise use (7) to suppress it.
where , and represent the final enhanced IR image, the raw IR image, and the DoG-filtered image, max(.) and min(.) are the maximum and the minimum functions.
Since small targets in both a raw IR image and DoG-filtered image are usually brighter than their surroundings, the term in (6) and (7) can enhance targets while suppressing backgrounds. Moreover, since both and are positive numbers smaller than 1, the term in (6) is always bigger than the term in (7). Therefore, by applying (6) and (7) to targets and non-targets, we can get a final image with salient targets. As a result, the target is easily detected by assigning the pixel with the maximum intensity as the target center. Algorithm 2 gives the details of our method for detecting small IR target.
| Algorithm 2 Our method for detecting small IR target. |
|
4. Experimental Results and Analysis
The proposed method for detecting a small IR target has been implemented in MATLAB using a PC with 2.6 GHz Intel Core i7 processor and 8 GB RAM. To evaluate the proposed method, different quantitative and qualitative evaluations have been carried out on IR images with complex backgrounds. The test data consists of 100 synthetic IR images with resolution of 584 × 468 pixels (termed as Seq.1) and 32 real-world IR images with resolution of 240 × 320 pixels (termed as Seq.2). Each image of Seq.1 has only one target. So does Seq.2. Here, the 100 synthetic images are made by adding targets with a Gaussian distribution to real-world cloud backgrounds.
4.1. Influences of the Modified Top-Hat Transformation and the DoG
This experiment adopts Seq.2 that has low target-background contrast to evaluate the influence of the modified top-hat transformation. According to [22] as well as our experimental results, we set the parameters of the modified top-hat transformation as , = 1, = 1, = 1.2, = 1.2, and = 5. Here is the window size. , and are the coefficients of target enhancement operation. For the two thresholds of our method, we set and . Figure 5, Figure 6 and Figure 7 show some results with and without modified top-hat transformation. The raw IR images of these figures include a small target located at the edge of clouds, a small target located at the sky background without clouds, and a small target near the edge of clouds, respectively. We can see that the modified top-hat transformation benefits to increasing the contrast between the target and the background. Therefore, the targets with low contrast can be detected easier with such a transformation.
4.2. Step-By-Step Results
As shown in Figure 3, our proposed method consists of four major steps. This experiment aims to present the influence of each step on the detection. Figure 8 and Figure 9 show some representative results. Generally speaking, the proposed method is able to well enhance the IR targets under different backgrounds and can suppress much of the background clutters. Specifically, we can see that by applying the modified top-hat transformation, dark sky backgrounds are darkened further, and cloud clutters become smoother (Figure 8b and Figure 9b). Then, with DoG filtering, a small IR target is emphasized, while the background is greatly suppressed, and thus the target becomes more prominent (Figure 8c and Figure 9c). Next, by using the Mexican-hat distribution, candidate targets including the real target as well as some cloud edges are enhanced (Figure 8d and Figure 9d). And then by using Rule 2 and Rule 3, the real target becomes the most prominent one (Figure 8e,f and Figure 9e,f). As a result, the target can be easily detected by locating the brightest pixel.
Figure 8c shows that DoG filtering is good at dealing with a synthetic target whose intensity strictly meets the Gaussian distribution. Generally speaking in this case the DoG itself is enough to detect the real target. But Figure 9c indicates that the DoG cannot well deal with real targets which may not have a strict Gaussian distribution. In this case, background clutters like cloud edges may have a similar intensity to a small target after DoG, and thus the simple DoG cannot detect targets correctly. From Figure 9f we can see that in the case of real targets our method still performs well. This is due to the rules based on the Mexican-hat distribution play an important role in enhancing real targets.
4.3. Comparison with Other Methods
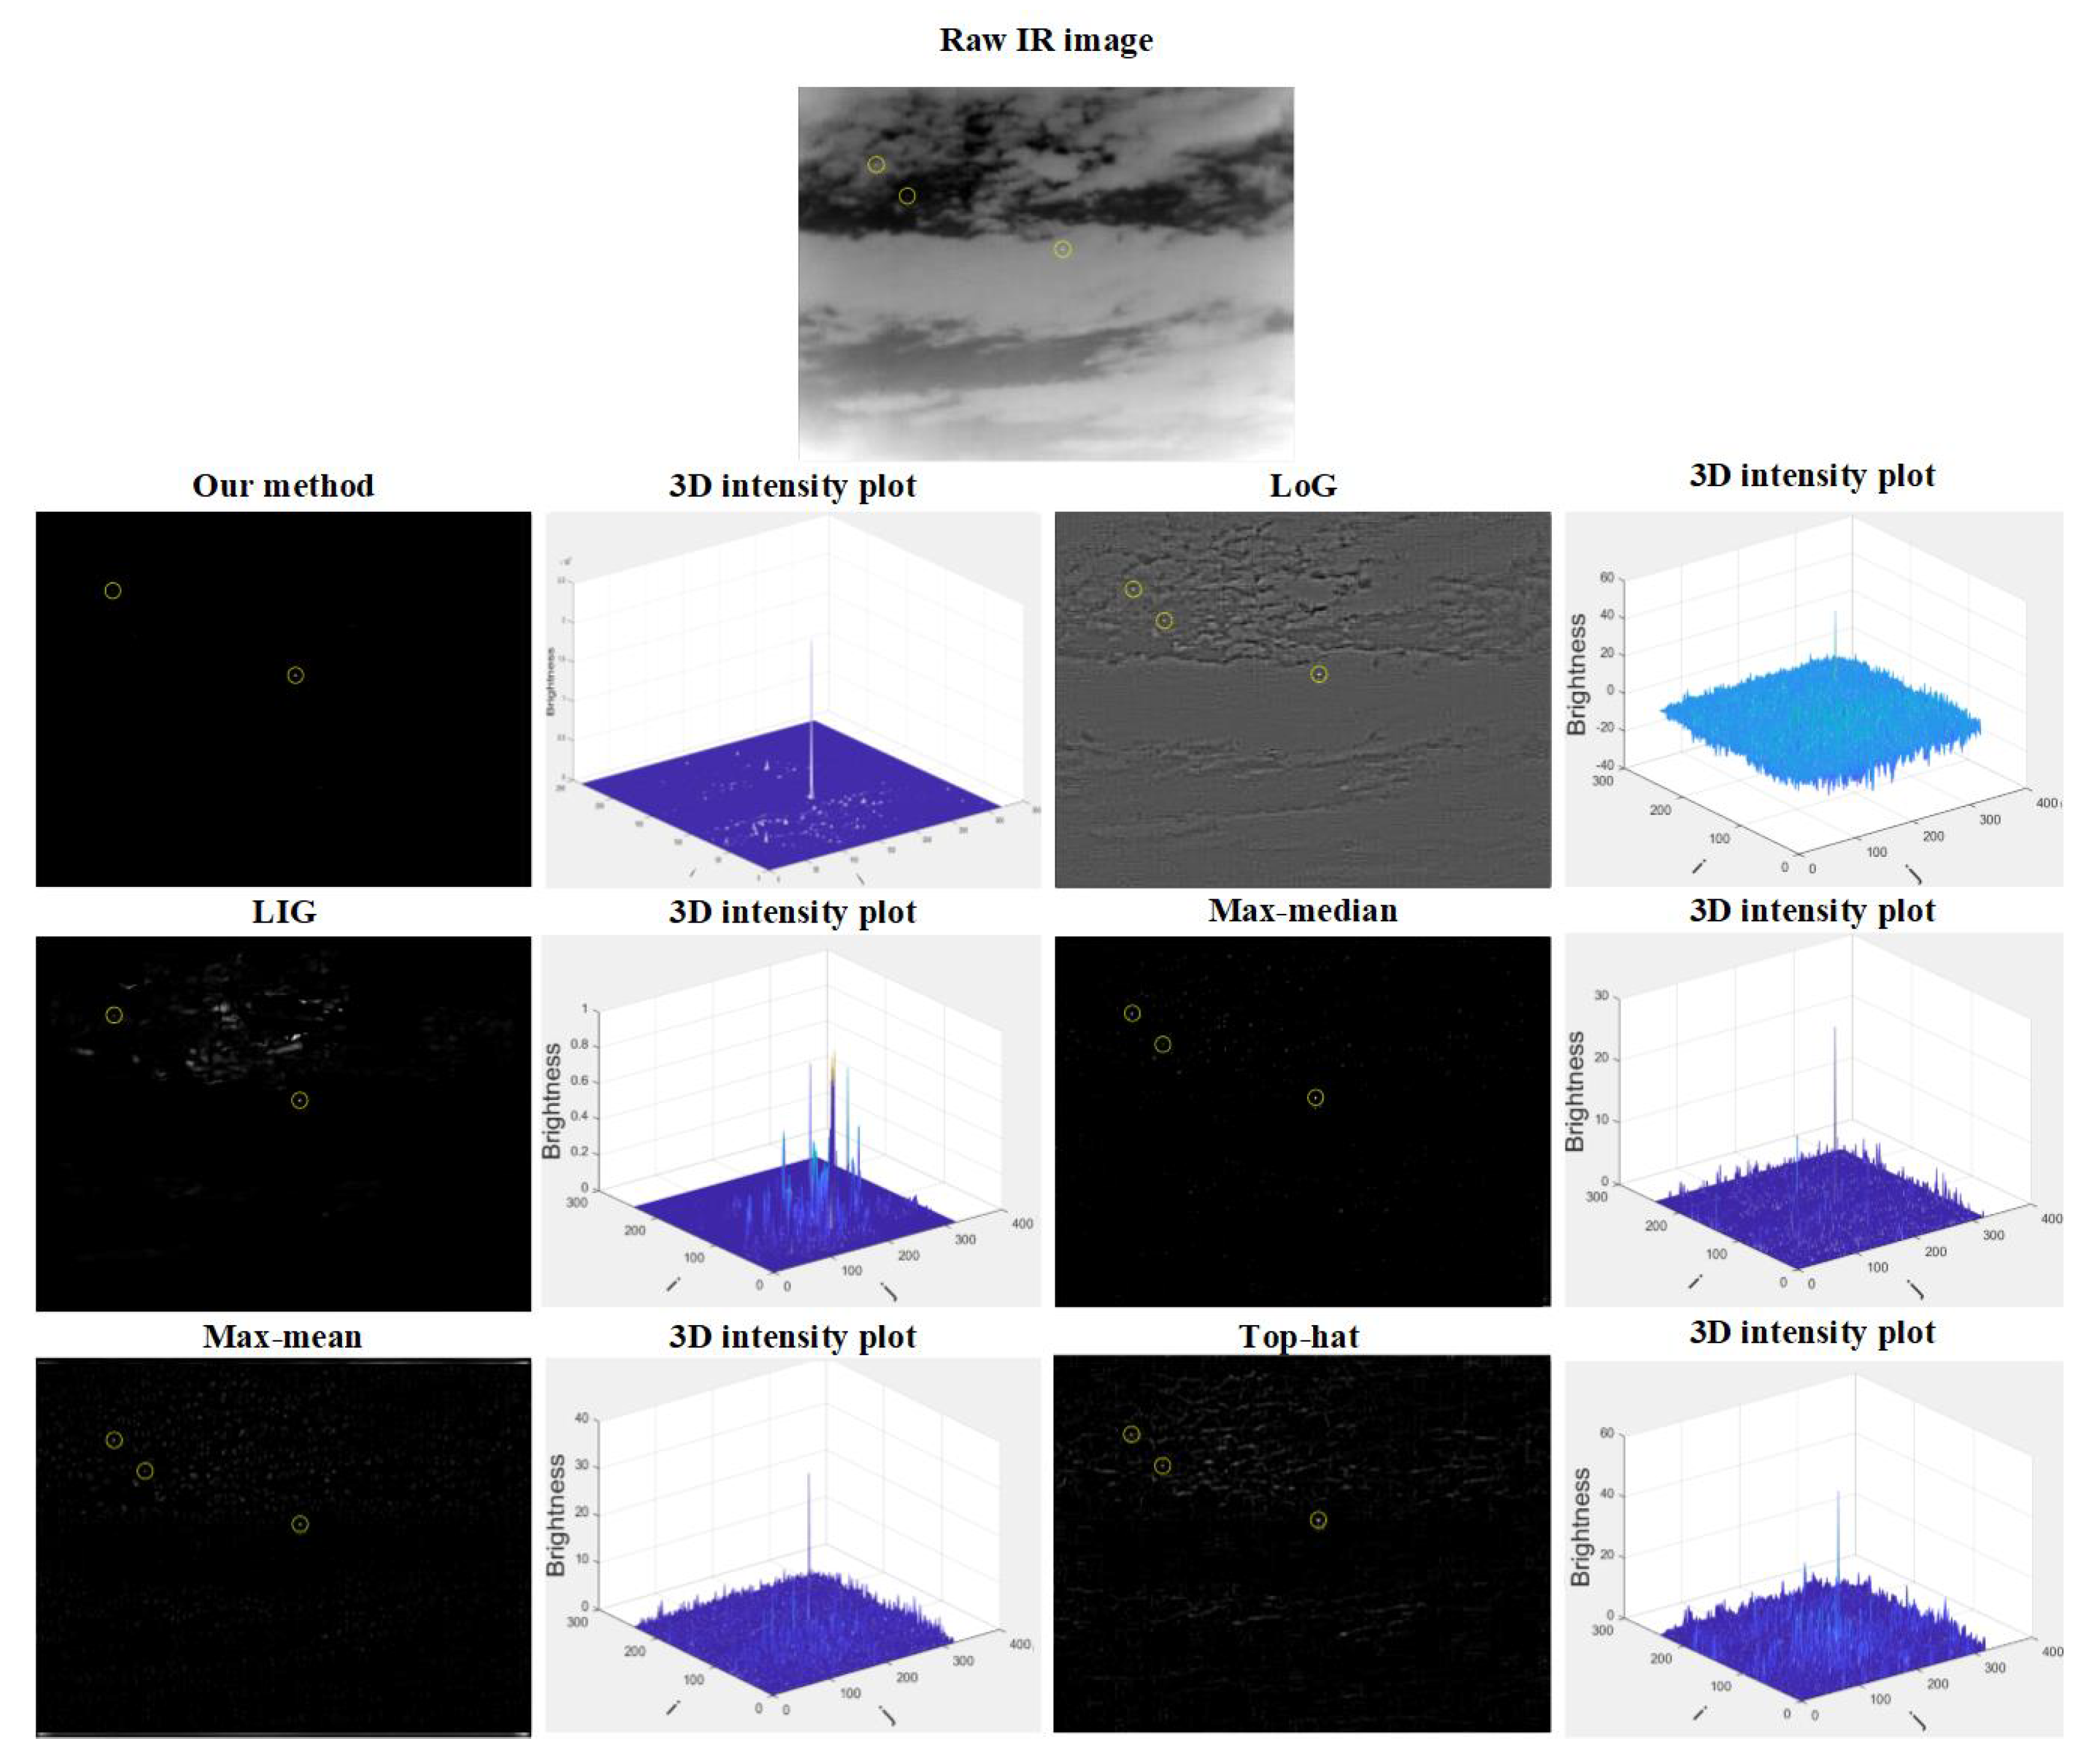
This experiment compares the proposed method with other nine popular small IR target detectors, i.e. Relative Local Contrast Measure (RLCM) [25], Patch-based Contrast Measure (PCM) [11], Variance difference (Var-diff) [15], Absolute Average Gray Difference (AAGD) [25], Laplacian of Gaussian (LoG) [26], Local Intensity and Gradient (LIG) [18], Max-median [27], Max–Mean [27] and the traditional Top-Hat filter. Some of them are traditional methods like LoG, Max-median, Max–Mean, and the traditional Top-Hat filter, and others are state-of-the-art methods like RLCM, PCM, Var-diff, AAGD, and LIG. Most parameters of the nine methods are the same as the original references, except the following parameters. The standard deviation of the Gaussian kernel is 0.5 in LoG, and the sliding window size of LIG is 19 × 19. The patch sizes of Max-median and Max–Mean is 5. The structure element is a rectangle of 3 × 3 in the Top-Hat filter. We determine these parameters to make the corresponding method perform best on both Seq.1 and Seq.2.
Figure 10 and Figure 11 visually illustrate the detection results corresponding to each method. The final detected target is circled in yellow. An image without any yellow circle means the method fails to detect any target. Here zoomed in images have been presented to see the target clearly.
From the 3D intensity plots shown in Figure 10 and Figure 11, we can see the target enhanced by our Mexican-hat distribution based method is more prominent than other compared methods, leading our method a satisfied detection performance. Particularly, RLCM can enhance the target successfully, but as shown in Figure 10 and Figure 11, it cannot suppress the high bright backgrounds successfully. For the methods of LoG, Max-median, Max-mean, and Top-Hat, they sometimes fail in suppressing clutters, leading to a false detection or failing to detect any target. For PCM, Var-diff, AAGD, and LIG, they apt to fail to detect any target in the images with complex backgrounds. In fact, for the simple methods such as Max-median and Max-mean, they seem to be more effective on a synthetic target, because of the non-strict Gaussian distribution of real small IR targets as well as the low contrast between target and background.
Besides visual comparisons, quantitative metrics have also been evaluated. We choose the Signal to Clutter Ratio Gain (SCRG) [28], Background Suppression Factor(BSF) [28], the true detection rate , the false detection rate [29], and time cost as the quantitative metrics. The results are listed in Table 1 and Table 2.
Table 1 and Table 2 show that for both synthetic and real-world targets, our method gets the highest SCRG and BSF, indicating it performs better than other compared methods in terms of both clutter suppression and target enhancement. Though for a synthetic target, and of our method are slightly worse than the Max-median and the Max-median, they are much better than the other seven methods. Moreover, among all of the compared methods, our method gets the highest and the lowest and on Seq.2 that has a real-world target. In terms of time cost, our method has a medium performance. The average processing time of our method is about 1.86 s for an image of 468 by 584 pixels, and 0.87 s for an image of 240 by 320 pixels. Our method is slower than PCM, Var-diff, AAGD, LoG, and Top-Hat, but faster than LIG and Max-median, and much faster than RLCM.
4.4. Multi-Target Detection Results
Although our method is originally designed for detecting single target, our method can also be directly applied to multi-target detection. To evaluate the performance of our method on multi-target detection, two sequences respectively derived from Seq.1 and Seq.2 are adopted. Two Gaussian-distributed synthetic small targets are added to the first thirty images of Seq.1 (Seq.2) and we named it as Seq.3 (Seq.4). Here, we only compare our method to LoG, LIG, Max-median, Max-mean, Top-Hat due to their good performance on Seq.1 and Seq.2. Table 3 and Table 4 list the quantitative results, while Figure 12 and Figure 13 show some detection results visually. Once again, we can see from Table 3 and Figure 12 that our method achieves the best and . However, our detector performs worse than LoG in the case of complex backgrounds as presented in Table 4 and Figure 13. Form Figure 12 and Figure 13, we can also see that our method still has strong ability for removing background clutters while reserving targets.
We also compare our method to those detectors mentioned in Section 4.3. As is shown in Figure 12, compared to other methods, our method can detect multi targets more accurately due to its stronger ability than RLCM, LoG, LIG, Max- median, Max-mean, and Top-hat for removing background clutters while reserving targets.
5. Conclusions
In this paper, we have proposed a new method for detecting small IR targets. Our method is based on that the adjacent region of a small target in a DoG-filtered image roughly holds the Mexican-hat distribution. Our experimental results on both real-world and synthetic IR images show that our method is quite effective in enhancing small IR targets while suppressing background clutters. In terms of SCRG, BSF, , and , our method outperforms both the traditional and state-of-the-art methods. Moreover, it runs faster than the RLCM, the LIG, the Max–median, and the Max–mean.
Our experimental results show that our method performs rather well in single target detection and can also be directly used for detecting multi-targets in simple background. However, such direct use degrades the detection performance when the background is very complicated. Thus, our future work will focus on detecting multi-targets in complex background via such a method.
Author Contributions
Conceptualization, Y.Z. (Yubo Zhang) and L.Z.; Data curation, Y.Z. (Yubo Zhang) and L.Z.; Formal analysis, Y.Z. (Yubo Zhang) and L.Z.; Funding acquisition, L.Z.; Investigation, Y.Z. (Yubo Zhang); Methodology, Y.Z. (Yubo Zhang); Project administration, L.Z.; Resources, L.Z.; Software, Y.Z. (Yubo Zhang); Supervision, L.Z.; Visualization, Y.Z. (Yubo Zhang); Writing—original draft, Y.Z. (Yubo Zhang); Writing—review & editing, Y.Z. (Yubo Zhang), L.Z. and Y.Z. (Yanbo Zhang).
Funding
This work has been supported by the National Natural Science Foundation of China (No. 61771155).
Conflicts of Interest
The authors declare no conflict of interest and there is no copyright issue in all of figures.
References
- Soni, T.; Zeidler, J.R.; Ku, W.H. Recursive estimation techniques for detection of small objects in infrared image data. In Proceedings of the ICASSP-92: 1992 IEEE International Conference on Acoustics, Speech, and Signal Processing, San Francisco, CA, USA, 23–26 March 1992; Volume 3, pp. 581–584. [Google Scholar]
- Zhang, L.; Peng, Z. Infrared Small Target Detection Based on Partial Sum of the Tensor Nuclear Norm. Remote Sens. 2019, 11, 382. [Google Scholar] [CrossRef] [Green Version]
- Bai, X. Morphological center operator for enhancing small target obtained by infrared. Opt.-Int. J. Light Electron Opt. 2014, 125, 3697–3701. [Google Scholar] [CrossRef]
- He, Q.; Mo, B.; Liu, F.; He, Y.; Liu, S. Small infrared target detection utilizing Local Region Similarity Difference map. Infrared Phys. Technol. 2015, 71, 131–139. [Google Scholar]
- Deng, L.; Zhu, H.; Zhou, Q.; Li, Y. Adaptive top-hat filter based on quantum genetic algorithm for infrared small target detection. Multimed. Tools Appl. 2017, 77, 10539–10551. [Google Scholar] [CrossRef]
- Itti, L.; Koch, C.; Niebur, E. A model of saliency-based visual attention for rapid scene analysis. IEEE Trans. Pattern Anal. Mach. Intell. 1998, 11, 1254–1259. [Google Scholar] [CrossRef] [Green Version]
- Li, W.; Pan, C.; Liu, L.X. Saliency-based automatic target detection inforward looking infrared images. In Proceedings of the 2009 16th IEEE International Conference on Image Processing (ICIP), Cairo, Egypt, 7–10 November 2009; Volume 153, pp. 327–333. [Google Scholar]
- Wang, X.; Lv, G.; Xu, L. Infrared dim target detection based on visual attention. Infrared Phys. Technol. 2014, 55, 513–521. [Google Scholar] [CrossRef]
- Chen, C.L.P.; Li, H.; Wei, Y.; Xia, T.; Tang, Y.Y. A local contrast method for small infrared target detection. IEEE Trans. Geosci. Remote Sens. 2014, 52, 574–581. [Google Scholar] [CrossRef]
- Yang, J.; Gu, Y.; Sun, Z.; Cui, Z. A Small Infrared Target Detection Method Using Adaptive Local Contrast Measurement. In Proceedings of the 2019 IEEE International Instrumentation and Measurement Technology Conference (I2MTC), Auckland, New Zealand, 20–23 May 2019; pp. 1–6. [Google Scholar]
- Wei, Y.; You, X.; Li, H. Multiscale patch-based contrast measure for small infrared target detection. Pattern Recognit. 2016, 58, 216–226. [Google Scholar] [CrossRef]
- Deng, H.; Sun, X.; Liu, M.; Ye, C.; Zhou, X. Small infrared target detection based on weighted local difference measure. IEEE Trans. Geosci. Remote Sens. 2016, 10, 4204–4214. [Google Scholar] [CrossRef]
- Han, J.; Ma, Y.; Huang, J.; Mei, X.; Ma, J. An infrared small target detecting algorithm based on human visual system. IEEE Geosci. Remote Sens. Lett. 2016, 13, 452–456. [Google Scholar] [CrossRef]
- Chen, Y.; Song, B.; Wang, D.; Guo, L. An effective infrared small target detection method based on the human visual attention. J. Abbr. 2018, 95, 128–135. [Google Scholar] [CrossRef]
- Nasiri, M.; Chehresa, S. Infrared small target enhancement based on variance difference. Infrared Phys. Technol. 2017, 10, 107–119. [Google Scholar] [CrossRef]
- Bai, X.; Bi, Y. Derivative entropy-based contrast measure for infrared small target detection. IEEE Trans. Geosci. Remote Sens. 2018, 56, 2452–2466. [Google Scholar] [CrossRef]
- Liu, J.; He, Z.; Chen, Z.; Shao, L. Tiny and dim infrared target detection based on weighted local contrast. IEEE Geosci. Remote Sens. Lett. 2018, 15, 1780–1784. [Google Scholar] [CrossRef]
- Zhang, H.; Zhang, L.; Yuan, D.; Chen, H. Infrared small target detection based on local intensity and gradient properties. Infrared Phys. Technol. 2018, 89, 88–96. [Google Scholar] [CrossRef]
- Yi, X.; Wang, B.; Zhou, H.; Qin, H. Dim and small infrared target fast detection guided by visual saliency. Infrared Phys. Technol. 2019, 97, 6–14. [Google Scholar] [CrossRef]
- Li, L.; Li, Z.; Li, Y.; Chen, C.; Yu, J.; Zhang, C. Small Infrared Target Detection Based on Local Difference Adaptive Measure. IEEE Geosci. Remote Sens. Lett. 2019, 1–5. [Google Scholar] [CrossRef]
- Zhang, J.; Zhang, B.; Liu, P. Infrared small target detection based on salient region extraction and gradient vector processing. In Proceedings of the 2019 International Conference on Robotics, Intelligent Control and Artificial Intelligence, Shanghai, China, 20–22 September 2019; pp. 422–426. [Google Scholar]
- Bai, X.; Zhou, F. Infrared small target enhancement and detection based on modified top-hat transformations. Comput. Electr. Eng. 2010, 36, 1193–1201. [Google Scholar] [CrossRef]
- Lowe, D.G. Distinctive image features from scale-invariant keypoints. Int. J. Comput. Vis. 2004, 60, 91–110. [Google Scholar] [CrossRef]
- Nilufar, S.; Ray, N.; Zhang, H. Object detection with dog scale-space: A multiple kernel learning approach. J. Abbr. 2012, 21, 3744–3756. [Google Scholar] [CrossRef]
- Moradi, S.; Moallem, P.; Sabahi, M.F. A false-alarm aware methodology to develop robust and efficient multi-scale infrared small target detection algorithm. Infrared Phys. Technol. 2018, 89, 387–397. [Google Scholar] [CrossRef]
- Kim, S.; Yang, Y.; Lee, J.; Park, Y. Small target detection utilizing robust methods of the human visual system for IRST. J. Infrared Millimeter Terahertz Waves 2009, 30, 994–1011. [Google Scholar] [CrossRef]
- Deshpande, S.D.; Er, M.H.; Venkateswarlu, R.; Chan, P. Max-mean and max-median filters for detection of small targets. Signal Data Process. Small Targets 1999, 3809, 74–83. [Google Scholar]
- Hilliard, C.I. Selection of a clutter rejection algorithm for real-time target detection from an airborne platform. Signal Data Process. Small Targets 2000, 4048, 74–84. [Google Scholar]
- Gu, Y.; Wang, C.; Liu, B.; Zhang, Y. A kernel-based nonparametric regression method for clutter removal in infrared small-target detection applications. IEEE Geosci. Remote Sens. Lett. 2010, 10, 469–473. [Google Scholar] [CrossRef]
Figure 1.
The bright-dark-bright pattern of the adjacent region of an IR target.

Figure 2.
Three sub-regions of a small image patch.
Figure 3.
The proposed method for detecting small IR targets.
Figure 4.
The intensity distribution of two real small IR targets in a DoG-filtered image.
Figure 5.
The twenty-first image in Seq.2. (x,y) in each sub-caption is the coordinate of the target center, and the detected target is circled in yellow.
Figure 5.
The twenty-first image in Seq.2. (x,y) in each sub-caption is the coordinate of the target center, and the detected target is circled in yellow.
Figure 6.
The twenty-fifth image in Seq.2.
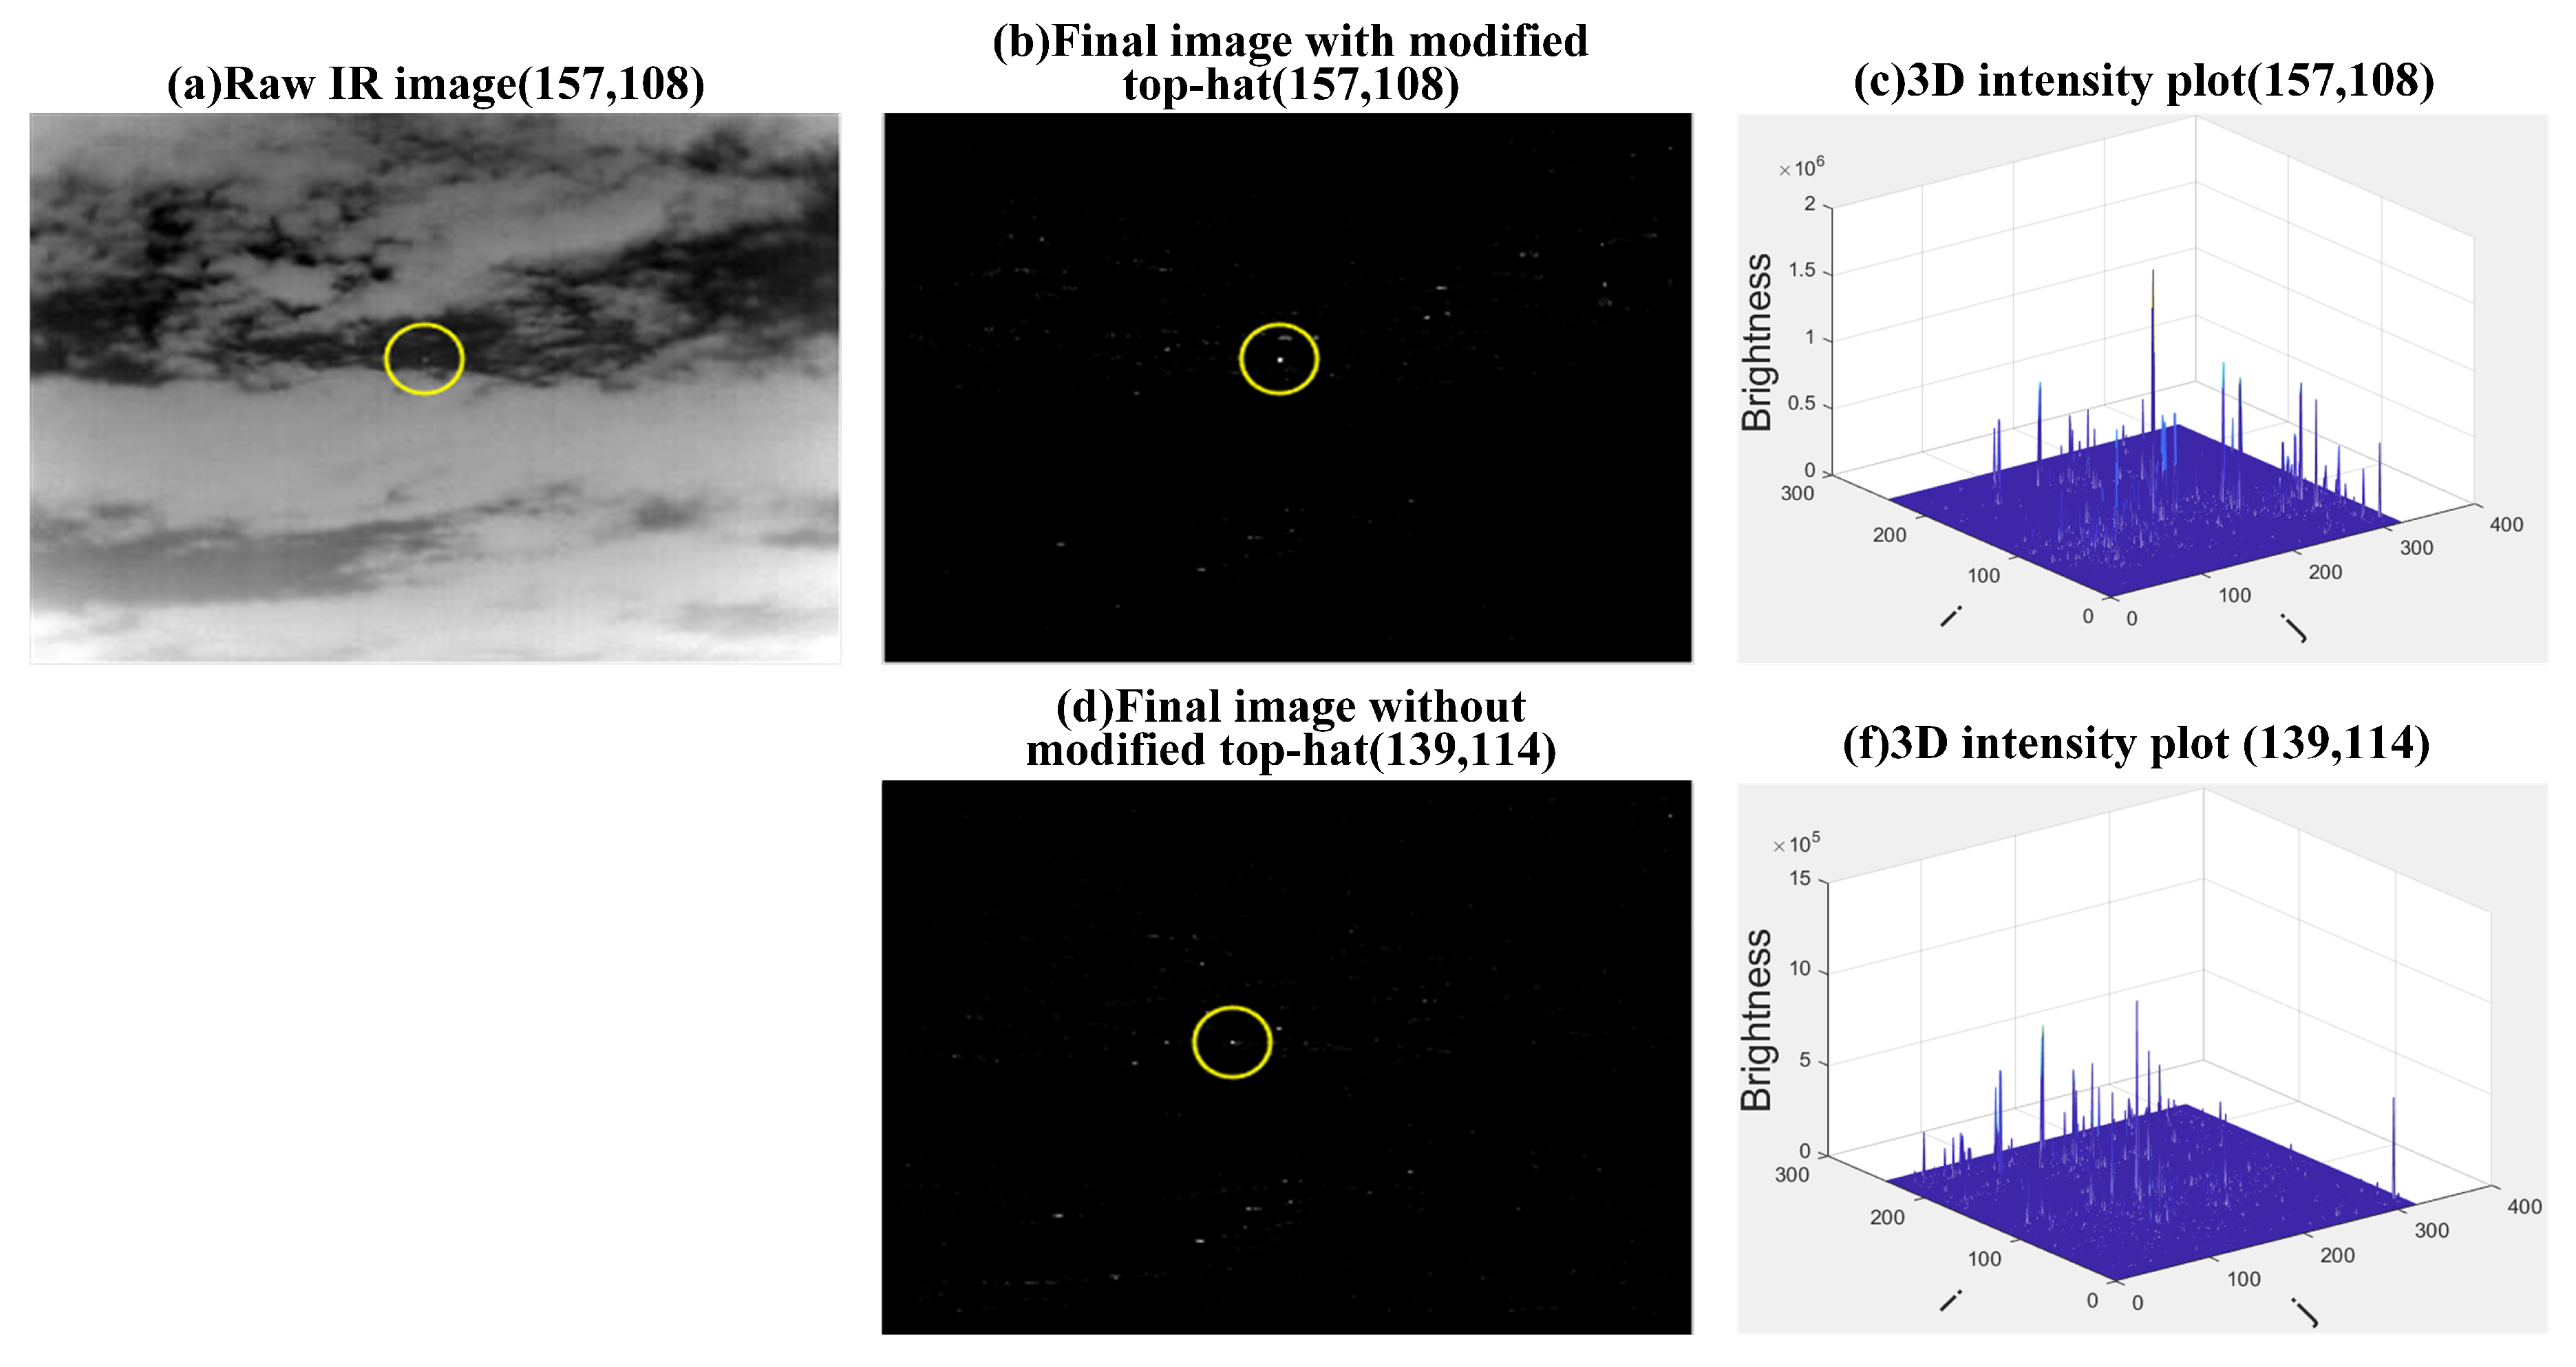
Figure 7.
The thirty-second image in Seq.2.

Figure 8.
The thirty-seventh image in Seq.1.
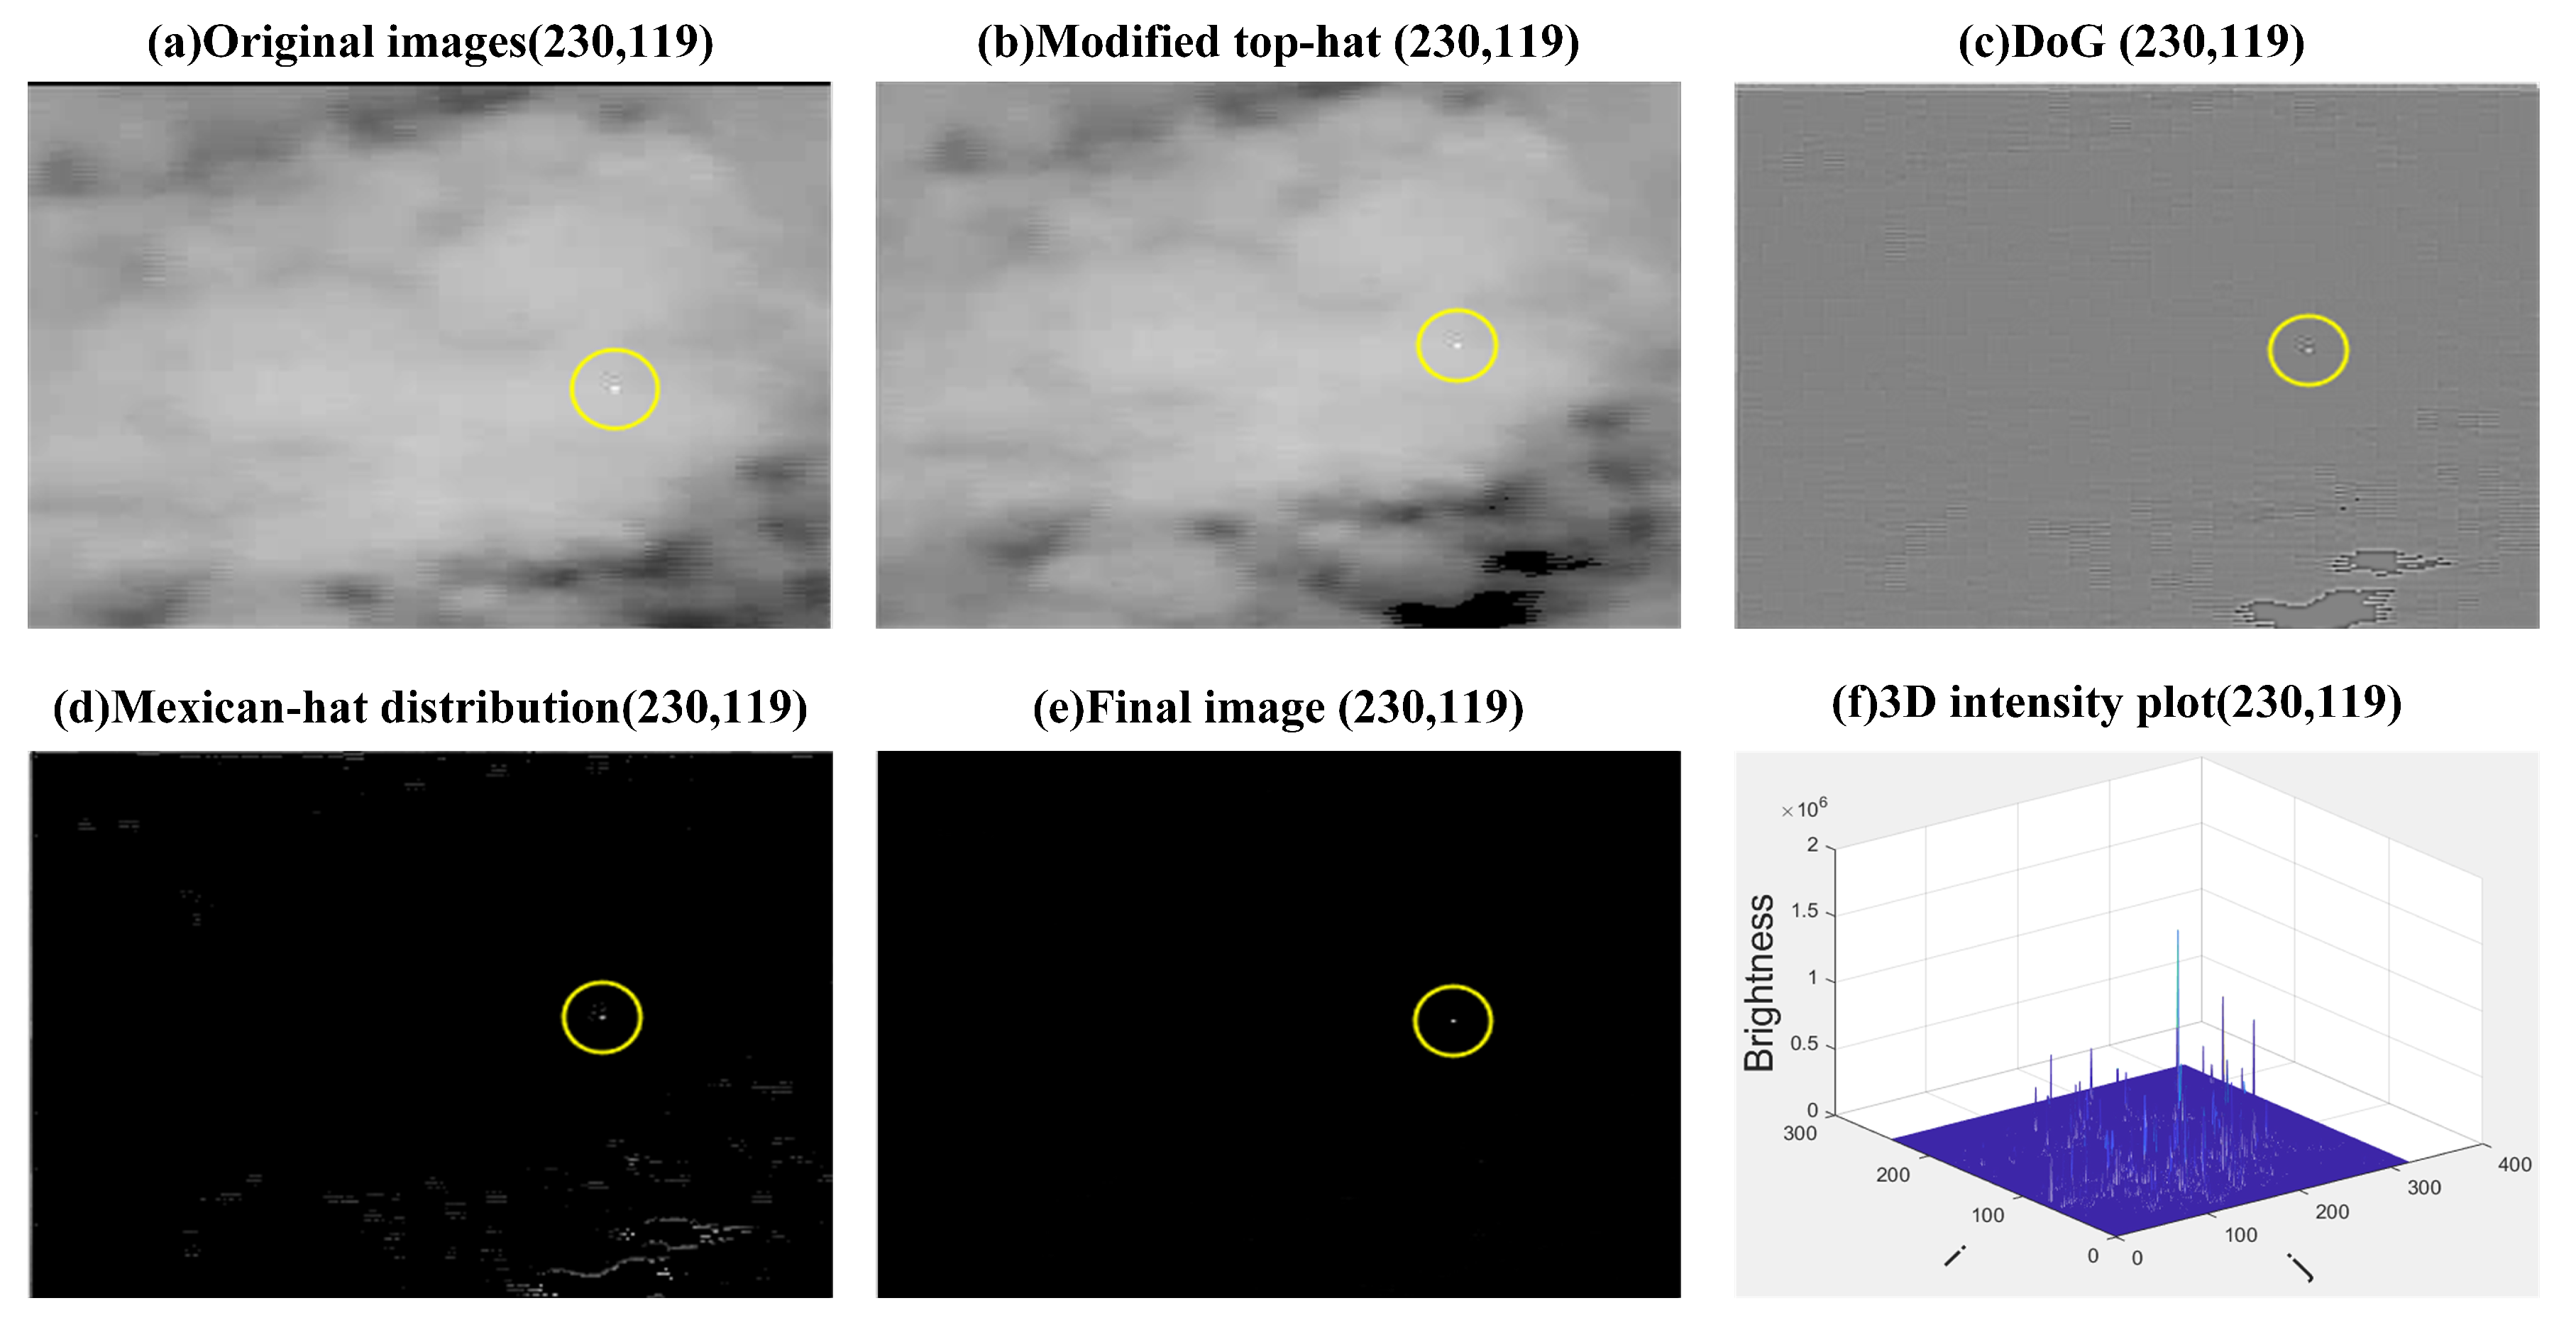
Figure 9.
The twentieth image in Seq.2.
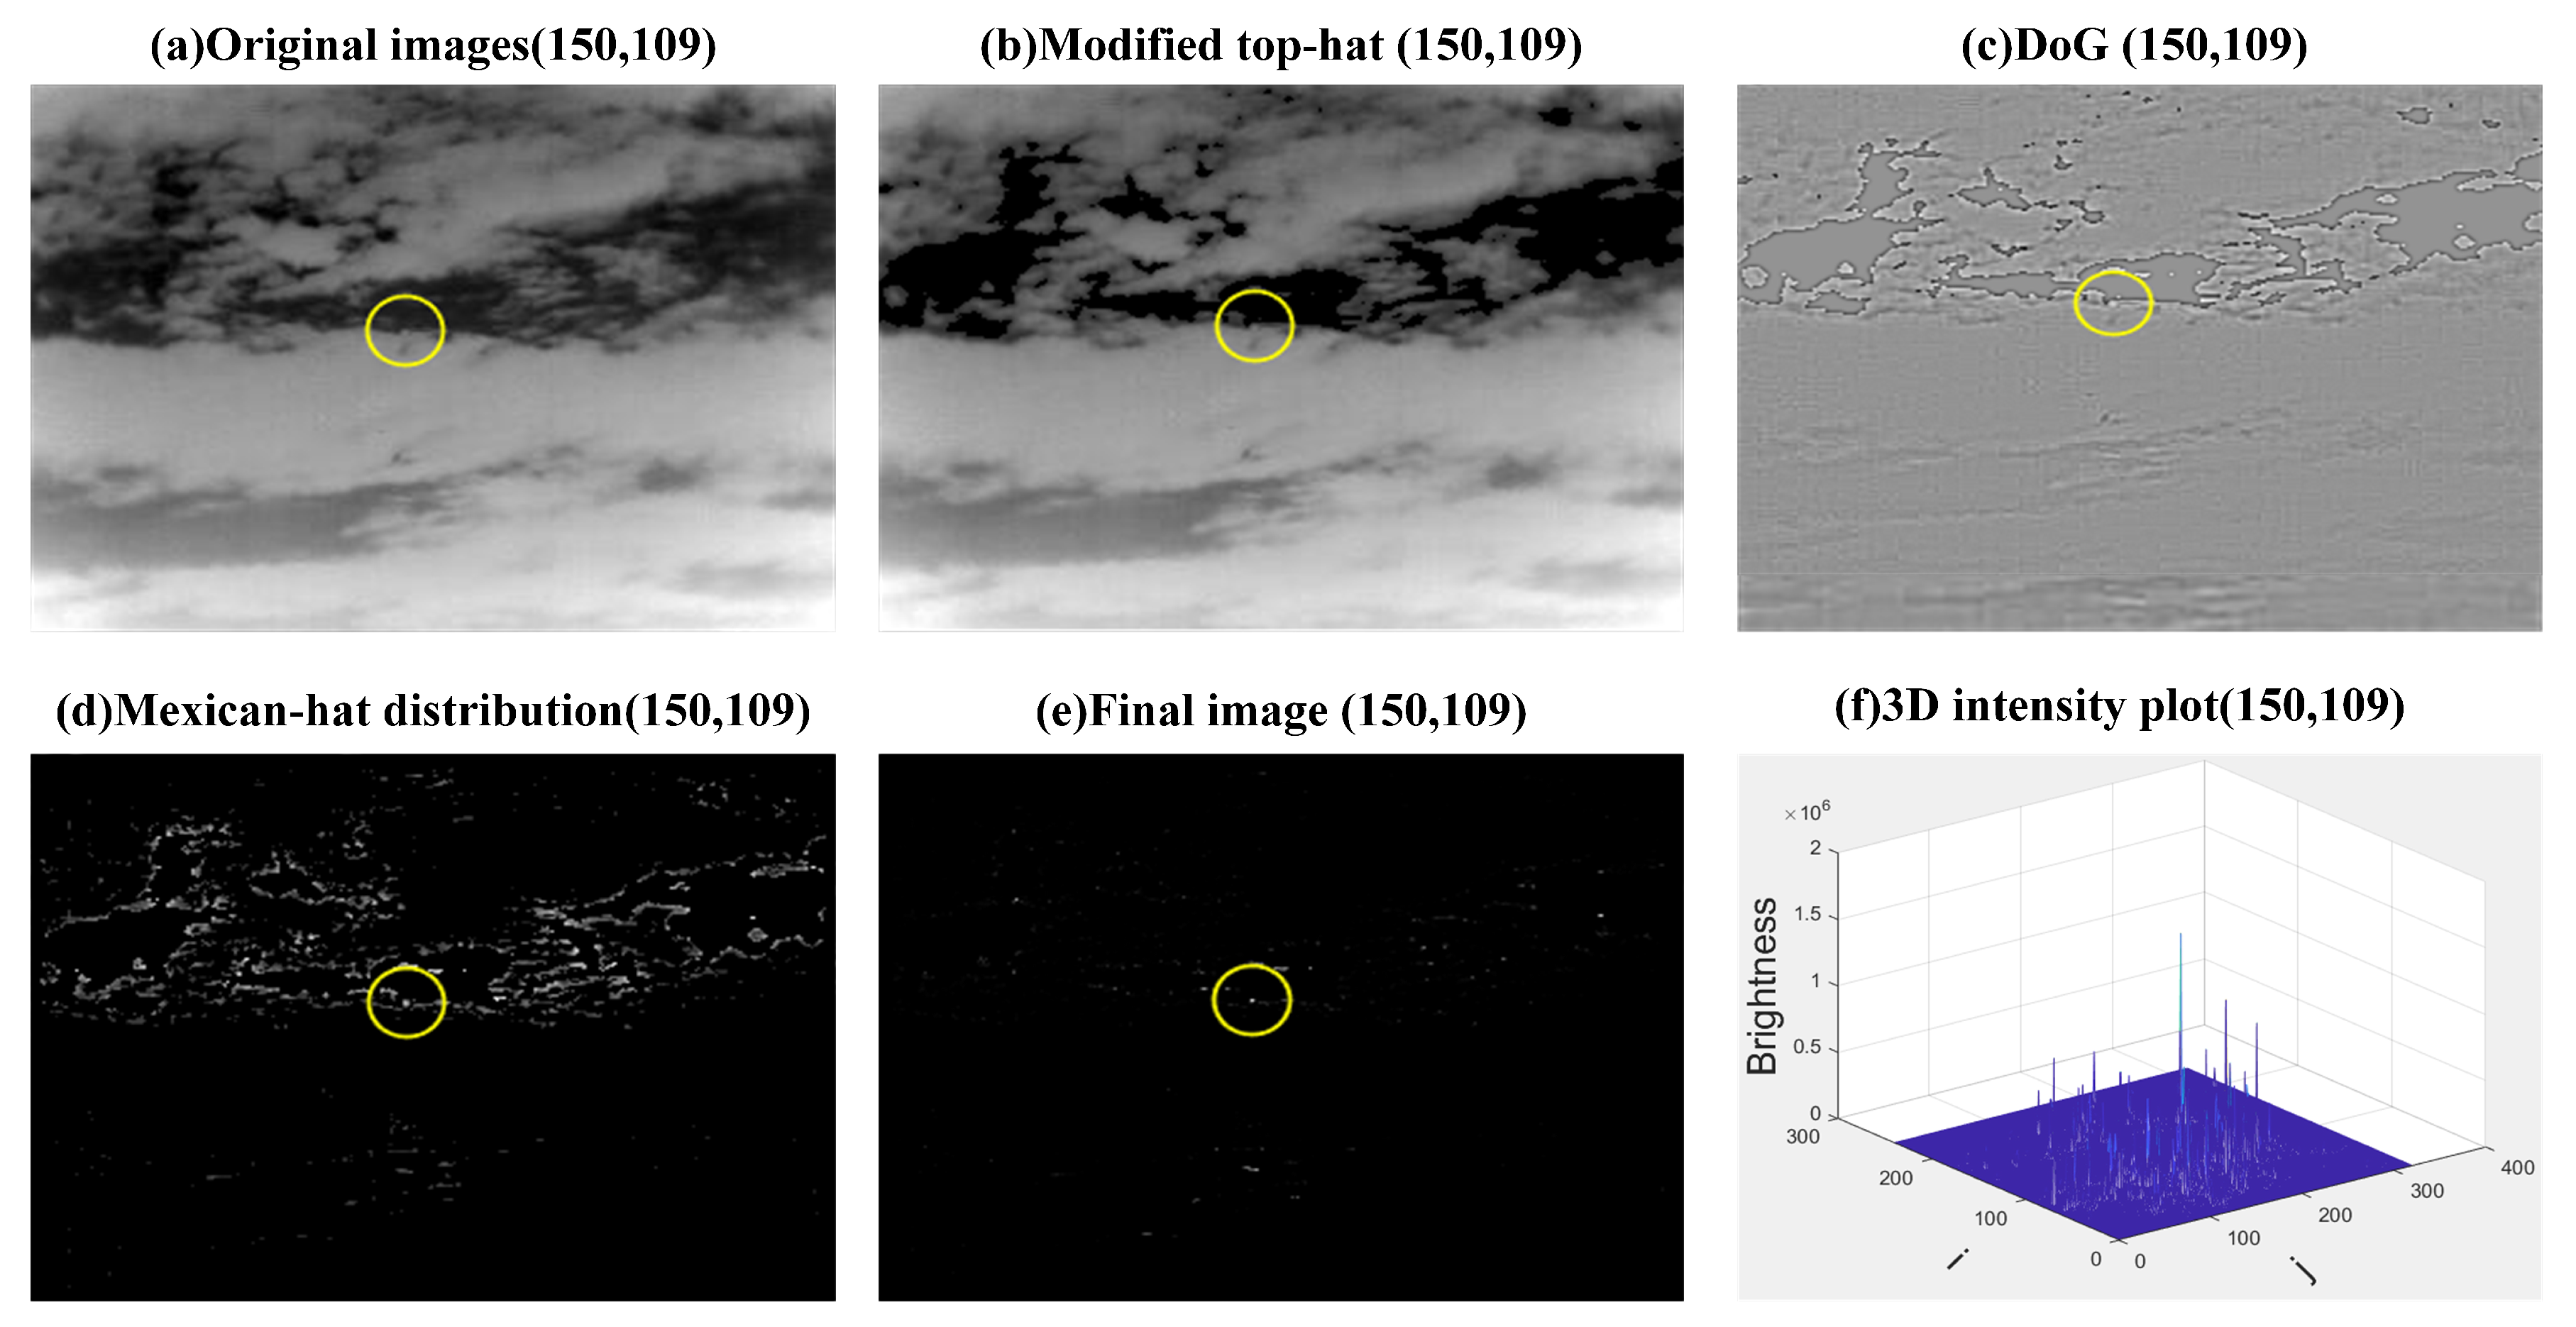
Figure 10.
The forty-ninth image in Seq.1.
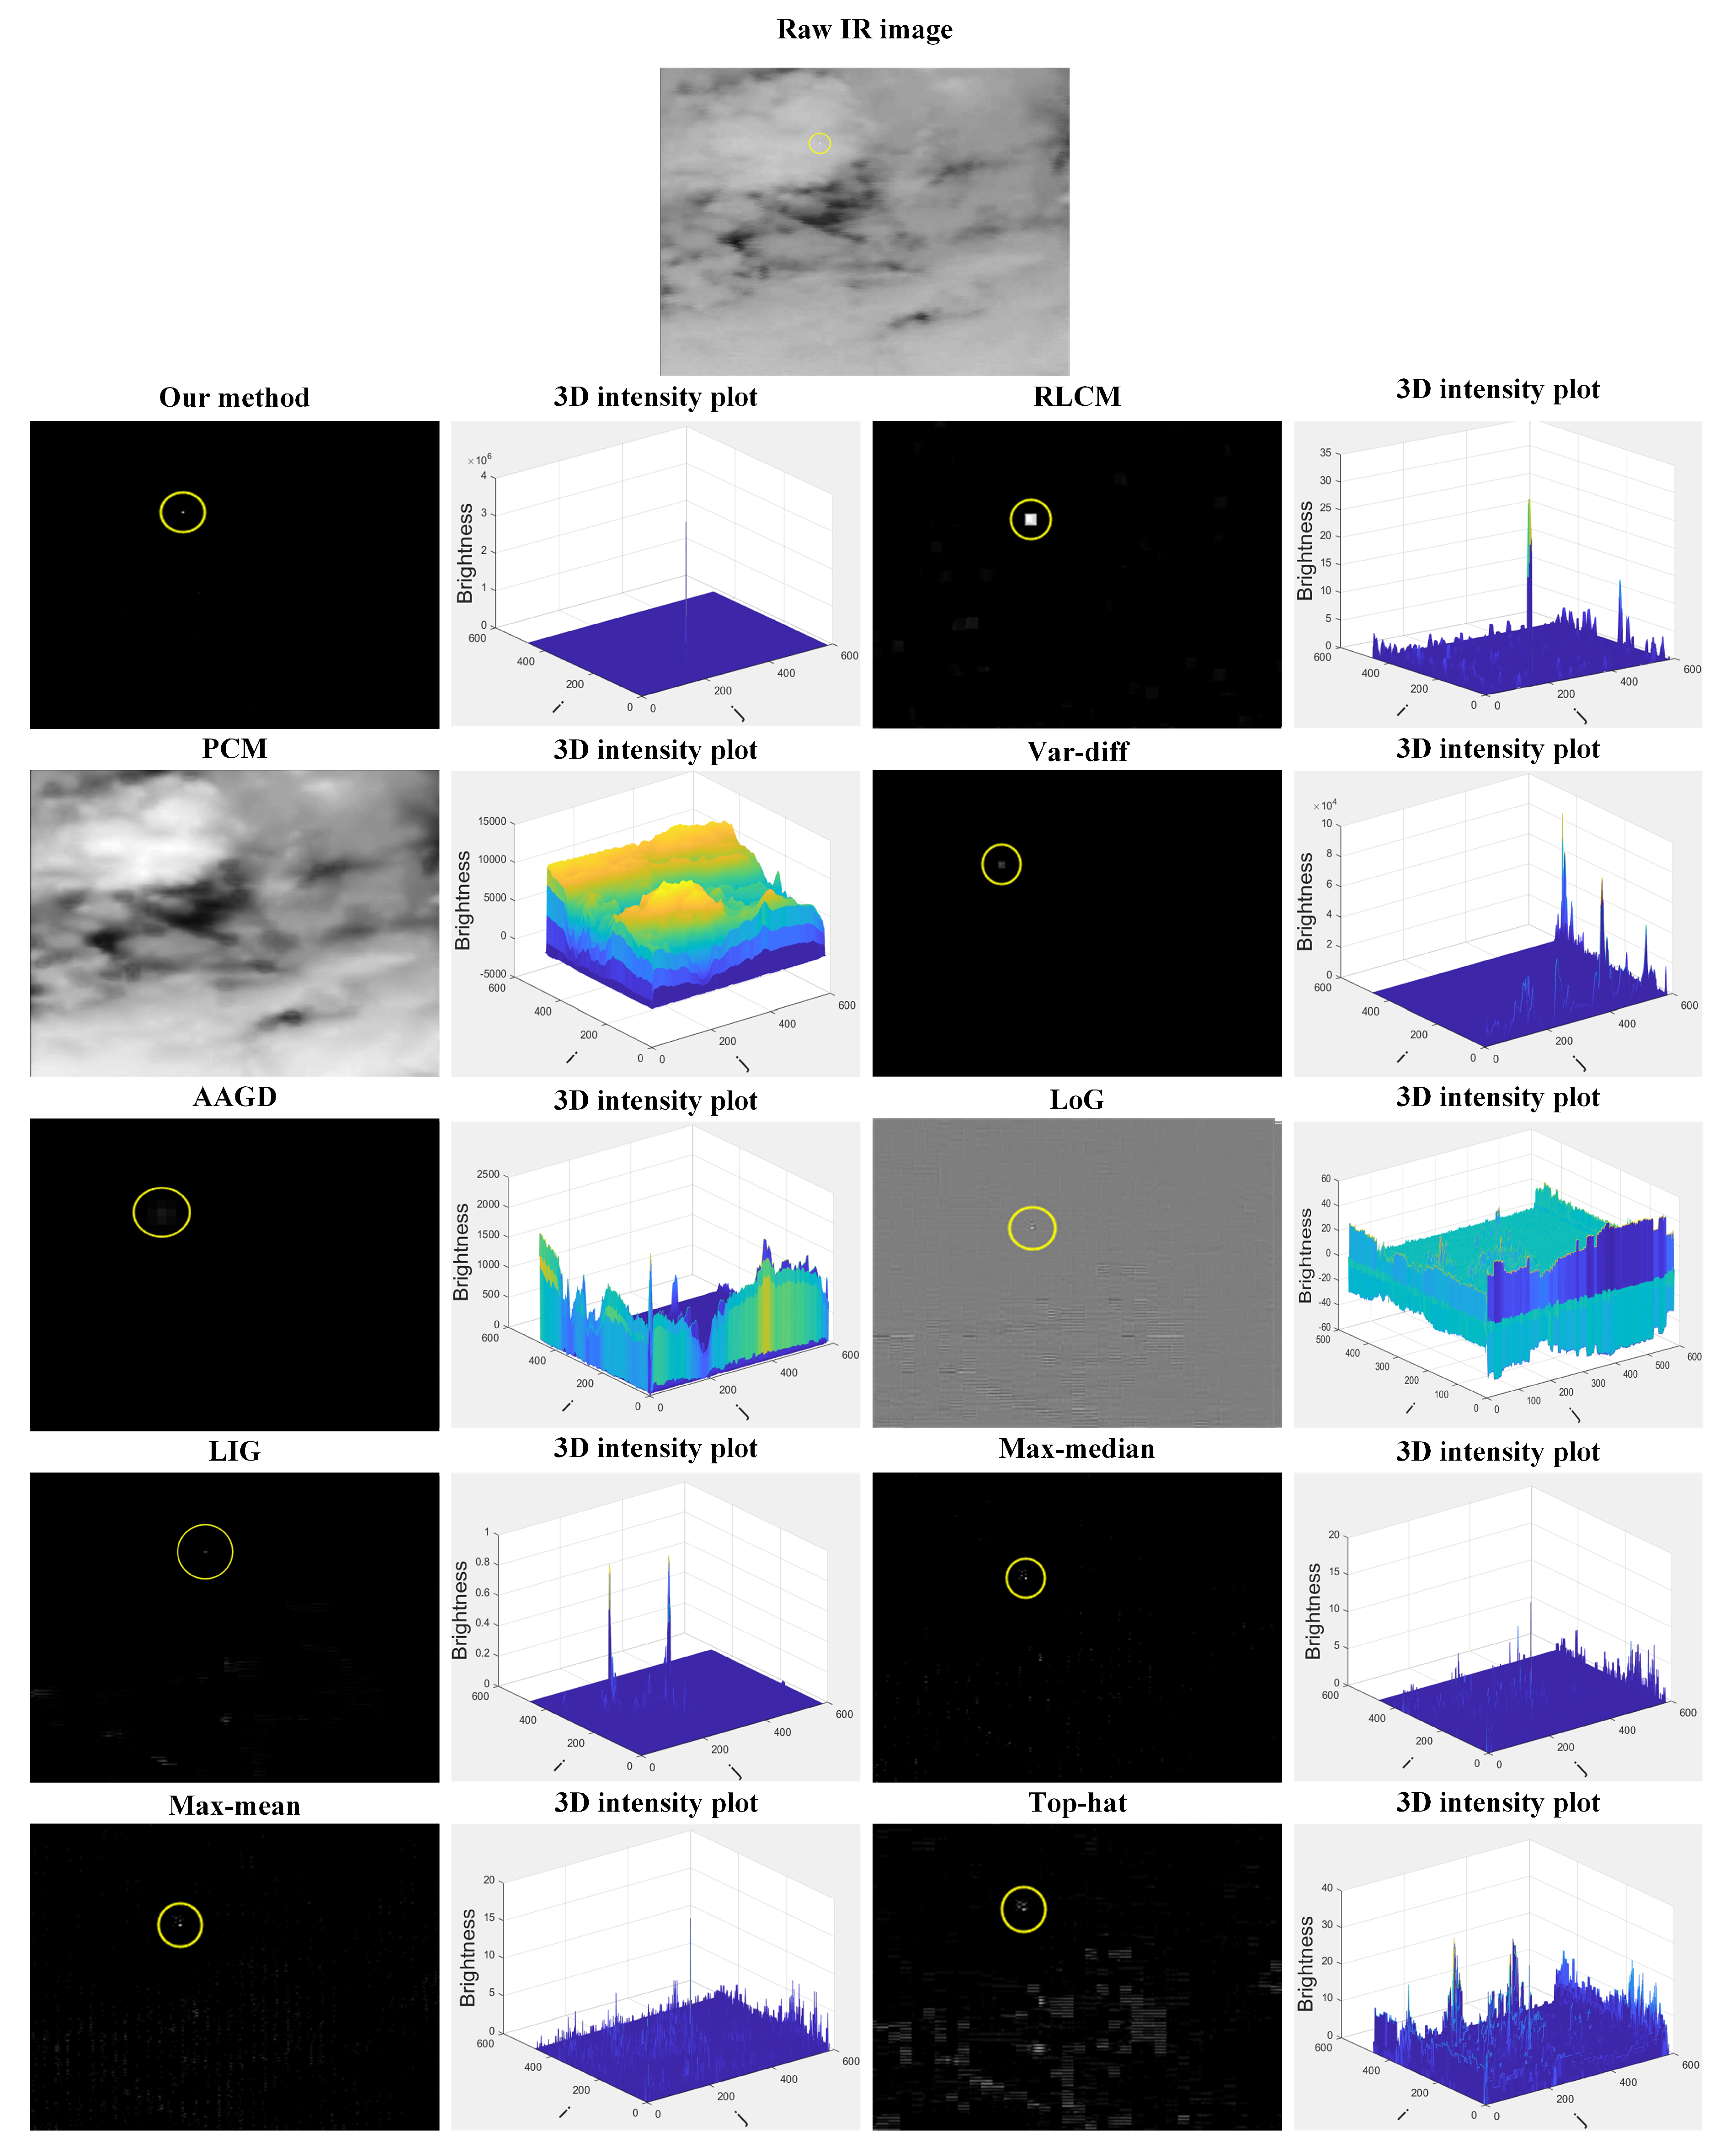
Figure 11.
The first image in Seq.2.

Figure 12.
Detection results on the second image in Seq.3.
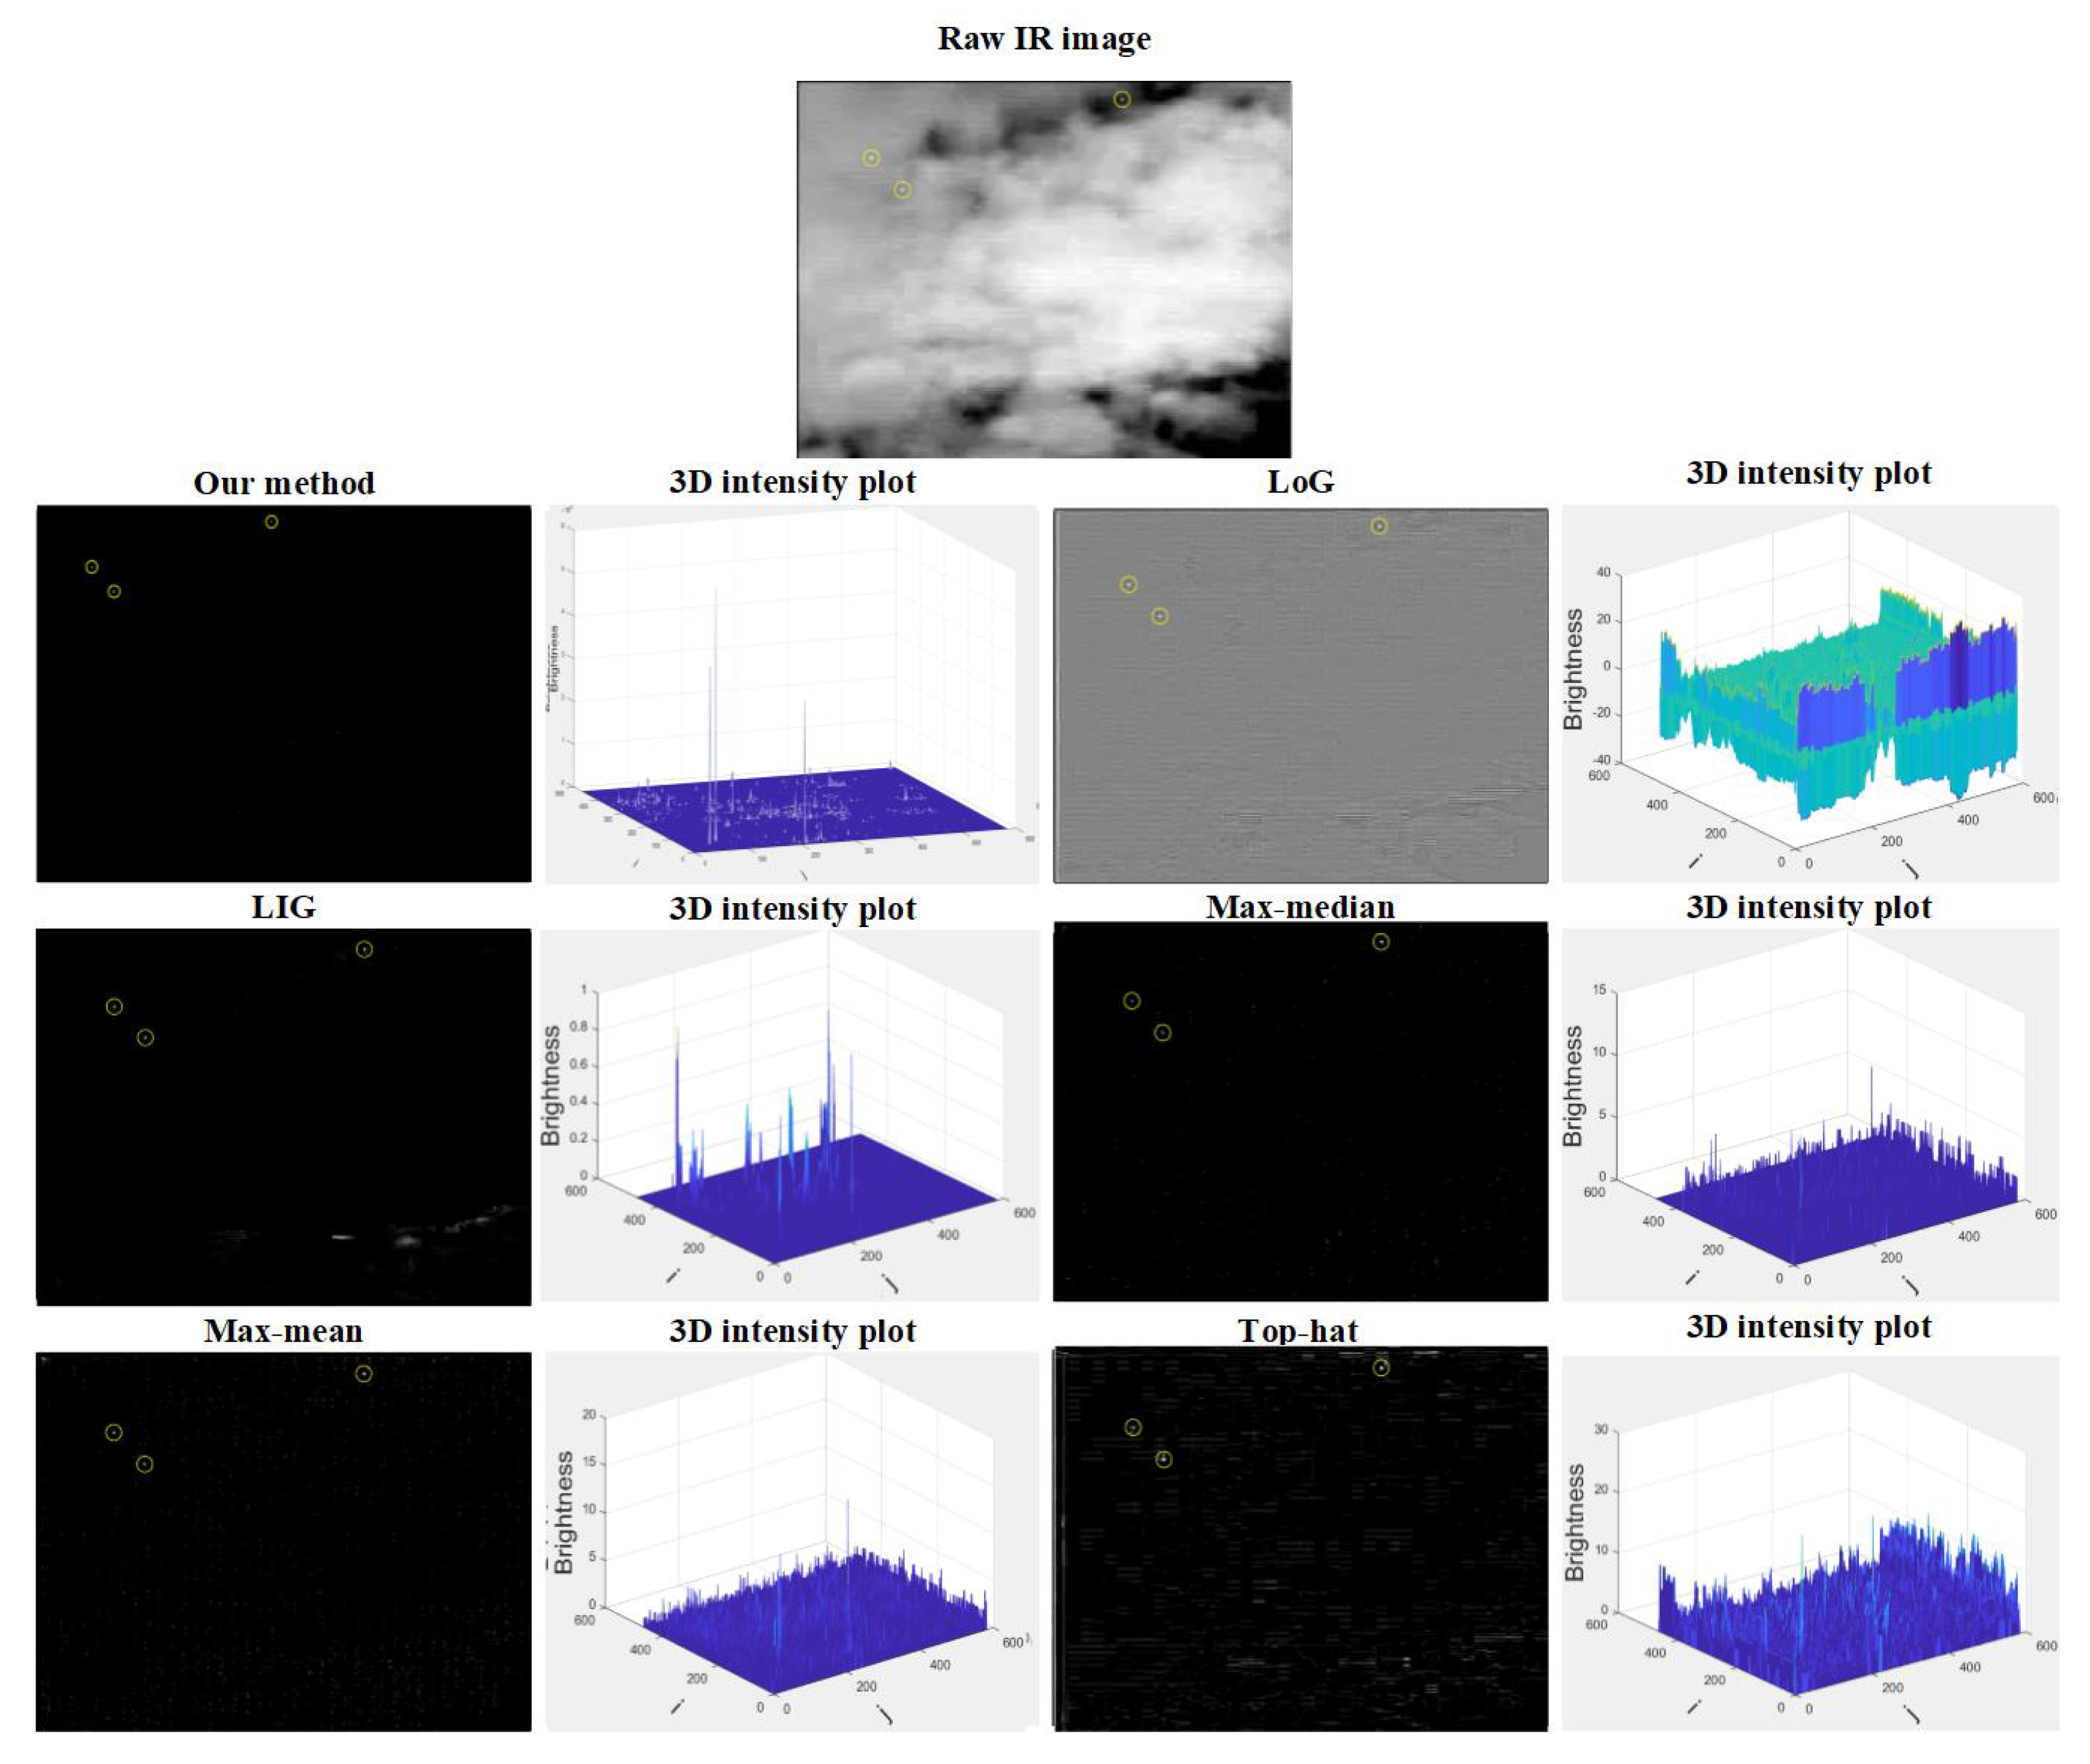
Figure 13.
Detection results on the second image in Seq.4.

Table 1.
Quantitative assessment on Seq.1 (time is the average per image processing time).
| Method | Our Method | RLCM | PCM | Var-Diff | AAGD | LoG | LIG | Max–Median | Max–Mean | Top-Hat |
|---|---|---|---|---|---|---|---|---|---|---|
| 0.9900 | 0.0600 | 0 | 0.2600 | 0 | 0.3500 | 0.8100 | 1 | 0.9900 | 0.9000 | |
| 0.0100 | 0.0500 | 0 | 0.1300 | 0 | 0.2300 | 0.0900 | 0 | 0 | 0.0400 | |
| SCRG | 203.9131 | 0.3930 | 0.0025 | 0.4481 | 0.0055 | 0.0275 | 0.0275 | 0.3577 | 0.2193 | 0.1267 |
| BSF | 113.8130 | 0.0004 | 1.1872 | 0.2359 | 0.0703 | 0.0018 | 0.0018 | 0.00004 | 0.0001 | 0.0004 |
| Time (second) | 1.8572 | 40.3541 | 0.4709 | 0.1362 | 0.1537 | 0.1144 | 7.5586 | 6.8573 | 15.4546 | 0.1023 |
Table 2.
Quantitative assessment of Seq.2.
| Method | Our Method | RLCM | PCM | Var-Diff | AAGD | LoG | LIG | Max–Median | Max–Mean | Top-Hat |
|---|---|---|---|---|---|---|---|---|---|---|
| 0.9688 | 0.3438 | 0 | 0.0313 | 0 | 0.9063 | 0.5313 | 0.8750 | 0.9063 | 0.9063 | |
| 0 | 0.5626 | 0 | 0.8750 | 0 | 0.0625 | 0.3125 | 0.1250 | 0.0625 | 0.0625 | |
| SCRG | 4920.8611 | 0.0029 | 0.0252 | 0.0632 | 0.0030 | 0.0172 | 0.1482 | 0.2515 | 0.0901 | 0.1482 |
| BSF | 612.0357 | 0.0005 | 7.8553 | 2.1969 | 0.1317 | 0.0019 | 0.0009 | 0.0002 | 0.0004 | 0.0009 |
| Time (second) | 0.8690 | 14.6853 | 0.1861 | 0.1057 | 0.1102 | 0.1040 | 2.1391 | 2.0189 | 4.6056 | 0.1294 |
Table 3.
Quantitative assessment of Seq.3.
| Method | Our Method | LoG | LIG | Max–Median | Max–Mean | Top-Hat |
|---|---|---|---|---|---|---|
| 0.9667 | 0.8000 | 0.8667 | 0.7111 | 0.7333 | 0.8444 | |
| 0.0333 | 0.2000 | 0.1333 | 0.2889 | 0.2667 | 0.1556 |
Table 4.
Quantitative assessment of Seq.4.
| Method | Our Method | LoG | LIG | Max–Median | Max–Mean | Top-Hat |
|---|---|---|---|---|---|---|
| 0.6556 | 0.8030 | 0.7396 | 0.5729 | 0.6979 | 0.7369 | |
| 0.3444 | 0.1969 | 0.2604 | 0.4271 | 0.3021 | 0.2604 |
© 2019 by the authors. Licensee MDPI, Basel, Switzerland. This article is an open access article distributed under the terms and conditions of the Creative Commons Attribution (CC BY) license (http://creativecommons.org/licenses/by/4.0/).
Share and Cite
MDPI and ACS Style
Zhang, Y.; Zheng, L.; Zhang, Y. Small Infrared Target Detection via a Mexican-Hat Distribution. Appl. Sci. 2019, 9, 5570. https://doi.org/10.3390/app9245570
AMA Style
Zhang Y, Zheng L, Zhang Y. Small Infrared Target Detection via a Mexican-Hat Distribution. Applied Sciences. 2019; 9(24):5570. https://doi.org/10.3390/app9245570
Chicago/Turabian StyleZhang, Yubo, Liying Zheng, and Yanbo Zhang. 2019. "Small Infrared Target Detection via a Mexican-Hat Distribution" Applied Sciences 9, no. 24: 5570. https://doi.org/10.3390/app9245570
Note that from the first issue of 2016, this journal uses article numbers instead of page numbers. See further details here.