Article

Stepped Spillways and Energy Dissipation: A Non-Uniform Step Length Approach

Civil Engineering Department, Cyprus International University, 99258 Lefkoşa, Turkey
*
Author to whom correspondence should be addressed.
Appl. Sci. 2019, 9(23), 5071; https://doi.org/10.3390/app9235071
Submission received: 4 October 2019 / Revised: 19 November 2019 / Accepted: 20 November 2019 / Published: 24 November 2019
(This article belongs to the Special Issue Advances on Structural Engineering)

Abstract

:
A stepped spillway, which is defined as a spillway with steps on the chute, can be used to improve the energy dissipation of descending water. Although uniform stepped spillways have been studied comprehensively, non-uniform stepped spillways need more attention. In the interest of maximum energy dissipation, in this study, non-uniform stepped spillways were investigated numerically. To this end, within the range of skimming flow, four different types of non-uniform step lengths, including convex, concave, random, and semi-uniform configurations, were tested in InterFOAM. To evaluate the influence of non-uniform step lengths on energy dissipation, the height and number of steps in all models were fixed and equal to a constant number. The results indicated that in semi-uniform stepped spillways, when the ratio between the lengths of the successive steps is 1:3, a vortex interference region occurs within the two adjacent cavities of the entire stepped chute, and as a result, the energy dissipation increases by up to 20%.

1. Introduction

To prevent overtopping and possible failure of a dam, excess water in reservoirs is released by spillways. However, the released water, due to high kinetic energy, can cause erosion downstream [1,2,3]. In general, the effects of erosion are prevented by stilling basins, and hydraulic jumps are employed to protect the structures from erosion hazards [4,5]. The length of the stilling basin located at the foot of the spillway should be kept as short as possible to minimize construction costs. In order to achieve this goal, one possible solution is to consider stepped spillways instead of the traditional smooth spillways. A stepped spillway has a profile made up of steps on the chute, which increases the energy dissipation and in turn helps to reduce the required size of the stilling basin. The energy dissipation occurs by flow recirculation, with or without air entrainment, under the pseudo-bottom caused by the flow on each step [6,7]. Another important feature of stepped spillways is, because of the high turbulence of the flow and the absorbed air from the atmosphere, the risk of cavitation reduces [8,9,10].
The flow over a stepped spillway, with respect to the discharge rate, can be classified into three main regimes: Nappe flow for low discharge rates, skimming flow for higher discharge rates, and a transition regime that can be considered as the upper and lower boundaries of nappe and skimming flow, respectively. The flow regime can be affected by the channel slope and the spillway geometry, such as step height and length [11,12,13]. The amount of energy dissipation is directly related to the flow regime. The largest energy dissipation occurs under the nappe and transition flow regimes, however, these may cause flow instability [2]. Instable flows must be avoided as they can be dangerous due to causing unnecessary vibrations in the structures [11]. Therefore, in general, the hydraulic design of dams is based on the skimming flow regime [14,15,16].
For efficient design, the quantity of energy dissipation in stepped spillways, ΔE/Et, at the end of the stepped spillway is determined, where ΔE is the total head loss (ΔE = Et − Hres) and Et is the maximum upstream head [2,16]. Hres is the residual energy and can be calculated as:
H r e s = y = 0 y 90 ( 1 C ) d y × c o s θ + q w 2 2 × g × ( y = 0 y 90 ( 1 C ) d y ) 2 + Z
where C is the air concentration, y is measured perpendicular to the pseudo-bottom formed by the step edges, y90 is the depth where the local C = 90%, and Z is the step edge elevation above the datum.
Based on the uniform flow condition the amount of energy dissipation of the flow over a step can be calculated [3,15]. The uniform flow condition would imply a long chute with many steps, which may not be a typical form of stepped structure [13]. In the present study, due to the limited chute length, the energy dissipation was calculated in the absence of a uniform equilibrium flow condition.
The effect of the slope on energy dissipation for stepped spillways with uniform flat horizontal steps has been investigated, mostly by experimental studies [2,3,7,9,13,15,17,18,19,20,21]. Experiments indicated that the energy loss due to the steps depends on the ratio of the critical flow depth (dc) to the step height (h), and the number of steps, N. When the value of dc/h approaches one, near the limit of the skimming flow, the energy dissipation will be significantly affected by the stepped surface [22]. For higher values of dc/h, the effect of N becomes appreciable and at a certain dc/h, and the energy dissipation improves as N increases [13,22].
In the literature, there are few experimental studies that have focused on the flow over non-uniform stepped spillways. Stephenson [23] studied the energy dissipation on a stepped spillway with non-uniform step heights. He found an increase of 10% in the energy dissipation compared to uniform steps. On the other hand, Felder and Chanson [10,24] investigated the effect of uniform and non-uniform step heights on the energy dissipation performance, and showed that there was no significant difference between the two configurations. Li et al. [25] studied the energy dissipation due to non-uniform-height steps in curved spillways. Their results show that, compared to the smooth spillway, the water flow from the concave bank to the convex bank increased the energy dissipation by up to 66%.
In addition to these experimental studies, flow on stepped spillways have been modeled numerically with a high degree of accuracy using computational fluid dynamics (CFD). In numerical studies of stepped spillways, the flow over the stepped spillway is investigated by the volume of fluid (VOF) method, with turbulence closures of the k-ε family [26,27,28,29,30,31,32,33,34,35]. For instance, Wan et al. [36] have used VOF and the realizable k-ε model to determine the inception point of air entrainment in various stepped spillways, including flat steps, pooled steps, and round steps. Their results indicated that as the step height decreases, the air entrainment decreases, and with respect to aeration, the round stepped spillway was the optimum design.
The above mentioned experimental and numerical studies have investigated the energy dissipation of uniform stepped spillways for different slopes, numbers of steps, and discharges. In this study, the effect of non-uniform step length on the energy dissipation was investigated. To evaluate the performance of non-uniform step lengths on energy dissipation, the height and the number of steps in all models were fixed and equal to a constant number. Numerical analysis was performed by the InterFOAM solver in the OpenFOAM package, using the VOF method and the realizable k-ε model. The main aims of the presented study were:
  • To investigate the effect of uniform step length on the energy dissipation for different slopes.
  • To investigate the effect of non-uniform step length on the energy dissipation for four different cases:
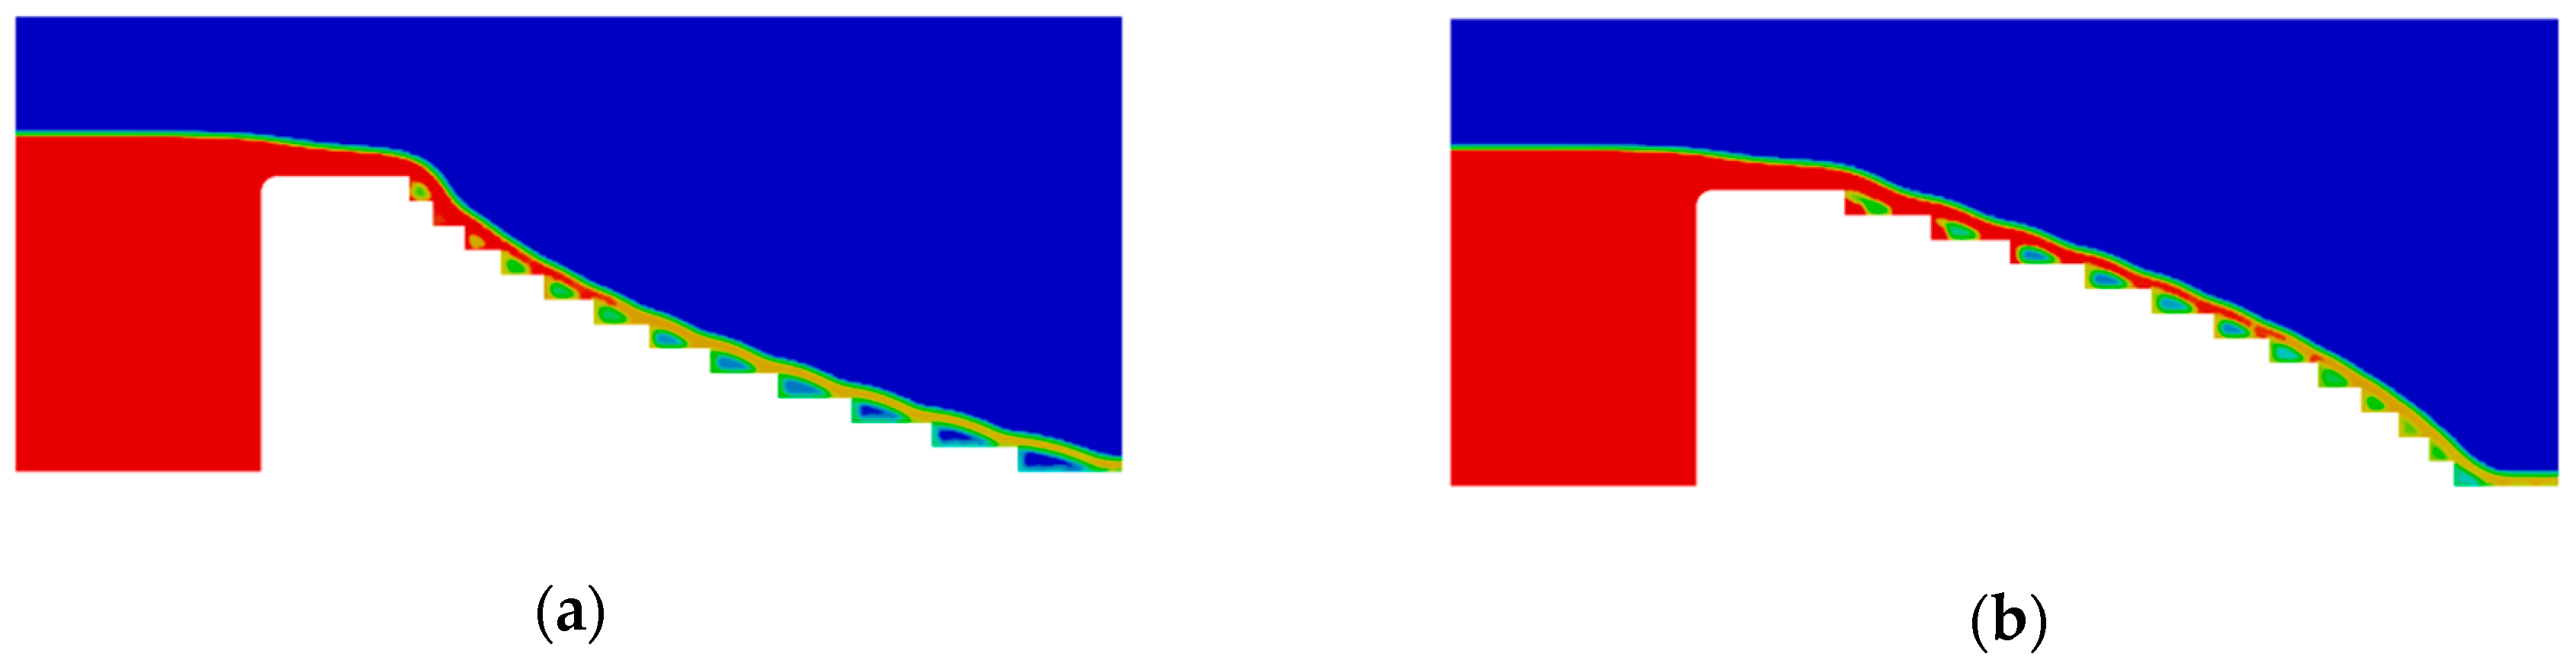
  • Longer steps in the beginning, with the step length decreasing progressively toward the end (convex configuration).
  • Shorter steps in the beginning, with the step length increasing progressively toward the end (concave configuration).
  • Random step length distribution
  • Semi-uniform step length distribution
  • Investigation of the optimum step length configuration with respect to energy dissipation.

2. Materials and Methods

One of the main features of a stepped spillway is the air entrainment that causes a two-phase flow. To analyze two-phase flows in OpenFOAM, VOF can be used where, for a fixed Eulerian mesh, based on each fluid fraction, all the variables in every volume are weighted. One of the advantages of the VOF method is that a simple fluid model can be developed using a single equation [26,28,37]. To this end, the continuity equation for the volume fraction of water can be presented as:
α w t + ( u α w ) = 0
where αw is the fraction of water and t is time. In the VOF model, as the water and air phases share the same velocity and pressure field, the two-phase flow can be considered as a single-phase flow, where the realizable k-ε turbulence is homogeneous. By solving Equation (2), the free surface of water can be determined. In all the computational cells, the αw and the fraction of air (αa) is considered as: α a = 1 α w , therefore, the density (ρ) and the molecular (µ) viscosity can be described as:
ρ = α w ρ w + ( 1 α w ) ρ a
μ = α w μ w + ( 1 α w ) μ a
where ρw and ρa are the density and μ w and μ a are the molecular viscosity of water and air, respectively. The maximum and minimum values of αw, one and zero, indicate that the given cell is filled entirely with water or air, respectively.
With the help of the Reynolds-averaged Navier–Stokes (RANS) equations [38], a two-phase flow is described in terms of a single velocity and pressure field that can be solved by the InterFoam solver based on the VOF phase fraction.
. u = 0
t ( ρ u ) + . ( ρ u u ) . ( μ e f f u ) = p * g h * ρ + F
where u is the mean component of the velocities, ρ is the density, p* is the modified pressure, g and h* are the gravitational acceleration and position vectors, F is the volumetric surface tension force, μ e f f = ( μ + μ t ) , μ is the molecular viscosity, and μ t is the turbulence viscosity term, which can be calculated by the turbulent model.
In order to model the flow over a stepped spillway by Equations (5) and (6), a turbulence closure is required. There are several turbulence closures available in the OpenFOAM toolbox (standard k-ε, realizable k-ε, RNG k-ε, standard-k-ω, SST-k-ω model, etc.). Herein, the performance of two common turbulence models, including the realizable k-ε and RNG k-ε, were numerically evaluated to determine which turbulence model is more applicable.
The realizable k-ε model is based on the two equations for k (turbulent kinetic energy) and ε (rate of viscous dissipation), respectively.
t ( ρ k ) + . ( ρ k u ) = . [ ( μ + μ t σ k ) k ] + G k + G b ρ ε + S K
t ( ρ ε ) + ( ρ ε u ) = [ ( μ + μ t σ ε ) ε ] + ρ C 1 S ε ρ C 2 ε 2 k + υ ε + C 1 ε ε k C 3 ε G b + S ε C 1 = m a x [ 0.43 η η + 5 ] ,   η = S k ε , S = ( 2 S i j S i j ) 0.5
where Gk and Gb are the generation of turbulent kinetic energy by the mean velocity gradients and buoyancy, respectively, S is the strain rate tensor, Sk and Sε are the source terms for the kinetic energy and dissipation rate, respectively, and σk, σε, C1, C2, C1ε, and C3ε are the adjustable constants.
All the models that have been numerically investigated in this article are described in Table 1 and Table 2.

2.1. Numerical Schemes

InterFoam uses the PIMPLE algorithm, a combination of the semi-implicit method for pressure-linked equations (SIMPLE) and the pressure-implicit with splitting of operators (PISO) algorithm, to solve the coupled system of equations in a segregated process utilizing an iterative sequence [39]. The convective terms within the momentum were discretized using the Gauss linear upwind method. The temporal term was discretized by a first-order implicit Euler scheme, while a Gauss linear corrected interpolation was used to discretize the Laplacian term [26].

2.2. Boundary Conditions

For all models investigated in this article, four boundary conditions were defined as follows:
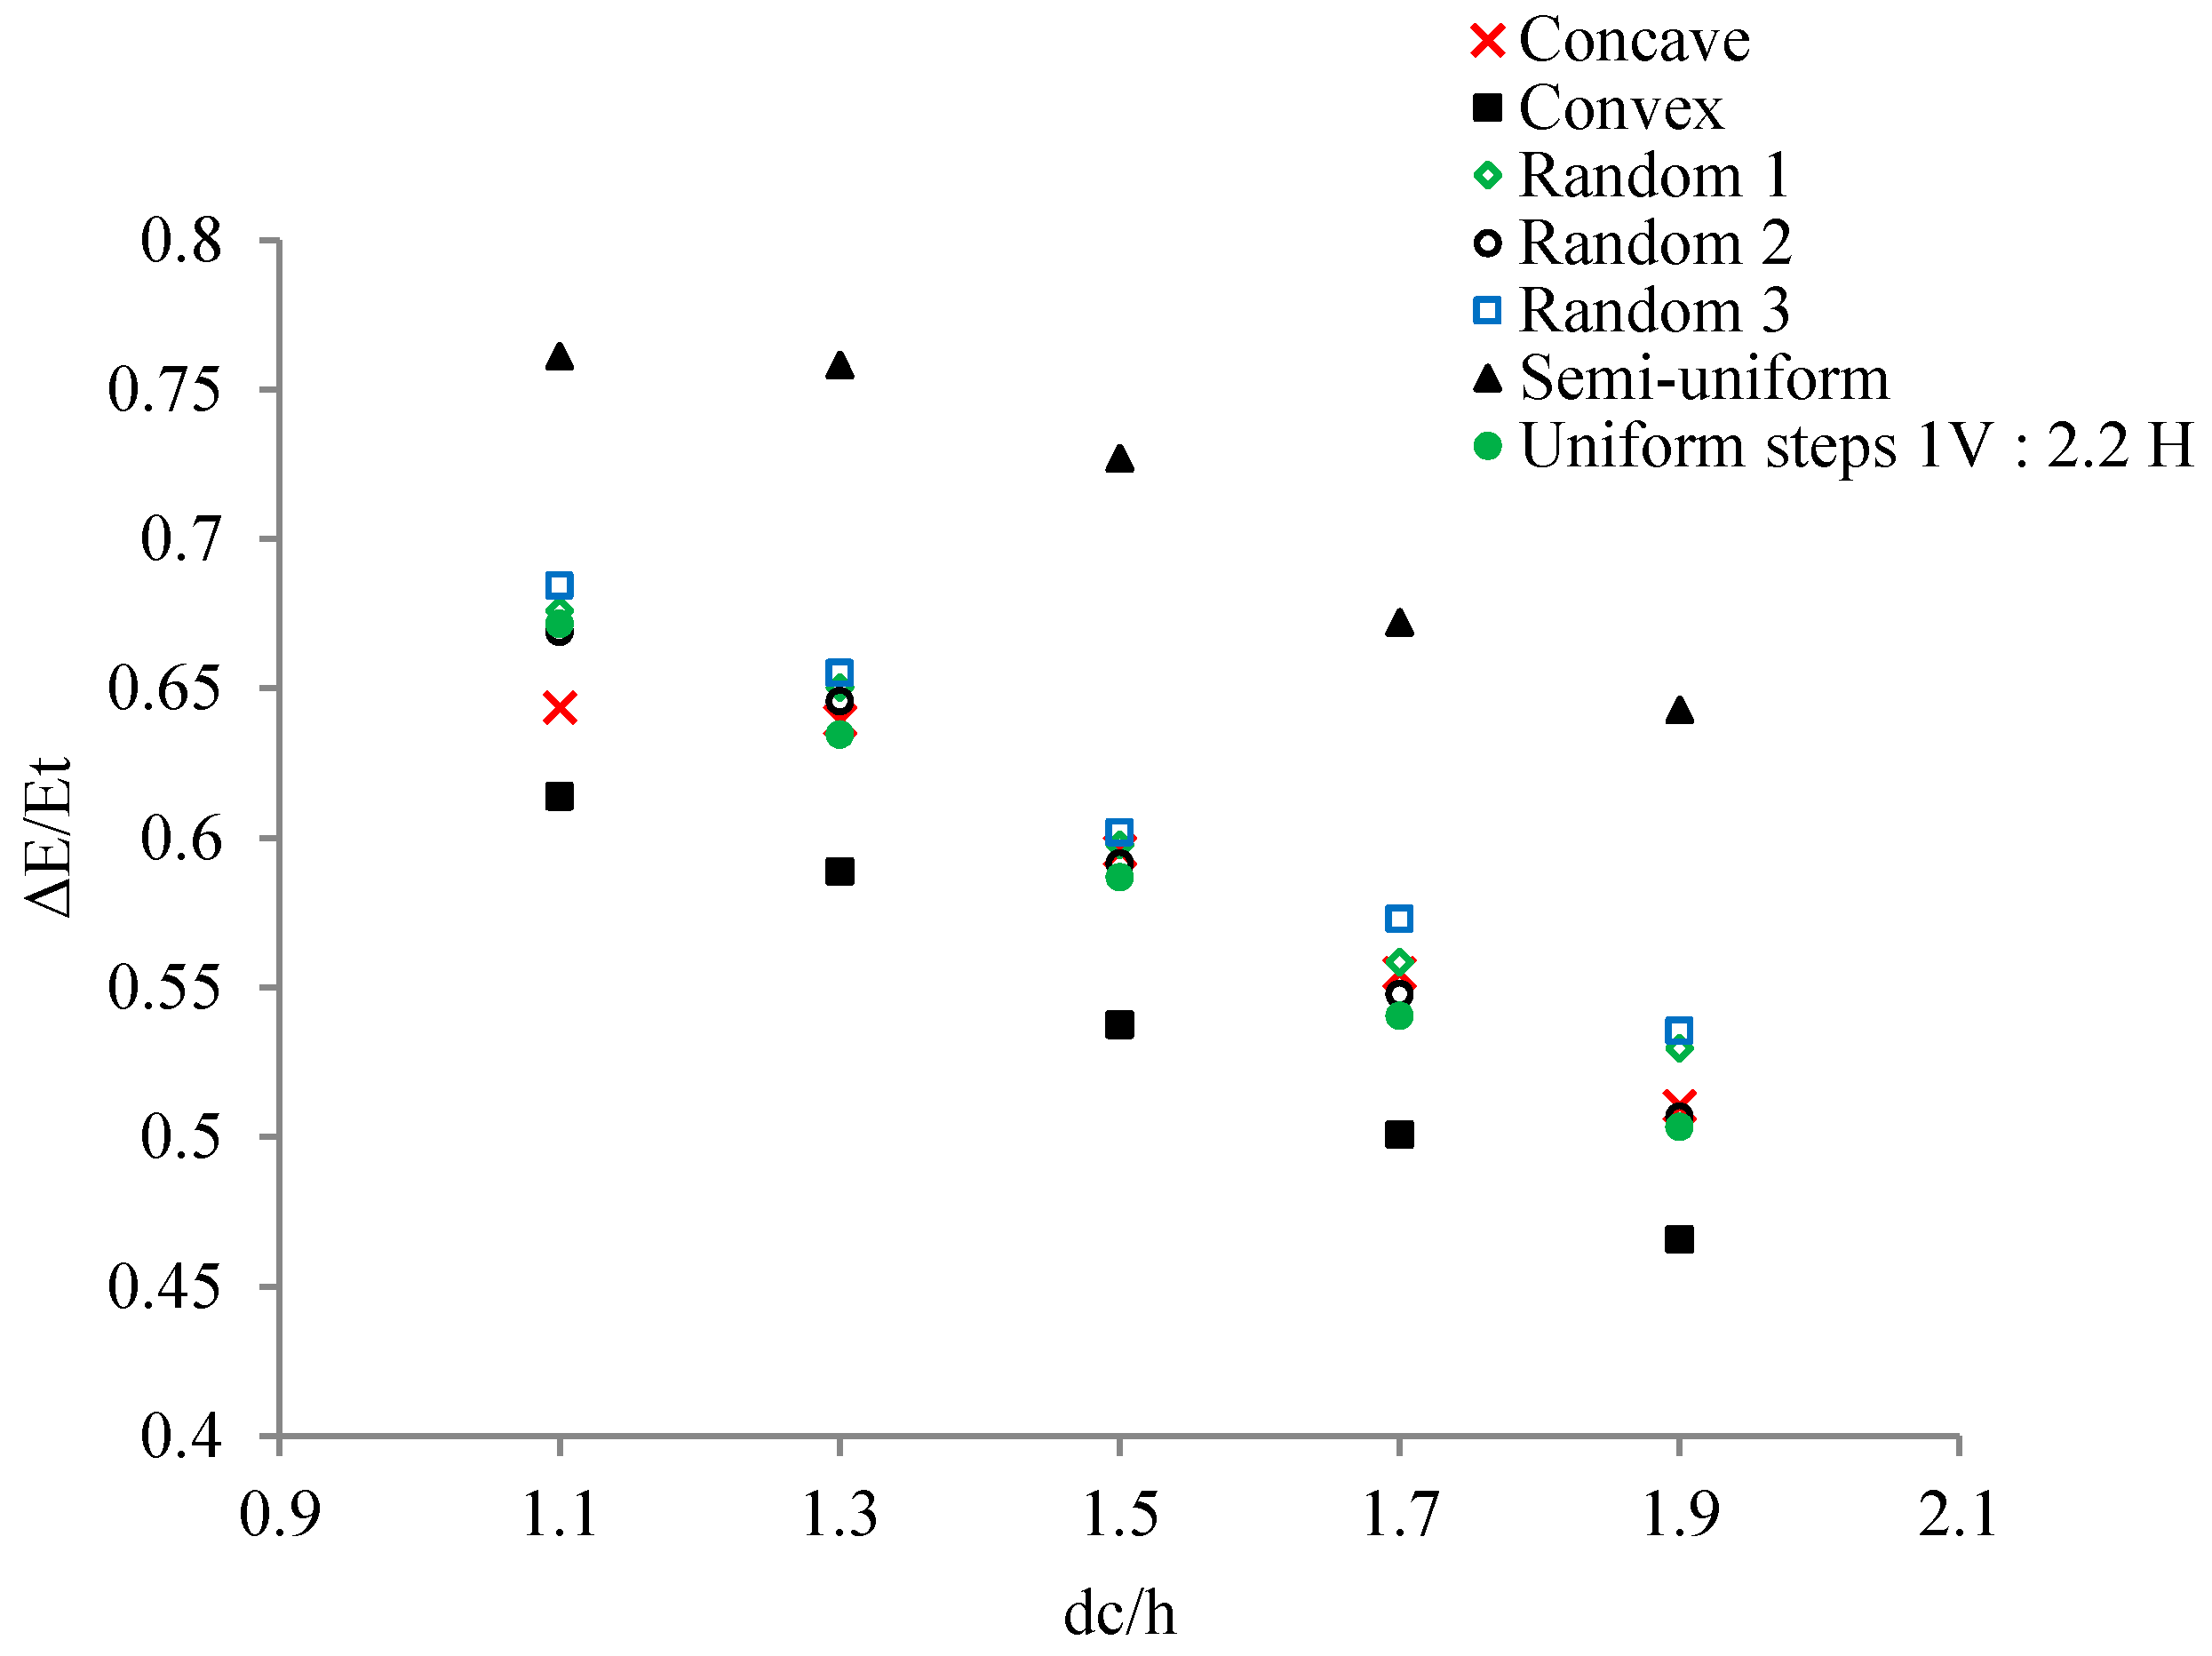
  • The water inflow boundary was set as a velocity-inlet condition and obtained based on the range of flow rates 1.1 ≤ dc/h ≤ 1.9. The term (dc/h) represents the ratio of the critical depth (dc) to step height (h), in which critical depth is representative of the discharge.
  • The outlet boundary condition was defined as an outlet pressure to allow the water flow out freely.
  • The walls were assumed to have a no-slip condition.
  • As shown in Figure 1, the atmospheric pressure was considered at the free surface boundary.
After validating the proposed numerical model by the experimental results obtained by Zhang and Chanson [40] and Felder [2], different uniform and non-uniform stepped spillways were investigated and, as shown in Figure 2, the optimized design was selected.

3. Results and Discussion

3.1. Mesh-Independence Test and Model Validation

The meshed domain was defined as a 2-D CFD model of flow over a stepped spillway. The meshes were created using the GMSH software. The grid convergence index (GCI) suggested by Roache [41] was employed to ensure grid independence, and three different mesh types from dense to coarse were tested. The mesh types were considered as: Mesh one with dimensions 0.0075 by 0.0075 m2, Mesh two with dimensions 0.01 by 0.01 m2, and Mesh three with dimensions 0.0133 by 0.0133 m2.
The grid refinement factor, which can be defined as r21 = Δh2/Δh1 and r32 = Δh3/Δh2, where Δh is a representative grid size, was 1.33, which is more than the recommended minimum value of 1.3 [42]. The water free surface and velocity profiles of the three mesh sizes mentioned here were compared with each other, and the results are shown in Figure 3.
In Figure 3c, the maximum GCI21 at step six and step nine were 5.25% and 3.92%, respectively, corresponding to velocities of 2.697 m/s and 2.909 m/s, respectively. Along the whole spillway, the mean GCI21 was less than 5%. As the results obtained from Mesh two and Mesh one were similar, to improve the modelling time, the grid size of Mesh two was selected.
The proposed numerical model was validated through the experimental data obtained from Zhang and Chanson [40] by comparing the free surface profiles, velocity distribution, and energy dissipation. The physical model of Zhang and Chanson [40] is a large-size step spillway (1V:1H), with 12 steps with the height of 0.1 and the length of 0.1 m. The different volumetric flow rates were controlled by a broad crested weir.

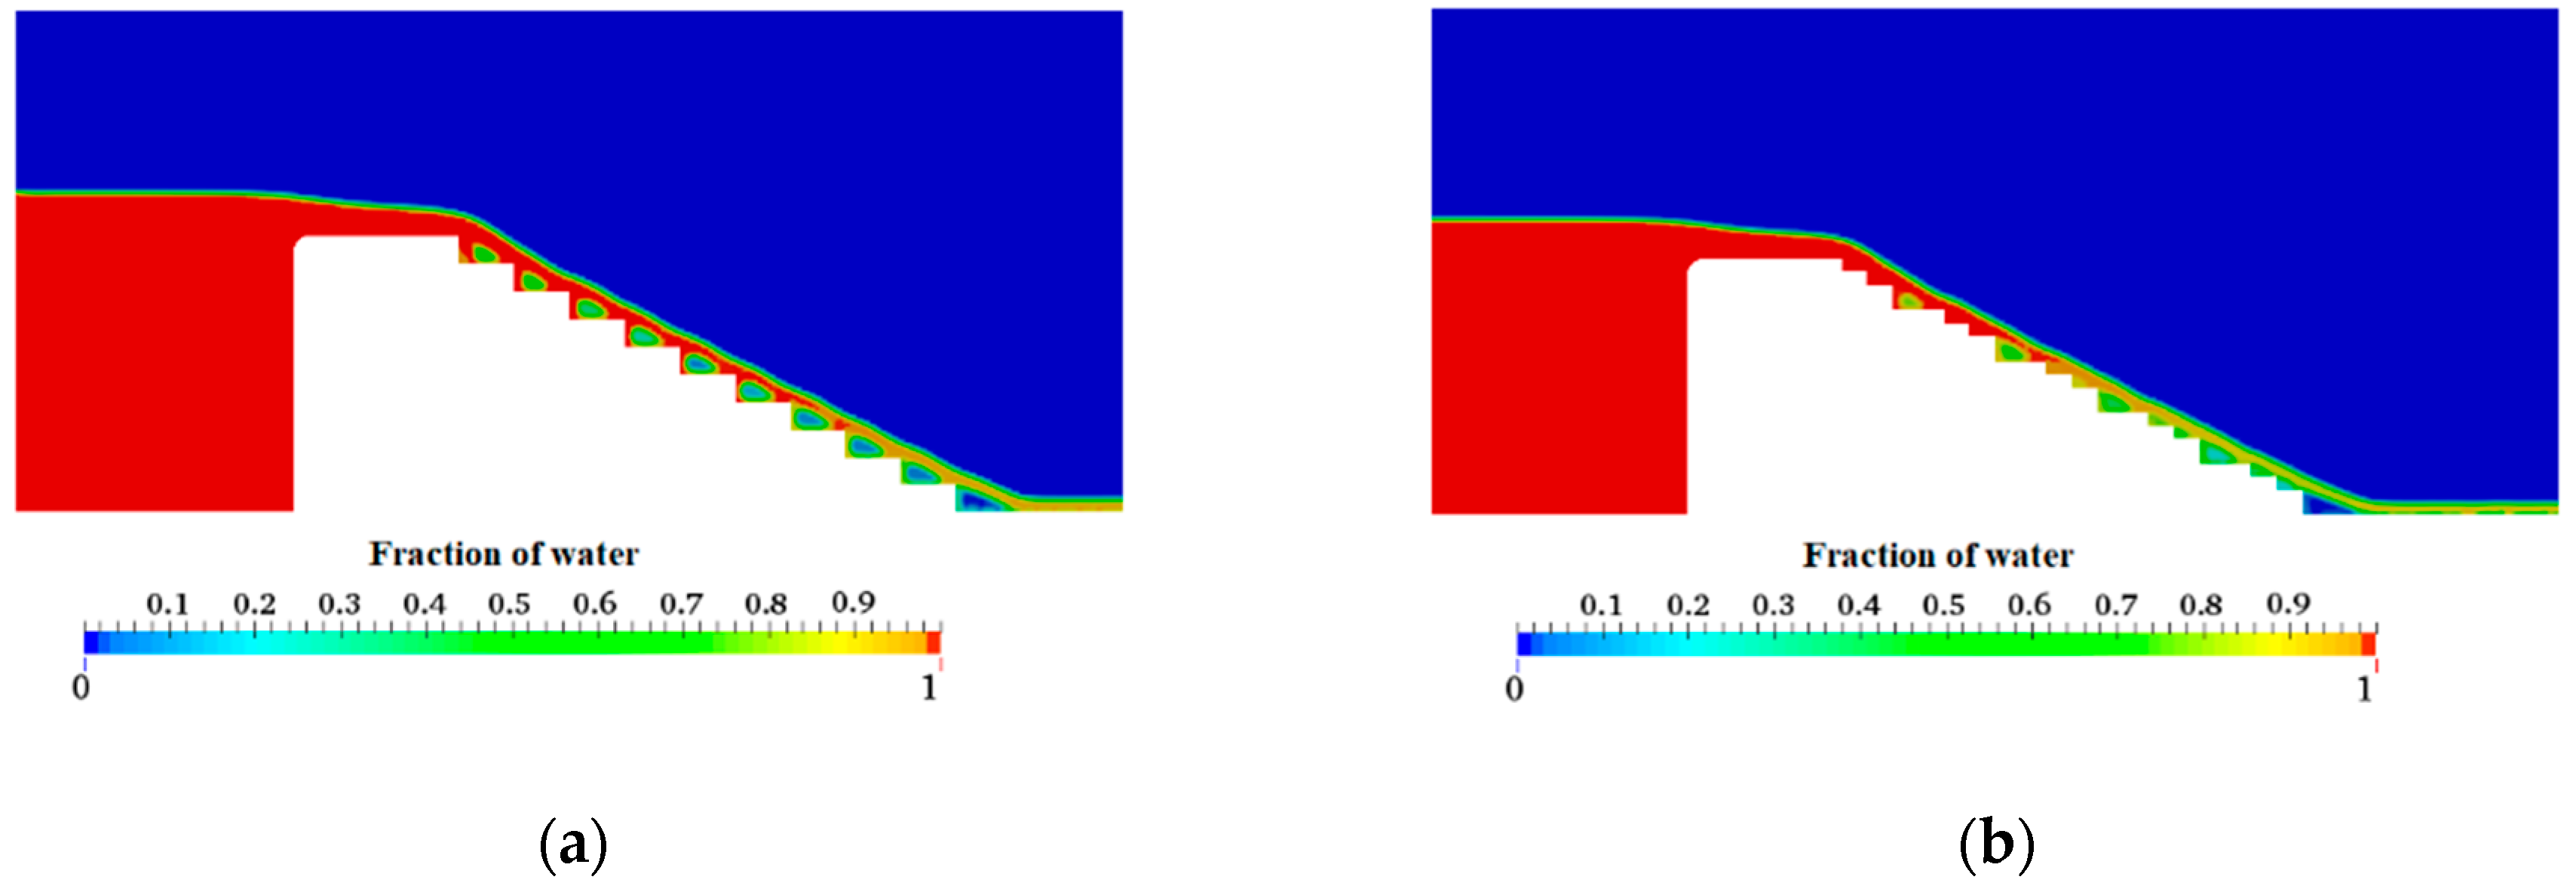
3.1.1. Free Surface Profiles

A standard practice for the VOF approach is to determine the numerical water depth at the position where the volume fraction α = 0.5 [26]. As shown in Figure 4, for different values of discharge (0.008 ≤ Q ≤ 0.250 m3/s), the simulated water surface profiles over a broad-crested weir length (Lcrest) are very similar to the experimental values.

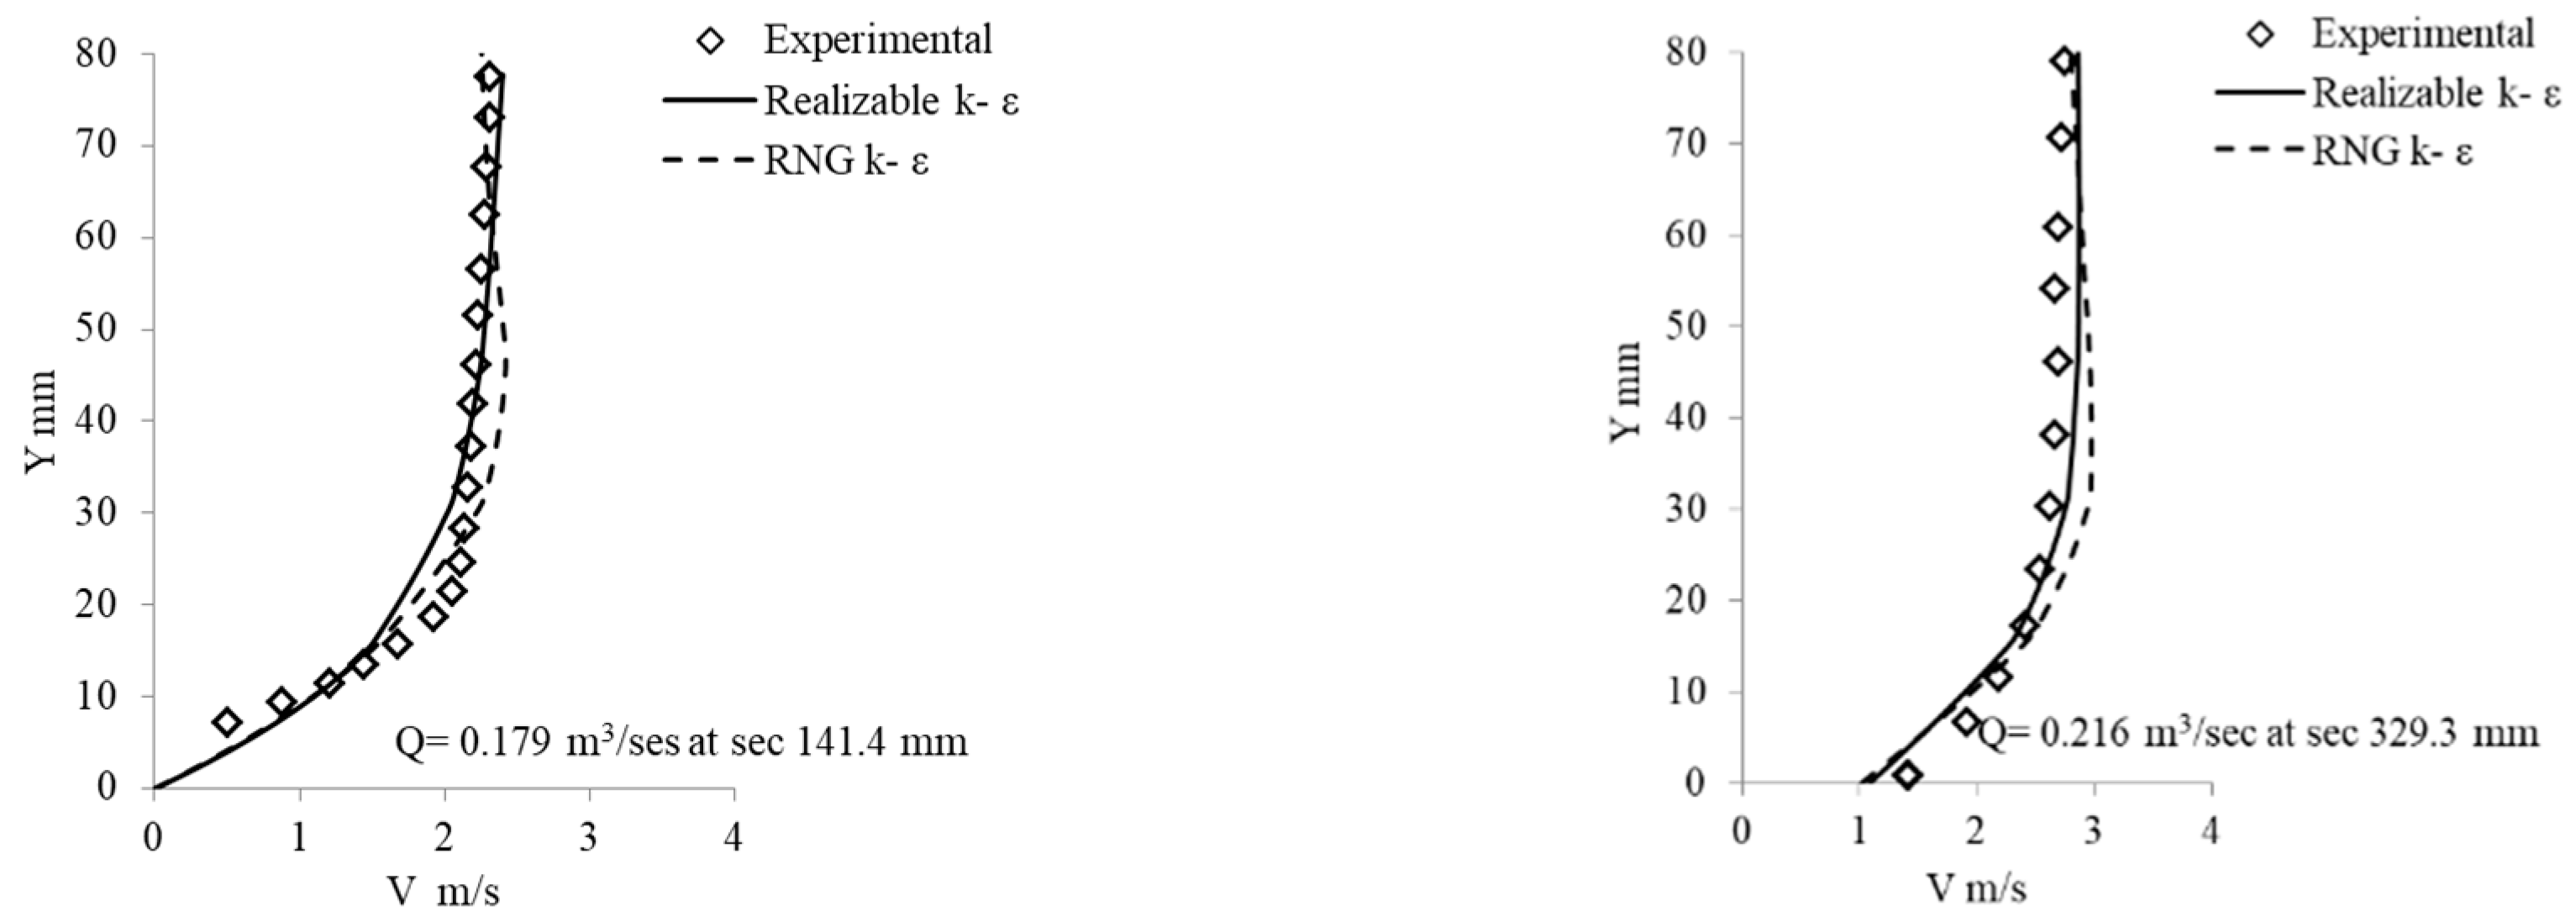
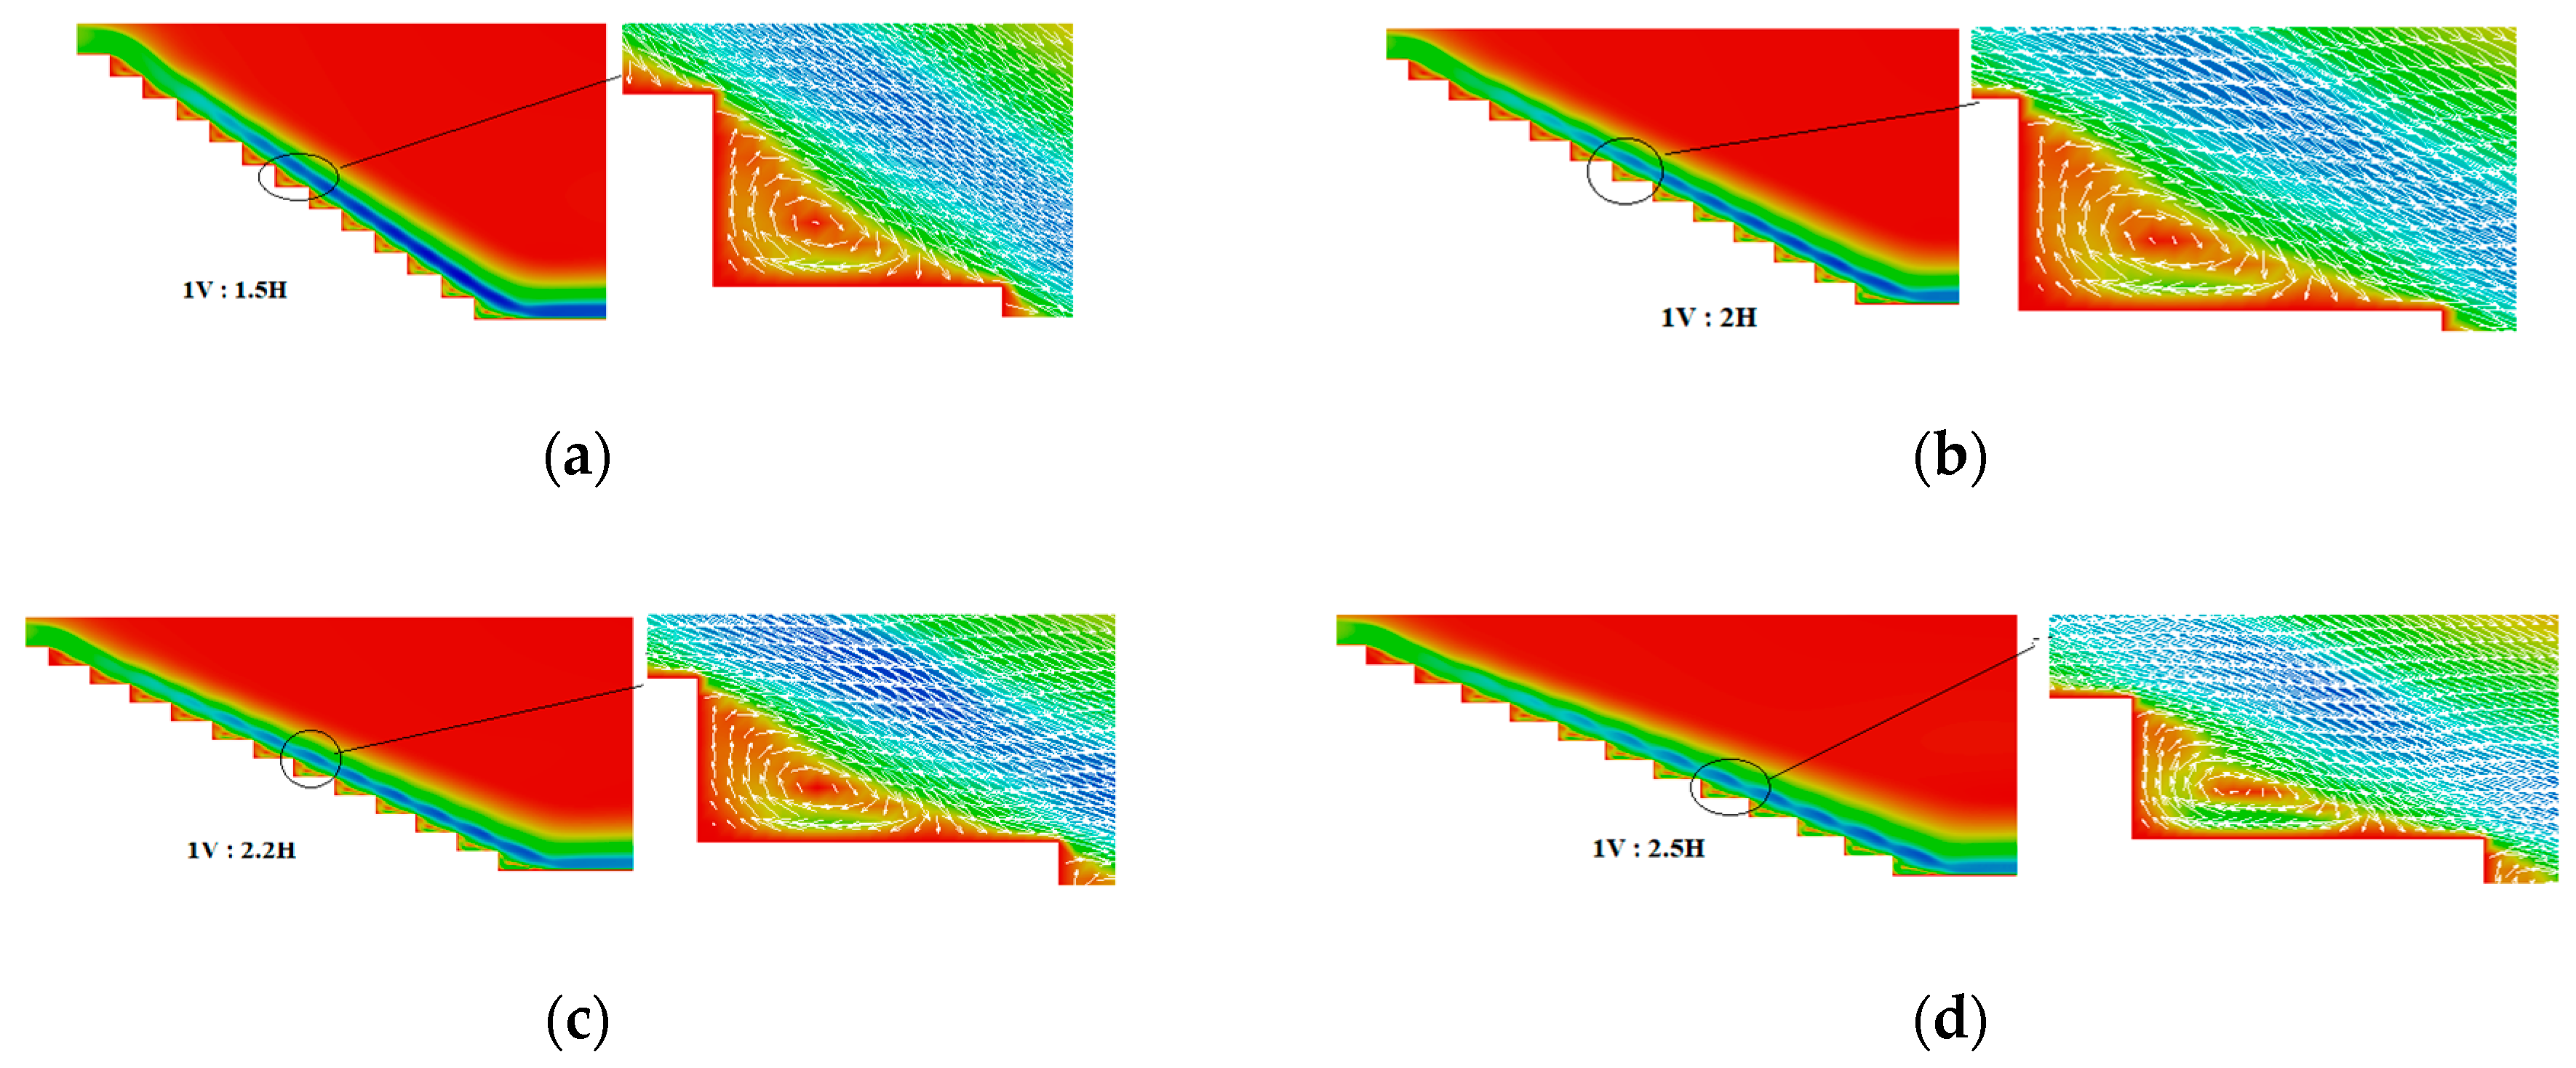
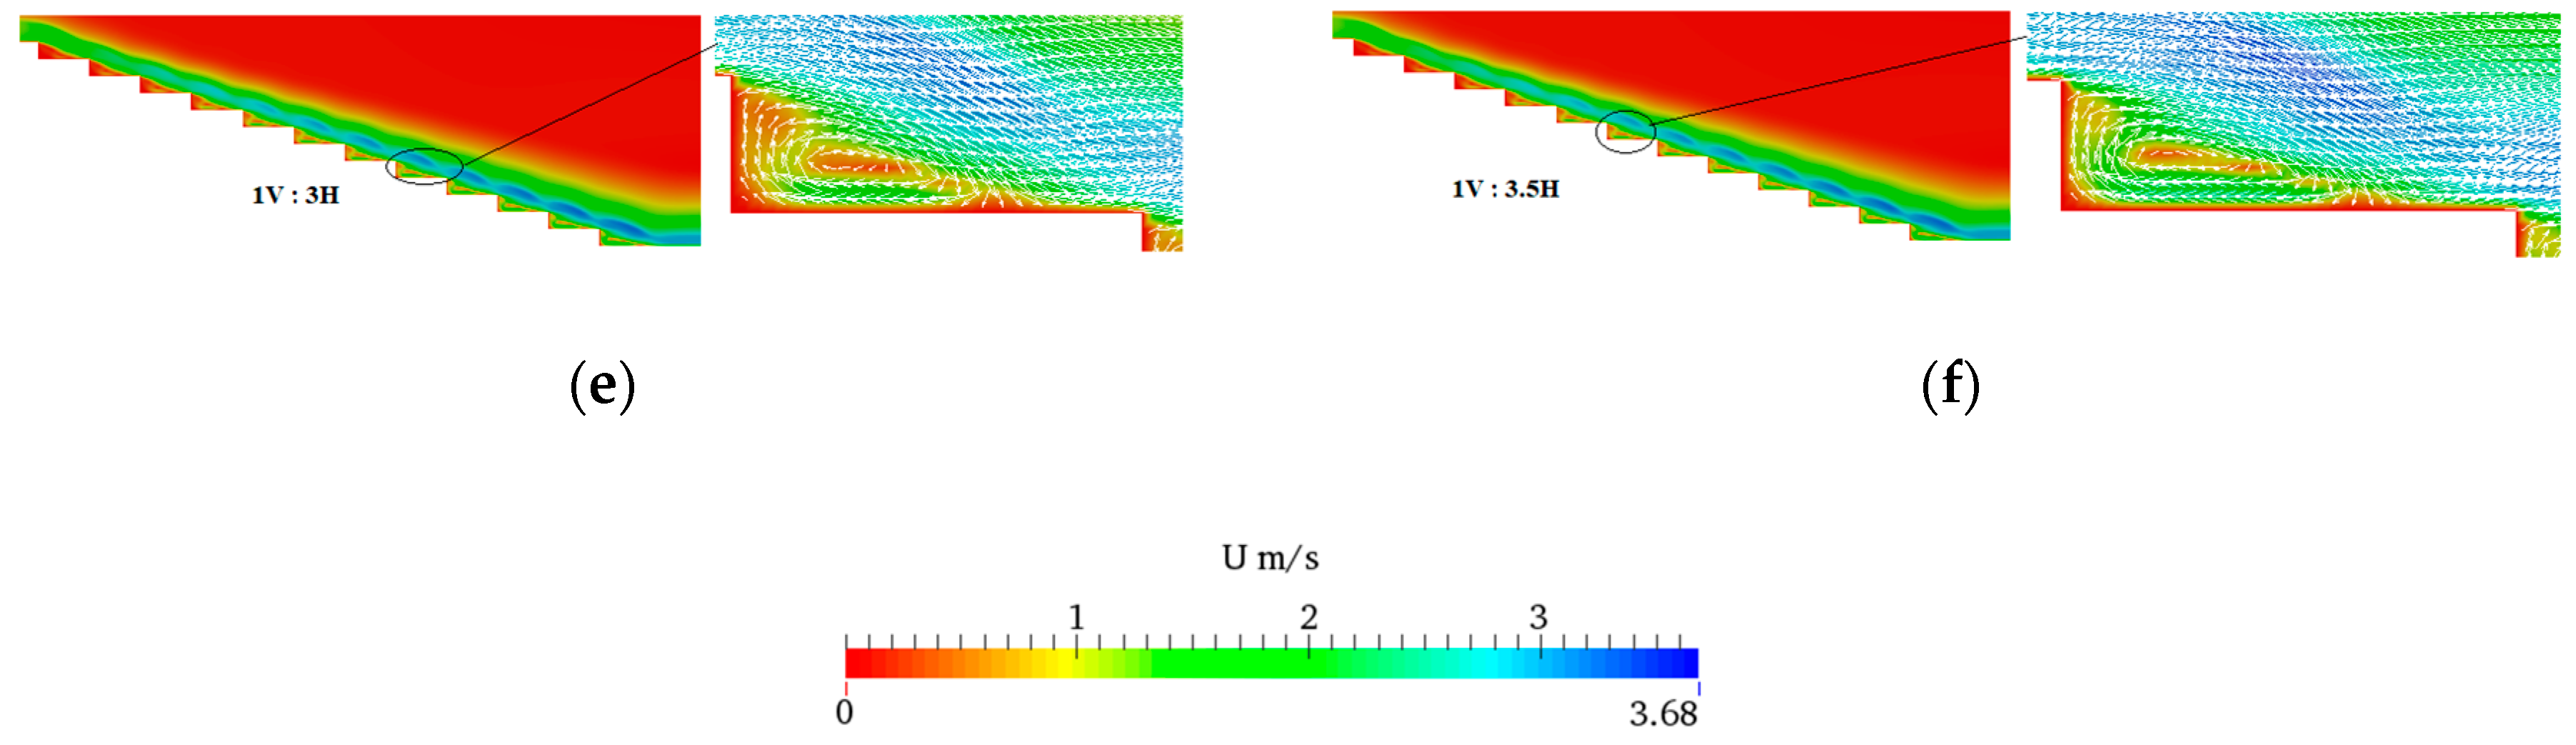
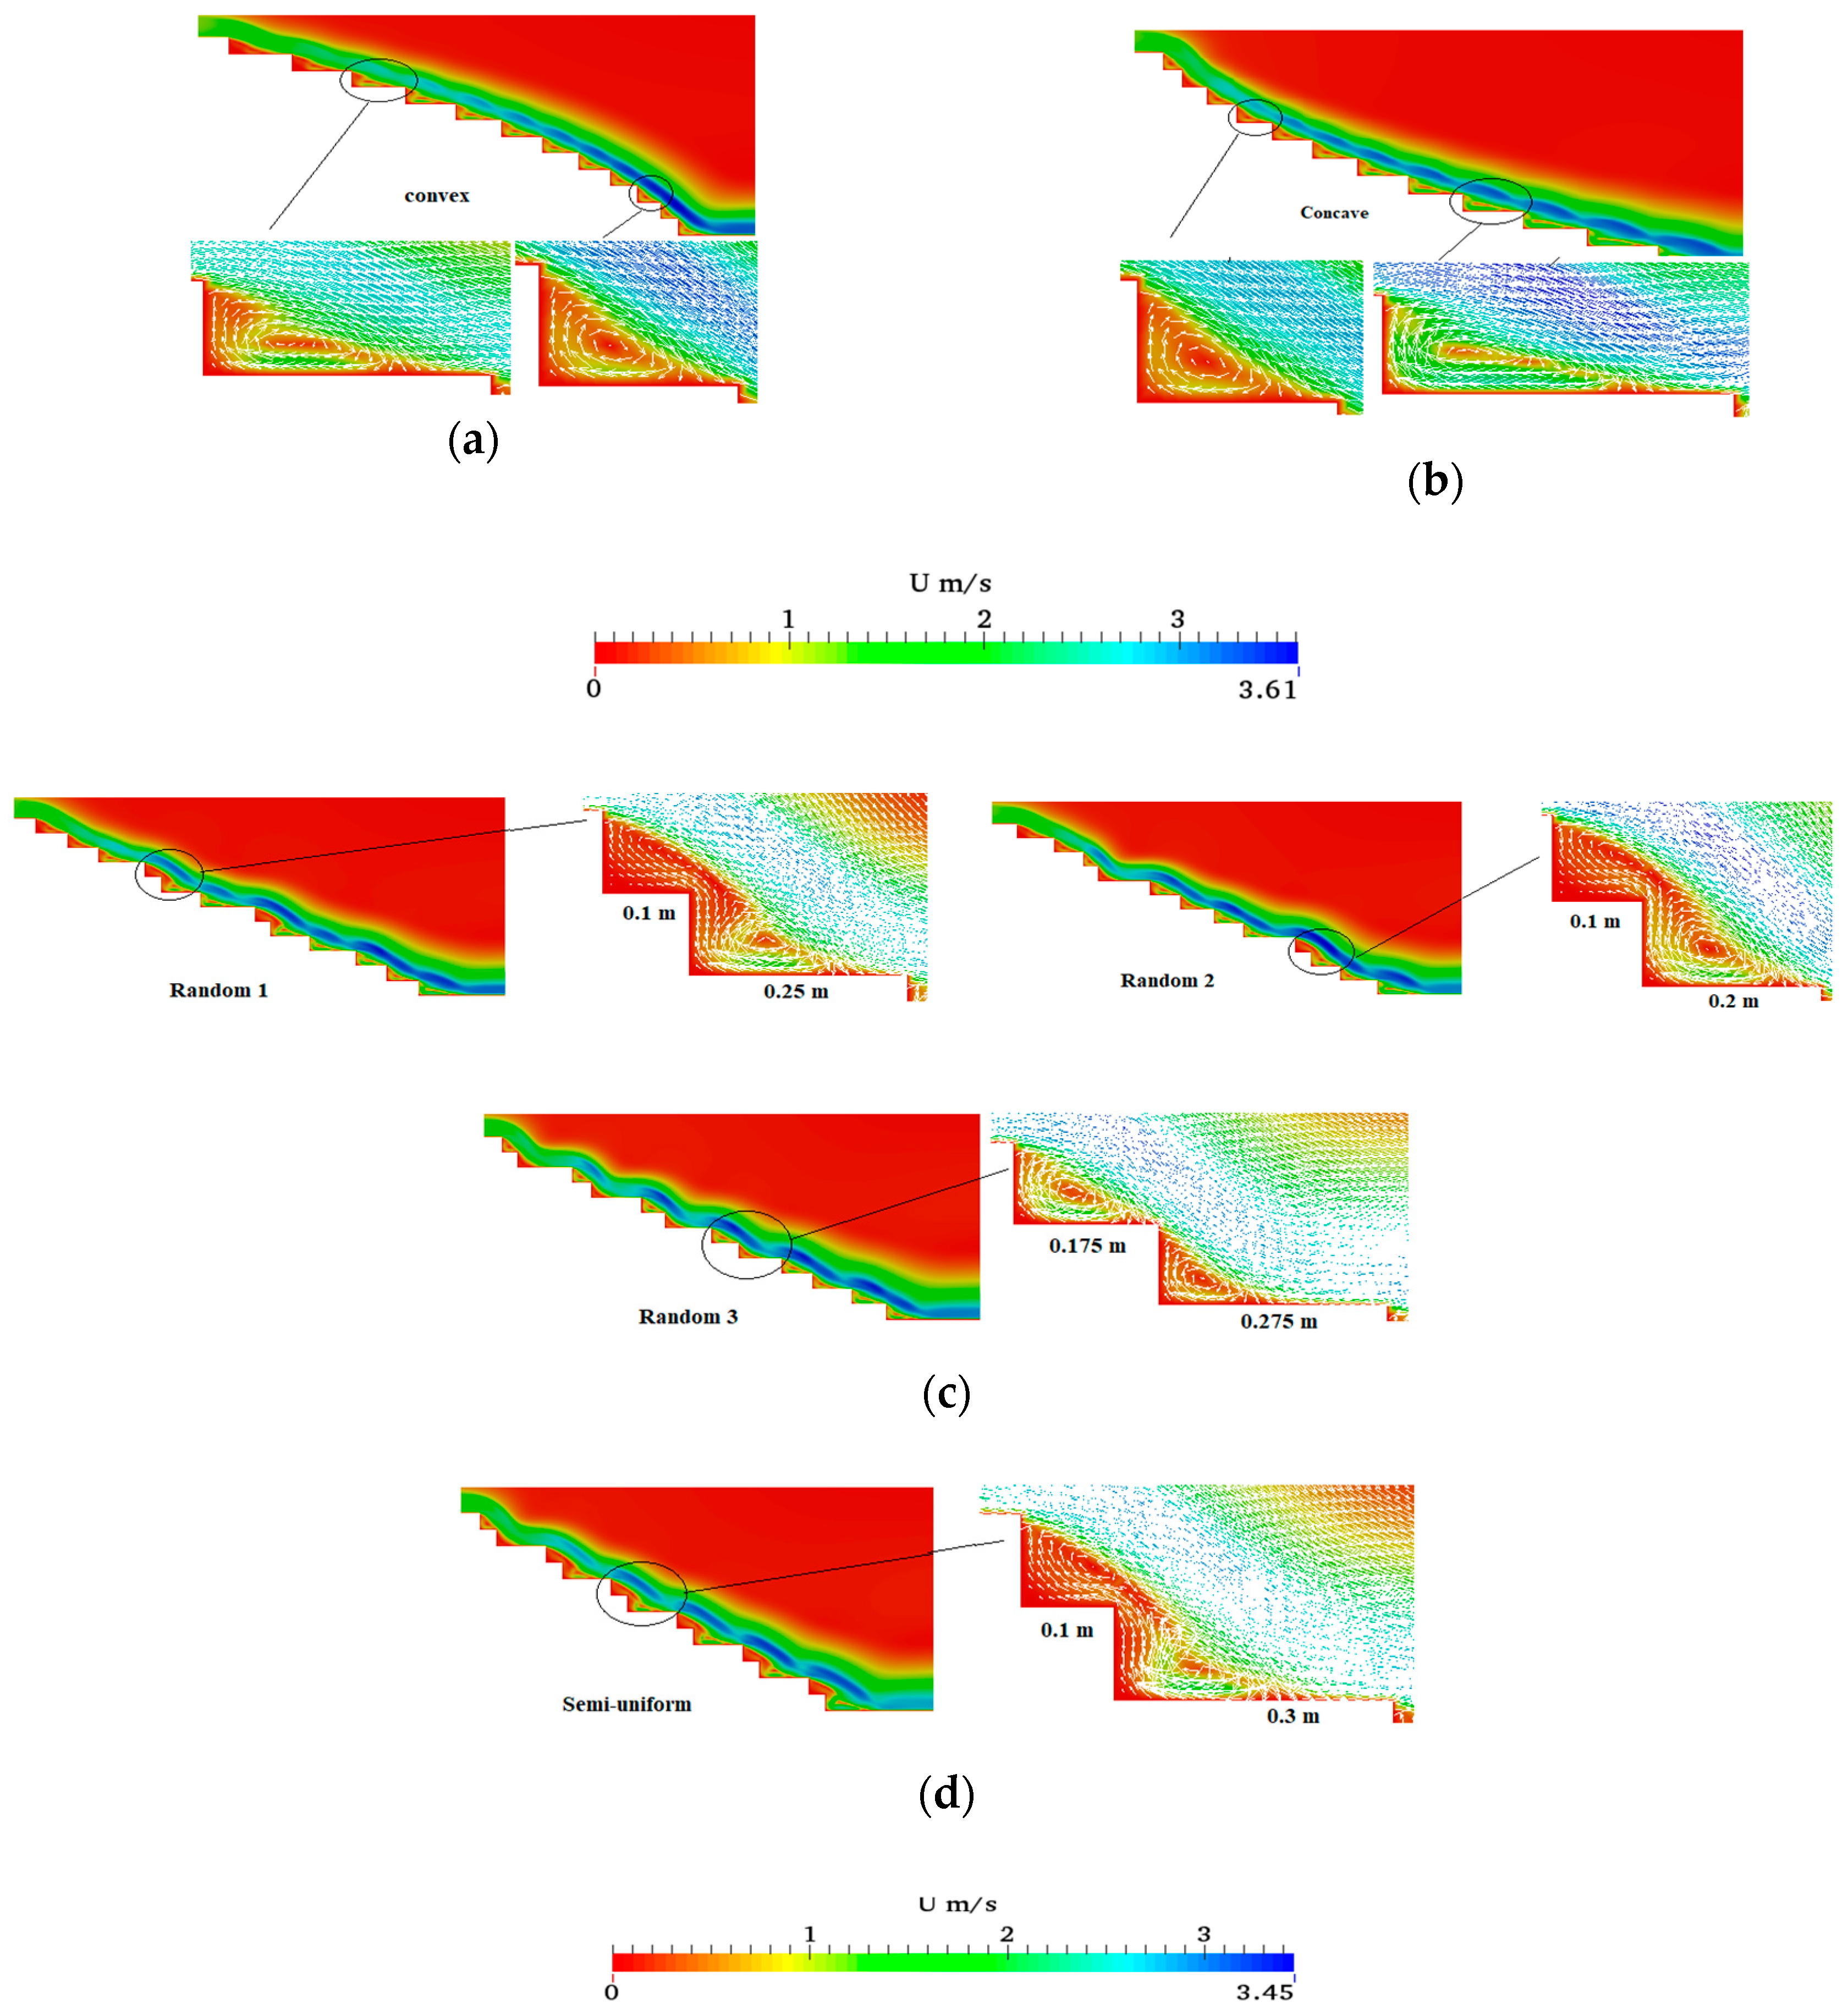
3.1.2. Velocity Distribution

In Figure 5, a comparison of the velocity profiles between the experimental and numerical results at some longitudinal stations with different discharges by using the realizable k-ε and RNG k-ε models is shown. The results revealed that the realizable k-ε model is the most efficient. The same result was reported in the literature as well [26,30,43,44].
Figure 6 shows the water volume fraction and the velocity vector distribution of flow along the chute. The velocity vectors rotate clockwise above the horizontal face of the step, and the velocity increases from the center of the vortices to the flow surface. Hence, most of the energy dissipation is by recirculation flow under the pseudo-bottom [2,9,45].

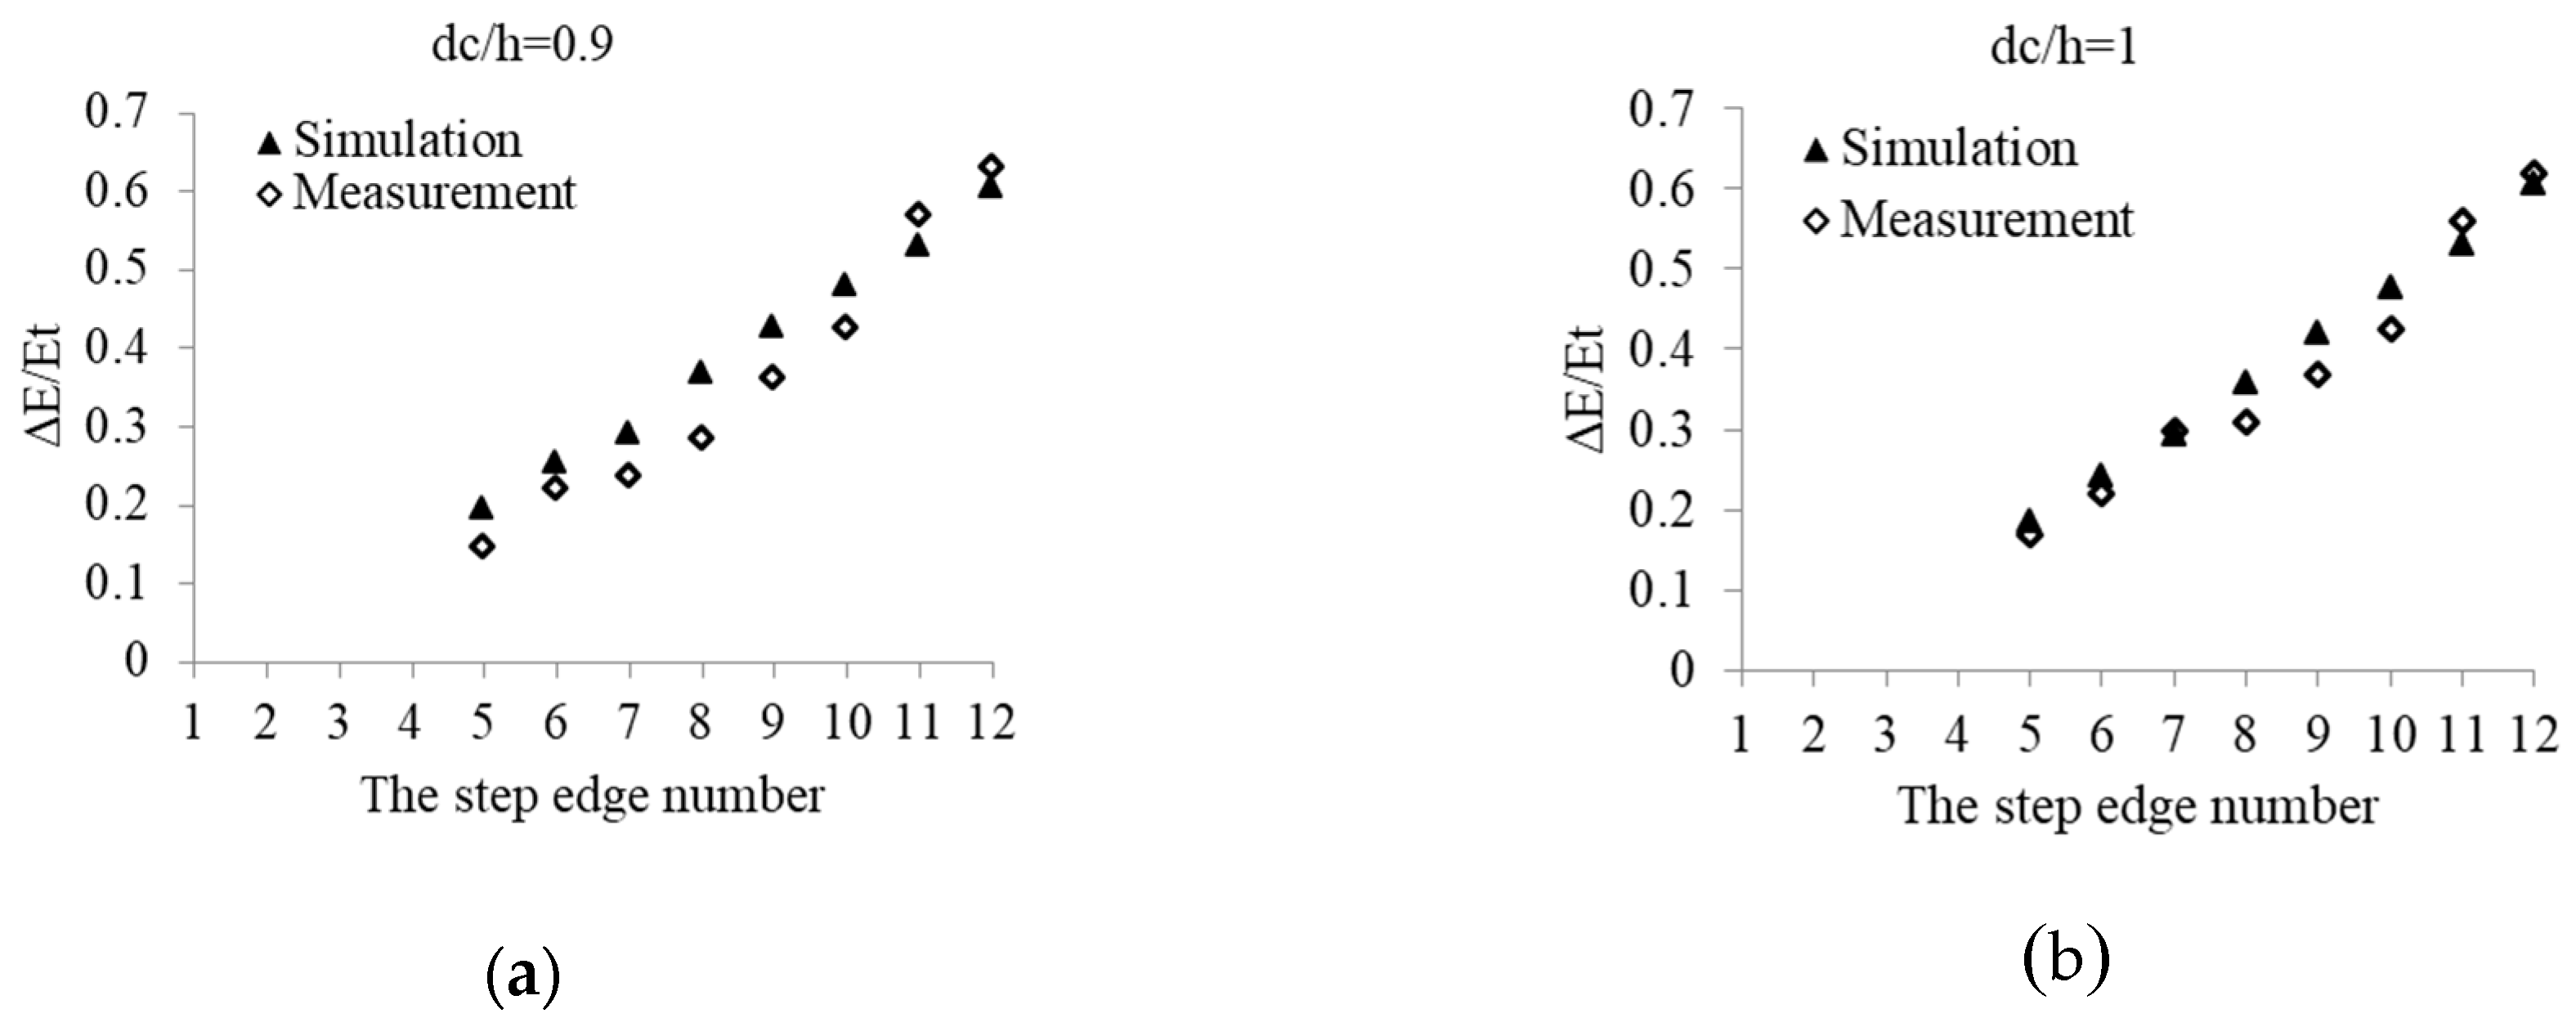
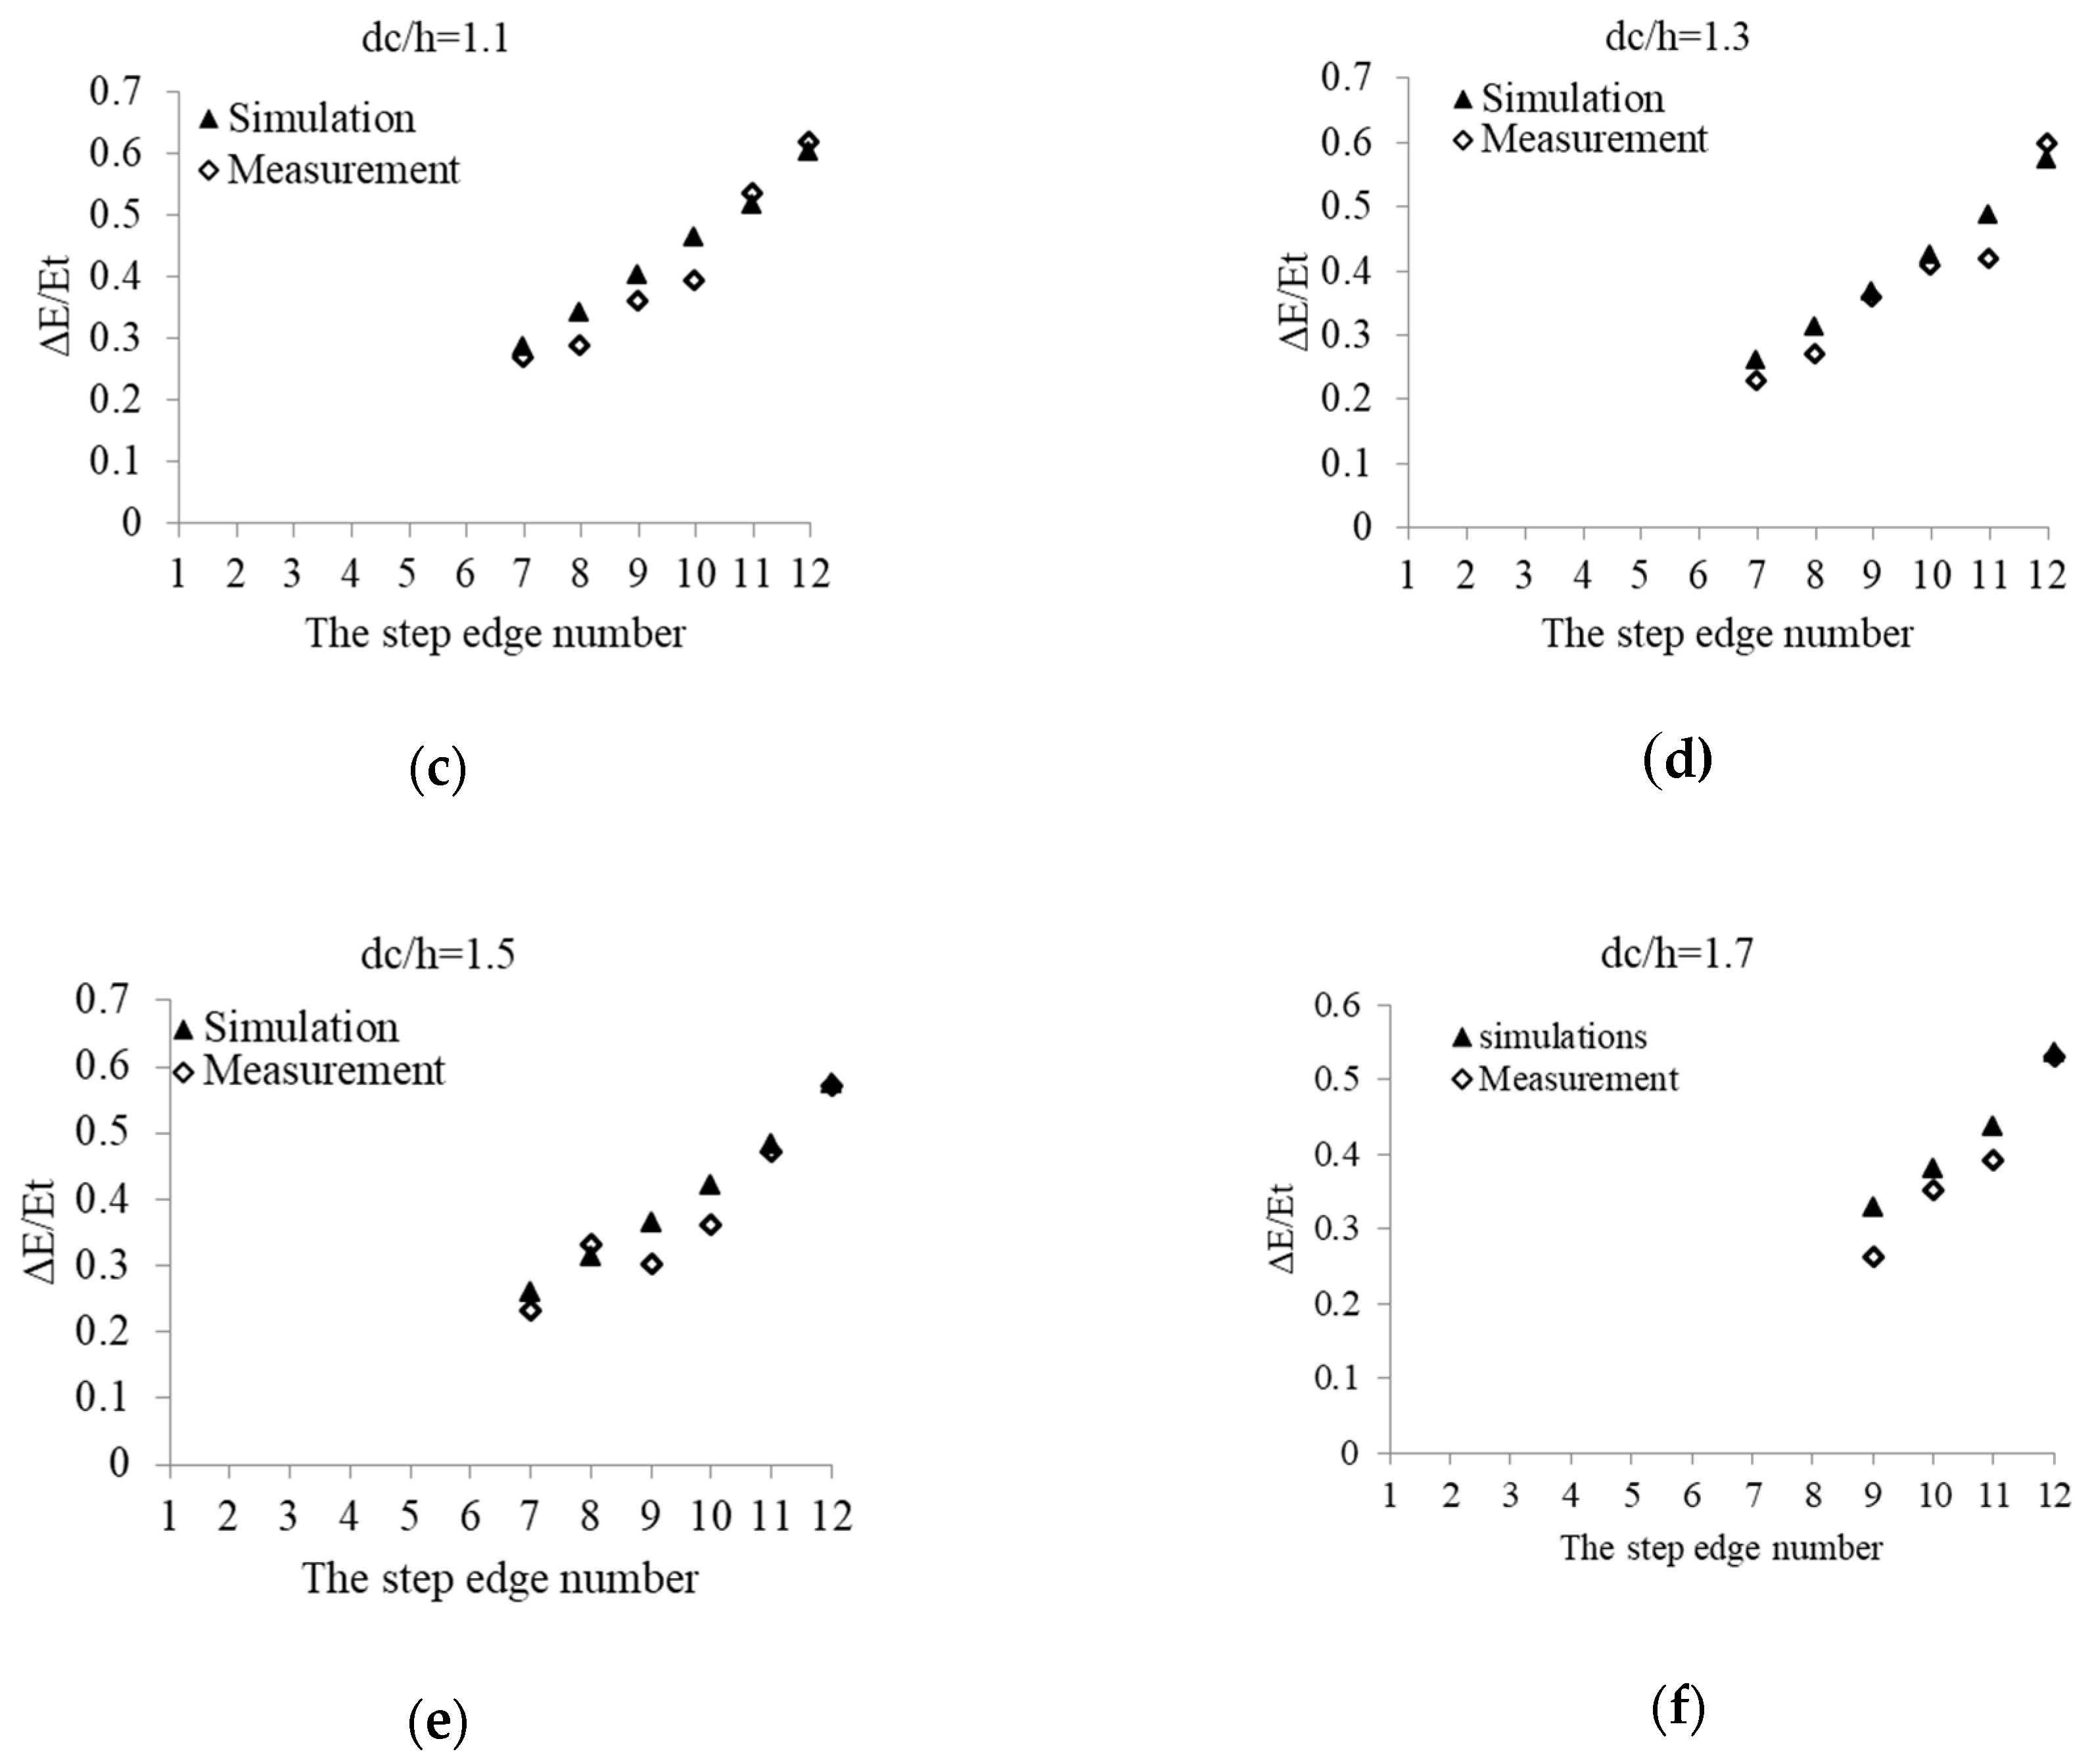
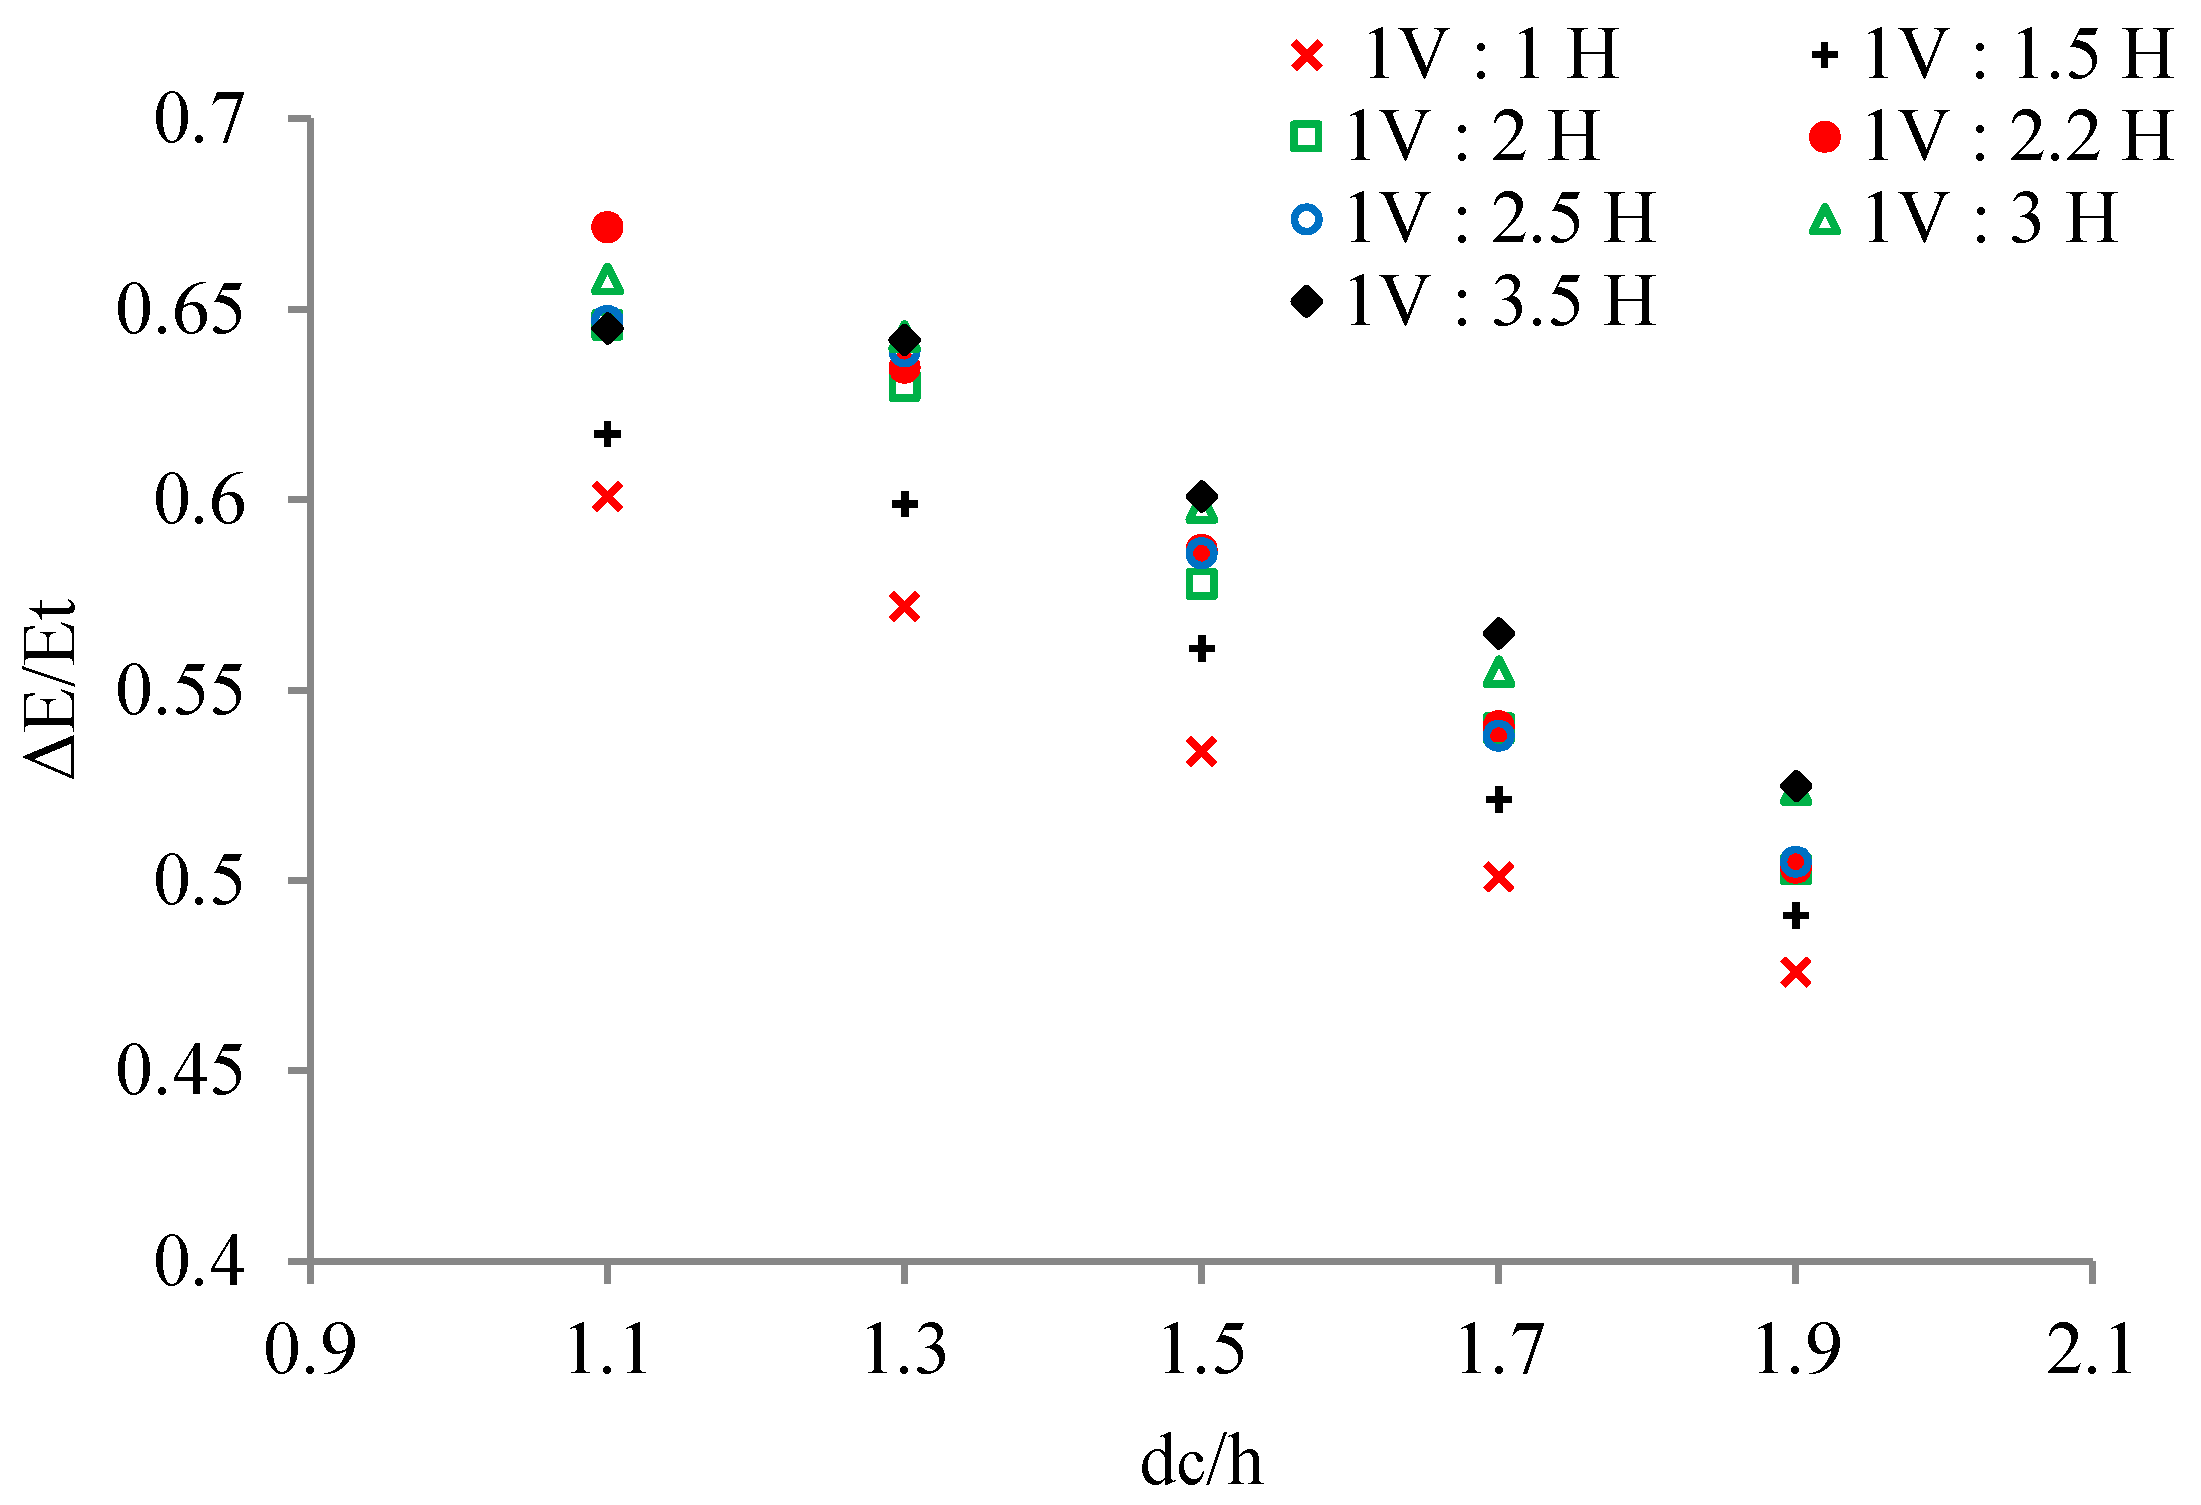
3.1.3. Energy Dissipation

For different volumetric flow rates within the range of 0.9 ≤ dc/h ≤ 1.7 the energy dissipation over a stepped chute was simulated. The results indicated energy dissipation of up to 60%. As can be seen in Figure 7, the numerically obtained results are very similar to the experimental results reported by Zhang and Chanson [16], indicating a high degree of accuracy of the proposed method.
Furthermore, the proposed numerical model was tested by the experimental results for uniform and non-uniform stepped spillways reported by Felder [2]. As is shown in Figure 8 and Table 3, the proposed method has a high degree of accuracy and the numerically obtained results are very similar to the experimental ones.

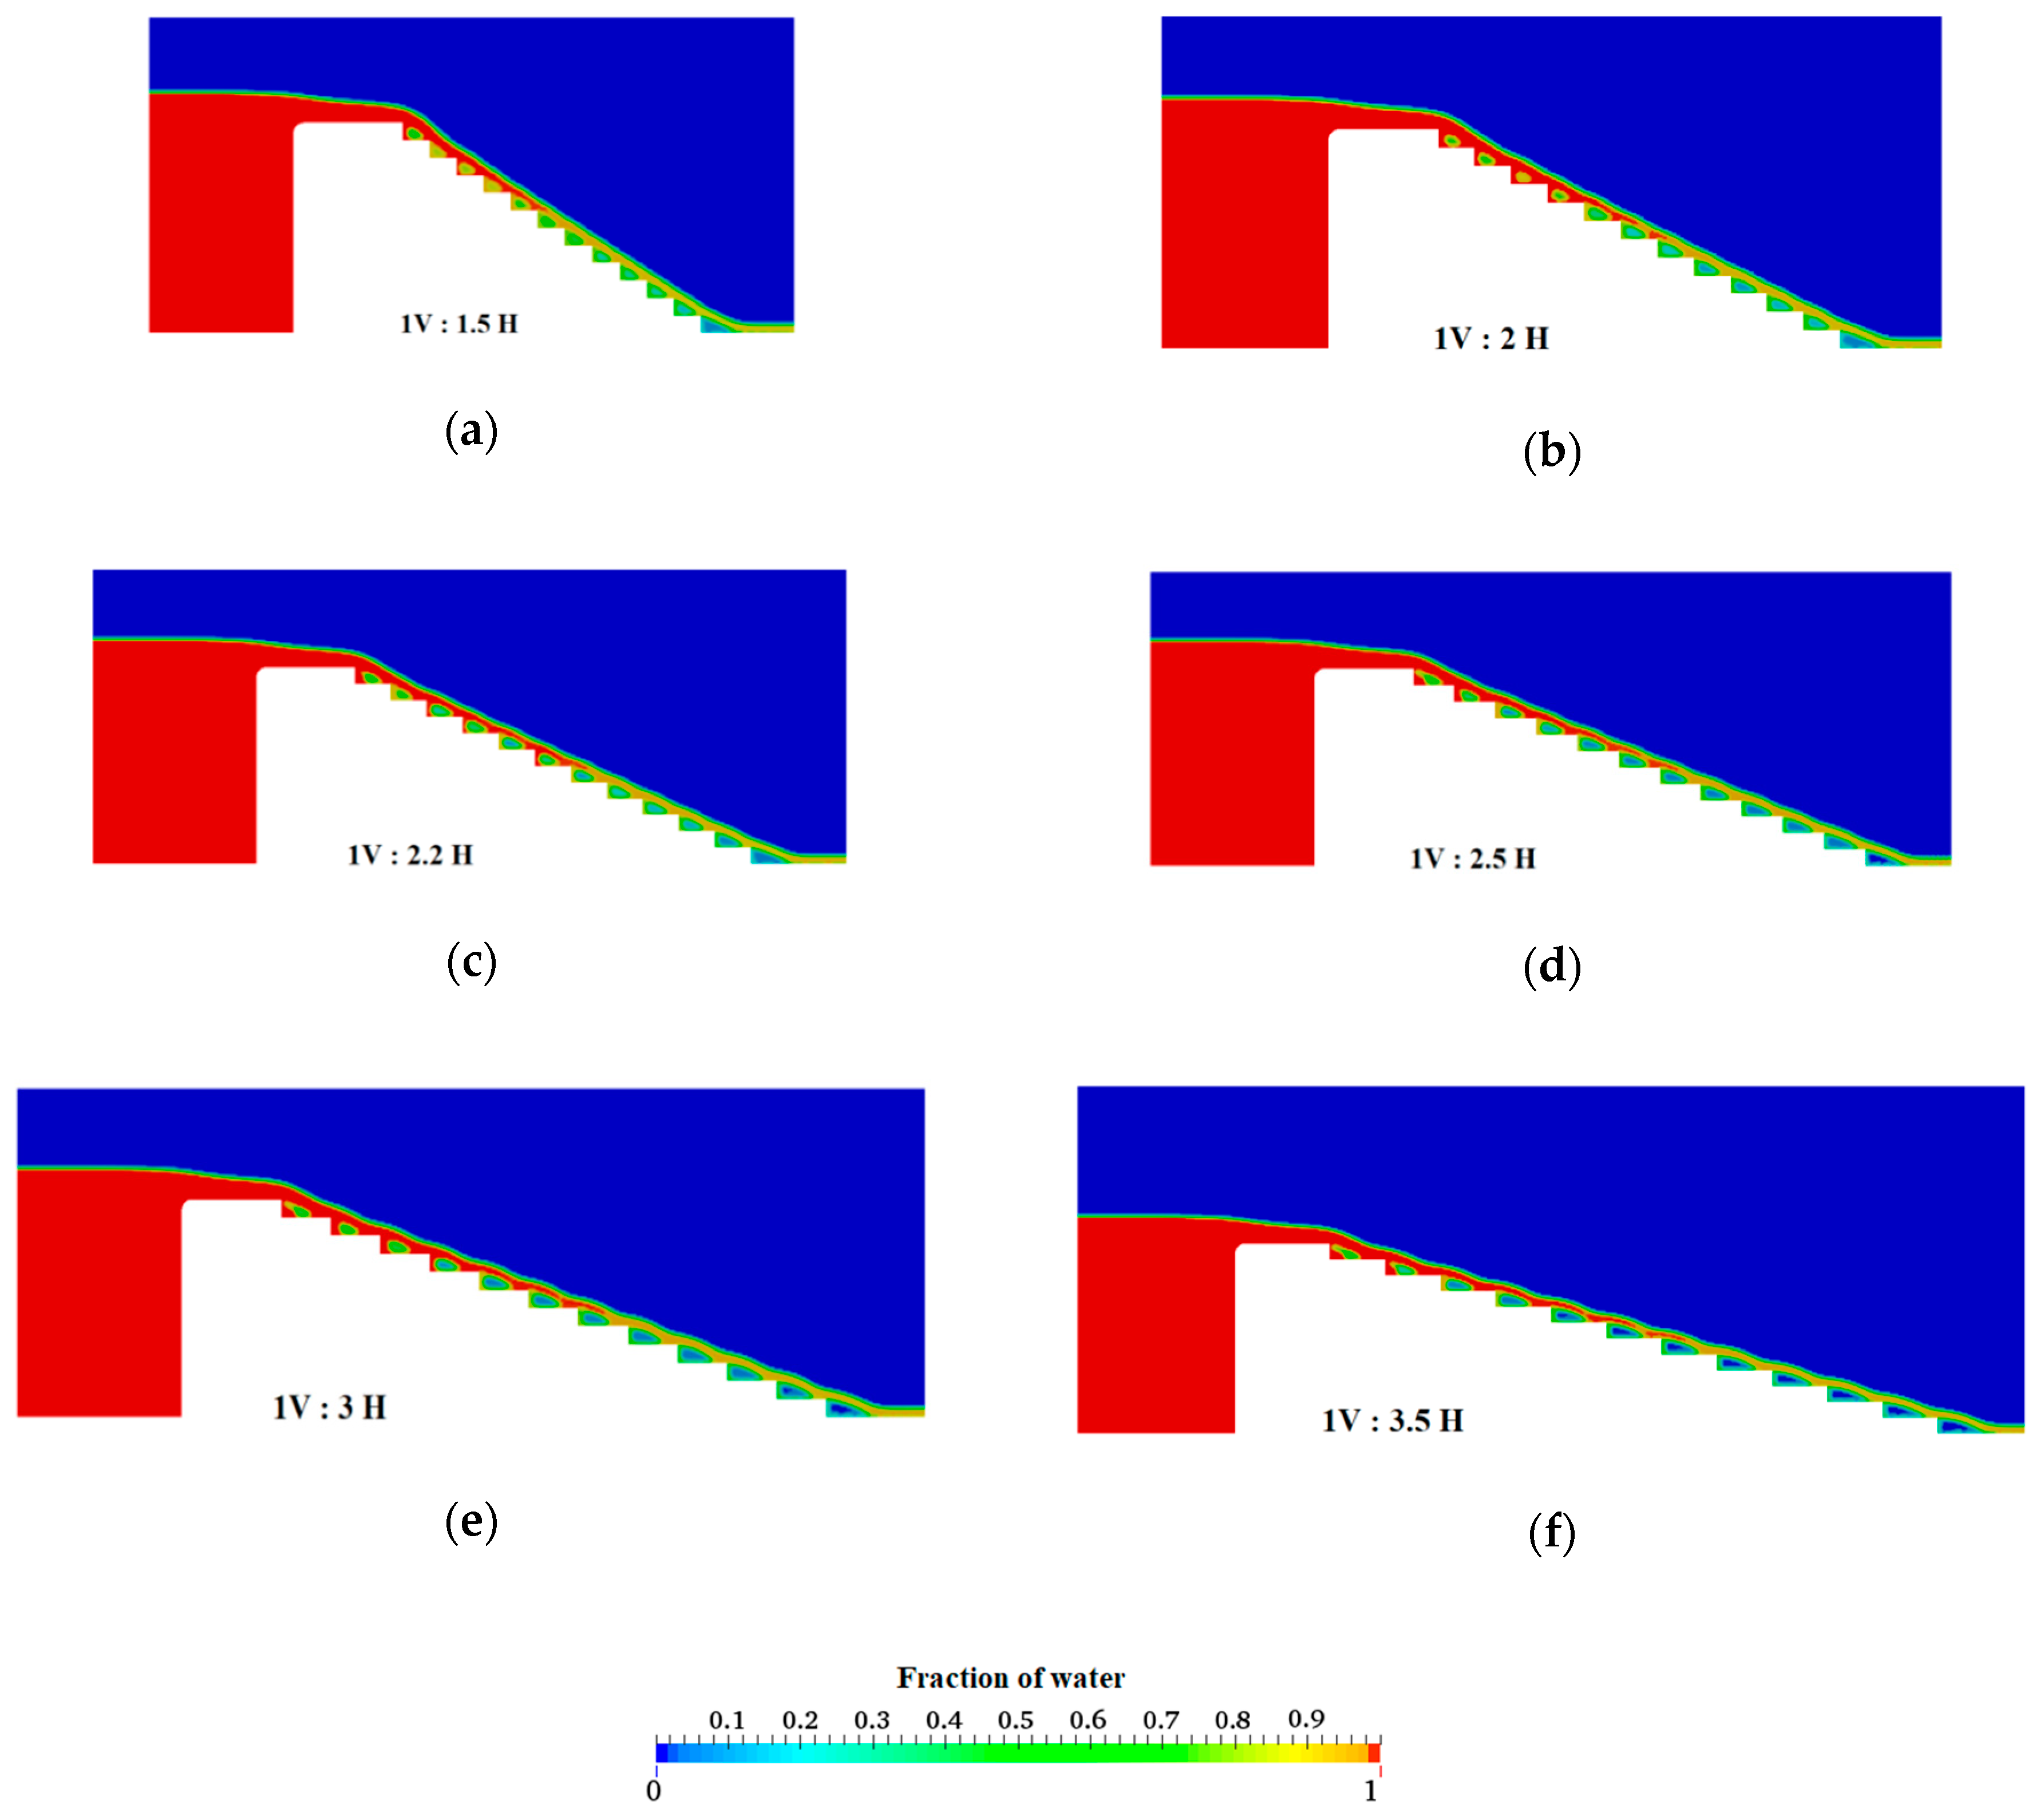
3.2. Uniform Stepped Spillways with Different Slopes

The effect of the spillway slope on the energy dissipation rate for all the configurations of uniform step length is discussed in this section. Figure 9 shows the water volume fraction of the flow, indicating recirculating flow in the step cavities. The results reveal that, as the step length increases, the air entrainment increases, which is simply caused by the increased length of the aerated flow region.
It was observed that the rate of energy dissipation increases slightly when the spillway slope decreases, and this has an inverse relationship with the discharge (Figure 10). This can be explained by the formation of a recirculation flow at the step cavities, which creates large vortexes. For instance, for step lengths of 0.1, 0.15, and 0.2 m, a recirculation vortex fills the entire step cavities, acting as a roller and consequently conveying the flow. However, a part of this flow hits a step length which is larger than 0.2 m and generates a slight increase in the energy dissipation for slopes smaller than 1V:2H (Figure 11). The flat slope 1V:2.2H yielded a slight increase in the energy dissipation by up to 1.3% compared to the slope 1V:2H, while the slope 1V:2.5 showed similar results against the flat slope 1V:2.2. Furthermore, the flat slopes 1V:3H and 1V:3.5 H yielded a slight increase in the energy dissipation by up to 2% compared to the slope 1V:2.2H, but the design would yield long and uneconomical designs. Among all uniform configurations tested here, the uniform stepped spillway with the 1V:2.2H slope was the optimum design in terms of the energy dissipation performance.
As shown in Figure 10 the results of energy dissipation for uniform configurations seem to have the same tendency. The energy dissipation is directly proportional to dc/h and can be estimated ( R 2 > 0.94 ) by:
Δ E E t = 0.1864 d c h + 0.8679     f o r   0.285 h L 0.5
Δ E E t = 0.1629 d c h + 0.7917   ,   f o r   0.667 h L 1

3.3. Non-Uniform Stepped Spillways

In this section, the effect of non-uniform step lengths on the energy dissipation for convex, concave, random, and semi-uniform configurations is discussed. The fraction of water flow over non-uniform configuration models investigated in this study can be seen in Figure 12. In the concave spillway, the extent of air entrainment was less in the water flow at the beginning of the steps and it increased towards the end of the chute, contrary to the convex spillway. The air entrainment in the concave configuration was larger compared to the convex configuration. The differences in the increase in the air entrainment could be explained by the flow disturbances resulting from an increase in the length of the steps toward the bottom of the spillway. In the random configurations, the air entrainment did not provide better aeration performance compared to uniform configurations.
The effect of non-uniform step length stepped spillways on the energy dissipation can be seen in Figure 13. Energy losses in the concave stepped spillway were approximately 9% more than the convex stepped spillway, and very similar to the uniform stepped spillway with the slope 1V:2.2H. For the concave spillway, a large vortex area occurs at the end of the lower half of the chute. The large vortex reduces the velocity, resulting in an increase of the energy dissipation. The small steps at the lower half of the convex spillway led to the formation of small vortices that contributed to a lower velocity reduction, resulting in less energy dissipation (Figure 14).
In the random configurations, the vortex generation and the dissipation process associated with each vortex are disturbed by the next step, and interfere with it if the ratio between the successive step lengths is greater than 1:2. As can be seen in Figure 14, the water velocity on the steps with a lower length of 0.1 m is approximately zero. The reduction of water movement has affected the energy dissipation significantly. It can also be noted that the random configurations one, two, and three showed similar results with respect to energy dissipation, and they did not provide a better performance compared to uniform configurations. On the contrary, the maximum energy dissipation was obtained with the semi-uniform configuration, which has alternate steps of lengths 0.1 and 0.3 m along the whole chute. It was observed that with this ratio, the vortex interference region was confined between two adjacent cavities on the entire chute, as shown in Figure 15, which, in turn, improved the energy dissipation. Compared with the best uniform configuration (1V:2.2H), the energy dissipation in the semi-uniform model was improved by 20%.

4. Conclusions

Utilizing the optimal design of stepped spillways is essential for maximizing the energy dissipation and, consequently, reducing the construction costs of hydraulic structures. In this article, different stepped spillway configurations with uniform, non-uniform, and semi-uniform step lengths were studied numerically. The results indicated that the air entrainment increases as the step length increases. For concave and convex stepped spillways, it was observed that the amount of air concentration in the concave spillway is more than in the convex one. As a result, it can be considered that the concave stepped spillway is more effective than the convex one in terms of reducing the risk of cavitation. Moreover, it was observed that, among all models, the main factor that influences the energy dissipation is the vortexes formed by the recirculation flow. For the different uniform configurations investigated in this article, the uniform stepped spillway design with a slope of 1V:2.2H was found to be optimum in terms of the energy dissipation performance. However, over all the models, the semi-uniform chute performed better. The results indicated that the vortex generation and dissipation process associated with each vortex became confined between two adjacent cavities on the entire chute when the ratio between the successive step lengths was 1:3, such that the energy dissipation was improved by up to 20%.

Author Contributions

Conceptualization, A.A., and A.R.; methodology, A.A., and A.R.; validation, A.A.; formal analysis, A.A., and A.R.; investigation, A.A., and A.R.; resources, A.A.; data curation, A.A., and A.R.; writing—original draft preparation, A.A.; writing—review and editing, A.R.; visualization, A.A., and A.R.; supervision, A.R.

Funding

This research received no external funding.

Acknowledgments

The authors would like to thank. Burhan Yıldız for his valuable comments and suggestions on an earlier draft of the paper.

Conflicts of Interest

The authors declare no conflict of interest.

References

  1. Chanson, H. Historical Development of Stepped Cascades for Dissipation of Hydraulic Energy. Trans. Newcom. Soc. 2001, 72, 295–318. [Google Scholar] [CrossRef]
  2. Felder, S. Air-Water Flow Properties on Stepped Spillways for Embankment Dams: Aeration, Energy Dissipation and Turbulence on Uniform, Non-Uniform and Pooled Stepped Chutes. Ph.D. Thesis, University of Queensland, Brisbane, Australia, 2013. [Google Scholar]
  3. Gonzalez, C.A.; Chanson, H. Hydraulic Design of Stepped Spillways and Downstream Energy Dissipators for Embankment Dams. Dam Eng. 2007, 17, 223–244. [Google Scholar]
  4. Padulano, R.; Fecarotta, O.; Del Giudice, G.; Carravetta, A. Hydraulic Design of a USBR Type II Stilling Basin. J. Irrig. Drain. Eng. 2017, 143, 04017001. [Google Scholar] [CrossRef]
  5. Fecarotta, O.; Carravetta, A.; Del Giudice, G.; Padulano, R.; Brasca, A.; Pontillo, M. Experimental results on the physical model of an USBR type II stilling basin. In Riverflow 2016; Taylor & Francis Group: London, UK, 2016. [Google Scholar] [CrossRef]
  6. Chanson, H. Hydraulics of skimming flows over stepped channels and spillways. J. Hydraul. Res. 1994, 32, 445–460. [Google Scholar] [CrossRef]
  7. Rajaratnam, N. Skimming flow in stepped spillways. J. Hydraul. Eng. ASCE 1990, 116, 587–591. [Google Scholar] [CrossRef]
  8. Boes, R.M.; Hager, W.H. Two-Phase Flow Characteristics of Stepped Spillways. J. Hydraul. Eng. 2003, 129, 661–670. [Google Scholar] [CrossRef]
  9. Chanson, H. Stepped spillway flows and air entrainment. Can. J. Civ. Eng. 1993, 20, 422–435. [Google Scholar] [CrossRef]
  10. Felder, S.; Chanson, H. Energy dissipation and air entrainment on stepped spillways with non-uniform cavity sizes. In Proceedings of the 34th IAHR Wrld Congress, Brisbane, Australia, 26 June–1 July 2011; pp. 2412–2419. [Google Scholar] [CrossRef]
  11. Chanson, H. Prediction of the transition nappe/skimming flow on a stepped channel. J. Hydraul. Res. 1996, 34, 421–429. [Google Scholar] [CrossRef]
  12. Chanson, H.; Toombes, L. Hydraulics of stepped chutes: The transition flow L’hydraulique des chutes en marches d’escalier: L’écoulement de transition. J. Hydraul. Res. 2004, 42, 43–54. [Google Scholar] [CrossRef]
  13. Chinnarasri, C.; Wongwises, S. Flow Patterns and Energy Dissipation over Various Stepped Chutes. J. Irrig. Drain. Eng. 2006, 132, 70–76. [Google Scholar] [CrossRef]
  14. Amador, A.; Sánchez-Juny, M.; Dolz, J. Characterization of the nonaerated flow region in a stepped spillway by PIV. J. Fluids Eng. 2006, 128, 1266–1273. [Google Scholar] [CrossRef]
  15. Boes, R.M.; Hager, W.H. Hydraulic design of stepped spillways. J. Hydraul. Eng. 2003, 129, 671–679. [Google Scholar] [CrossRef]
  16. Zhang, G.; Chanson, H. Broad-crested weir operation upstream of a steep stepped spillway. In Proceedings of the 36th IAHR World Congress, Hague, The Netherlands, 28 June–3 July 2015; pp. 2901–2911. [Google Scholar]
  17. Chamani, M.R.; Rajaratnam, N. Jet flow on stepped spillways. J. Hydraul. Eng. 1994, 120, 254–259. [Google Scholar] [CrossRef]
  18. Chanson, H. Advective Diffusion of Air Bubbles in Turbulent Water Flows. In Fluid Mechanics of Environmental Interfaces; Taylor & Francis: Leiden, The Netherlands, 2013; pp. 181–219. [Google Scholar]
  19. Chanson, H.; Felder, S. Energy dissipation on embankment dam stepped spillways, overflow stepped weirs and masonry stepped Spillways. In Proceedings of the 17th Congress of IAHR Asia and Pacific Division, Auckland, New Zealand, 21–24 February 2010; Melville, B., De Costa, G., Swann, T., Eds.; Auckland University: Auckland, New Zealand, 2010. [Google Scholar]
  20. Felder, S.; Chanson, H. Simple design criterion for residual energy on embankment dam stepped spillways. J. Hydraul. Eng. 2016, 142, 04015062. [Google Scholar] [CrossRef]
  21. Hunt, S.L.; Kadavy, K.C.; Hanson, G.J. Simplistic design methods for moderate-sloped stepped chutes. J. Hydraul. Eng. 2014, 140, 4014062. [Google Scholar] [CrossRef]
  22. Christodoulou, G.C. Energy dissipation on stepped spillways. J. Hydraul. Eng. 1993, 119, 644–650. [Google Scholar] [CrossRef]
  23. Stephenson, D. Stepped energy dissipators. In Proceedings of the International Conference on Hydraulics for High Dams, Beijing, China, 15–18 November 1988; IAHR: Beijing, China, 1988. [Google Scholar]
  24. Felder, S.; Chanson, H. Energy Dissipation down a stepped spillway with nonuniform step heights. J. Hydraul. Eng. 2011, 137, 1543–1548. [Google Scholar] [CrossRef]
  25. Li, D.; Yang, Q.; Ma, X.; Dai, G. Case study on application of the step with non-uniform heights at the bottom using a numerical and experimental model. Water 2018, 10, 1762. [Google Scholar] [CrossRef]
  26. Bayon, A.; Toro, J.P.; Bombardelli, F.A.; Matos, J.; López-Jiménez, P.A. Influence of VOF technique, turbulence model and discretization scheme on the numerical simulation of the non-aerated, skimming flow in stepped spillways. J. Hydro-Environ. Res. 2017, 19, 137–149. [Google Scholar] [CrossRef]
  27. Bombardelli, F.A.; Meireles, I.; Matos, J. Laboratory measurements and multi-block numerical simulations of the mean flow and turbulence in the non-aerated skimming flow region of steep stepped spillways. Environ. Fluid Mech. 2011, 11, 263–288. [Google Scholar] [CrossRef]
  28. Chen, Q.; Dai, G.; Liu, H. Volume of fluid model for turbulence numerical simulation of stepped spillway overflow. J. Hydraul. Eng. 2002, 128, 683–688. [Google Scholar] [CrossRef]
  29. Cheng, X.; Gulliver, J.S.; Zhu, D. Application of displacement height and surface roughness length to determination boundary layer development length over stepped spillway. Water 2014, 12, 3888–3912. [Google Scholar] [CrossRef]
  30. Kositgittiwong, D.; Chinnarasri, C.; Julien, P.Y. Numerical simulation of flow velocity profiles along a stepped spillway. Proc. Inst. Mech. Eng. Part E J. Process Mech. Eng. 2013, 227, 327–335. [Google Scholar] [CrossRef]
  31. Li, S.; Zhang, J. Numerical investigation on the hydraulic properties of the skimming flow over pooled stepped spillway. Water 2018, 10, 1478. [Google Scholar] [CrossRef]
  32. Lopes, P.; Leandro, J.; Carvalho, R.F.; Bung, D.B. Alternating skimming flow over a stepped spillway. Environ. Fluid Mech. 2017, 17, 303–322. [Google Scholar] [CrossRef]
  33. Shahheydari, H.; Nodoshan, E.J.; Barati, R.; Moghadam, M.A. Discharge coefficient and energy dissipation over stepped spillway under skimming flow regime. KSCE J. Civ. Eng. 2015, 19, 1174–1182. [Google Scholar] [CrossRef]
  34. Tabbara, M.; Chatila, J.; Awwad, R. Computational simulation of flow over stepped spillways. Comput. Struct. 2005, 83, 2215–2224. [Google Scholar] [CrossRef]
  35. Toro, J.P.; Bombardelli, F.A.; Paik, J.; Meireles, I.; Amador, A. Characterization of turbulence statistics on the non-aerated skimming flow over stepped spillways: A numerical study. Environ. Fluid Mech. 2016, 16, 1195–1221. [Google Scholar] [CrossRef]
  36. Wan, W.; Raza, A.; Chen, X. Effect of Height and Geometry of Stepped Spillway on Inception Point Location. Appl. Sci. 2019, 9, 2091. [Google Scholar] [CrossRef]
  37. Eghbalzadeh, A.; Javan, M. Comparison of Mixture and VOF models for numerical simulation of Air-Entrainment in skimming flow over stepped spillways. Procedia Eng. 2012, 28, 657–660. [Google Scholar] [CrossRef] [Green Version]
  38. Ferziger, J.H.; Peric, M. Computational Methods for Fluid Dynamics, 3rd ed.; Springer: Berlin/Heidelberg, Germany; New York, NY, USA, 2002. [Google Scholar] [CrossRef] [Green Version]
  39. Pendar, M.; Roohi, E. Cavitation characteristics around a sphere: An LES Investigation. Int. J. Multiph. Flow 2018, 98, 1–23. [Google Scholar] [CrossRef]
  40. Zhang, G.; Chanson, H. Hydraulics of the Developing Flow Region of Stepped Cascades: An Experimental Investigation; Hydraulic Model Report No. CH97/15; School of Civil Engineering, The University of Queensland: Brisbane, Australia, 2015; Available online: https://espace.library.uq.edu.au/view/UQ:355818 (accessed on 1 January 2015).
  41. Roache, P.J. Quantification of uncertainty in computational fluid dynamics. Annu. Rev. Fluid Mech. 1997, 29, 123–160. [Google Scholar] [CrossRef]
  42. Celik, I.B.; Ghia, U.; Roache, P.J. Procedure for Estimation and Reporting of Uncertainty Due to Discretization in CFD Applications. J. Fluids Eng. 2008, 130, 1–4. [Google Scholar] [CrossRef] [Green Version]
  43. Bai, Z.; Zhang, J. Comparison of different turbulence models for numerical simulation of pressure Distribution in V-Shaped Stepped Spillway. Math. Probl. Eng. 2017, 3, 1–9. [Google Scholar] [CrossRef] [Green Version]
  44. Qian, Z.; Hu, X.; Huai, W.; Amador, A. Numerical simulation and analysis of water flow over stepped spillways. Sci. China Ser. E Technol. Sci. 2009, 52, 1958–1965. [Google Scholar] [CrossRef]
  45. Kositgittiwong, D. Validation of Numerical Model of the Flow Behaviour through Smooth and Stepped Spillways Using Large-Scale Physical Model. Ph.D. Thesis, King Mongkut’s University of Technology, Thonburi, Thailand, 2012. [Google Scholar] [CrossRef]
Figure 1. Structured mesh and boundary conditions.
Applsci 09 05071 g001
Figure 2. Flowchart for obtaining the optimized design for uniform and non-uniform stepped spillways.
Applsci 09 05071 g002
Figure 3. Grid convergence study at dc/h = 1.3 (Q = 0.145 m3/s) for the finest, fine, and coarse grids. Part (a) and (b) show the water free surface and velocity profiles. Part (c) is the fine-grid solution with discretization error bars using the grid convergence index (GCI) index.
Applsci 09 05071 g003
Figure 4. Free-surface profiles above a broad crested weir.
Applsci 09 05071 g004
Figure 5. Comparison of velocity profiles between the numerical results and experimental data at some longitudinal stations.
Applsci 09 05071 g005aApplsci 09 05071 g005b
Figure 6. Air–water flow on a uniform stepped spillway at slope 1V:1H for dc/h = 1.3. Part (a) is the water volume fraction and part (b) is the velocity vector distribution.
Applsci 09 05071 g006
Figure 7. Energy dissipation comparison between the experimental data of Zhang and Chanson [16] and numerical results for different flow rates over a stepped chute, when (a) dc/h = 0.9; (b) dc/h = 1; (c) dc/h = 1.1; (d) dc/h = 1.3; (e) dc/h = 1.5 and (f) dc/h = 1.7.
Applsci 09 05071 g007aApplsci 09 05071 g007b
Figure 8. Air–water flow on a stepped spillway at slopes 26.56° for dc/h = 1.28: (a) uniform steps and (b) non-uniform steps.
Applsci 09 05071 g008
Figure 9. Air–water flow on uniform stepped spillways with different slopes for dc/h = 1.3: (a) uniform stepped spillway with step length 0.15 m; (b) uniform stepped spillway with step length 0.20 m; (c) uniform stepped spillway with step length 0.22 m; (d) uniform stepped spillway with step length 0.25 m; (e) uniform stepped spillway with step length 0.30 m and (f) uniform stepped spillway with step length 0.35 m.
Applsci 09 05071 g009
Figure 10. Effect of uniform step length on the rate of energy dissipation.
Applsci 09 05071 g010
Figure 11. Velocity vectors distribution on uniform stepped spillways with different slopes for dc/h = 1.3: (a) uniform stepped spillway with step length 0.15 m; (b) uniform stepped spillway with step length 0.20 m; (c) uniform stepped spillway with step length 0.22 m; (d) uniform stepped spillway with step length 0.25 m; (e) uniform stepped spillway with step length 0.30 m and (f) uniform stepped spillway with step length 0.35 m.
Applsci 09 05071 g011aApplsci 09 05071 g011b
Figure 12. Air–water flow on non-uniform stepped spillway configurations for dc/h = 1.3: (a) Concave configuration; (b) Convex configuration; (c), (d), (e) Random configurations and (f) Semi-uniform configuration.
Applsci 09 05071 g012aApplsci 09 05071 g012b
Figure 13. Energy dissipation of non-uniform stepped spillway configurations and a uniform stepped spillway with the slope 1V:2.2H.
Applsci 09 05071 g013
Figure 14. Velocity vectors on a non-uniform stepped spillway for dc/h = 1.3: (a) convex configuration; (b) concave configuration; (c) random configurations; and (d) semi-uniform configuration.
Applsci 09 05071 g014
Figure 15. Velocity vectors on semi-uniform stepped spillway configurations over the entire chute.
Applsci 09 05071 g015
Table 1. Uniform configurations of the stepped spillways modelled in this study.
Step Height
h(m)
Step Length
L(m)
Height of Dam
Hd (m)
Number of Steps (N)Slope
V:H 1
0.10.101.2121:1
0.10.151.2121:1.5
0.10.201.2121:2
0.10.221.2121:2.2
0.10.251.2121:2.5
0.10.301.2121:3
0.10.351.2121:3.5
1 V indicates the vertical step height and H is the horizontal step length.
Table 2. Non-uniform configurations of the stepped spillways modelled in this study.
ConcaveConvexRandom
1
Random
2
Random
3
Semi-Uniform
N = 12
h = 0.1 m
Hd = 1.2 m
iL (m)L (m)L (m)L (m)L (m)L (m)
10.10.350.20.250.10.1
20.1250.3250.20.20.350.3
30.150.30.30.10.1250.1
40.1750.2750.10.350.3250.3
50.20.250.250.20.150.1
60.2250.2250.350.2250.30.3
70.250.20.10.20.1750.1
80.2750.1750.250.350.2750.3
90.30.150.30.10.20.1
100.3250.1250.20.20.250.3
110.350.10.20.250.2250.1
Average Slope (θ) --24.2024.4024.0027.7
Standard deviation (SD) 0.0830.0830.0790.0810.0830.112
Table 3. The experimental and numerical energy dissipation results of the last step for different stepped spillways.
ReferenceθHdamNh
(m)
L
(m)
Q
m3/sec
dc/hΔE/EtError %
Experiment ResultsNumerical Results
Zhang and Chanson [16]451.2120.10.10.0570.70.610.6221.967
0.0830.90.630.6024.444
0.09810.630.6053.968
0.1121.10.620.6013.065
0.1451.30.600.5724.667
0.1791.50.570.5346.316
0.2161.70.530.5015.472
Felder [2]26.561100.10.20.0560.690.760.716.579
0.1161.110.640.6360.625
0.1431.280.630.6162.222
0.1611.380.660.59210.303
0.1801.490.580.5770.517
0.2021.610.570.5503.509
Felder [2] 0.0950.970.650.6293.23
26.56115hL0.1161.110.620.6160.645
10 steps (h = 0.05 m) 0.10.1431.280.560.5996.964
5 steps (h = 0.1 m) 0.20.1611.380.560.5823.928

