2.1. The General Behavior of SFRC Beams
As summarized by Dinh in 2009 [
21], the steel fibers perform a role similar to that of shear reinforcement in the transversally-reinforced concrete beam. The presence of steel fibers supports the redistribution of tensile stress, prevents the propagation and opening of diagonal cracks, and is effective for controlling cracks and fostering the formation of multiple diagonal cracks. Furthermore, like shear reinforcement, the steel fibers can delay early concrete splitting along the tensile reinforcing bar. It is known that the orientation and distribution of steel fibers in concrete may not be well controlled due to possible segregation and fiber balling issues; therefore, the shear strength analysis for an SFRC beam faces several challenges. The proper distribution of the steel fibers for the improvement of mechanical properties is also the most important issue related to the steel fiber reinforcement in an SFRC member. Unlike normal concrete, the opening of wide diagonal cracks in an SFRC beam is the result of fiber pullout rather than shear reinforcement yielding. Moreover, the pullout behavior of steel fibers and the bond strength between the steel fibers and the concrete remain a complex problem [
21]. The shear behavior of a simply-supported SFRC beam subject to two-point concentrated and monotonic loads is affected by beam cross section (shape and size), ratio of shear span-to-effective depth, tensile reinforcement ratio, concrete compressive strength, size of coarse aggregate, fiber volume fraction, and the bond stress between steel fibers and the surrounding matrix. The commonly considered parameters for calculating SFRC ultimate shear stress are the shear span-to-effective depth, the longitudinal tensile reinforcement ratio, the concrete compressive strength, the fiber volume fraction, and the bond stress between steel fibers and the surrounding matrix.
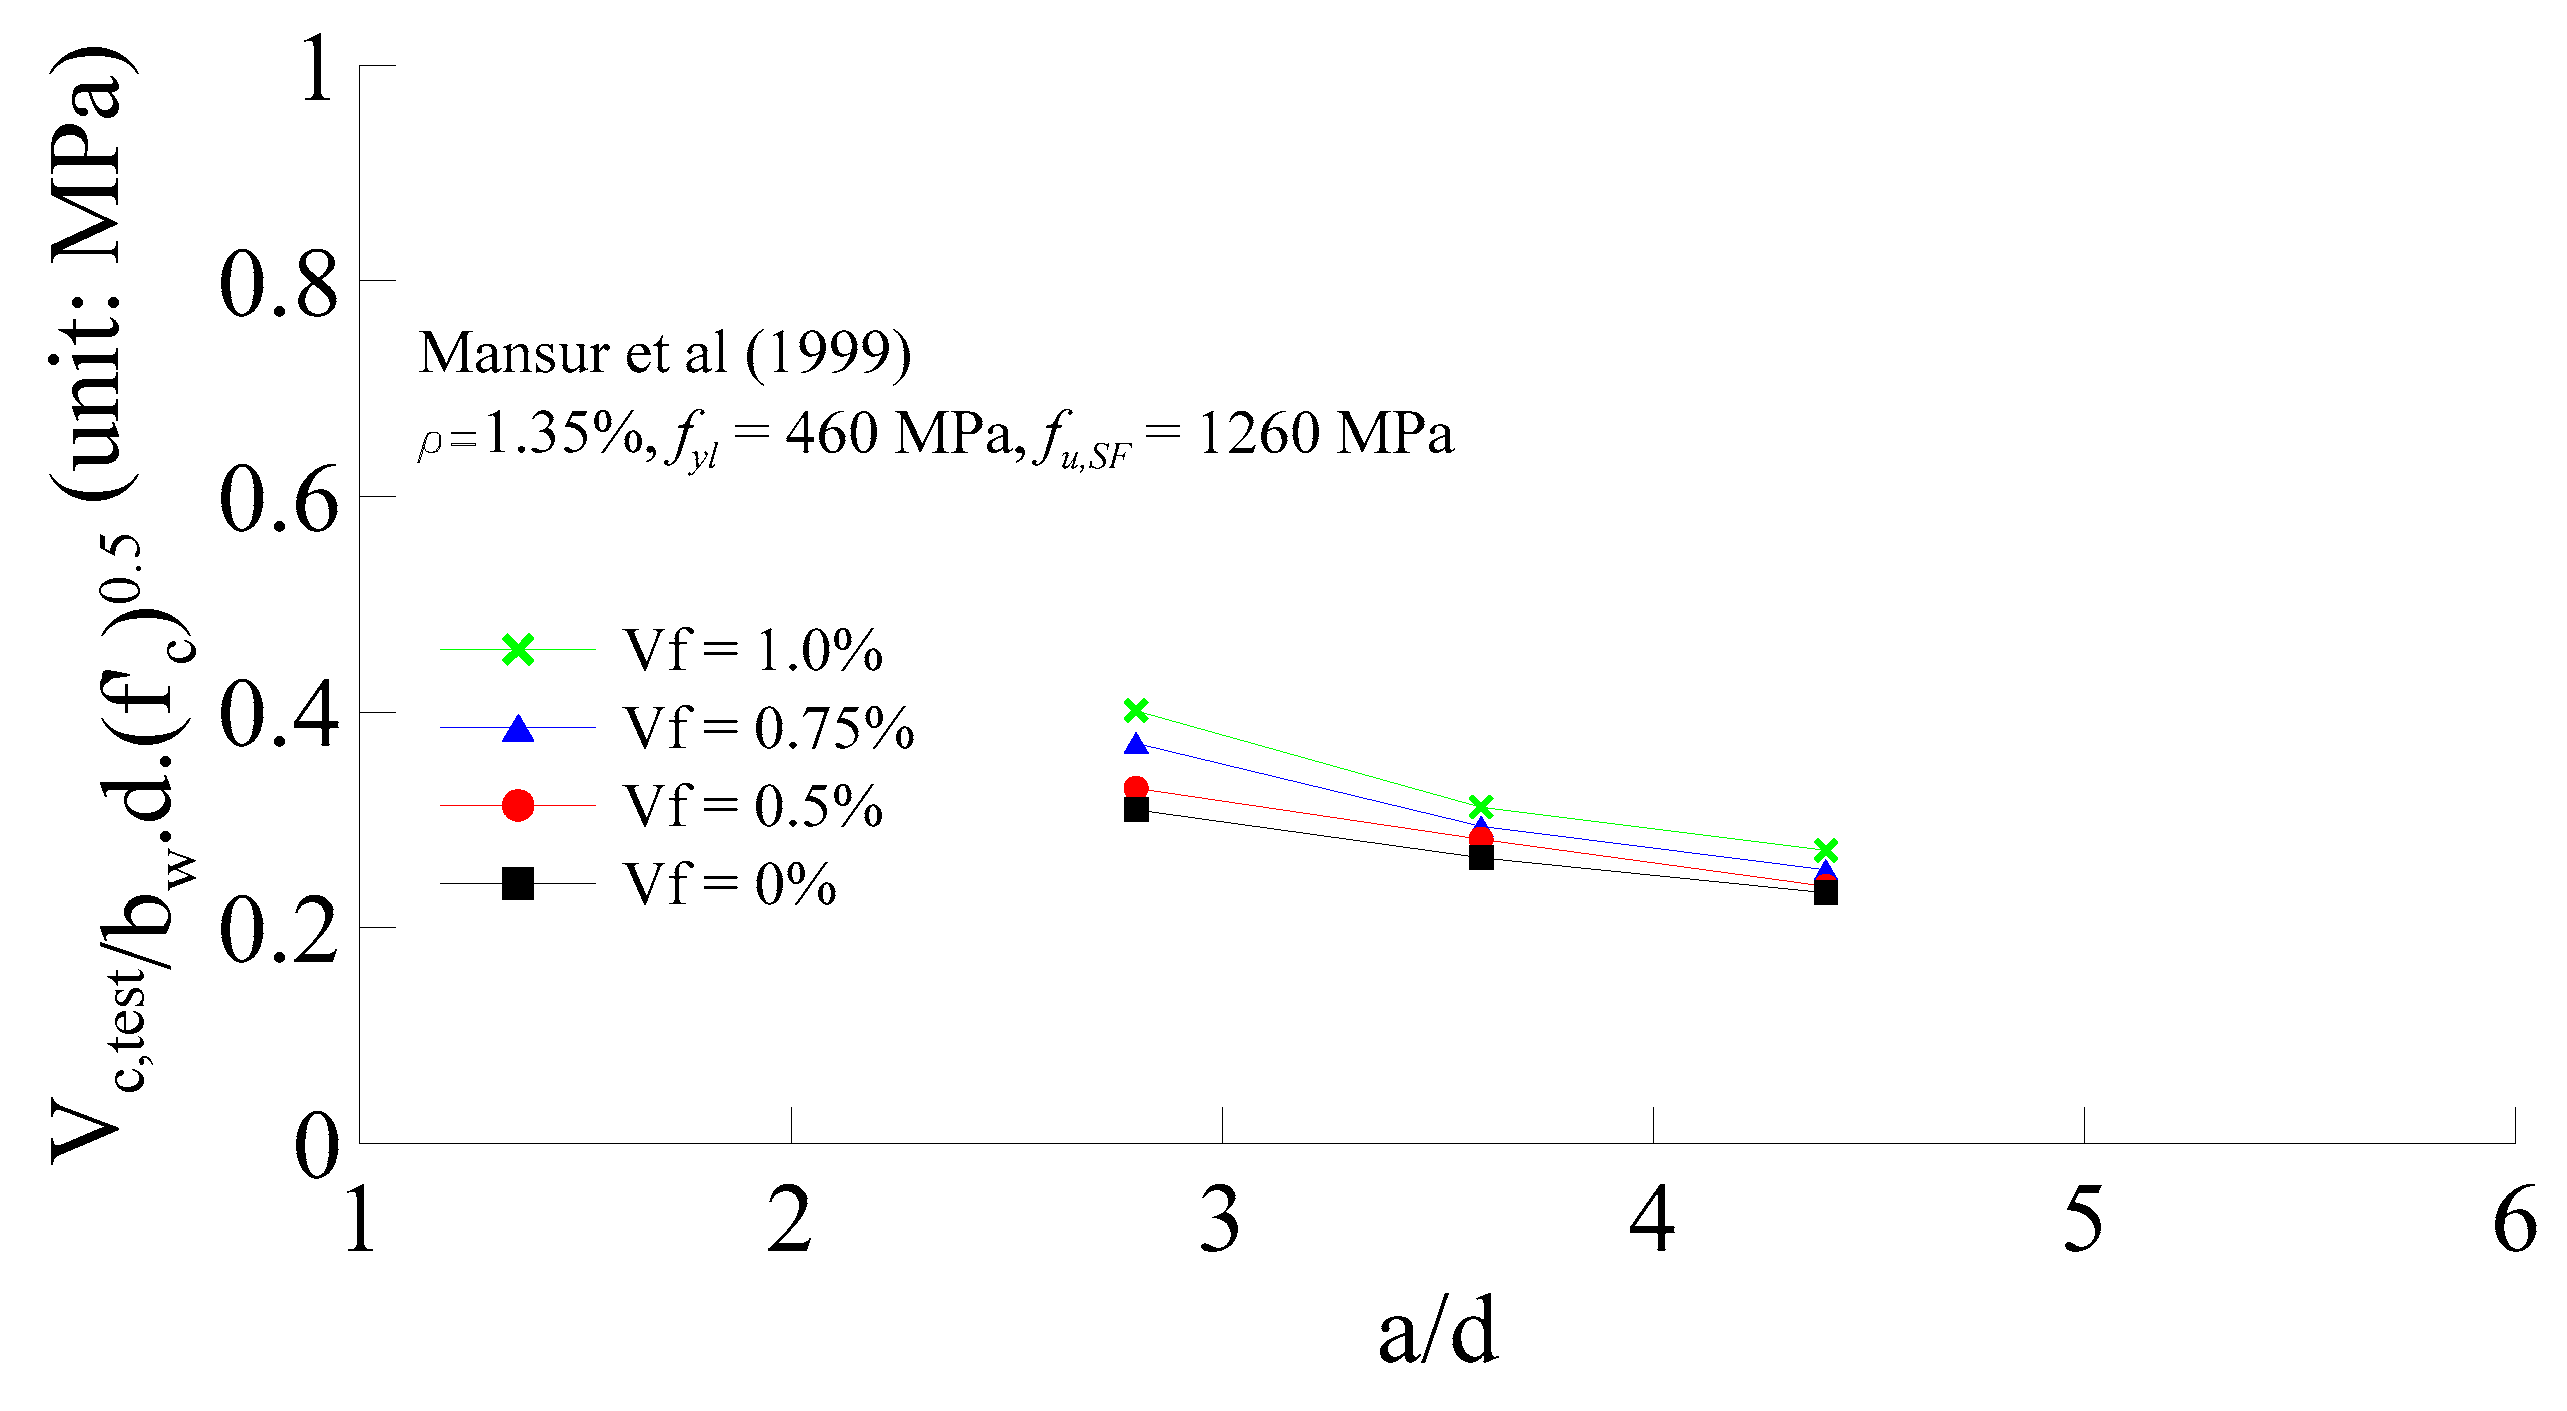
The shear span-to-effective depth ratio has a significant effect on the SFRC ultimate shear strength, as shown in previous research studies. The arch action occurring in a beam with smaller shear span transfers load from the loading point to the support directly through a compressive strut. Dinh [
21] reported that Batson et al. in 1972 proposed a critical value of a shear span-to-effective depth ratio of 3 for the SFRC beams. The relationship between normalized shear strength and the shear span-to-effective depth ratio reported by different researchers is shown in
Figure 1 [
11]. The symbols
,
,
,
,
,
,
,
, and
shown in
Figure 1 stand for beam ultimate shear strength, beam section width, section effective depth, concrete compressive strength, shear-span length, longitudinal reinforcement ratio, yield strength of longitudinal reinforcing bar, ultimate tensile strength of steel fiber, and fiber volume fraction, respectively. It can be seen that the beam shear strength becomes smaller, as the shear span-to-effective depth ratio increases.
The longitudinal tensile reinforcement ratio in an SFRC beam was investigated as well. The SFRC beam with greater longitudinal tensile reinforcement ratio can resist more ultimate shear strength due to an increase of dowel action and height of compression zone [
13,
22]. In general, the steel fibers must contribute to improving the dowel strength, since steel fibers provide bridging action across the microcracks in the matrix and improve resistance to crack opening. Swamy and Bahia [
23] conducted an experimental study, in which they provided several beam specimens. They reported that the concrete strain prior to dowel cracking varied between 600 × 10
−6 to 850 × 10
−6, where these values were relatively high compared to the maximum tensile strain of normal and even fiber reinforced concrete. As reported by Zarrionpour and Chao [
24], the dowel action in the slender SFRC beams varied between 10 to 35% of the total shear capacity as the height of beam varied between 305 to 1220 mm, and the shear span-to-effective depth ratio of tested beams ranged from 3.45 to 3.6. Therefore, according to research conducted by Swamy and Bahia [
23] and Zarrionpour and Chao [
24], the dowel action contributed to the shear strength of SFRC beams. On the other hand, Dinh et al. [
25] reported that the shear contribution of dowel action was ignored according to the test results of 24 beams (4 plain concrete beams and 20 SFRC beams). The failure mode for plain concrete beams was diagonal tension, while 18 SFRC beams failed due to shear tension.
Figure 2 shows the relationship between the normalized shear strength and the longitudinal tensile reinforcement ratio for different shear-span-to-effective depth ratios. It can be seen that the longitudinal tensile reinforcement ratio improves the SFRC shear strength, regardless of the contribution of dowel action.
The concrete compressive stress is one of the important parameters for ultimate shear strength of the SFRC beam. It can be observed from research conducted by Kwak et al. [
17] that when the concrete compressive strengths were increased up to 100%, while other parameters remained the same, the improvements of ultimate shear strength were 26%, 21%, and 20% for beams with shear span-to-effective depth ratio of 2, 3, and 4, respectively.
In regard to the contribution of aggregate size to shear capacity, greater aggregate size in the SFRC beam could enhance the shear resistance of the beam due to increased aggregate interlock [
21]. To be on the safe side, most researchers selected aggregate with maximum size of 9.5 mm accordingly [
21]. Zarrionpour and Chao [
24] measured the shear resistance from aggregate interlock at any point along crack length with a crack width exceeding 0.2 mm. It was reported that the contribution of aggregate interlock to shear resistance ranged from 0 to 5% [
24]. Also, it was reported that the aggregate interlock in the SFRC beams had a minor contribution at the point where the beams reached their peak strength.
The last two important parameters are the fiber volume fraction and the bond strength of the fiber-matrix interface. The effect of fiber volume fraction on shear strength also depends on fiber diameter and fiber length [
21]. The table in
Appendix A presents the shear stresses of SFRC beams with different fiber volume fraction and aspect ratio, where those results are part of the experimental results collected in this study. It can be seen that when the fiber volume fraction and the steel fiber aspect ratio are varied, while other parameters remain the same, there is almost no difference in the shear stresses. For example, it can be found from the test results conducted by Dinh et al. [
25], in which 4 SFRC beams contained 2 different steel fiber aspect ratios and fiber volume fractions, while other parameters remained the same. The specimens B18-3c, B18-3d, B18-5a, and B18-5b had similar ultimate shear stress. This is because specimens B18-3c, B18-3d, B18-5a, and B18-5b had a similar reinforcing index for steel fiber, RI, in which RI is a multiplication of the steel fiber aspect ratio and the fiber volume fraction. Improving the fiber volume fraction may improve shear strength significantly, if the fiber volume fraction is the only parameter improved, while other parameters, including steel fiber aspect ratio, are kept to remain the same [
11,
26].
The bond strength of the fiber-matrix interface has usually been neglected. Swamy et al. [
27] set the bond strength between steel fibers and concrete matrix at 4.15 MPa. Liao et al. [
2] and Perceka et al. [
9] conducted single-fiber pullout tests to determine the equivalent bond strength that describes the bond strength of the fiber-matrix interface. In order to account for the equivalent bond strength,
, Equation (1) that was proposed by Kim et al. [
2] can be used. In addition, Liao et al. [
2] and Perceka et al. [
9] used micromechanical model proposed by Xu et al. in 2011 [
2,
9] to verify the experimental results. Both authors reported that the difference between the experimental and analytical results was only 10% [
2].
where
is the pullout energy defined as an area under a pullout force-slip curve,
is fiber diameter, and
is the length of fiber embedded in the matrix.
2.2. Shear Strength Prediction Equations
The number of equations used to predict the shear strength of SFRC beams without shear reinforcement can be found in many research studies. Selected shear strength prediction equations for the SFRC beam without shear reinforcement proposed by previous researchers are shown in Equations (2)–(12).
Sharma [
10]:
where
is the concrete tensile strength based on split-cylinder test.
Narayan and Darwish [
12]:
where
is the computed value of split-cylinder strength of fiber concrete,
is the fiber factor;
is the cube strength of fiber concrete,
is the steel fiber length,
is the average fiber interfacial bond stress that can be taken as 4.15 MPa [
17],
is the bond factor: 0.5 for round fibers, 0.75 for crimped fibers, and 1.00 for indented fibers,
the shear stress provided by steel fibers,
is the arch action that is equal to 1.0 for
greater than 2.80 and equal to
for
less than 2.80.
The first equation (Equations (5a) and (5b)):
The second equation (Equation (6)):
Parra-Montesinos in 2006 summarized the test data from beams subjected to shear force and reported the use of deformed steel fibers as an alternative minimum stirrups for beams subjected to factored shear forces ranging from
to
(in SI units). The range of those values corresponds to 0.5V
c and V
c. The SFRC beams with a fiber volume fraction of 0.75% or greater exhibited ultimate shear stresses that were greater than the conservative lower bound value of
MPa. Therefore, the shear strength of SFRC beam can be expressed in Equation (7).
Kwak et al. in 2002 conducted an experimental program and proposed equations to predict the shear strength of SFRC beams, as shown in Equation (8). The shear strength prediction equation is expressed in Equation (8a).
where e is shown in Equation (8b).
The proposed shear strength is expressed in Equation (9), where the first and second terms are the contribution of the beam compression zone to shear strength and shear strength provided by steel fibers, respectively. It shall be noted that 0.11
is the uniform shear stress that is associated with the normal stress of 0.85
. This shear stress is assumed to act over the depth of the compression zone. Furthermore, the contribution of steel fibers to shear strength was derived by assuming the transferred tensile force across the critical crack through fiber tension depending on the crack width. The magnitude of that tensile force was estimated by using the constant stress rather than actual distribution. In order to simplify the derivation process, the tensile force below the tensile longitudinal reinforcing bar was ignored.
where c is the depth of neutral axis; β
1 is the ratio of equivalent rectangular compressive stress block depth-to-neutral axis depth; α is the angle for critical inclined crack (set as 45 degree); and (σ
t)
avg is the average tensile stress.
Wu modified Dinh’s shear strength model (2014). The uniform shear stress is 0.12f’
c instead of 0.11f’
c. This uniform shear stress corresponded with the normal stress of 0.80f’
c. In addition, the strain in the extreme layer of the concrete compression zone was assumed to be 0.004 rather than 0.003 from the regression results of SFRC cylinder tests. The shear strength model proposed by Wu is given in Equation (11), in which the parameters λ
1, λ
2, and λ
3 are defined as 0.25, 1.2, and 1, respectively.
where
is the beam section height; σ
pc is the post-cracking stress; and
is the factor relating fibers pullout ratio, efficiency factor of orientation in the crack state, and the number of fibers pulling out per unit area.
2.3. Evaluation of Shear Strength Prediction Equations
Eight equations are compared with test results. Two-hundred thirty-six test results from reinforced concrete and SFRC beams without shear reinforcement and with concrete compressive stress ranging from 20.6 to 194 MPa, shear span-to-effective depth ratio ranging from 1.0 to 6.0, and fiber volume fraction ranging from 0 to 2%, are collected [
11,
13,
17,
21,
24,
25,
26,
29,
30,
31,
32,
33,
34,
35,
36,
37,
38,
39]. The relationship between measured and predicted shear strengths using previous shear strength prediction equations is shown in
Figure 3. The statistic evaluation results, namely mean and coefficient of variation (COV) values for comparison between measured and predicted strengths are summarized in
Table 1 and shown in
Figure 3 as well. If a data point appears above the solid line, the measured strength is greater than the predicted stress; otherwise, the predicted strength is greater than the measured strength. Two dashed lines are shown as boundaries with 20% offset from the predicted shear strength.
The shear strength model proposed by Sharma (Equation (2)) tends to overestimate the shear strength of SFRC beam. One-hundred specimens appear below the lower dashed line, which means that the measured shear strength values of 100 specimens are less than 80% of the corresponding predicted shear strength values. On the other hand, the measured shear strength values of 57 specimens are greater than 120% of the corresponding predicted shear strength values. Calculated shear strength values using the model proposed Narayanan and Darwish (Equation (3)) and Ashour et al. (Equations (5) and (6)) show conservative results compared to results from Sharma’s equation (Equation (2)). This may have occurred due to the former three equations considering explicitly the parameters affecting the shear strength of SFRC beams. By contrast, Sharma’s model misses the effects of longitudinal reinforcement ratio and steel fiber parameters. By using Equations (3) and (5), most of the data appears above the lower dashed line; by contrast, using the second equation of Ashour et al. (Equation (6)) exhibits more data appearing below the bottom dashed line (
Figure 3d) compared to results from Equations (3) and (5).
Parra-Montesinos [
15] constructed a database by considering the shear span-to-effective depth ratio, cylinder concrete compressive strength, fiber volume fraction, steel fiber tensile strength, and fiber aspect ratio. Parra-Montesinos [
15] set
(Equation (7)) as a lower bound for evaluating the application of steel fibers in SFRC beams and for supporting the use of deformed steel fibers as the minimum shear reinforcement regardless of the shear span-to-effective depth ratio, concrete compressive strength, or the longitudinal tensile reinforcement ratio. Parra-Montesinos [
15] reported that the shear stress values of SFRC beams with fiber volume fraction of 0.75% or greater (based on Parra-Montesinos’s database) were greater than
(MPa).
Figure 3e shows that there are 60 specimens located below the lower dashed line. In general, the shear strength model from Parra-Montesinos (Equation (7)) is more conservative than that derived by Sharma (Equation (2)).
The equation proposed by Kwak et al. (Equation (8)) appears to be superior to the equations proposed by Sharma (Equation (2)), Narayanan and Darwish (Equation (3)), and Ashour et al. (Equation (5)). Only 18 points appear below the lower dashed line. This number is slightly greater than the number exhibited by using Equation (6). The shear model proposed by Kwak et al. involves the important parameters affecting shear strength. Dinh’s shear strength model is not as conservative as the shear strength model proposed by Kwak et al., since the former has 131 specimens appearing above the upper dashed line, while the latter shows 137 specimens appearing above the upper dashed line. Wu’s shear strength model is simillar to Dinh’s shear strength model; however, the latter shows better results. Using Wu’s equation leads 32 specimens to lie below the bottom dashed line, while Dinh’s equation results in 30 specimens lying below the bottom dashed line. Among the eight equations reviewed, the shear strength prediction equation proposed by Narayan and Darwish (Equation (3)) [
12] shows the smallest coefficient of variation (COV). Therefore, out of these eight equations, Equation (3) can show more precise results.

