Article

In Vitro Cytotoxicity of Possible Corrosion Products from Mg-Based Biodegradable Metals: Magnesium Oxide and Magnesium Hydroxide Nanoparticles

1
Department of Energy and Environmental Systems, North Carolina Agricultural and Technical State University, Greensboro, NC 27411, USA
2
Engineering Research Center for Revolutionized Metallic Biomaterials, North Carolina Agricultural and Technical State University, Greensboro, NC 27411, USA
3
Department of Chemical, Biological and Bioengineering, North Carolina Agricultural and Technical State University, Greensboro, NC 27411, USA
4
Department of Animal Sciences, North Carolina Agricultural and Technical State University, Greensboro, NC 27411, USA
5
Department of Mechanical Engineering, North Carolina A & T State University, Greensboro, NC 27411, USA
*
Author to whom correspondence should be addressed.
Appl. Sci. 2019, 9(20), 4304; https://doi.org/10.3390/app9204304
Submission received: 6 September 2019 / Revised: 7 October 2019 / Accepted: 8 October 2019 / Published: 14 October 2019
(This article belongs to the Special Issue Degradable/Resorbable Metallic Alloys for Biomedical Applications)

Abstract

:
Biodegradable magnesium (Mg) alloys have potential applications in orthopedic implants due to their mechanical and osseointegration properties. However, the surface characteristics, biocompatibility, and toxicity of the released corrosion products in the form of magnesium oxide (MgO) and magnesium hydroxide (Mg(OH)2) nanoparticles (NPs) at the junction of implants and in the surrounding tissue are not completely understood. Here, we investigated in vitro cytotoxicity and morphological changes in human fetal osteoblast (hFOB) 1.19 cells in response to various concentrations (1 mM, 5 mM, 10 mM, and 50 mM) of MgO/Mg(OH)2 NPs by live/dead assay and scanning electron microscopy (SEM). In this study, we performed a surface characterization of MgO/Mg(OH)2 NPs to evaluate the size of the NPs. Further, an immersion test was performed in Dulbecco’s Modified Eagle’s Medium (DMEM) with randomly selected various concentrations (1 mM, 5 mM, 10 mM, 50 mM, and 100 mM) of MgO/Mg(OH)2 NPs to understand the degradation behavior of the NPs, and the change in the pH values from days 1 to 7 was measured. After conducting an immersion test for seven days, the highest concentration (100 mM) of MgO/Mg(OH)2 NPs was selected to study the element depositions on nanoparticles through scanning electron microscopy–energy-dispersive X-ray spectroscopy (SEM–EDX) mapping. The results from this in vitro cytotoxicity study suggest that less than or equal to 5-mM concentrations of MgO/Mg(OH)2 NPs are tolerable concentrations for hFOB 1.19 cells. This study provides a foundational knowledge of MgO/Mg(OH)2 NP cytotoxicity in hFOB 1.19 cells that can help to develop future sustainable biodegradable magnesium-based alloys for orthopedic applications.

1. Introduction

Orthopedics is a multibillion-dollar global industry that is mainly focused on the diagnosis, treatment, and prevention of musculoskeletal system via surgical and nonsurgical therapeutic interventions. Orthopedic devices have gained a considerable amount of attention for the treatment of bone, joint, and muscular injury. According to the American Academy of Orthopedic Surgeons (AAOS), musculoskeletal problems are the most prevalent medical conditions, and more than 130 million patients need medical attention each year [1]. Reports have also suggested that the annual cost of musculoskeletal disorders in the US is about $510 billion [2]. Therefore, there is a great demand for orthopedic devices in this industry. Current metallic biomaterials have been used to repair or replace existing damaged bone tissues due to their mechanical strength and fracture toughness [3]. However, these metallic biomaterials release toxic metallic particles through a corrosion process [4,5,6,7,8]. These toxic corrosion particles lead to inflammatory responses, which reduce the biocompatibility of implants and result in tissue damage [4,5,6,7,8,9,10,11,12,13,14,15]. Several foundational studies on humans have suggested that magnesium (Mg)-based alloys be used for orthopedic implants. These implants were abandoned due to their rapid degradation and accumulation of hydrogen gas in adjacent tissues at the site of implant [16,17]. However, magnesium (Mg) was rediscovered as a biodegradable material in orthopedic applications due to its biocompatibility and structural stability [18]. These biodegradable implants (after supporting the diseased tissues and bone fractures) degrade in the physiological environment of the body. Therefore, this eliminates the need for a second surgery to remove implants. However, unpredictable degradation behavior, the formation of gas cavities at the junction of the implant and the surrounding tissues, and their compromised structural integrity in an in vivo environment makes Mg-based implants challenging [19]. Some studies have reported a disparity between in vitro and in vivo corrosive environments for Mg-based alloys [20,21].
Moreover, the surface characteristics, biocompatibility, and toxicity of the corrosion products released from Mg-based implants in the form of MgO/Mg(OH)2 nanoparticles (NPs) (at the junction of implants and surrounding tissues) are not completely understood. Therefore, there is a need to control the corrosion rate of these implants for better performance for an adjustable amount of time. The purpose of this study, therefore, was to determine the in vitro cytotoxicity of magnesium oxide (MgO) and magnesium hydroxide (Mg(OH)2) nanoparticles (NPs) in human fetal osteoblast (hFOB) 1.19 cells to understand an acceptable concentration of release from biodegradable Mg-based alloys to develop a sustainable implant for future in vivo studies. In this study, a surface characterization of MgO/Mg(OH)2 NPs was performed to evaluate the size of the nanoparticles.
Further, we systematically investigated the degradation behavior of various concentrations (1 mM, 5 mM, 10 mM, 50 mM, and 100 mM) of MgO/Mg(OH)2 NPs through an immersion test in Dulbecco’s Modified Eagle’s Medium (DMEM), and the change in the pH values from day 1 to 7 was measured. After seven days, we investigated the elemental depositions on MgO/Mg(OH)2 NPs for the higher concentration (100 mM) through scanning electron microscopy–energy-dispersive X-ray spectroscopy (SEM–EDX) mapping. Since the results of the pH values obtained from the immersion test between 50- and 100-mM concentrations of MgO/Mg(OH)2 did not show a significant difference, we therefore optimized the 50-mM concentration as the highest concentration for further experiments.
A live/dead assay and SEM were performed to study the cytotoxicity and morphological changes in the hFOB 1.19 cells in response to various concentrations (1 mM, 5 mM, 10 mM, and 50 mM) of MgO/Mg(OH)2 NPs. The result of this cytotoxicity study provided a foundational knowledge of the tolerable range of MgO/Mg(OH)2 NPs that might be released from biodegradable Mg-based alloys to improve the current challenge of implant degradation for future in vivo studies.

2. Materials and Methods

2.1. Materials

Magnesium oxide nanoparticles (MgO NPs) (nanopowder, <50-nM particle size; Cat# 549649-5G) and magnesium hydroxide nanoparticles (Mg(OH)2 NPs) (nanopowder, <100-nM particle size; Cat# 632309-25G) were purchased from Sigma-Aldrich, USA.

2.2. Immersion Test and pH Measurement

We investigated the degradation behavior of the MgO/Mg(OH)2 NPs through an immersion test. After the sterilization of various concentrations of MgO/Mg(OH)2 NPs (1 mM, 5 mM, 10 mM, 50 mM, and 100 mM) through ultraviolet (UV) rays for 15 min, samples were immersed in 1 mL of Dulbecco’s Modified Eagle’s Medium (DMEM) with 4.5 g/L glucose and sodium pyruvate without L-glutamine and phenol red (Cat# 17-205-CV, Cellgro) for 7 days in a 24-well plate. Each sample was carried out in triplicate. Samples were maintained in an Isotemp incubator (ThermoFisher Scientific, NC, USA) under standard cell culture conditions (37 °C, 5% CO2) to study the change in pH from day 1 to 7. The pH values were measured at time points during days 1–7 using a pH meter (Oakton® pH2100, Eutech Instruments, Singapore) to understand the degradation behavior of MgO/Mg(OH)2 NPs.

2.3. Surface Morphology and Element Analysis

The surface characteristics of MgO/Mg(OH)2 NPs were determined by a Hitachi SU8000 Field Emission Scanning Electron Microscope (Hitachi High Technologies America, Dallas, TX) after gold-coating the samples using a Polaron E5400 Sputter coater. This gold coating served as a strain for SEM to enhance the contrast of the images. For effective results, the gold sputter chamber was flushed with argon gas at a low pressure at a direct current (DC) voltage between 1000 and 3000 volts. In addition, after conducting the immersion test for 7 days, samples were gold-coated, and element depositions on the MgO/Mg(OH)2 NPs were analyzed through EDX Quantax Esprit 1.8.2 software (Bruker). Further, an EDX mapping analysis was performed to evaluate the element distribution on the MgO/Mg(OH)2 NPs. With the EDX mapping, each element was scanned individually across the entire surface of the MgO/Mg(OH)2 NPs. An overlay of all the elements distributed on the surface of the MgO/Mg(OH)2 NPs was observed to predict the presence of the corrosion products.

2.4. Cell Culture and Treatment

Human fetal osteoblast (hFOB) 1.19 cells (SV40 large T antigen transfected; American Type Culture Collection) (Cat# ATCC® CRL-11372™) were cultured in complete growth media (1:1 mixture of Ham’s F12 medium with L-glutamine (Cat#10-080-CV, Cellgro) and Dulbecco’s Modified Eagle’s Medium with 4.5 g/L glucose and sodium pyruvate without L-glutamine and phenol red (Cat# 17-205-CV, Cellgro)) supplemented with 0.3 mg/mL gentamicin sulfate (Cat# 17-518Z, Lonza) and 10% fetal bovine serum (heat-inactivated at 56 °C) (Cat# S1105H, Atlanta Biologicals) under standard cell culture conditions (37 °C, 5% CO2) with humidified air. After the third passage, cells were seeded (50,000 cells/well) in 1 mL of complete growth media on a glass coverslip in a 24-well plate. Further, cells were incubated under standard cell culture conditions (37 °C, 5% CO2) with humidified air for 2–3 days to allow for adhesion to a 24-well plate. Experimental groups received the cells cultured in complete growth media; however, negative control groups received media only and cells cultured in complete growth media. Further, 24-well plates were aspirated.
Various concentrations of MgO/Mg(OH)2 NPs (1 mM, 5 mM, 10 mM, and 50 mM) were sterilized for 15 min in an ultraviolet (UV) light before exposure to hFOB 1.19 cells to prevent any microbial growth. After sterilization, each concentration of MgO/Mg(OH)2 NPs was immersed in 1 mL of complete growth media in a 15 mL tube (Cat#05-539-5, Fisher brand). Control groups received 0.5 mL of freshly prepared complete growth media; however, experimental groups received 0.5 mL of various concentrations (1 mM, 5 mM, 10 mM, and 50 mM) of MgO/Mg(OH)2 NPs prepared in complete growth media on the 24-well plates. Samples were incubated under standard cell culture conditions (37 °C, 5% CO2) with humidified air for 30 min. Each sample was in triplicate for the reproducibility of the results. Further, 24-well plates were aspirated, and samples were rotated slightly in 1X phosphate-buffered saline (PBS) (Cat#21-040-CM, Cellgro) maintained at pH 7.4 to remove nonadherent cells. They were allowed to sit for 10 min at room temperature (RT).

2.5. Live/Dead Assay

A Live/Dead® Viability/Cytotoxicity kit (Cat# L3224, Invitrogen) was utilized to study the cell viability and cytotoxicity in hFOB 1.19 cells in response to various concentrations (1 mM, 5 mM, 10 mM, and 50 mM) of MgO/Mg(OH)2 NPs. With this two-color fluorescence-based assay, live and dead cells were determined by calcein acetomethoxy (calcein AM) and ethidium homodimer (EthD-1) dyes as a marker for cell viability and intracellular esterase activity and plasma membrane integrity. The intracellular esterase activity through the conversion of nonfluorescent cell-permeable calcein AM to intensified fluorescent calcein determined the live cells. Calcein was retained within the live cells to produce green fluorescence in the live cells (excitation/emission wavelengths of 495/515 nm), whereas EthD-1 entered through the damaged plasma membrane of the cells and showed a 40-fold enrichment of fluorescence upon binding to nucleic acids to produce a bright red fluorescence in dead cells (excitation/emission wavelengths of 495/635 nm).
Samples were allowed to rotate in 1X phosphate-buffered saline (PBS) and sit for 10 min at RT, as mentioned in Section 2.4. Meanwhile, for the preparation of the dye solution, 18 µL EthD-1 was added in 18 mL of PBS, followed by the addition of 18 μL of calcein AM, to achieve 0.5 mL of dye solution per sample in a 24-well plate for MgO/Mg(OH)2 NPs sample sets. Since each sample was in triplicate, for each sample set, 0.5 mL of freshly prepared dye solution was added slowly in drop-by-drop fashion. The 24-well plates were allowed to sit in the dark for 30–40 minutes, followed by observation under a fluorescence microscope (EVOS XL AMG).
Live (green) and dead (red) cells were counted utilizing Image J software (Version 1.48, National Institutes of Health, Bethesda, Maryland, USA). The percent (%) live cells was calculated as
Percent   ( % )   Live   cells = live   cells Total   number   of   cells × 100 .
Here, we calculated the total number of cells by adding the number of live cells to the number of dead cells. Further, the results for the percent (%) live cells were analyzed statistically by one-way analysis of variance (ANOVA) techniques using Prism version 5.0 (GraphPad Software, Inc., San Diego, CA, USA). The difference between means was considered statistically significant when the p-value was ≤0.05 when compared to controls. The results obtained were expressed as mean ± standard error (SE) or standard deviation (SD).

2.6. Morphological Changes in hFOB 1.19 Cells

A Hitachi SU8000 field emission SEM was utilized to observe morphological changes in the hFOB 1.19 cells in response to various concentrations (1 mM, 5 mM, 10 mM, and 50 mM) of MgO/Mg(OH)2 NPs. Samples were treated as mentioned in Section 2.4.
Further, samples were rinsed three times with 1X phosphate-buffered saline (PBS) (Cat#21-040-CM, Cellgro) maintained at pH 7.4 to remove any nonadherent cells. The attached hFOB 1.19 cells were fixed in 4% paraformaldehyde (Cat# 19943, Affymetrix) and were left for 15–20 min at RT, followed by aspiration. Further, 1X phosphate-buffered saline (PBS) was added thrice to the samples and was left for 5 min (each at RT), followed by aspiration. Different concentrations of ethanol were prepared in 1X phosphate-buffered saline (PBS): 30%, 50%, 70%, 90%, 95%, and 100%. Each sample was treated with 0.5 mL of each of the prepared concentrations of ethanol, starting from 30% for 5 min, followed by aspiration. Samples were treated with increasing concentrations of ethanol to remove any impurities, if any, before scanning through SEM. Samples were allowed to dry in a chemical fume hood prior to gold-coating on the samples being performed for SEM analysis. Further, an SEM analysis was performed to evaluate morphological changes in the hFOB 1.19 cells.

3. Results and Discussion

In this study, we investigated in vitro cytotoxicity in hFOB 1.19 cells in response to various concentrations of MgO/Mg(OH)2 NPs. An immersion test was conducted to study the degradation behavior of various concentrations (1mM, 5mM, 10mM, 50 mM, 100 mM) of MgO/Mg(OH)2 NPs in DMEM under standard conditions (37 °C, 5% CO2) for 1–7 days. Change in the pH values was measured at time points during days 1–7. After seven days, elemental depositions on MgO/Mg(OH)2 NPs were analyzed through SEM–EDX analysis. Further, a fluorescence-based live/dead assay was conducted to evaluate the cell viability and cell-mediated cytotoxicity in hFOB 1.19 cells upon exposure to various concentrations (1 mM, 5 mM, 10 mM, and 50 mM) of MgO/Mg(OH)2 NPs for 30 min. In addition, the morphological characterization of the hFOB 1.19 cells in response to the various concentrations of MgO/Mg(OH)2 NPs was evaluated using SEM.

3.1. Surface Characterization of MgO/Mg(OH)2 NPs through SEM

The surface topology of MgO/Mg(OH)2 NPs was analyzed by SEM. The results showed that the average size of the MgO NPs was <50 nM, whereas the average size of the Mg(OH)2 NPs was <100 nM, as shown in Figure 1 and Figure 2, respectively. The results in Figure 1 confirm that the average particle size of the MgO NPs was <50 nM (particle sizes of 39.69 nM at a 5 μm resolution and 41.67 nM at a 1 μm resolution are shown). However, the average particle size of Mg(OH)2 NPs was <100 nM (particles sizes of 59.53 nM at a 5 μm resolution and 92.60 nM at a 1 μm resolution are shown), as shown in Figure 2. The color of the MgO/Mg(OH)2 NPs was white; however, the particles were irregular in shape. A particle size analysis was conducted using Image-Pro Plus based on the SEM image. Briefly, we randomly selected three regions followed by histogram-based particle selection and particle counting.

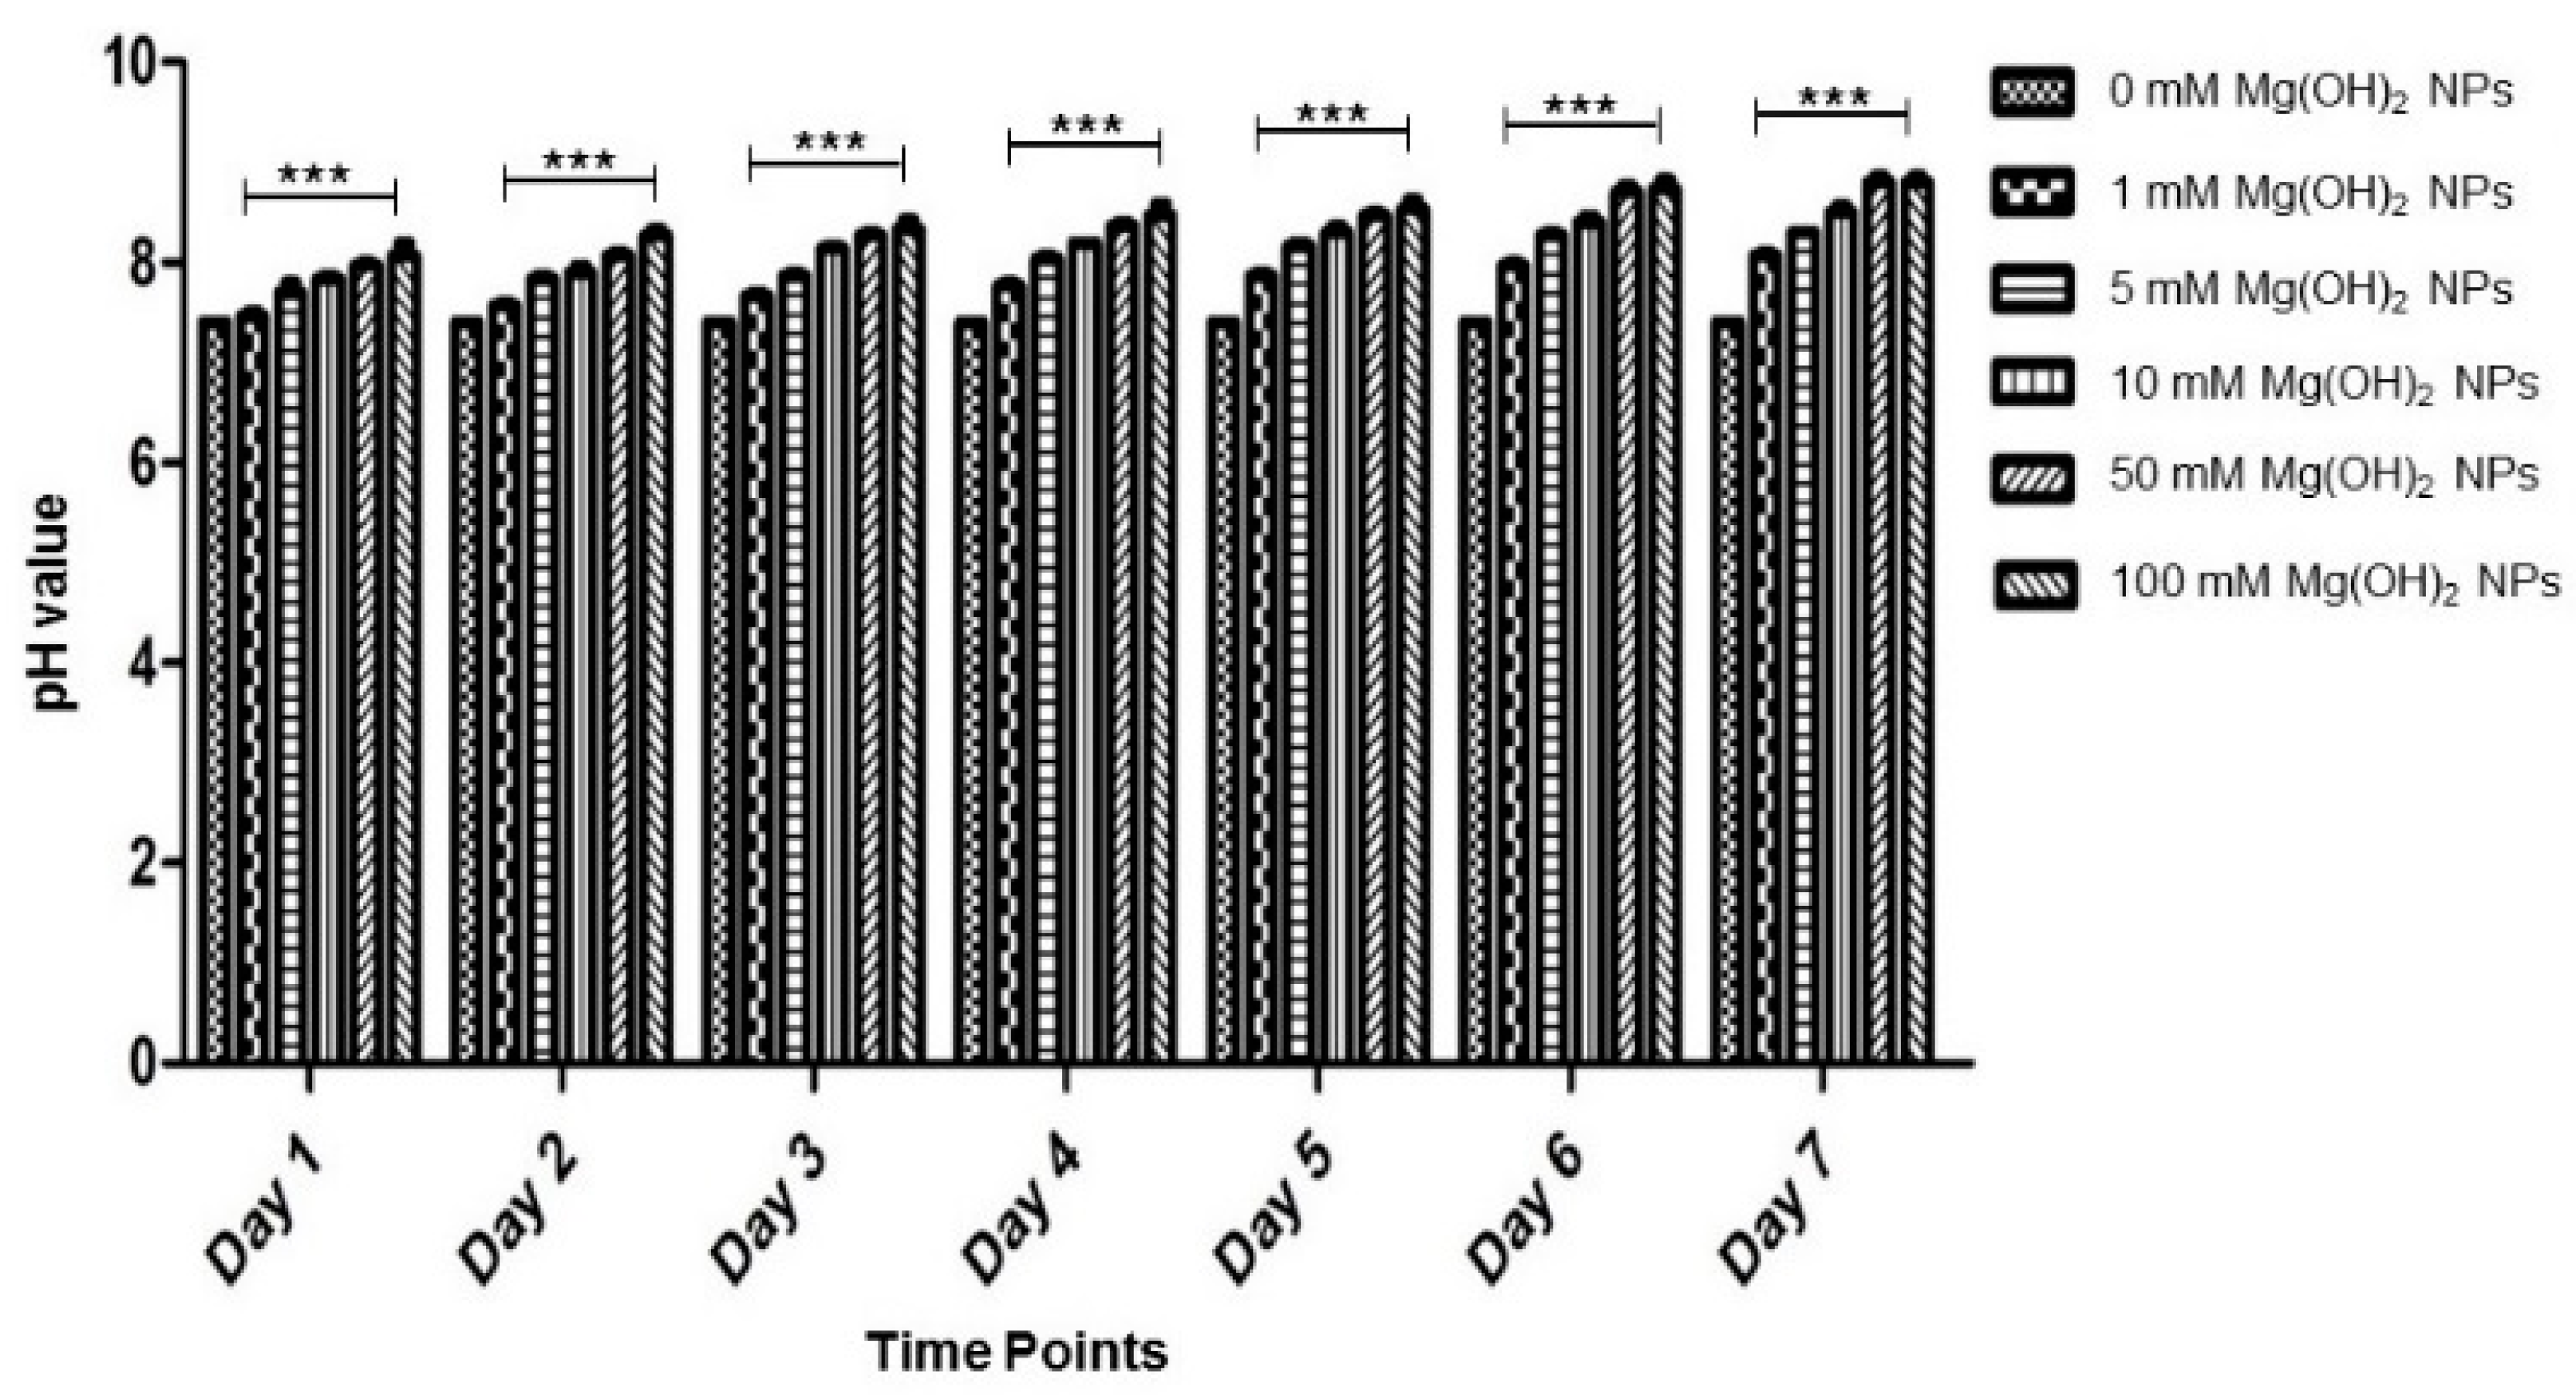
3.2. Change in the pH Values in Response to Various Concentrations of MgO/Mg(OH)2 NPs

The degradation behavior of various concentrations of MgO/Mg(OH)2 NPs was studied in 1 mL of DMEM under standard conditions (37 °C, 5% CO2) to understand the degradation behavior of these corrosion products. The change in the pH values was measured from days 1 to 7. As represented in Figure 3, the pH values of the aqueous suspensions of MgO NPs (1 mM = 7.43, 5 mM = 7.60, 10 mM = 7.67, 50 mM = 7.80, and 100 mM = 7.83) were more alkaline when compared to the control group (0 mM = 7.40) for day 1. On day 7, the pH values of the aqueous suspension of MgO NPs were increased (1 mM = 7.93, 5 mM = 8.03, 10 mM = 8.07, 50 mM = 8.57, and 100 mM = 8.73) significantly when compared to the control group (0 mM = 7.40). An increase in the pH values clearly indicated the higher degradation rate of the MgO NPs in DMEM.
Figure 4 shows that the pH values of the aqueous suspension of Mg(OH)2 NPs (1 mM = 7.50, 5 mM = 7.70, 10 mM = 7.80, 50 mM = 8.0, and 100 mM = 8.0) were more alkaline when compared to the control group (0 mM = 7.40) for day 1. On day 7, the pH values of the aqueous suspension of Mg(OH)2 NPs were increased (1 mM = 8.07, 5 mM = 8.30, 10 mM = 8.50, 50 mM = 8.80, and 100 mM = 8.80) significantly compared to the control group of Mg(OH)2 NPs (0 mM = 7.40). However, we observed no influence on the pH values of the control group for both MgO and Mg(OH)2 NPs (0 mM = 7.40) from days 1 to 7.
The immersion test result showed that the size and concentrations of the MgO/Mg(OH)2 NPs regulated their degradation behavior in DMEM. The higher concentrations of NPs (>50 mM) showed increased degradation behavior when compared to lower concentrations (<50 mM) and the control groups (no influence on the pH). At higher concentrations, the solution was more alkaline due to the release of an OH ion. The release of increased OH ions at higher concentrations of MgO/Mg(OH)2 NPs indicates a challenge for future biodegradable Mg-based alloys. The result of this immersion test provides tolerable lower concentrations of MgO/Mg(OH)2 NPs that might be released from the biodegradable Mg-based alloys to help develop innovative alloys for successful implementation in future in vivo testing.

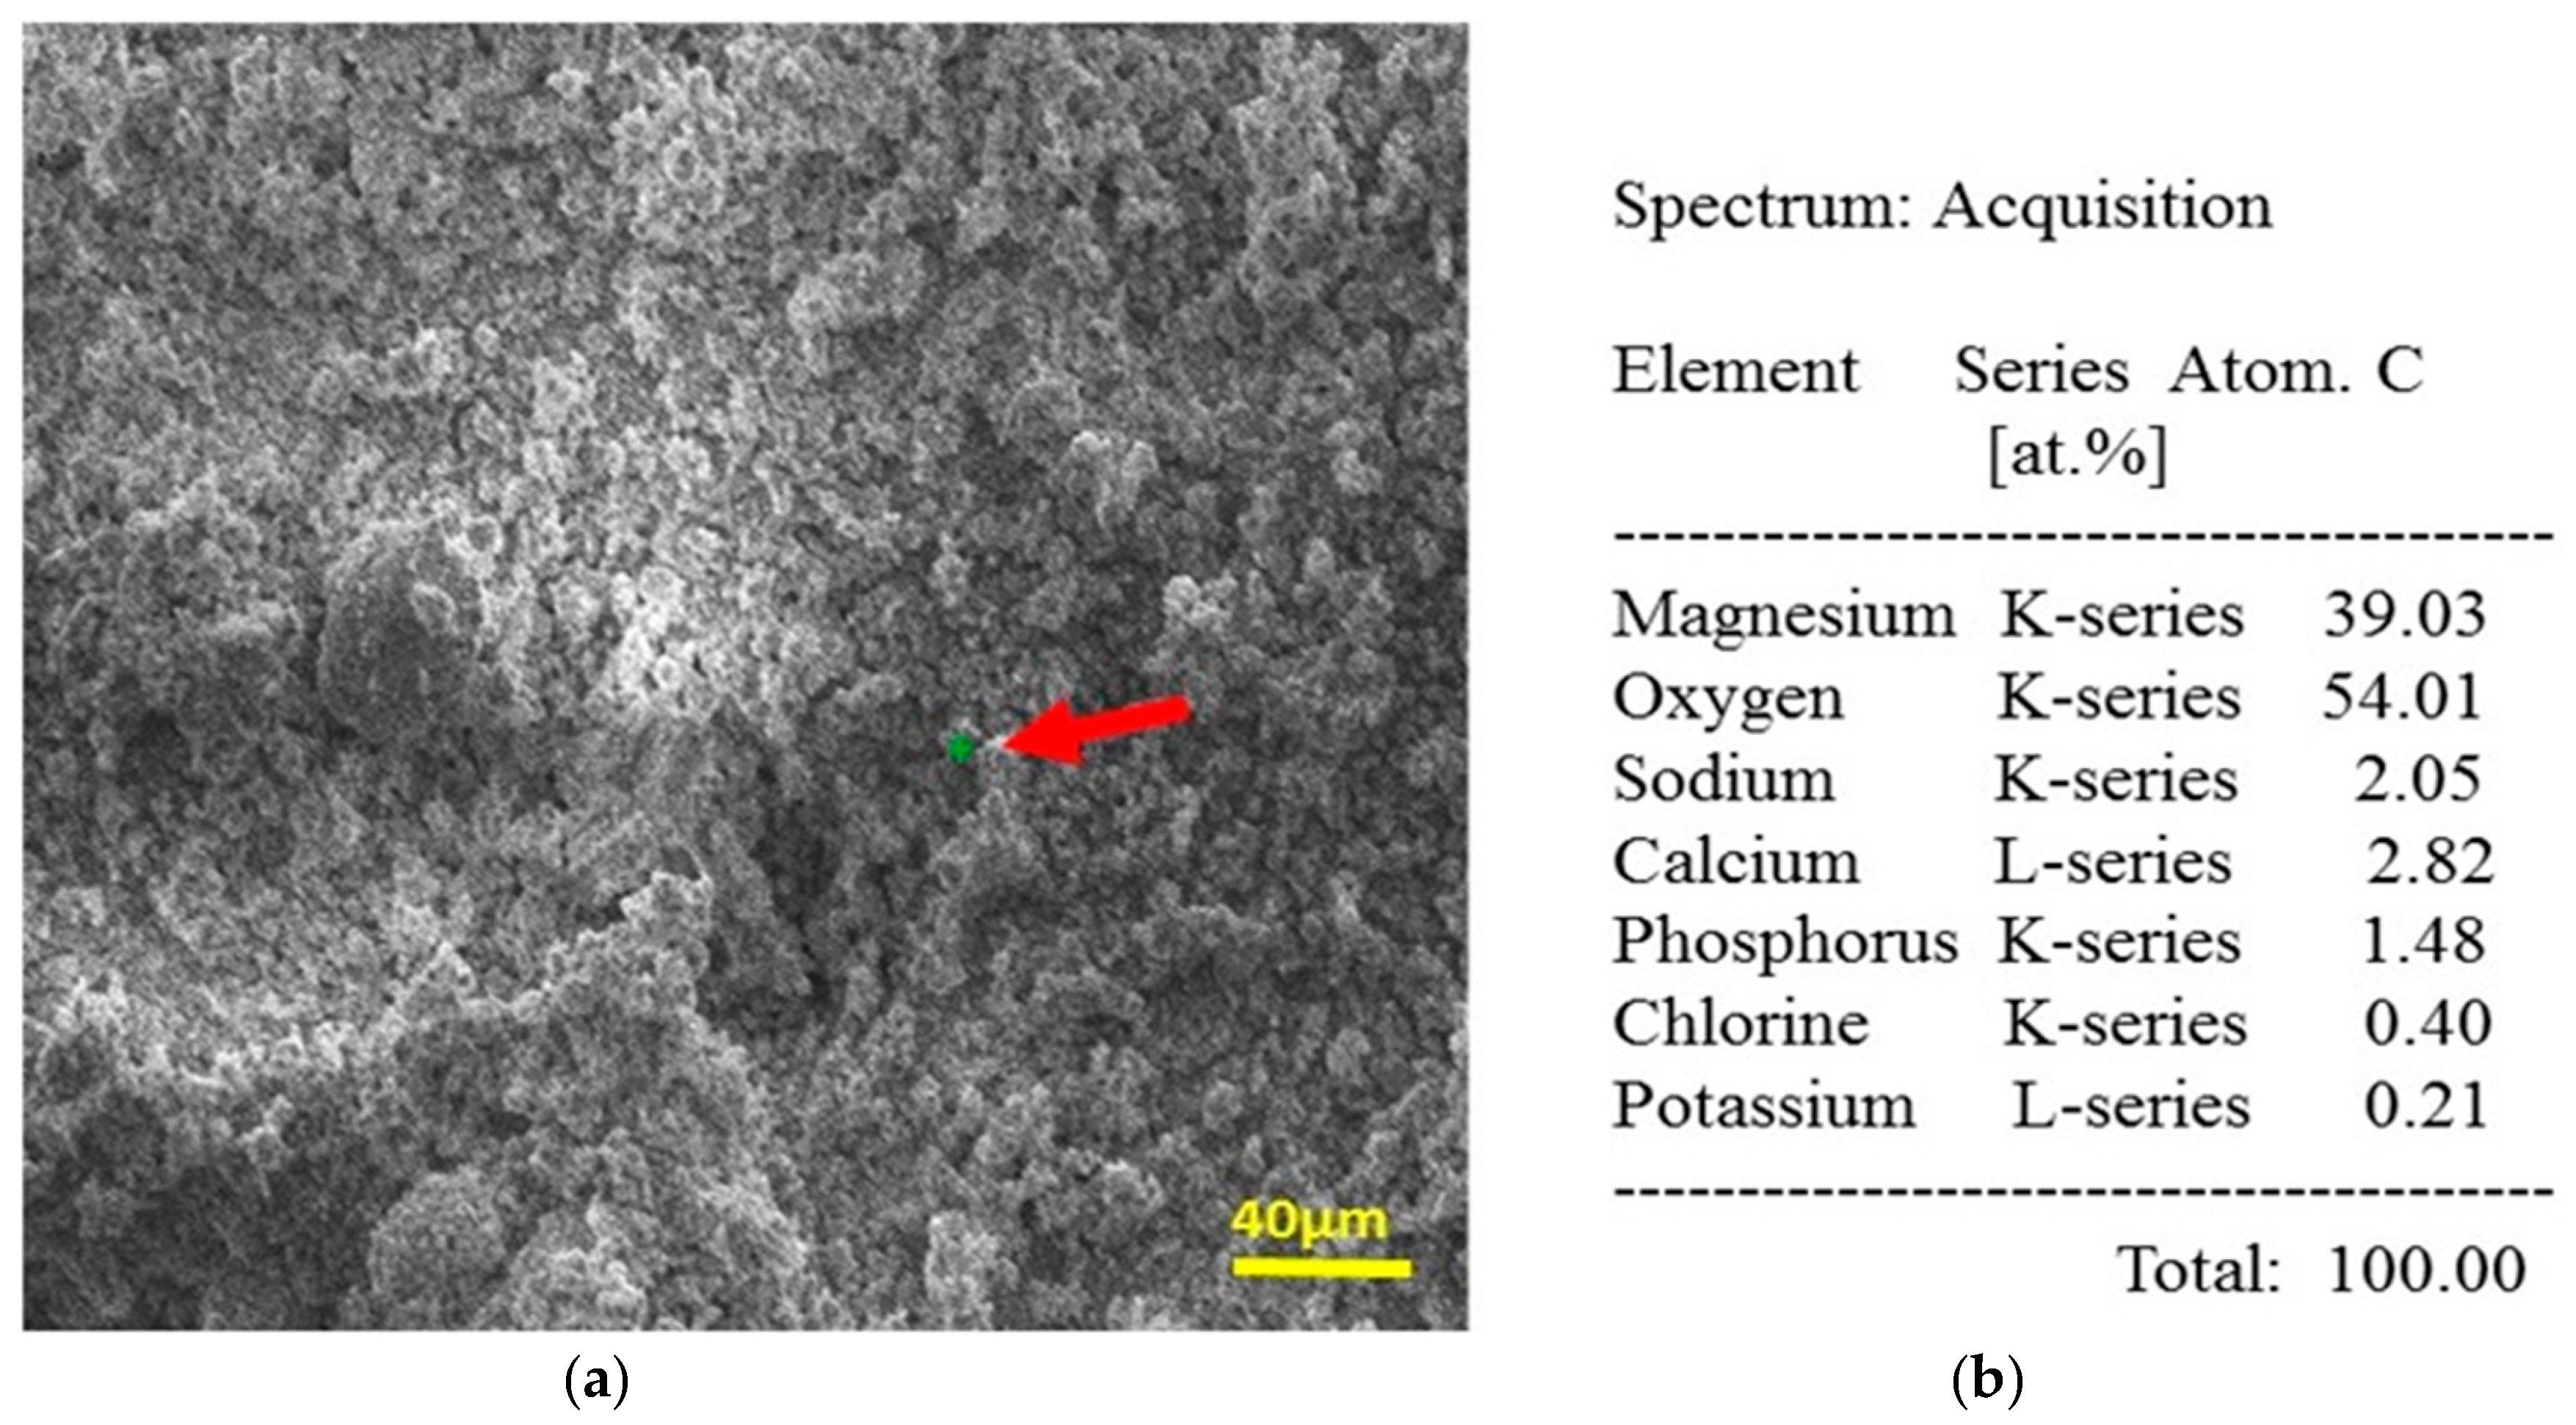
3.3. Element Depositions on MgO/Mg(OH)2 NPs after Immersion Test

Elemental depositions on MgO/Mg(OH)2 NPs were determined using SEM–EDX analysis after immersion tests in DMEM. Samples with 100-mM concentrations of MgO/Mg(OH)2 NPs were dried, gold-coated, and analyzed through SEM–EDX analysis. Figure 5 shows the presence of Mg, O, Na, Ca, P, Cl, and K as the corrosion products.
Figure 6 shows the presence of Mg, O, Na, Ca, P, Cl, and K as the corrosion products for Mg(OH)2 NPs through SEM–EDX analysis after an immersion test conducted in DMEM for seven days.
Further, SEM–EDX mapping confirmed the presence of corrosion products for MgO/Mg(OH)2 NPs. Figure 7 and Figure 8 illustrate the presence of Mg, O, Na, Ca, P, Cl, and K as corrosion products after the incubation of MgO/Mg(OH)2 NPs in DMEM for seven days.

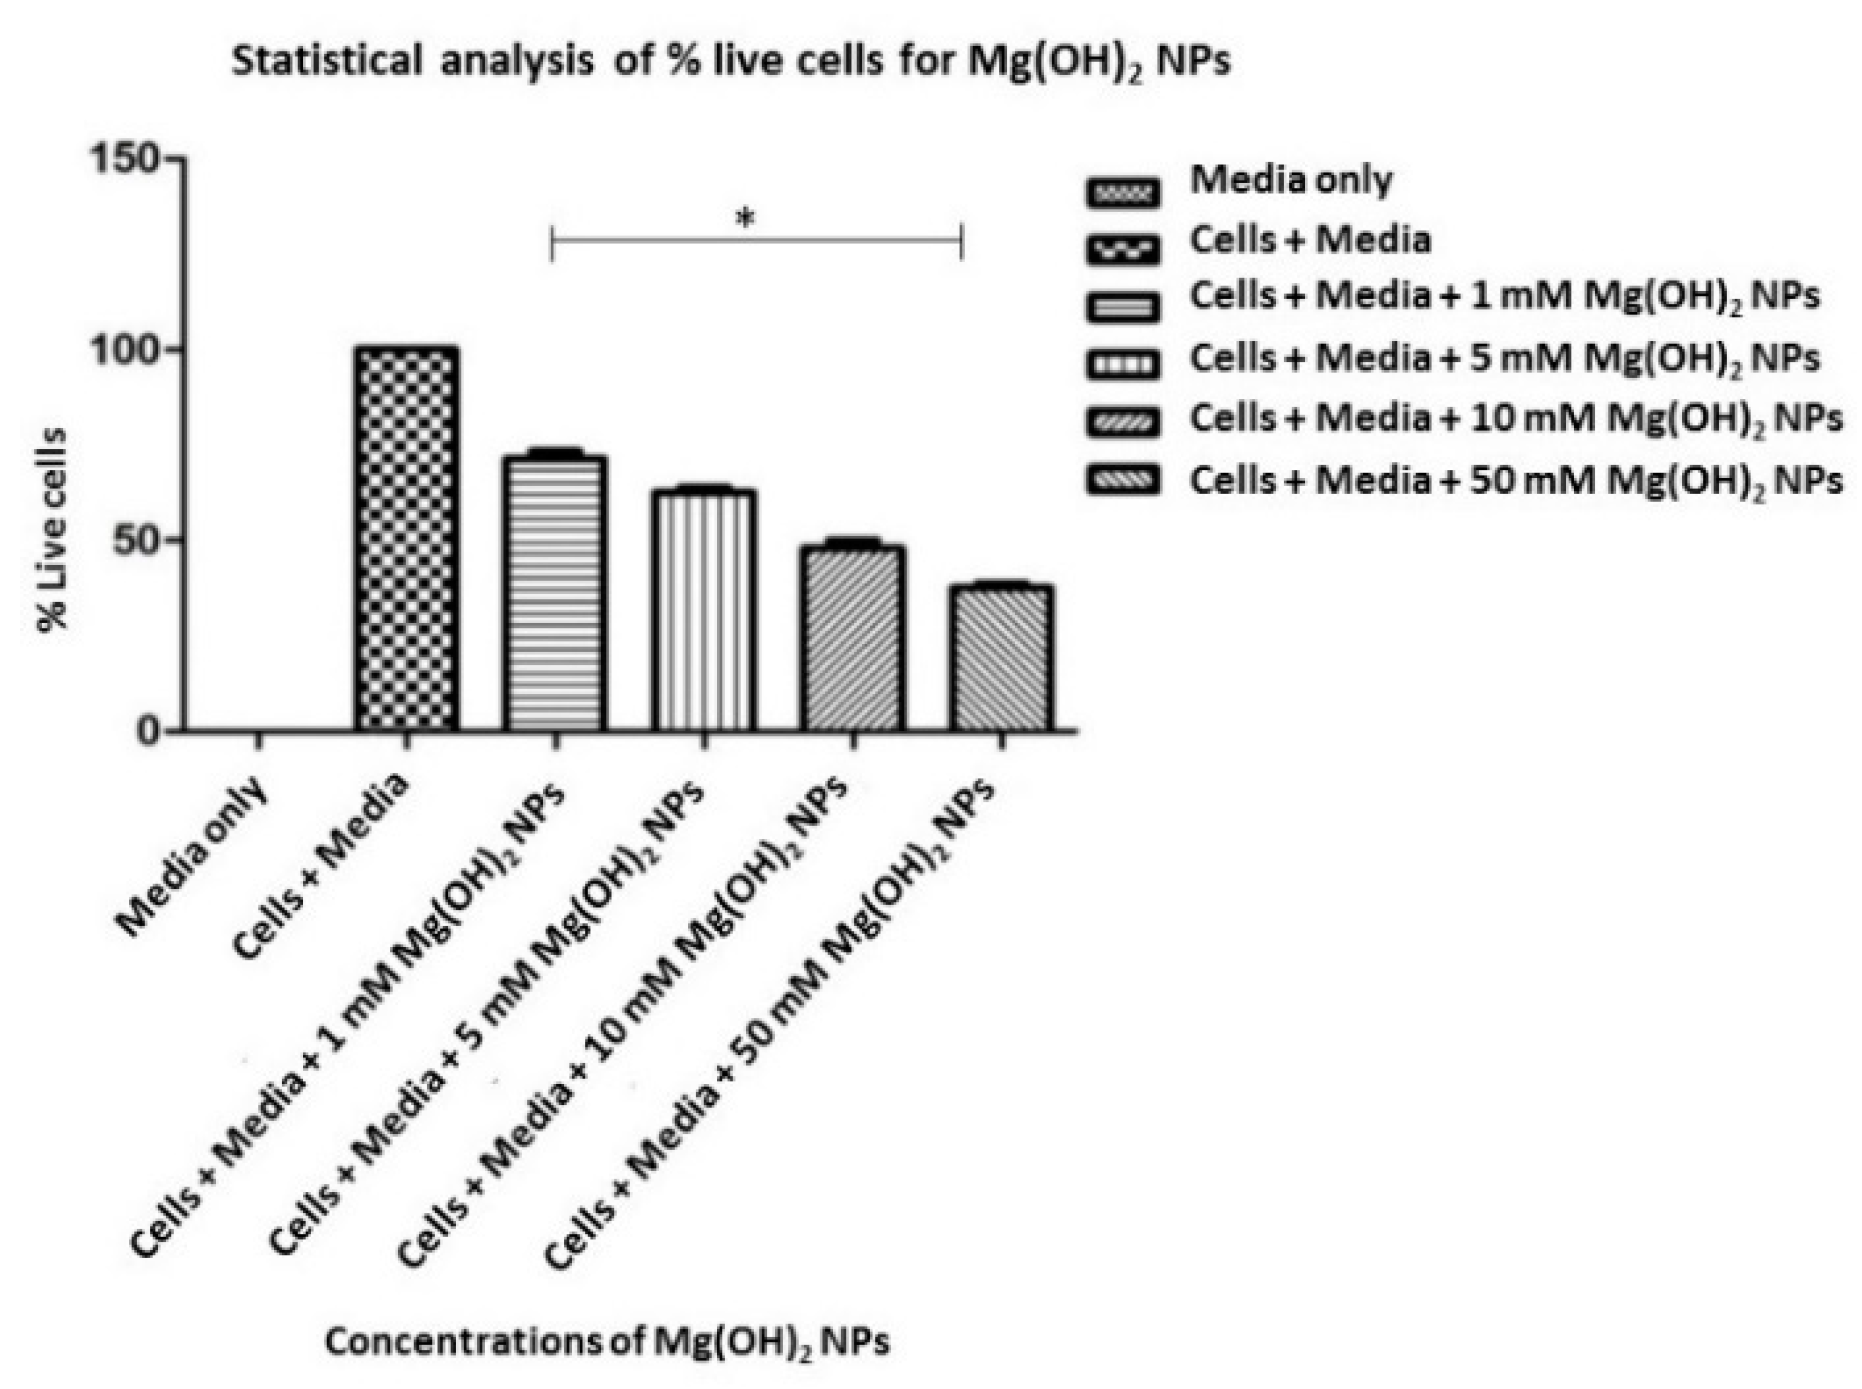
3.4. The Cell Viability and Cytotoxicity Study in hFOB 1.19 Cells

Cell viability and cytotoxicity in hFOB 1.19 cells in response to various concentrations (1 mM, 5 mM, 10 mM, and 50 mM) of MgO/Mg(OH)2 NPs were studied through a live/dead assay, as represented in Figure 9 and Figure 10, respectively. Fluorescence microscope results showed green (live), healthy, and viable hFOB 1.19 cells with a few red (dead) cells upon exposure to lower concentrations (5 mM or less) of MgO/Mg(OH)2 NPs when compared to the higher concentrations (10 mM or more). The negative control group Figure 9b and Figure 10b results showed green (live), healthy, and viable cells with no red (dead) cells. An increase in competitive red (dead) cells at the higher concentrations indicated cytotoxicity in the cells. Figure 10f illustrates the clustering of hFOB 1.19 cells in response to 50-mM concentrations of Mg(OH)2 NPs. The clustering of red (dead) cells indicated an agglomeration of Mg(OH)2 NPs within the cells, showing toxic effects on cell survival. Figure 11 and Figure 12 represent a statistical analysis of the % live cells for MgO/Mg(OH)2 NPs.

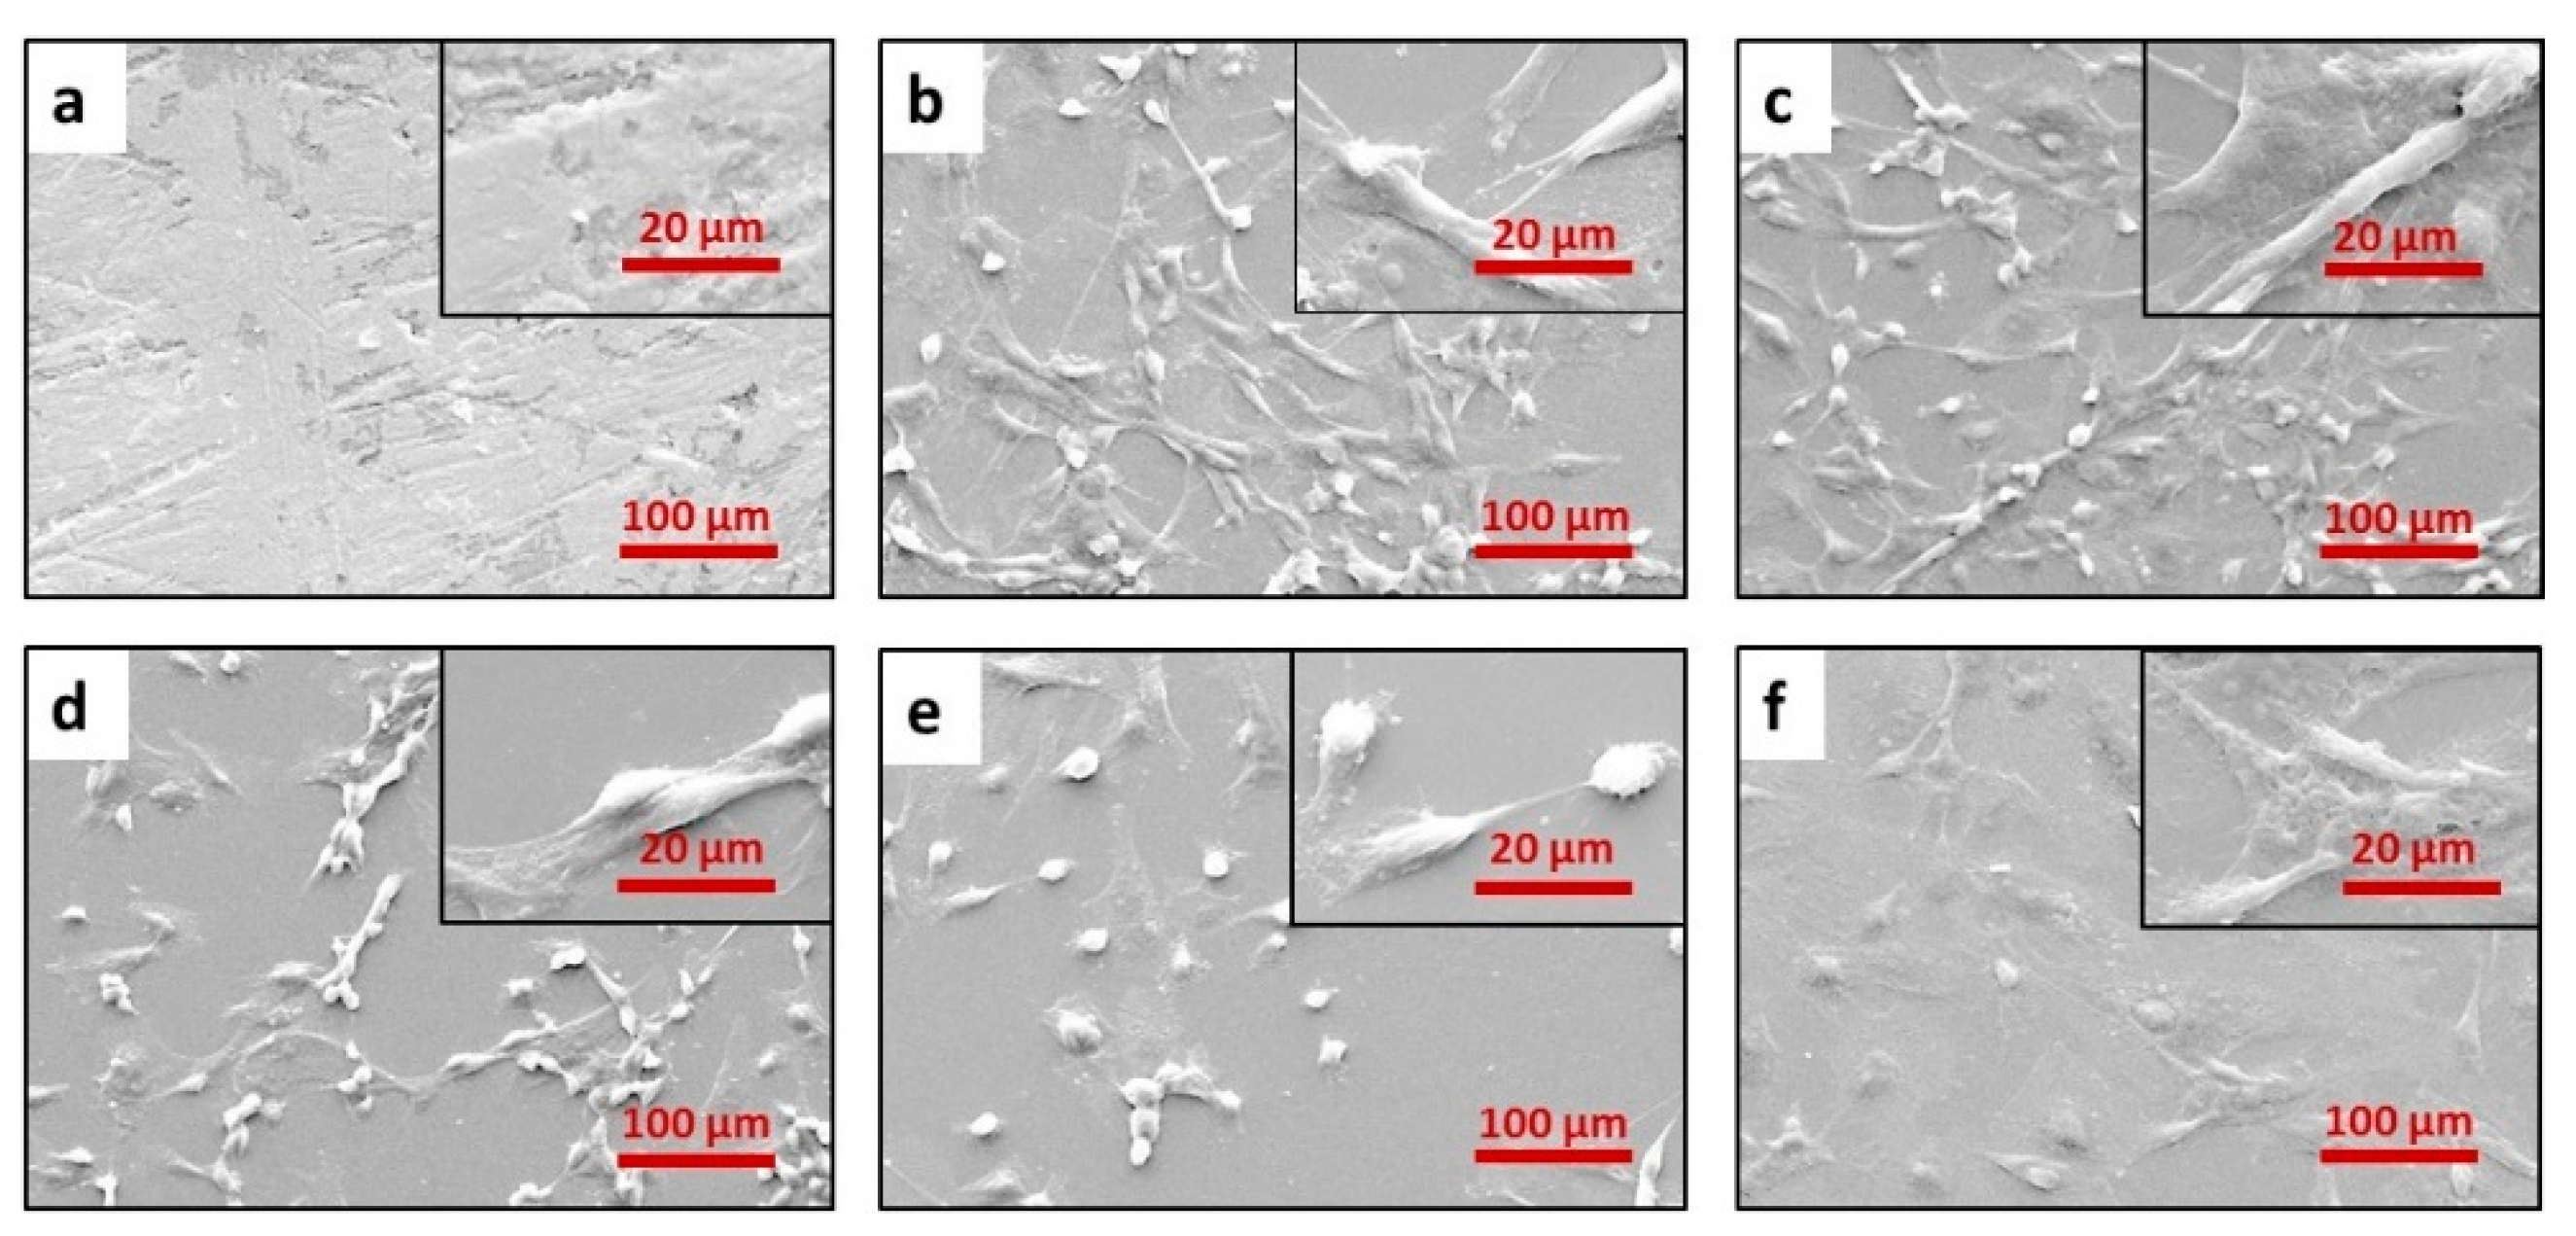
3.5. Morphological Changes in hFOB 1.19 Cells

SEM was utilized to study the morphological changes in hFOB 1.19 cells in response to various concentrations (1, 5, 10, and 50 mM) of MgO/ Mg(OH)2 NPs. The results in Figure 13 and Figure 14 illustrate the minimal impact on hFOB 1.19 cells upon exposure to lower concentrations of MgO/Mg(OH)2 NPs (1 and 5 mM). At these concentrations, hFOB 1.19 cells showed proliferation and elongation. However, upon exposure to higher concentrations (10 mM and 50 mM) of MgO/Mg(OH)2 NPs, morphological changes to round shape and the clustering of cells was observed. The compromised integrity of the plasma membrane of the hFOB 1.19 cells upon exposure to higher concentrations (10 and 50 mM) of MgO/Mg(OH)2 NPs indicated cytotoxic effects.

3.6. Discussion

In this study, we investigated the exposure of various concentrations (1 mM, 5 mM, 10 mM, and 50 mM) of MgO/Mg(OH)2 NPs in hFOB 1.19 cells to understand in vitro cytotoxicity. The determination of cytotoxicity in response to concentrations of MgO/Mg(OH)2 NPs in hFOB 1.19 cells will help develop sustainable biodegradable alloys as implant materials for commercial orthopedic devices. A recent study showed that the hemostasis of bone is affected by local pH and oxygen tension [22]. Hypoxia inhibits the proliferation and differentiation of the osteoblast cells responsible for bone formation and stimulates osteoclast cells that are associated with bone resorption. In addition, a foundational study on Mg-based implants reported a faster corrosion rate for implants in the physiological environment of the body, which makes it challenging to establish Mg as a biodegradable material [16]. One study also suggested that the exposure of corrosion products such as MgO to an aqueous solution leads to the formation of Mg(OH)2 [19]. Further, the corrosion of Mg(OH)2 in an aqueous solution containing 150 mmol/L of Cl forms magnesium chloride (MgCl2) and hydrogen (H2) gas [23]. In this study, we observed the presence of trace amounts of Cl for both MgO and Mg(OH)2 NPs after conducting the immersion test for seven days, as analyzed through SEM–EDX mapping (shown in Figure 7 and Figure 8). This result suggests the formation of water-soluble MgCl2. The presence of Ca and P indicates that these corrosion products might interact with the Ca and P present in the environment and disintegrate in bulk in the case of implant degradation into the surrounding medium, as explained in the biocorrosion model [24]. These insoluble complex compounds of MgO/Mg(OH)2 NPs in the form of magnesium phosphates might introduce cytotoxicity into hFOB 1.19 cells, as shown below:
3MgO + Ca3(PO4)2→Mg3(PO4)2 + 3CaO,
3Mg(OH)2 + Ca3(PO4)2→Mg3(PO4)2 + 3CaO + 3H2O.
The immersion test result showed rapid degradation behavior of MgO/Mg(OH)2 NPs in DMEM due to the release of more OH, which was indicated by an increase in the pH values for the concentrations 10 mM, 50 mM, and 100 mM when compared to lower concentrations (1 mM and 5 mM) and the control groups. On the basis of the results of the pH values obtained from the immersion test, we optimized the higher concentration selection to 50 mM, as no significant difference was observed between the 50-mM and 100-mM concentrations. Therefore, selected concentrations of 1 mM, 5 mM, 10 mM, and 50 mM of MgO/Mg(OH)2 NPs were used for further live/dead assays and SEM analyses to determine cytotoxicity and morphological changes, respectively.
The live/dead assay results showed that upon exposure to lower concentrations (1 mM and 5 mM) of MgO/Mg(OH)2 NPs in hFOB 1.19 cells, proliferation and adhesion with fewer dead cells was observed. However, upon exposure to higher concentrations (10 mM and 50 mM) of MgO/Mg(OH)2 NPs, a reduction in cell proliferation in hFOB 1.19 cells was observed. Interestingly, upon exposure to 50-mM concentrations of Mg(OH)2 NPs in hFOB 1.19 cells, the clustering of cells due to the disruption of plasma membrane integrity and the formation of insoluble complex compounds was observed. Besides, the SEM analyses showed morphological changes in hFOB 1.19 cells upon exposure to various concentrations of MgO/Mg(OH)2 NPs. The SEM analysis results showed that upon exposure to lower concentrations (1 mM and 5 mM) of MgO/Mg(OH)2 NPs, cells adhered, proliferated, and elongated; however, at the higher concentrations (10 mM and 50 mM), the morphology of the cells changed to a round structure, thereby indicating the disruption of plasma membrane integrity and cytotoxicity when compared to control groups. The results from the live/dead assays and the SEM analyses, therefore, were comparable in terms of cell adhesion, proliferation, and cell death. Hence, this in vitro study provides a foundational knowledge for an acceptable concentration of MgO/Mg(OH)2 NPs that might be released from biodegradable Mg-based alloys in their application in orthopedic implants in future in vivo studies.

4. Conclusions

In this present study, in vitro cytotoxicity in hFOB 1.19 cells in response to various concentrations (1 mM, 5 mM, 10 mM, and 50 mM) of MgO/Mg(OH)2 NPs was studied. The determination of cytotoxicity in hFOB 1.19 cells provides a foundational knowledge for an allowable concentration of MgO/Mg(OH)2 NPs that might be released from biodegradable Mg-based alloys in their application in orthopedic implants in future in vivo studies. The immersion test result showed that MgO/Mg(OH)2 NPs degraded at a faster rate with the release of increased OH ions at higher concentrations (50 mM and 100 mM), which was determined by the change in the pH values from days 1 to 7. However, there was no significant difference observed between the change in the pH values of 50-mM and 100-mM concentrations; therefore, we selected 100-mM concentrations of MgO/Mg(OH)2 to conduct SEM–EDX mapping to understand the element depositions on MgO/Mg(OH)2 NPs after the immersion test. SEM–EDX mapping showed the presence of Mg, O, Na, Ca, P, Cl, and K in both MgO and Mg(OH)2 NPs.
Further, an in vitro cytotoxicity study in hFOB 1.19 cells in response to the exposure to various concentrations (1 mM, 5 mM, 10 mM, and 50 mM) of MgO/Mg(OH)2 NPs (observed by live/dead assay) showed cell proliferation and viability at lower concentrations (5 mM or less). However, at higher concentrations (10 mM and 50 mM) of NPs, an agglomeration of the cells was observed, which indicated the formation of complex compounds that might be the reason for cell death in hFOB 1.19 cells. The morphological changes studied by SEM analysis showed comparable results to the live/dead assay for cell adhesion, proliferation, and cell death. The results from this in vitro cytotoxicity study suggest that less than or equal to 5-mM concentrations of MgO/Mg(OH)2 NPs are tolerable concentrations for hFOB 1.19 cells. On the basis of this foundational study, in the future, innovative biodegradable Mg-based alloys can be developed for their application in orthopedics. We also suggest that future research must be done to understand the cytotoxicity of corrosion products through a real-time in vitro sensing system and in vivo testing.

Author Contributions

Conceptualization, Y.Y. and J.W.; methodology, Y.K.; software, M.P., validation, M.P. and Y.Y.; formal analysis M.P. and Y.Y., Investigation, M.P.; Resources, J.S.; data curation, M.P.; writing—original draft preparation, M.P.; writing—review and editing, Y.Y., M.P. and J.W.; visualization, M.P.; supervision, Y.Y. and J.S.; project administration, J.W. and J.S.; funding acquisition, Y.Y. and J.S.

Funding

This research was funded the National Science Foundation Engineering Research Center for Revolutionizing Metallic Biomaterials, an NIH grant (1SC3GM113728), and an NSF grant (1649243).

Conflicts of Interest

The authors declare no conflicts of interest.

References

  1. American Academy of Orthopedic Surgeons (AAOS). Available online: http://www.aaos.org/ (accessed on 1 November 2010).
  2. Orthopedic Industry: Market Research Reports, Statistics and Analysis. Report Linker 2013. Available online: http://www.reportlinker.com/ci02254/Orthopedic.html (accessed on 15 March 2013).
  3. Niinomi, M. Recent metallic materials for biomedical applications. Met. Mater. Trans. A 2002, 33, 477–486. [Google Scholar] [CrossRef]
  4. Puleo, D.A.; Huh, W.W. Acute toxicity of metal ions in cultures of osteogenic cells derived from bone marrow stromal cells. J. Appl. Biomater. 1995, 6, 109–116. [Google Scholar] [CrossRef] [PubMed]
  5. Jacobs, J.J.; Gilbert, J.L.; Urban, R.M. Corrosion of Metal Orthopaedic Implants. J. Bone Jt. Surg. 1998, 80, 268–282. [Google Scholar] [CrossRef] [PubMed]
  6. Jacobs, J.J.; Skipor, A.K.; Patterson, L.M.; Hallab, N.J.; Paprosky, W.G.; Black, J.; Galante, J.O. Metal release in patients who have had a primary total hip arthroplasty. J. Bone Jt. Surg. 1998, 80, 1447–1458. [Google Scholar] [CrossRef]
  7. Jacobs, J.J.; Hallab, N.J.; Skipor, A.K.; Urban, R.M. Metal degradation products: A cause for concern in metal-metal bearings? Clin. Orthop. Relat. Res. 2003, 417, 139–147. [Google Scholar]
  8. Lhotka, C.; Szekeres, T.; Steffan, I.; Zhuber, K.; Zweymüller, K. Four-year study of cobalt and chromium blood levels in patients managed with two different metal-on-metal total hip replacements. J. Orthop. Res. 2003, 21, 189–195. [Google Scholar] [CrossRef]
  9. Granchi, D.; Ciapetti, G.; Stea, S.; Savarino, L.; Filippini, F.; Sudanese, A.; Zinghi, G.; Montanaro, L. Cytokine release in mononuclear cells of patients with Co–Cr hip prosthesis. Biomaterials 1999, 20, 1079–1086. [Google Scholar] [CrossRef]
  10. Niki, Y.; Matsumoto, H.; Suda, Y.; Otani, T.; Fujikawa, K.; Toyama, Y.; Hisamori, N.; Nozue, A. Metal ions induce bone-resorption cytokine production through the redox pathway in synoviocytes and bone marrow macrophages. Biomaterials 2003, 24, 1447–1457. [Google Scholar] [CrossRef]
  11. Haynes, D.R.; Boyle, S.J.; Rogers, S.D.; Howie, D.W.; Vernon-Roberts, B. Variation in Cytokines Induced by Particles from Different Prosthetic Materials. Clin. Orthop. Relat. Res. 1998, 352, 223–230. [Google Scholar] [CrossRef]
  12. Wang, J.Y.; Wicklund, B.H.; Gustilo, R.B.; Tsukayama, D.T. Titanium, chromium and cobalt ions modulate the release of bone-associated cytokines by human monocytes/macrophages in vitro. Biomaterials 1996, 17, 2233–2240. [Google Scholar] [CrossRef]
  13. Bi, Y.; Van De Motter, R.R.; Ragab, A.A.; Goldberg, V.M.; Anderson, J.M.; Greenfield, E.M. Titanium Particles Stimulate Bone Resorption by Inducing Differentiation of Murine Osteoclasts. J. Bone Jt. Surg. 2001, 83, 501–508. [Google Scholar] [CrossRef] [PubMed]
  14. Allen, M.J.; Myer, B.J.; Millett, P.J.; Rushton, N. The effects of particulate cobalt, chromium and cobalt-chromium alloy on human osteoblast-like cells in vitro. J. Bone Jt. Surg. 1997, 79, 475–482. [Google Scholar] [CrossRef]
  15. Wang, M.L.; Nesti, L.J.; Tuli, R.; Lazatin, J.; Danielson, K.G.; Sharkey, P.F.; Tuan, R.S. Titanium particles suppress expression of osteoblastic phenotype in human mesenchymal stem cells. J. Orthop. Res. 2002, 20, 1175–1184. [Google Scholar] [CrossRef]
  16. McBride, E.D. Absorbable metal in bone surgery. J. Am. Med. Assoc. 1938, 111, 2464–2467. [Google Scholar] [CrossRef]
  17. Verbrugge, J. Le Mate´riel Me´tallique Re´sorbable En Chirurgie Osseuse. Presse Med. 1934, 23, 460–465. [Google Scholar]
  18. Witte, F.; Kaese, V.; Haferkamp, H.; Switzer, E.; Meyer-Lindenberg, A.; Wirth, C.; Windhagen, H. In Vivo corrosion of four magnesium alloys and the associated bone response. Biomaterials 2005, 26, 3557–3563. [Google Scholar] [CrossRef]
  19. Staiger, M.P.; Pietak, A.M.; Huadmai, J.; Dias, G. Magnesium and its alloys as orthopedic biomaterials: A review. Biomaterials 2006, 27, 1728–1734. [Google Scholar] [CrossRef]
  20. Williams, D.F. Effects of the environment on materials. Biomed. Eng. 1971, 6, 106–113. [Google Scholar]
  21. Witte, F.; Fischer, J.; Nellesen, J.; Crostack, H.-A.; Kaese, V.; Pisch, A.; Beckmann, F.; Windhagen, H. In Vitro and in vivo corrosion measurements of magnesium alloys. Biomaterials 2006, 27, 1013–1018. [Google Scholar] [CrossRef]
  22. Arnett, T.R. Acidosis, hypoxia and bone. Arch. Biochem. Biophys. 2010, 503, 103–109. [Google Scholar] [CrossRef]
  23. Shaw, B.A. Corrosion Resistance of Magnesium Alloys. In ASM Handbook; Corros Fundam Testing, Prot, 13A; ASM International: Russell, OH, USA, 2003. [Google Scholar]
  24. Li, Z.; Gu, X.; Lou, S.; Zheng, Y.; Zheng, Y. The development of binary Mg–Ca alloys for use as biodegradable materials within bone. Biomaterials 2008, 29, 1329–1344. [Google Scholar] [CrossRef] [PubMed]
Figure 1. SEM image of MgO nanoparticles (NPs) at (a) low magnification and (b) high magnification.
Applsci 09 04304 g001
Figure 2. SEM image of Mg(OH)2 NPs at (a) low magnification and (b) high magnification.
Applsci 09 04304 g002
Figure 3. Immersion test results through two-way analysis of variance (ANOVA) techniques representing the change in the pH in response to various concentrations of MgO NPs from days 1 to 7 in 1 mL of Dulbecco’s Modified Eagle’s Medium (DMEM). Data are presented as the mean ± standard error of the mean (SEM), n = 3, *** p value < 0.001 when compared to control.
Applsci 09 04304 g003
Figure 4. Immersion test results through two-way ANOVA techniques representing the change in the pH in response to various concentrations of Mg(OH)2 NPs from day 1 through day 7 in 1 mL of DMEM. Data are presented as the mean ± standard error of the mean (SEM), n = 3, *** p value < 0.001 when compared to control.
Applsci 09 04304 g004
Figure 5. SEM–energy-dispersive X-ray spectroscopy (EDX) analysis results of MgO NPs after incubation for seven days in DMEM. (a) 100-mM concentrations of MgO NPs, and (b) EDX analysis representing element deposition on MgO NPs.
Applsci 09 04304 g005
Figure 6. SEM–EDX analysis results of Mg(OH)2 after incubation for seven days in DMEM. (a) 100-mM concentrations of Mg(OH)2 NPs, and (b) EDX analysis representing element deposition on Mg(OH)2 NPs.
Applsci 09 04304 g006
Figure 7. SEM–EDX mapping result of 100-mM concentrations of MgO NPs after incubation for seven days in DMEM. Various depositions of elements and (a) overlay mapping of the elements, (b) Mg, (c) O, (d) Na, (e) Ca, (f) P, (g) Cl, and (h) K.
Applsci 09 04304 g007
Figure 8. SEM–EDX mapping result of 100-mM concentrations of Mg(OH)2 NPs after incubation for seven days in DMEM. Various depositions of elements and (a) overlay mapping of the elements: (b) Mg, (c) O, (d) Na, (e) Ca, (f) P, (g) Cl, and (h) K.
Applsci 09 04304 g008
Figure 9. Live/dead assay results demonstrated live (green) and dead (red) human fetal osteoblast (hFOB) 1.19 cells in response to various concentrations of MgO NPs for 30 min. (a) Media Only (-ve control group), (b) Cells + Media (-ve control group), (c) Cells + Media + 1 mM MgO NPs, (d) Cells + Media + 5 mM MgO NPs, (e) Cells + Media + 10 mM MgO NPs, and (f) Cells + Media + 50 mM MgO NPs.
Applsci 09 04304 g009
Figure 10. Live/dead assay results demonstrated live (green) and dead (red) hFOB 1.19 cells in response to various concentrations of Mg(OH)2 NPs. (a) Media Only (-ve control group), (b) Cells + Media (-ve control group), (c) Cells + Media + 1 mM Mg(OH)2 NPs, (d) Cells + Media + 5 mM Mg(OH)2 NPs, (e) Cells + Media + 10 mM Mg(OH)2 NPs, and (f) Cells + Media + 50 mM Mg(OH)2 NPs.
Applsci 09 04304 g010
Figure 11. Statistical analysis of % live cells in hFOB 1.19 cells through one-way ANOVA techniques for MgO NPs. Control groups: Media Only (-ve), Cells + Media (-ve), experimental groups: Cells + Media + 1-mM/5-mM/10-mM/50-mM concentrations of MgO NPs. Data are represented as the mean ± SEM, n = 3, * p-value ≤ 0.05 when compared to controls.
Applsci 09 04304 g011
Figure 12. Statistical analysis of % live cells in hFOB 1.19 cells through one-way ANOVA techniques for Mg(OH)2 NPs. Control groups: Media Only (-ve), Cells + Media (-ve); experimental groups: Cells+ Media + 1-mM/5-mM/10-mM/50-mM concentrations of Mg(OH)2 NPs. Data are represented as the mean ± SEM, n = 3, * p-value ≤ 0.05 when compared to controls.
Applsci 09 04304 g012
Figure 13. SEM results representing the morphological changes in hFOB 1.19 cells in response to various concentrations of MgO NPs. (a) Media Only (-ve control group), (b) Cells + Media (-ve control group), (c) Cells + Media + 1 mM MgO NPs, (d) Cells + Media + 5 mM MgO NPs, (e) Cells + Media + 10 mM MgO NPs, and (f) Cells + Media + 50 mM MgO NPs.
Applsci 09 04304 g013
Figure 14. SEM results representing the morphological changes in hFOB 1.19 cells in response to various concentrations of Mg(OH)2 NPs. (a) Media Only (-ve control group), (b) Cells + Media (-ve control group), (c) Cells + Media + 1 mM Mg(OH)2 NPs, (d) Cells + Media + 5 mM Mg(OH)2 NPs, (e) Cells + Media + 10 mM Mg(OH)2 NPs, and (f) Cells + Media + 50 mM Mg(OH)2 NPs.
Applsci 09 04304 g014

