Two-Step Feature Selection for Identifying Developmental Differences in Resting fMRI Intrinsic Connectivity Networks


1
School of Mathematics and Statistics, Xi’an Jiaotong University, Xi’an 710049, China
2
Tri-institutional Center for Translational Research in Neuroimaging and Data Science (TReNDS), Georgia State University, Georgia Institute of Technology, and Emory University, Atlanta, GA 30303, USA
3
Department of Biomedical Engineering, Tulane University, New Orleans, LA 70112, USA
*
Author to whom correspondence should be addressed.
Appl. Sci. 2019, 9(20), 4298; https://doi.org/10.3390/app9204298
Submission received: 2 August 2019
/
Revised: 30 September 2019
/
Accepted: 4 October 2019
/
Published: 12 October 2019
Abstract
:Functional connectivity derived from functional magnetic resonance imaging (fMRI) is used as an effective way to assess brain architecture. There has been a growing interest in its application to the study of intrinsic connectivity networks (ICNs) during different brain development stages. fMRI data are of high dimension but small sample size, and it is crucial to perform dimension reduction before pattern analysis of ICNs. Feature selection is thus used to reduce redundancy, lower the complexity of learning, and enhance the interpretability. To study the varying patterns of ICNs in different brain development stages, we propose a two-step feature selection method. First, an improved support vector machine based recursive feature elimination method is utilized to study the differences of connectivity during development. To further reduce the highly correlated features, a combination of F-score and correlation score is applied. This method was then applied to analysis of the Philadelphia Neurodevelopmental Cohort (PNC) data. The two-step feature selection was randomly performed 20 times, and those features that showed up consistently in the experiments were chosen as the essential ICN differences between different brain ages. Our results indicate that ICN differences exist in brain development, and they are related to task control, cognition, information processing, attention, and other brain functions. In particular, compared with children, young adults exhibit increasing functional connectivity in the sensory/somatomotor network, cingulo-opercular task control network, visual network, and some other subnetworks. In addition, the connectivity in young adults decreases between the default mode network and other subnetworks such as the fronto-parietal task control network. The results are coincident with the fact that the connectivity within the brain alters from segregation to integration as an individual grows.
1. Introduction
The human brain is a complex system with different regions dedicated to different functions, which are locally segregated but globally integrated to process information. At present, many brain imaging techniques have been used to characterize and quantify the brain, such as functional magnetic resonance imaging (fMRI). It measures the changes in the blood oxygen level dependent (BOLD) signal, which can reveal correlations in neural activity between distant brain regions [1,2,3]. These correlations are of fundamental interest to neuroscientists for the comprehensive and noninvasive exploration of human brain. It was discovered that different brain regions actively interact with each other even when an individual subject is at rest, i.e., without performing any cognitive tasks. Therefore, resting-state fMRI (rs-fMRI) has been widely used to investigate regional associations of brain networks [4,5], which can give an insight to the brain’s functional organization. In particular, it can be used to examine altered or aberrant functional networks as a result of aging or brain disorders [6,7,8].
Functional connectivity (FC) based on fMRI data reflects the functionally integrated relationship between spatially separated brain regions. The analysis of FC has the potential to further our understanding of the neural mechanisms underlying brain development, psychiatric, and neurological disorders. The measurement of FC is critical for the identification of developmental differences and diagnosis of diseases [9,10]. Previously, FC was assumed to be stationary over the scanning time, and most fMRI studies applied a static functional connectivity (sFC) analysis, i.e., calculating the correlations of whole fMRI time courses for the entire resting state scan. Now many works have shown that brain functional connectivity is dynamic over time, which is more successful in uncovering the disruptions of the human brain in disease conditions. In such analyses, brain functional connectivity can vary within a short period (e.g., tens of seconds). Thus, many methods have been proposed to estimate dynamic functional connectivity (dFC) [11,12]. Among them, the sliding window based method is the most widely used [13,14,15,16].
It is commonly assumed that the brain operates as a set of distributed sub-networks that co-activate over time; as a consequence, there is a great interest in identifying these intrinsic connectivity networks (ICNs) derived from FC data [17]. Identifying ICNs is based on the evidence that neural systems use parsimonious representations to efficiently process information while minimizing redundancy [17]. There are two most commonly used approaches to identify ICNs. One is the seed-based correlation analysis [18]. This method starts with a prior specified seed region or voxel, and calculates the correlations with other regions or voxels to get a connection map with respect to the seed. Since the choice of seed may affect connectivity findings towards specific, small or overlapping sub-systems, this method has a limited ability to study multiple systems simultaneously [19]. Another way to find the ICNs is based on data-driven methods, such as independent component analysis (ICA), independent vector analysis (IVA), principle component analysis (PCA), non-negative matrix factorization (NMF), and a sparse representation and dictionary learning (SRDL). However, it is still a great challenge to identify ICNs from FC data because the FC data usually have high dimension but a small sample size, i.e., n<<p, where n is the sample size and p is the number of features. For such data, it is too difficult to discover the potential information contained in the data from a limited number of observations, which form a cognitive concept of the data or complete identification task [20].
Since feature selection methods can not only remove the redundant information or invalid features but also keep the key information of the original data set, they have been widely used in functional connectivity network studies [21]. Based on the combination of feature selection search and the construction of the classification model, filter and wrapper are two typical types of feature selection methods. Additionally, ensemble methods are another popular kind of feature selection method [22]. Filter methods mainly depend on the attribute of features, and the evaluation criteria are independent from classifiers [23]. Wrapper methods embed the feature selection search with the classification performance of the classifier, but the drawbacks of this method are the higher risk of overfitting, and computational intensity when the classifier has a high computational cost [24]. Ensemble methods are based on different sampling strategies to extract multiple sample sets, and then, a specific feature selection algorithm is used to obtain multiple sets of feature subsets [25].
For ICN studies in recent years, special attention has been paid to investigating the differences of ICN with regard to brain development. For example, dynamic functional sparse connectivity patterns on rs-fMRI data were extracted to analyze children from ages 8 to 21 years [26]. The analysis suggested that, compared with young adults, children’s brains showed reduced connectivity among the sensorimotor network and auditory network and increased connectivity between the default mode network and other networks. Some co-activated brain regions were revealed [27]. They found that in the default mode network, auditory system, and executive control system, there is an increased connectivity in children compared to young adults. For subjects of 10–20 years old, nodes at multiple scales, e.g., voxel-wise or regions of interest (ROIs) within the brain, were examined in [28]. The results showed that connectivity between hub and non-hub regions changed with the development from childhood to adolescence. Based on 264 ROIs identified by parcellation analysis from rs-fMRI data, functional modules in the brain were detected for subjects 8–22 years old [29,30,31]. The results indicated that the network organization is stable throughout adolescence, and cross-network integration increases with age.
In this paper, we propose a two-step feature selection method to identify the differences of ICNs during brain development. The two-step feature selection methods can couple two effective feature selection methods to assemble an optimal feature set for building the prediction model [32]. This method takes full advantages of the support vector machine recursive feature elimination (SVM-RFE), which can efficiently reduce noise and irrelevant features in the classification task. In addition, by combining the F-score with the correlation score, only the discriminative features can be kept. Our results suggest that there exist many remarkable differences of ICNs with age. Among them, the significant differences in connectivity are strongly associated with task control, cognition, information processing, attention, alertness, and other functions. Compared with children, we find that young adults experience increased connectivity between the sensory/somatomotor network and the cingulo-opercular task control network, visual network, and ventral attention network. At the same time, young adults experience reduced connectivity among the default mode network and the fronto-parietal task control network. Our discoveries coincide with many prior studies, e.g., [26,27,33,34,35,36,37,38]. Moreover, we reveal that with aging, most of the connections among different resting state networks become remarkably enhanced and those within rest state networks generally decline. This is coincident with the fact that the connectivity of brains alters from segregation to integration as one grows.
The analysis of topological properties based on graph theory further confirms the significance of the difference of ICNs between the two groups, namely, children and young adults. We chose clustering coefficient, characteristic path length, local network efficiency and global network efficiency as the evaluation criteria of the brain network. By the two-sample t-test, the p-values of these four parameters for the brain networks of the two groups are totally small. Additionally, compared with six important feature selection methods, the two-step feature selection method only needs less than 200 features to identify the differences of ICNs during development; for other methods, 600 or even more features are needed. Compared with the other methods, the redundant degree and the classification performance of the proposed method are also significant. From which we can know that the two-step feature selection method proposed here can detect the changes of ICNs more precisely.
2. Methods
In this paper, we propose a two-step feature selection strategy to select features without redundancy, with the potential to improve the accuracy of prediction and identification of sparse ICN changes.
Step 1: Feature selection based on SVMRFE-CA
SVM-RFE is a wrapper feature selection algorithm that avoids overfitting when the data is of high dimension. It can remove insignificant features in order to achieve higher classification performance. SVM-RFE was first proposed for gene selection [39], and has been widely applied to many other fields [40,41,42].
Suppose that in the training set , is the i-th sample, is the label of , N is the sample size, and D is the dimension of each sample (thus the original dimension of the feature data is also D). Finding the optimal classification hyperplane of SVM is equivalent to minimizing the objective function J
where is defined as the margin, is the slack variable related with training errors, and C is the penalty coefficient used as a trade-off between the maximum margin and the minimum training errors. By the Lagrange multiplier method, the optimal solution of (1) is
where is the Lagrange multiplier. Let . In the SVM-RFE algorithm, each is defined as the weight of feature i [39].
In [40], it was proven that , where represents the value of the objective function after feature i is removed; i.e., is an approximation of the change of the objective function when feature i is eliminated. Therefore, eliminating features with small weights will not have a big impact on the objective function of the optimization problem, which is just the essence of the SVM-RFE algorithm. Since and are consistent in values, the importance of feature i can be evaluated by
For SVM-RFE, the importance of each feature of the training data is calculated by (3), and the feature with the smallest score is deleted [43]. The SVM is trained again with the remaining features, and the iterations are conducted until the stopping criterion is reached.
In the SVM-RFE algorithm, if a feature is eliminated, it will not be considered again in the subsequent process, which may however have some discriminative ability. This happens especially in the case that the data set is small but with high dimensions. In order to improve the performance of SVM-RFE, we divide the training data into two parts: one for feature selection and the other for validation. The classification accuracy (CA) on the validation set is regarded as the evaluation criterion of the candidate feature subset. Then, by combining with backward deletion, the optimal feature subset can be finally obtained. Specifically, if one feature with small weight is picked, while the corresponding CA on the validation set decreases after its removal, then this feature should be reconsidered. Additionally, multiple subsampling strategies on the training data are utilized and a series of feature selection processes are performed to avoid mistakenly removing such features. Finally, such obtained series of feature subsets form one optimal feature subset. The improved method of SVM-RFE is denoted as SVMRFE-CA.
For SVMRFE-CA, the selected features are evaluated by their classification performances, so the features in the optimal feature subset are beneficial to the discrimination. However, among them, there may exist highly correlated and relevant features. In what follows, we will remove those features obtained by SVMRFE-CA, and only retain the most discriminative features as the final optimal feature subset.
Step 2: Feature selection based on F-score and the correlation score to form a new feature selection technique (FSCS)
F-score is a simple and valid feature selection method to quantify the discernibility of a candidate feature [44]. The F-score of the i-th feature is defined as
where and are the means of the positive samples and the negative samples corresponding to the i-th feature, and and are the variances of them, respectively. In Equation (4), the numerator can be considered as an index of the distance between the centers of two data sets, which evaluates the ability of the i-th feature to distinguish between positive and negative sample sets. Since the variance of a data set indicates the degree of concentration, the denominator of Equation (4) represents the ability of the i-th feature to assemble samples. Therefore, the larger the , the more distinguishable the feature i is between the two sample sets.
In addition, we introduce the correlation score between the feature i and a feature set D, which is defined as follows
where represents the Pearson correlation coefficient between features i and j, and denotes the feature size of D. therefore measures the degree of correlation between feature i and feature set D.
In order to further select the most discriminative and non-redundant features from the feature subset obtained by SVMRFE-CA, we combine both F-score and the correlation score to form a new feature selection technique, i.e., FSCS. The evaluation criterion of it is defined as
where is the current selected feature set. The definition suggests the greater the is, the stronger distinguishing ability of the candidate feature i, and meanwhile, the weaker the correlation between feature i and the features in . The FSCS technique based on F-score and correlation score maximizes the discriminative power of feature i and simultaneously minimizes its overall correlation with other selected features, which can further optimize the features in the feature subset selected by SVMRFE-CA.
The Two-Step Feature Selection Method
In view of the above SVMRFE-CA as well as the FSCS method, we propose a two-step feature selection technique, and its flowchart is shown in Figure 1. In the first step, an integration of feature subsets is produced by multiple iterations of the SVMRFE-CA algorithm with random division of data. The frequency of each feature in these subsets is aggregated and sorted. The first n features with large frequency are retained, and they form an integrated feature subset which has a strong correlation with the classification performance. Based on this, the second step employs FSCS to further select features with the maximal discriminative abilities, while it has the minimal overall correlations with other candidate features. Therefore, using two-step feature selection, we can get the optimal feature subset. The two-step feature selection algorithm is described in Algorithm 1.
| Algorithm 1: Two-step feature selection method |
|
3. Results on Philadelphia Neuro Developmental Cohort (PNC) Data
In this section, we will apply the proposed two-step feature selection method to study the differences of FC during brain development. The flowchart of investigating the developmental differences of the brain between children and young adults is shown in Figure 2.
3.1. Data Collection and Preprocessing
The Philadelphia Neuro developmental Cohort (PNC) is a large-scale collaborative study between the Brain Behavior Laboratory at the University of Pennsylvania and the Children’s Hospital of Philadelphia, which contains resting state fMRI data for adolescents aged 8 to 22 [45]. Standard brain imaging preprocessing steps were applied using Statistical Parametric Mapping 12 (SPM12), including motion correction, spatial normalization to standard Montreal Neurological Institute (MNI) space (spatial resolution of mm) and spatial smoothing with a 3 mm Full Width Half Maximum (FWHM) Gaussian kernel. The influence of motion (six parameters) was further addressed using a regression procedure, and the functional time series were band-pass filtered using a 0.01 Hz to 0.1 Hz frequency range. Finally, the dimension of the data was reduced using the standard 264 ROI atlas as defined by Power et al. with a sphere radius parameter of 5 mm [29]. Then, the time sequences of all ROIs are averaged in the same brain region, so that the data is reduced to a matrix for every subject with denoting the number of time points for each rs-fMRI scan, and the time interval is 3 s.
In this study, subjects of children (class I) are 103 to 144 months old, and subjects of young adults (class II) are 216 through 271 months old. The details of the subjects are listed in Table 1.
3.2. Dynamic Functional Network Connectivity Analysis
After the PNC data was reduced to a matrix for each subject, the FC can be obtained by calculating the Pearson correlations coefficient (PCC) for each pair of ROIs. As we have discussed in the Introduction, the traditional method of calculating FC is based on the assumption that the functional network of the brain is static over the entire scanning session. However, many recent studies have shown that the functional network changes dynamically over time, and more meaningful information of brain activation patterns can be mined by considering the presence of temporal variability [46,47].
In this work, the dFC is estimated by using the sliding window approach along with time series. For this method, a window is moved along the resting-state fMRI time series and the correlation between two ROIs is calculated for each window. Assume that the time series has T time points, thus there are sub-sequences generated by the sliding time window with window length l and step size s. It is critical to choose the appropriate length of the windows, since longer windows are closer to the whole signal while shorter windows are more sensitive to transient changes and may introduce more noise to the correlation analysis [48]. To effectively capture dynamic information, a window length between 30 s and 60 s is suggested, which can reflect the cognition of an individual [48,49].
For the PNC data, we choose and . In this way, each time window has 20 time points with the window length of 60 s and the step of 1 s. Therefore, for each subject, as the sliding window moves, the 124 time points of the whole BOLD signal will be divided into sub-sequences. Based on this, we calculate the PCC between every two ROI regions within every sliding window.
For each subject, if we denote the time series in the n-th time window of ROI i as , then the PCC between the s-th ROI and the t-th ROI in the n-th time window is calculated as follows
where
Thus, considering the symmetry of PCC for two ROIs, for each subject, the dFC feature matrix is with being the number of sliding windows, where 34,716. For each subject, the average connectivity information is further extracted from matrix D by calculating the mean of each column. The obtained feature vector for each subject is a description of the average dynamic functional connectivity between each of two ROIs. The calculation approach of the feature vector for each subject is shown in Figure 3.
In order to capture the differences of ICNs during development, the proposed two-step feature selection method is implemented to remove the redundant features of V or only retain the discriminative ones. It is demonstrated that by the feature selection technique, some meaningful differences of functional connectivity between children and young adults can be found, which are further confirmed by the existing results on brain development, topological analysis of brain networks, and the performance of classification.
3.3. The Identification of Essential Differences of ICNs during Development
We randomly divide the samples into two parts, training data for two-step feature selection and test data for testing the classification performance of the selected features, and repeat the process for times. With each repetition, the training samples are randomly divided into two parts for times, i.e., for feature selection and for validating the selected features. Thus, by combining the SVMRFE-CA and the FSCS methods for the current training samples, we obtain the optimal feature subset which possesses the non-redundant information. Then, the frequency of each feature in all the optimal subsets obtained by times is counted. We found that when or is over 20, the selected features are nearly the same. Therefore, we choose . Finally, among the total 34,716 functional connections, 20,719 are absent, 1859 occur more than 10 times, and 134 present in all the 20 experiments. The 134 connections can be considered as functional connections with the most significant differences during development. Additionally, in order to facilitate the analysis on these 264 ROIs which are identified by Power et al. [29], the functional roles to brain regions are assigned from the work of Smith et al. [50]. Based on which, different resting state networks (RSNs) are defined [51], which are shown in Figure 4.
In Figure 4, the 13 RSNs are mainly concerned with the perception of movement, memory, language and other several functions of brain, and they are the sensory/somatomotor network (SSN), cingulo-opercular task control network (COTCN), auditory network (AN), default mode network (DMN), memory retrieval network (MRN), visual network (VN), fronto-parietal task control network (FPTCN), salience network (SN), subcortical network (SCN), ventral attention network (VAN), dorsal attention network (DAN), and cerebellar network (CN), respectively. In which, SSN contains the precuneus, cingulate gyrus, precentral and postcentral gyrus, superior frontal gyrus, and some other brain regions. COTCN contains the middle frontal gyrus, insula, superior temporal gyrus, etc. In DMN, the main brain regions include the posterior cingulate, medial frontal gyrus, parahippocampal gyrus, bilateral lateral temporal lobe. VN mainly contains the middle and inferior occipital gyrus, lingual gyrus and cuneus. FPTCN includes the superior parietal lobule and frontal gyrus. The main regions in SCN are the extra-nuclear, lentiform nucleus and thalamus. VAN is composed of the superior and middle temporal gyrus, inferior frontal gyrus and inferior parietal lobule. Among the 264 ROIs, there exist 28 ROIs with which the functional roles are uncertain, and they are uniformly merged into the uncertain RSN [35].
For the selected 134 functional connections, which are considered to be significantly associated with the developmental difference, there are 104 within or between the 13 RSNs defined above, and 30 related to the uncertain RSN, i.e., the 13th RSN. Among the 134 functional connections, 45 of them are significantly strengthened during development, and 89 are notably weakened with age. Figure 5 describes the relationships between the 134 functional connections and the 264 ROIs as well as the 13 RSNs. The colors of the 264 ROIs represent their corresponding RSNs with their names listed on the left. The red lines represent the enhanced functional connections during development, and the blue lines represent the weakened functional connections.
In addition, the distributions of the 104 functional connections among the 12 certain RSNs are illustrated in Figure 6, where the thickness of the line represents the number of different function connections, i.e., the thicker the line is, the stronger functional connection is. Furthermore, the enhanced and weakened functional connections are shown in Figure 7 by the BrainNet Viewer toolbox [52].
3.4. The Validation of the Selected Different ICNs by Graph Theory
Topological properties of a brain network can be used to explore the coordination and cooperation between different brain regions [53,54]. For example, the clustering coefficient quantifies functional segregation of the brain network, which reflects the ability of a specialized task to occur within certain densely interconnected groups of brain regions. The length of a characteristic path quantifies the functional integration of the brain network, which reflects the ability to combine specialized information from distributed brain regions. Both global and local network efficiencies quantify the transmission capability of the brain network, which reflects the ability of transmitting information between different brain regions. By topological analysis, the significance of those selected ICNs related to development can be verified. Based on the two brain networks constructed separately by the selected ICNs of the children and the young adults, we explore if there exist any discriminating differences of topological features for these two networks. We chose clustering coefficient (), characteristic path length (), local network efficiency (), and global network efficiency () as the evaluation criteria. Their definitions are shown in Table 2. These four parameters of the two brain networks are calculated and tested by the two-sample t-test. The p-values of , , , and are , , , and , respectively. Obviously, the analysis of topological features clearly confirms that there do exist definite differences of the brain connectivity between children and young adults.
3.5. Comparison with Other Feature Selection Methods
In order to show the advantages of the proposed two-step feature selection method, we compare it with SVM-RFE, FSCS and several other typical feature selection methods, i.e., maximum correlation minimum redundancy with mutual information difference (mRMR-MID), maximum correlation minimum redundancy with mutual information entropy (mRMR-MIQ), feature section with random forest by Gini index (RFFS-GINI), and feature section with random forest by out of bag data (RFFS-OOB) [55,56]. Each feature selection method was repeated 20 times with random training and testing data. The performance of the classification accuracy rate (CAR) for different feature selection methods are shown in Figure 8. The two-step feature selection method achieves its optimal classification accuracy in a faster and more stable way than other methods. It is worth noting that for other methods, 600 or even more features (i.e., the differences of ICNs) are needed to get their best performances, while less than 200 features are sufficient for the proposed method to identify the the changes of brains’ connectivity during development. This is consistent with the feature size selected in Section 3.3.
Additionally, the redundant degree of a feature subset D can be calculated by
where represents the Pearson correlation coefficient of features i and j, and denotes the number of features in D. By (8), the average redundant degree of both the two-step feature selection method and the SVM-RFE (with best performance) are 49.8423 and 138.6289, respectively, which strongly confirms the ability of the two-step feature selection method to effectively remove redundancy.
In addition to CAR, the selected differences of ICNs can be further quantified by sensitivity (SS), specificity (SC), positive predictive value (PPV) and negative predictive value (NPV), which are defined as follows
where , , and denote the number of true positive, false positive, true negative and false negative samples, respectively. CAR, SS, SC, PPV and NPV provide five different assessments of the classifiers. CAR is the proportion of all samples that are correctly predicted, SS is the proportion of positive samples (here, the positive samples refer the children subjects) correctly predicted among all the predicted positive samples, SC is the proportion of negative samples (i.e., the young adults) correctly predicted among all the predicted negative samples, PPV is the proportion of correctly predicted positive samples among the true positive samples, and NPV is the proportion of negative samples correctly predicted among those true negative samples. We calculate the average classification performance when the CAR curve of each method stably achieves its maximum, and the results are shown in Table 3.
From Figure 8 and Table 3, we can see that the proposed two-step feature selection method has the best identification on the differences of ICNs during development. When comparing with mRMR-MIQ, mRMR-MID, FSCS, RFFS-GINI, RFFS-OOB and SVM-RFE, the average classification accuracy has increased by 12.46%, 10.66%, 9.81%, 4.84%, 3.51%, 1.58%, respectively. The sensitivity, specificity, positive predictive value and negative predictive value of the proposed two-step feature selection method are all better than the other methods.
4. Discussion
The two-step feature selection method proposed here is utilized to identify the essential differences of ICNs as an individual grows. With the first step, i.e., SVMRFE-CA, the noise and irrelevant features can be efficiently reduced. At the same time, since the data set is small but with high dimensions, if a feature in the training process is eliminated, although it may have some discriminative ability, it will not be considered again in the subsequent process by the original SVM-RFE method. In order to retain these latent significant features, we introduced a reconsidered way to keep these features, and the multiple subsampling strategies are also utilized to avoid mistakenly removing such features. In the second step, the F-score is combined with the correlation score to remove the highly correlated and relevant features selected in the SVMRFE-CA process. By the two-step feature selection method, only the features with the most discriminative ability will be retained.
The analysis based on graph theory further confirms the significance of the revealed difference of ICNs between children and young adults. Compared with other feature selection methods, the two-step feature selection method also shows its competitive power. For this method, less than a third of features are needed to identify the developmental differences. Meanwhile, the redundant degree, and the classification performance both displayed the efficiency of the proposed method.
The obtained results reveal that, compared with children, for young adults there exist many remarkable differences in the functional connections among SSN, COTCN, VN, VAN, DMN, FPTCN, and SCN, where the connectivity among SSN, COTCN, VN, and VAN, are significantly enhanced. The results can reflect the specific functional differences during brain development since these RSNs are strongly associated with cognition, information processing, attention, alertness, and other functions. In detail, it is reported that SSN is mainly related to cognitive activities [57]. Some brain regions in COTCN play a particularly important role in the coordination of information transfer between networks and are very active in performing many complex cognitive tasks [58]. VN is mainly involved in visual information processing. VAN is responsible for non-spatial attention, which enables a bottom-up attention selection by a stimulus-driven process, which includes awareness of significant events, reorientation of attention, and alertness [59]. Additionally, our findings are quite consistent with prior reports. For example, it has been observed that the connectivity among the SSN and certain other RSNs are relatively low in childhood [26]. The study by Jolles et al. showed that the hyper-connectivity of young adults’ VN with other RSNs is enhanced, that is, young adults’ visual information processing ability is higher than that of children [33]. In [35], it observed that some ICNs related to SSN and VN are quite complex in young adults’ brains. Meanwhile, we found that compared with children, there exist some weakened functional connections in young adults’ brains, i.e., DMN, SCN, and COTCN. These discoveries have also been found in prior studies. Hutchison et al. revealed that children have stronger connectivity between DMN and the cognitive control system than young adults [34]. In [36], it was discovered that there is more consistent DMN connectivity in children’ brains. In [37], they uncovered that with increasing age during adolescence and early adulthood, a clear pattern emerges, that is, the connectivity decreases between DMN and COTCN. In [38], it showed that for children, the cortical gray matter reaches a peak, which is usually reduced in adolescence, and this can be a reason leading to the weakening of the connection between DMN and SCN. We discovered that several decreases in connectivity exist between FPTCN and SSN for young adults, and it was also found in [26], that children have stronger connectivity between these two RSNs. Additionally, our research revealed that some differences of connectivity exist between the uncertain RSN and other RSNs, e.g., SSN, DMN, and SN, and they exist most in the fusiform gyrus, lingual gyrus, frontal lobe, and temporal lobe. Moreover, we found that for young adults, the intra functional connections within many RSNs are weakened compared with children, e.g., in DMN and SSN. At the same time, the inter functional connections among different RSNs (e.g., the connections among SSN, VN, VAN and COTCN) are markedly enhanced. The above discoveries are confirmed with the understanding that the connectivity of the brain moves from segregation to integration as one grows. That is, with age development, most connections among different RSNs become remarkably enhanced, and those within RSNs generally decline.
5. Conclusions
In this study, we presented a two-step feature selection method to identify the essential differences of brain functional connectivity as one grows. For the resting state fMRI dataset focused on brain normative development, 134 significant differences of dynamic functional connectivity between children and young adults have been discovered. Based on this, we revealed that there exist many remarkable differences in the functional modules among the sensory/somatomotor network, cingulo-opercular task control network, visual network, ventral attention network, default mode network, fronto-parietal task control network, and subcortical network. Especially when compared with children, young adults have strengthened functional connectivity between the sensory/somatomotor network and other functional networks. Weakened functional connectivity was found in young adults, e.g., the connections between the default mode network, subcortical network and cerebellar network. Meanwhile, our findings are consistent with the fact that the connectivity of brains changes from segregation to integration during development. The topological analysis further verified the significance of the identified brain functional connectivity. Additionally, a comparison with several feature selection methods supports the performance of the two-step feature selection method.
Author Contributions
Conceptualization, C.Q.; methodology, C.Q. and B.G.; writing—original draft preparation, B.G. and L.-J.L.; writing—review and editing, C.Q., Y.-P.W. and V.D.C.; funding acquisition, C.Q.
Funding
This research was supported by NSFC Nos. 11471006 and 11101327, National Science and Technology Co-operation Program of China (No. 2015DFA81780), the Fundamental Research Funds for the Central Universities (No. xjj2017126) and was partly Supported by HPC Platform, Xi’an Jiaotong University and NIH R01 GM109068 and R01 MH104680.
Conflicts of Interest
The authors declare no conflict of interest.
References
- Yu, Q.; Du, Y.; Chen, J.; Sui, J.; Adali, T.; Pearlson, G.D.; Calhoun, V.D. Application of graph theory to assess static and dynamic brain connectivity: Approaches for building brain graphs. Proc. IEEE 2018, 106, 886–906. [Google Scholar] [CrossRef] [PubMed]
- Lawrence, S.J.D.; Formisano, E.; Muckli, L.; De Lange, F.P. Laminar fMRI: Applications for cognitive neuroscience. Neuroimage 2017. [Google Scholar] [CrossRef] [PubMed]
- Heurling, K.; Leuzy, A.; Jonasson, M.; Frick, A.; Zimmer, E.R.; Nordberg, A.; Lubberink, M. Quantitative positron emission tomography in brain research. Brain Res. 2017, 1670, 220–234. [Google Scholar] [CrossRef] [PubMed]
- Biswal, B.; Yetkin, F.Z.; Haughton, V.M.; Hyde, J.S. Functional connectivity in the motor cortex of resting human brain using echo-planar MRI. Magn. Reson. Med. 1995, 34, 537–541. [Google Scholar] [CrossRef]
- Betzel, R.F.; Byrge, L.; He, Y.; Goni, J.; Zuo, X.N.; Sporns, O. Changes in structural and functional connectivity among resting-state networks across the human lifespan. Neuroimage 2014, 102, 345–357. [Google Scholar] [CrossRef]
- Suk, H.I.; Wee, C.Y.; Lee, S.W.; Shen, D. State-space model with deep learning for functional dynamics estimation in resting-state fMRI. Neuroimage 2016, 129, 292–307. [Google Scholar] [CrossRef] [Green Version]
- Finn, E.S.; Shen, X.; Scheinost, D.; Rosenberg, M.D.; Huang, J.; Chun, M.M.; Papademetris, X.; Constable, R.T. Functional connectome fingerprinting: Identifying individuals using patterns of brain connectivity. Nat. Neurosci. 2015, 18, 1664–1671. [Google Scholar] [CrossRef]
- Mennigen, E.; Miller, R.L.; Rashid, B.; Fryer, S.L.; Loewy, R.L.; Stuart, B.K.; Mathalon, D.H.; Calhoun, V.D. Reduced higher-dimensional resting state fMRI dynamism in clinical high-risk individuals for schizophrenia identified by meta-state analysis. Schizophr. Res. 2018, 201, 217–223. [Google Scholar] [CrossRef]
- Calhoun, V.D.; Miller, R.; Pearlson, G.D.; Adal, T. The chronnectome: Time-varying connectivity networks as the next frontier in fMRI data discovery. Neuron 2014, 84, 262–274. [Google Scholar] [CrossRef]
- Fornito, A.; Zalesky, A.; Breakspear, M. The connectomics of brain disorders. Nat. Rev. Neurosci. 2015, 16, 159–172. [Google Scholar] [CrossRef]
- Chen, J.E.; Rubinov, M.; Chang, C. Methods and considerations for dynamic analysis of functional MR imaging data. Neuroimaging Clin. 2017, 27, 547–560. [Google Scholar] [CrossRef] [PubMed]
- Preti, M.G.; Bolton, T.A.; Van, D.V.D. The dynamic functional connectome: State-of-the-art and perspectives. Neuroimage 2016, 160, 41–54. [Google Scholar] [CrossRef] [PubMed]
- Hindriks, R.; Adhikari, M.H.; Murayama, Y.; Ganzetti, M.; Mantini, D.; Logothetis, N.K.; Deco, G. Can sliding-window correlations reveal dynamic functional connectivity in resting-state fMRI? Neuroimage 2016, 127, 242–256. [Google Scholar] [CrossRef] [PubMed]
- Shakil, S.; Lee, C.H.; Keilholz, S.D. Evaluation of sliding window correlation performance for characterizing dynamic functional connectivity and brain states. Neuroimage 2016, 133, 111–128. [Google Scholar] [CrossRef] [Green Version]
- Du, Y.; Fryer, S.L.; Fu, Z.; Lin, D.; Sui, J.; Chen, J.; Damaraju, E.; Mennigen, E.; Stuart, B.; Loewy, R.L.; et al. Dynamic functional connectivity impairments in early schizophrenia and clinical high-risk for psychosis. Neuroimage 2017, 180, 632–645. [Google Scholar] [CrossRef]
- Allen, E.A.; Damaraju, E.; Plis, S.M.; Erhardt, E.B.; Eichele, T.; Calhoun, V.D. Tracking whole-brain connectivity dynamics in the resting state. Cereb. Cortex 2014, 24, 663–676. [Google Scholar] [CrossRef]
- Eavani, H.; Satterthwaite, T.D.; Filipovych, R.; Gur, R.E.; Gur, R.C.; Davatzikos, C. Identifying sparse connectivity patterns in the brain using resting-state fMRI. Neuroimage 2015, 105, 286–299. [Google Scholar] [CrossRef]
- Cao, J.; Worsley, K. The geometry of correlation fields with an application to functional connectivity of the brain. Ann. Appl. Probab. 1999, 9, 1021–1057. [Google Scholar] [CrossRef]
- Yu, Q.; Allen, E.A.; Sui, J.; Arbabshirani, M.R.; Pearlson, G.; Calhoun, V.D. Brain connectivity networks in schizophrenia underlying resting state functional magnetic resonance imaging. Curr. Top. Med. Chem. 2012, 12, 2415–2425. [Google Scholar] [CrossRef]
- Suk, H.I.; Lee, S.W.; Shen, D. Deep ensemble learning of sparse regression models for brain disease diagnosis. Med Image Anal. 2017, 37, 101–113. [Google Scholar] [CrossRef] [Green Version]
- Jie, N.F.; Osuch, E.A.; Zhu, M.H.; Ma, X.Y.; Wammes, M.; Jiang, T.Z.; Sui, J.; Calhoun, V.D. Discriminating Bipolar Disorder from Major Depression using Whole-Brain Functional Connectivity: A Feature Selection Analysis with SVM-FoBa Algorithm. J. Signal Process. Syst. 2018, 90, 259–271. [Google Scholar] [CrossRef]
- Qiao, C.; Lu, L.; Yang, L.; Kennedy, P.J. Identifying Brain Abnormalities with Schizophrenia Based on a Hybrid Feature Selection Technology. Appl. Sci. 2019, 9, 2148. [Google Scholar] [CrossRef]
- Chandrashekar, G.; Sahin, F. A Survey on Feature Selection Methods; Pergamon Press, Inc.: New York, NY, USA, 2014. [Google Scholar]
- Yuhui, D.; Zening, F.; Calhoun, V.D. Classification and Prediction of Brain Disorders Using Functional Connectivity: Promising but Challenging. Front. Neurosci. 2018, 12, 525. [Google Scholar]
- Kuncheva, L.I. Ensemble Feature Selection. In Combining Pattern Classifiers: Methods and Algorithms, 2nd ed.; John Wiley & Sons: New York, NY, USA, 2014. [Google Scholar]
- Cai, B.; Zille, P.; Stephen, J.M.; Wilson, T.; Calhoun, V.D.; Wang, Y.P. Estimation of dynamic sparse connectivity patterns from resting state fMRI. IEEE Trans. Med. Imaging 2018, 37, 1224–1234. [Google Scholar] [CrossRef]
- Zille, P.; Calhoun, V.D.; Stephen, J.M.; Wilson, T.; Wang, Y.P. Fused estimation of sparse connectivity patterns from rest fMRI: Application to comparison of children and adult brains. IEEE Trans. Med. Imaging 2018, 37, 2165–2175. [Google Scholar] [CrossRef]
- Hwang, K.; Hallquist, M.N.; Luna, B. The development of hub architecture in the human functional brain network. Cereb. Cortex 2013, 23, 2380–2393. [Google Scholar] [CrossRef]
- Power, J.D.; Cohen, A.L.; Nelson, S.M.; Wig, G.S.; Petersen, S.E. Functional network organization of the human brain. Neuron 2011, 72, 665–678. [Google Scholar] [CrossRef]
- Nelson, S.M.; Cohen, A.L.; Power, J.D.; Wig, G.S.; Petersen, S.E. A parcellation scheme for human left lateral parietal cortex. Neuron 2010, 67, 156–170. [Google Scholar] [CrossRef]
- Cohen, A.L.; Fair, D.A.; Dosenbach, N.U.F.; Miezin, F.M.; Dierker, D.; Essen, D.C.V.; Schlaggar, B.L.; Petersen, S.E. Defining functional areas in individual human brains using resting functional connectivity MRI. Neuroimage 2008, 41, 45–57. [Google Scholar] [CrossRef] [Green Version]
- Li, Y.; Wang, M.; Wang, H.; Zhang, Z.D.; Geoffrey, W.; Song, J.N. Accurate in silico identification of species-specific acetylation sites by integrating protein sequence-derived and functional features. Sci. Rep. 2014, 4, 5765. [Google Scholar] [CrossRef] [Green Version]
- Jolles, D.D.; Van Buchem, M.A.; Crone, E.A.; Rombouts Serge, A.R.B. A comprehensive study of whole-brain functional connectivity in children and young adults. Cereb. Cortex 2011, 21, 385–391. [Google Scholar] [CrossRef] [PubMed]
- Hutchison, R.M.; Morton, J.B. Tracking the brains functional coupling dynamics over development. Neuroscience 2015, 35, 6849–6859. [Google Scholar] [CrossRef] [PubMed]
- Engel, J.; Thompson, P.M.; Stern, J.M.; Staba, R.J.; Bragin, A.; Mody, I. Connectomics and epilepsy. Curr. Opin. Neurol. 2013, 26, 186–194. [Google Scholar] [CrossRef] [PubMed]
- Broyd, S.J.; Demanuele, C.; Debener, S.; Helps, S.K.; James, C.J.; Sonuga-Barke, E.J.S. Default-mode brain dysfunction in mental disorders: A systematic review. Neurosci. Biobehav. Rev. 2009, 33, 279–296. [Google Scholar] [CrossRef] [PubMed]
- Anderson, J.S.; Ferguson, M.A.; Lopez-Larson, M.; Yurgelun-Todd, D. Connectivity gradients between the default mode and attention control networks. Brain Connect. 2011, 1, 147–157. [Google Scholar] [CrossRef]
- Giedd, J.N. The teen brain: Insights from neuroimaging. J. Adolescent Health 2008, 42, 335–343. [Google Scholar] [CrossRef]
- Guyon, I.; Weston, J.; Barnhill, S.; Vapnik, V. Gene selection for cancer classification using support vector machines. Mach. Learn. 2002, 46, 389–422. [Google Scholar] [CrossRef]
- Zhou, X.; Tuck, D.P. MSVM-RFE: Extensions of SVM-RFE for multiclass gene selection on DNA microarray data. Bioinformatics 2007, 23, 1106–1114. [Google Scholar] [CrossRef]
- Yan, K.; Zhang, D. Feature selection and analysis on correlated gas sensor data with recursive feature 536 elimination. Sens. Actuators B Chem. 2015, 212, 353–363. [Google Scholar] [CrossRef]
- Kumar, A.; Sharmila, D.J.S.; Singh, S. SVMRFE based approach for prediction of most discriminatory gene target for type II diabetes. Genom. Data 2017, 12, 28–37. [Google Scholar] [CrossRef]
- Guyon, I.; Elisseeff, A. An Introduction to Variable and Feature Selection. J. Mach. Learn. 2003, 3, 1157–1182. [Google Scholar]
- Dao, F.Y.; Lv, H.; Wang, F.; Feng, C.Q.; Ding, H.; Chen, W.; Lin, H. Identify origin of replication in Saccharomyces cerevisiae using two-step feature selection technique. Bioinformatics 2018. [Google Scholar] [CrossRef] [PubMed]
- Satterthwaite, T.D.; Elliott, M.A.; Ruparel, K.; Calkins, M.E.; Jackson, C.; Elliott, M.A.; Roalf, D.R.; Hopson, R.; Prabhakaran, K.; Behr, M.; et al. The philadelphia neurodevelopmental cohort: A publicly available resource for the study of normal and abnormal brain development in youth. Neuroimage 2016, 124, 1115–1119. [Google Scholar] [CrossRef] [PubMed]
- Chiang, S.; Vankov, E.R.; Yeh, H.J.; Guindani, M.; Vannucci, M.; Haneef, Z.; Stern, J. Temporal and spectral characteristics of dynamic functional connectivity between resting-state networks reveal information beyond static connectivity. PLoS ONE 2018, 13, e0190220. [Google Scholar] [CrossRef]
- Marusak, H.A.; Calhoun, V.D.; Brown, S.; Crespo, L.M.; Thomason, M.E. Dynamic functional connectivity of neurocognitive networks in children. Hum. Brain Mapp. 2016, 38, 97–108. [Google Scholar] [CrossRef]
- Damaraju, E.; Allen, E.A.; Belger, A.; Ford, J.M.; McEwen, S.; Mathalon, D.H.; Muellwe, B.A.; Pearlson, G.D.; Potkin, S.G.; Preda, A.; et al. Dynamic functional connectivity analysis reveals transient states of dysconnectivity in schizophrenia. Neuroimage Clin. 2014, 5, 298–308. [Google Scholar] [CrossRef] [Green Version]
- Shirer, W.R.; Ryali, S.; Rykhlevskaia, E.; Menon, V.; Greicius, M.D. Decoding subject-driven cognitive states with whole-brain connectivity patterns. Cereb. Cortex 2012, 22, 158–165. [Google Scholar] [CrossRef]
- Smith, S.M.; Fox, P.T.; Miller, K.L.; Glahn, D.C.; Beckmann, C.F. Correspondence of the brain’s functional architecture during activation and rest. Proc. Natl. Acad. Sci. USA 2009, 106, 13040–13045. [Google Scholar] [CrossRef]
- Smith, S.M.; Miller, K.L.; Salimi-Khorshidi, G.; Webster, M.; Beckmann, C.F.; Nichols, T.E.; Ramsey, J.D.; Woolrich, M.W. Network modelling methods for fMRI. NeuroImage 2011, 54, 875–891. [Google Scholar] [CrossRef]
- Mingrui, X.; Jinhui, W.; Yong, H. BrainNet viewer: A network visualization tool for human brain connectomics. PLoS ONE 2013, 8, e68910. [Google Scholar]
- Baggio, H.C.; Sala-Llonch, R.; Segura, B.; Marti, M.J.; Valldeoriola, F.; Compta, Y.; Tolosa, E.; Junque, C. Functional brain networks and cognitive deficits in Parkinson’s disease. Hum. Brain Mapp. 2014, 35, 4620–4634. [Google Scholar] [CrossRef] [PubMed]
- Wang, J.H.; Zuo, X.N.; Dai, Z.J.; Xia, M.R.; Zhao, Z.L.; Zhao, X.L.; Jia, J.P.; Han, Y.; He, Y. Disrupted functional brain connectome in individuals at risk for Alzheimer’s disease. Biol. Psychiatry 2013, 73, 472–481. [Google Scholar] [CrossRef] [PubMed]
- Peng, H.; Long, F.; Ding, C. Feature selection based on mutual information criteria of max-dependency, max-relevance, and min-redundancy. IEEE Trans. Pattern Anal. Mach. 2005, 27, 1226–1238. [Google Scholar] [CrossRef] [PubMed]
- Menze, B.H.; Kelm, M.B.; Masuch, R.; Himmelreich, U.; Bachert, P.; Petrich, W.; Hamprecht, F.A. A comparison of random forest and its Gini importance with standard chemometric methods for the feature selection and classification of spectral data. BMC Bioinform. 2009, 10, 213. [Google Scholar] [CrossRef]
- Londei, A.; D’Ausilio, A.; Basso, D.; Sestieri, C.; Gratta, C.D.; Romani, G.L.; Belardinelli, M.O. Sensory-motor brain network connectivity for speech comprehension. Hum. Brain Mapp. 2010, 31, 567–580. [Google Scholar] [CrossRef]
- Sheffield, J.M.; Repovs, G.; Harms, M.P.; Carter, C.S.; Gold, J.M.; MacDonald, A.W.; Ragland, D.; Silverstein, S.M.; Godwin, D.; Barch, D.M. Fronto-parietal and cingulo-opercular network interity and cognition in health and schizophrenia. Neuropsychologia 2015, 73, 82–93. [Google Scholar] [CrossRef]
- Cubillo, A.; Halari, R.; Smith, A.; Taylor, E.; Rubia, K. A review of fronto-striatal and fronto-cortical brain abnormalities in children and adults with Attention Deficit Hyperactivity Disorder (ADHD) and new evidence for dysfunction in adults with ADHD during motivation and attention. Cortex 2012, 48, 194–215. [Google Scholar] [CrossRef]
Figure 1.
The two-step feature selection method. In which SVMRFE-CA denotes support vector machine recursive feature elimination-classification accuracy, FSCS denotes F-score and the correlation score.
Figure 1.
The two-step feature selection method. In which SVMRFE-CA denotes support vector machine recursive feature elimination-classification accuracy, FSCS denotes F-score and the correlation score.
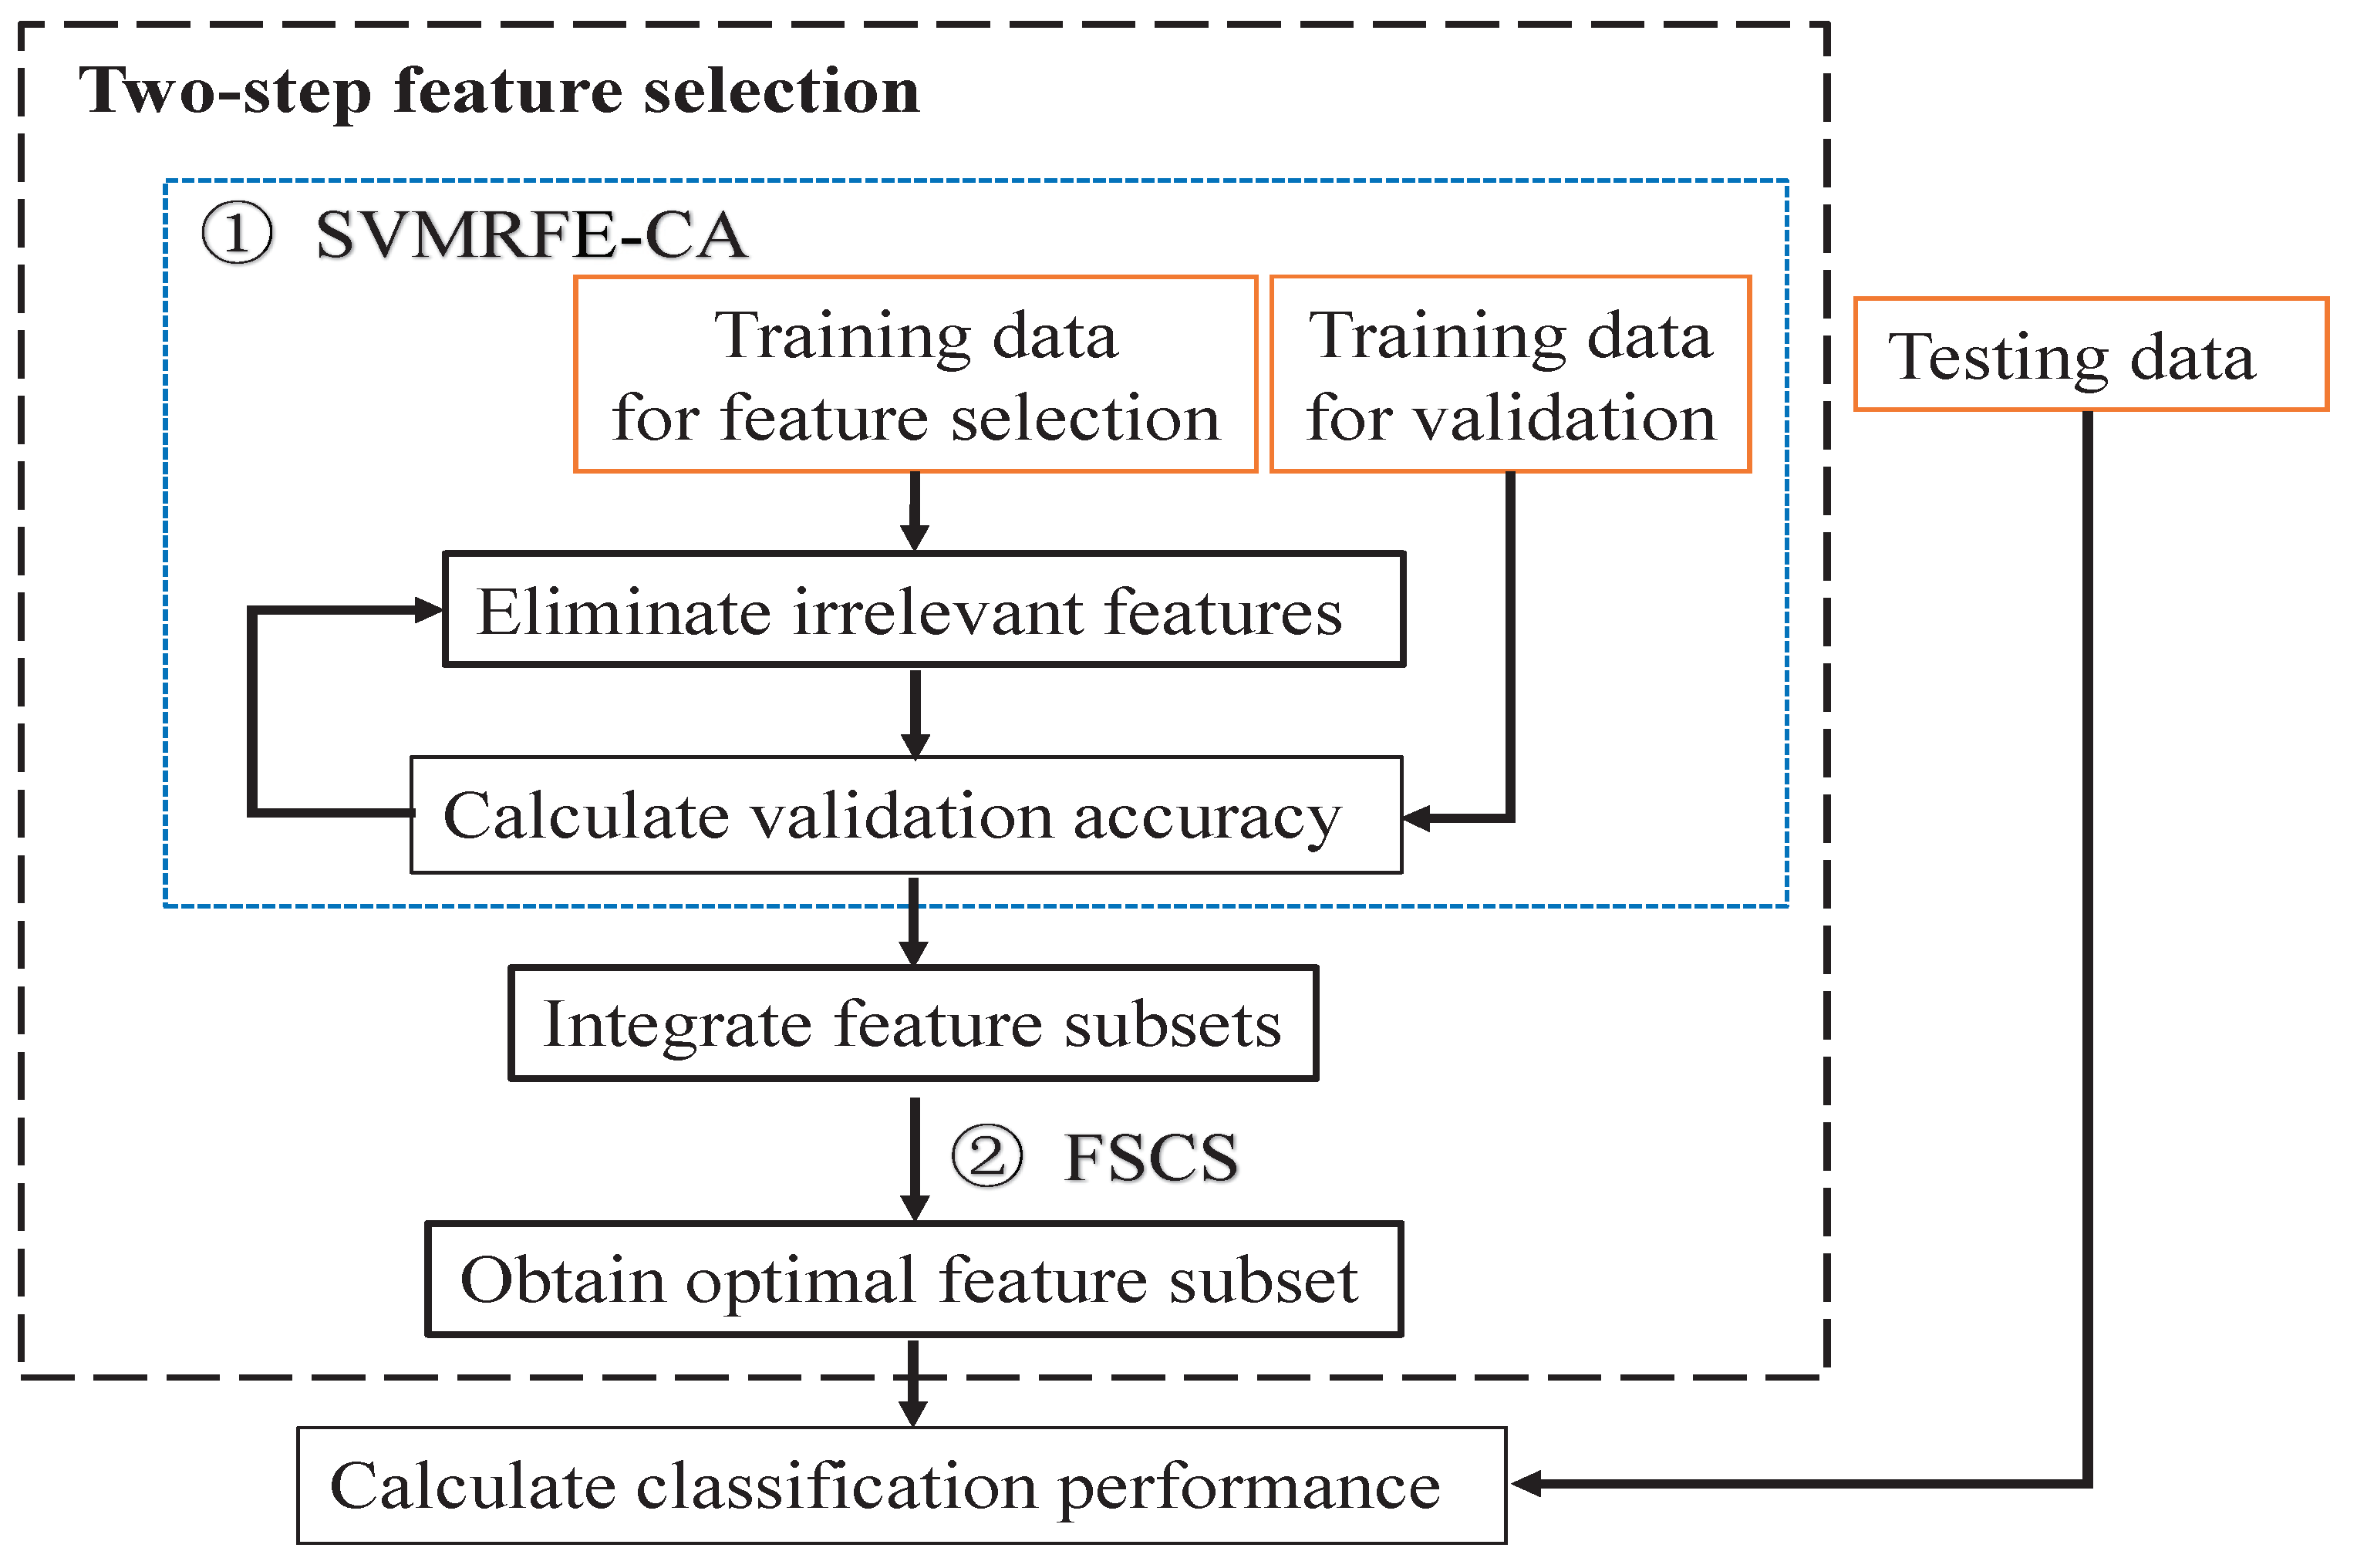
Figure 2.
Flowchart for investigating the developmental differences. Resting-state functional magnetic resonance (rs-fMRI), blood oxygen level dependent (BOLD), functional connectivity (FC), intrinsic connectivity networks (ICNs).
Figure 2.
Flowchart for investigating the developmental differences. Resting-state functional magnetic resonance (rs-fMRI), blood oxygen level dependent (BOLD), functional connectivity (FC), intrinsic connectivity networks (ICNs).
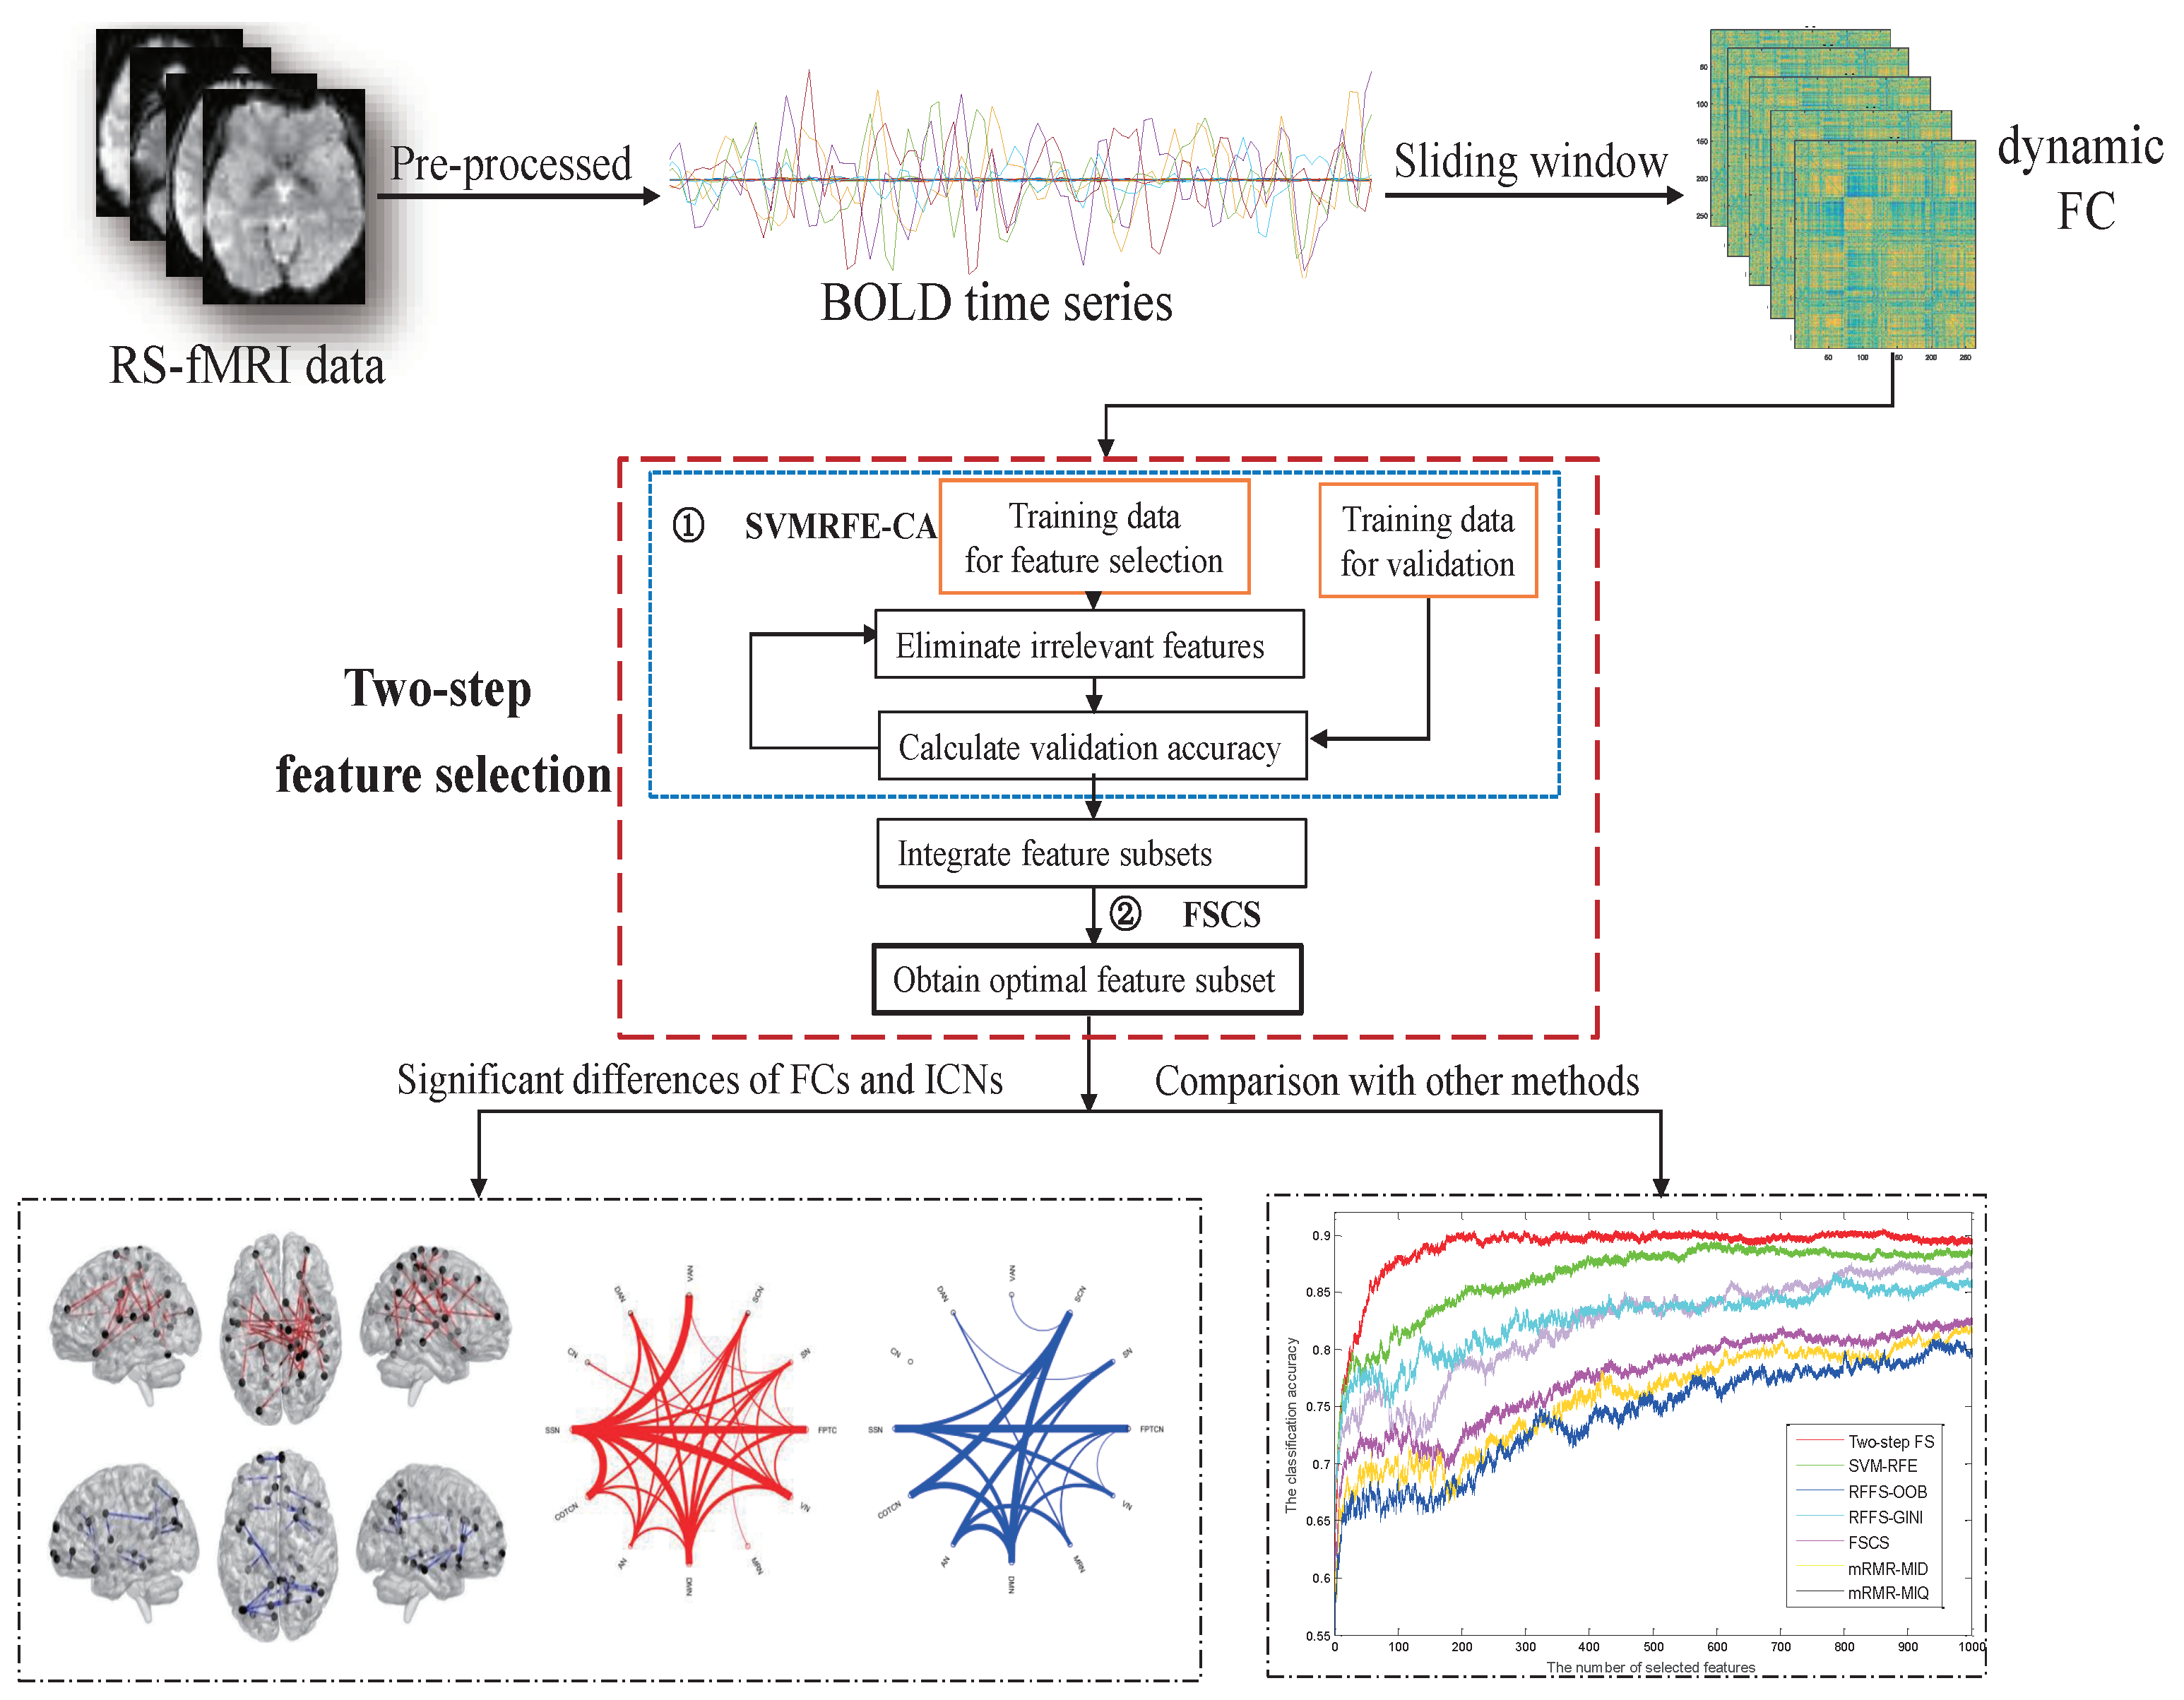
Figure 3.
The flowchart for calculating the feature vector of each subject. Pearson correlations coefficient (PCC).
Figure 3.
The flowchart for calculating the feature vector of each subject. Pearson correlations coefficient (PCC).
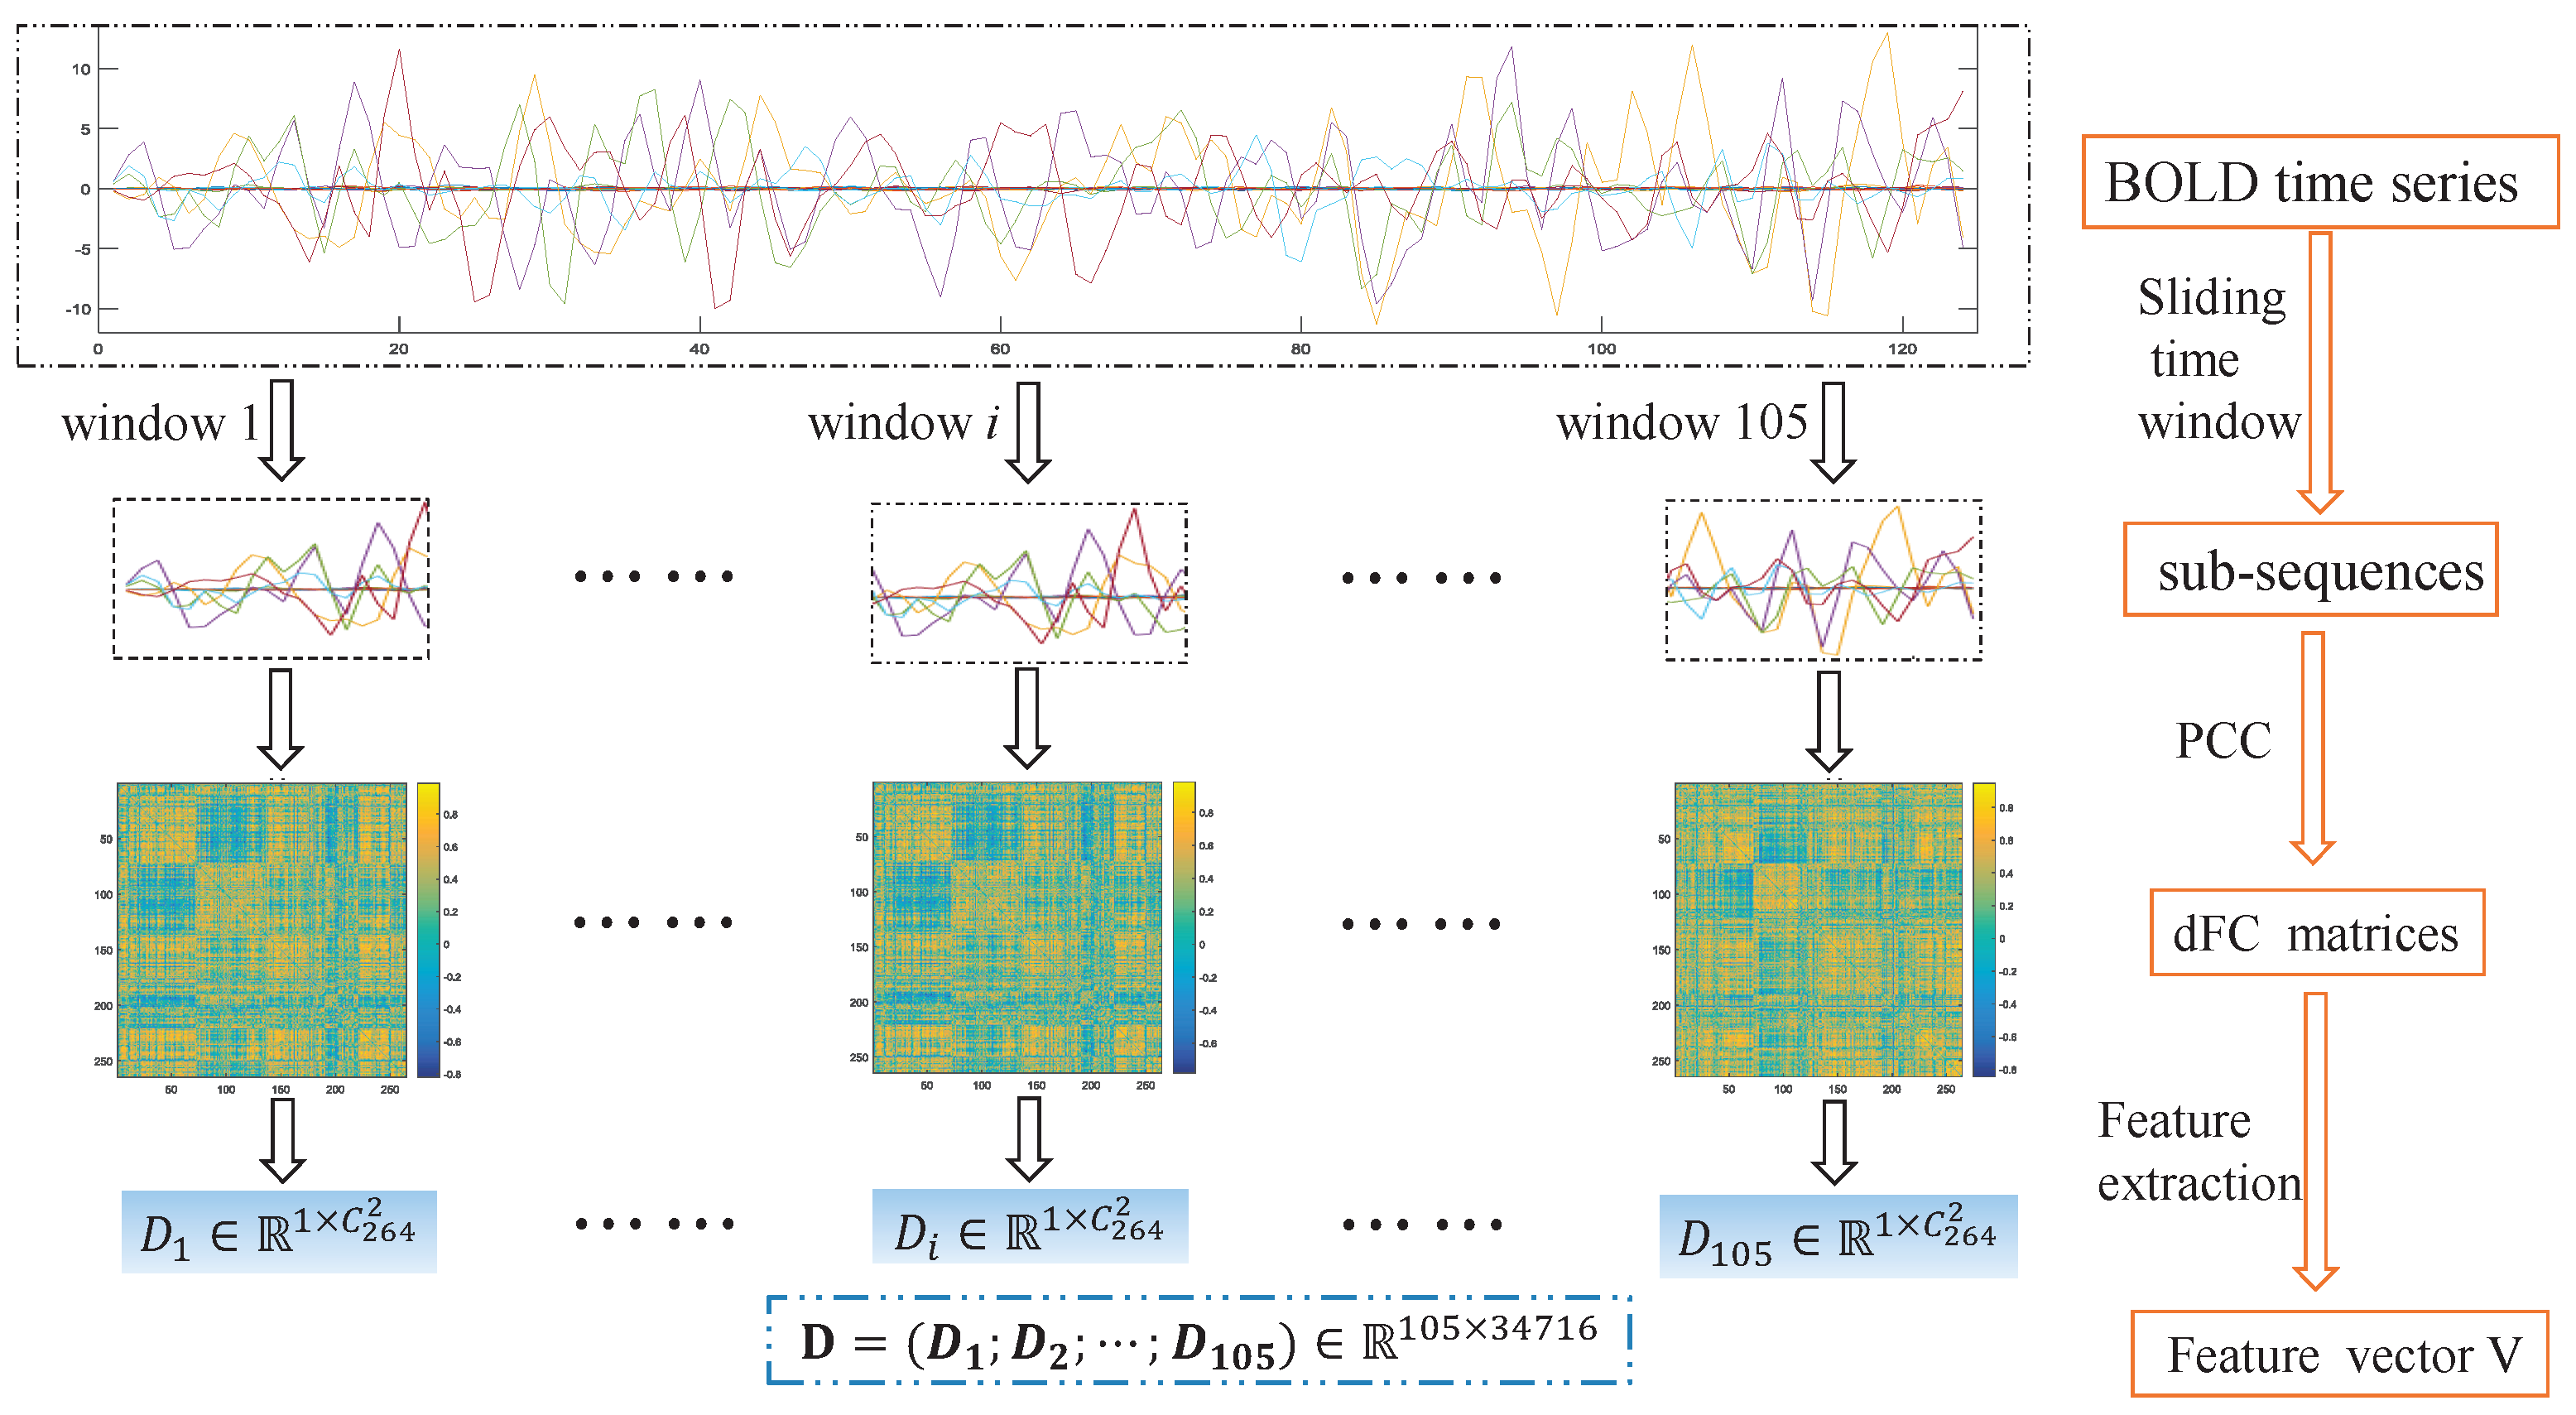
Figure 4.
Resting state network maps. Sensory/somatomotor network (SSN), cingulo-opercular task control network (COTCN), auditory network (AN), default mode network (DMN), memory retrieval network (MRN), visual network (VN), fronto-parietal task control network (FPTCN), salience network (SN), subcortical network (SCN), ventral attention network (VAN), dorsal attention network (DAN), and cerebellar network (CN).
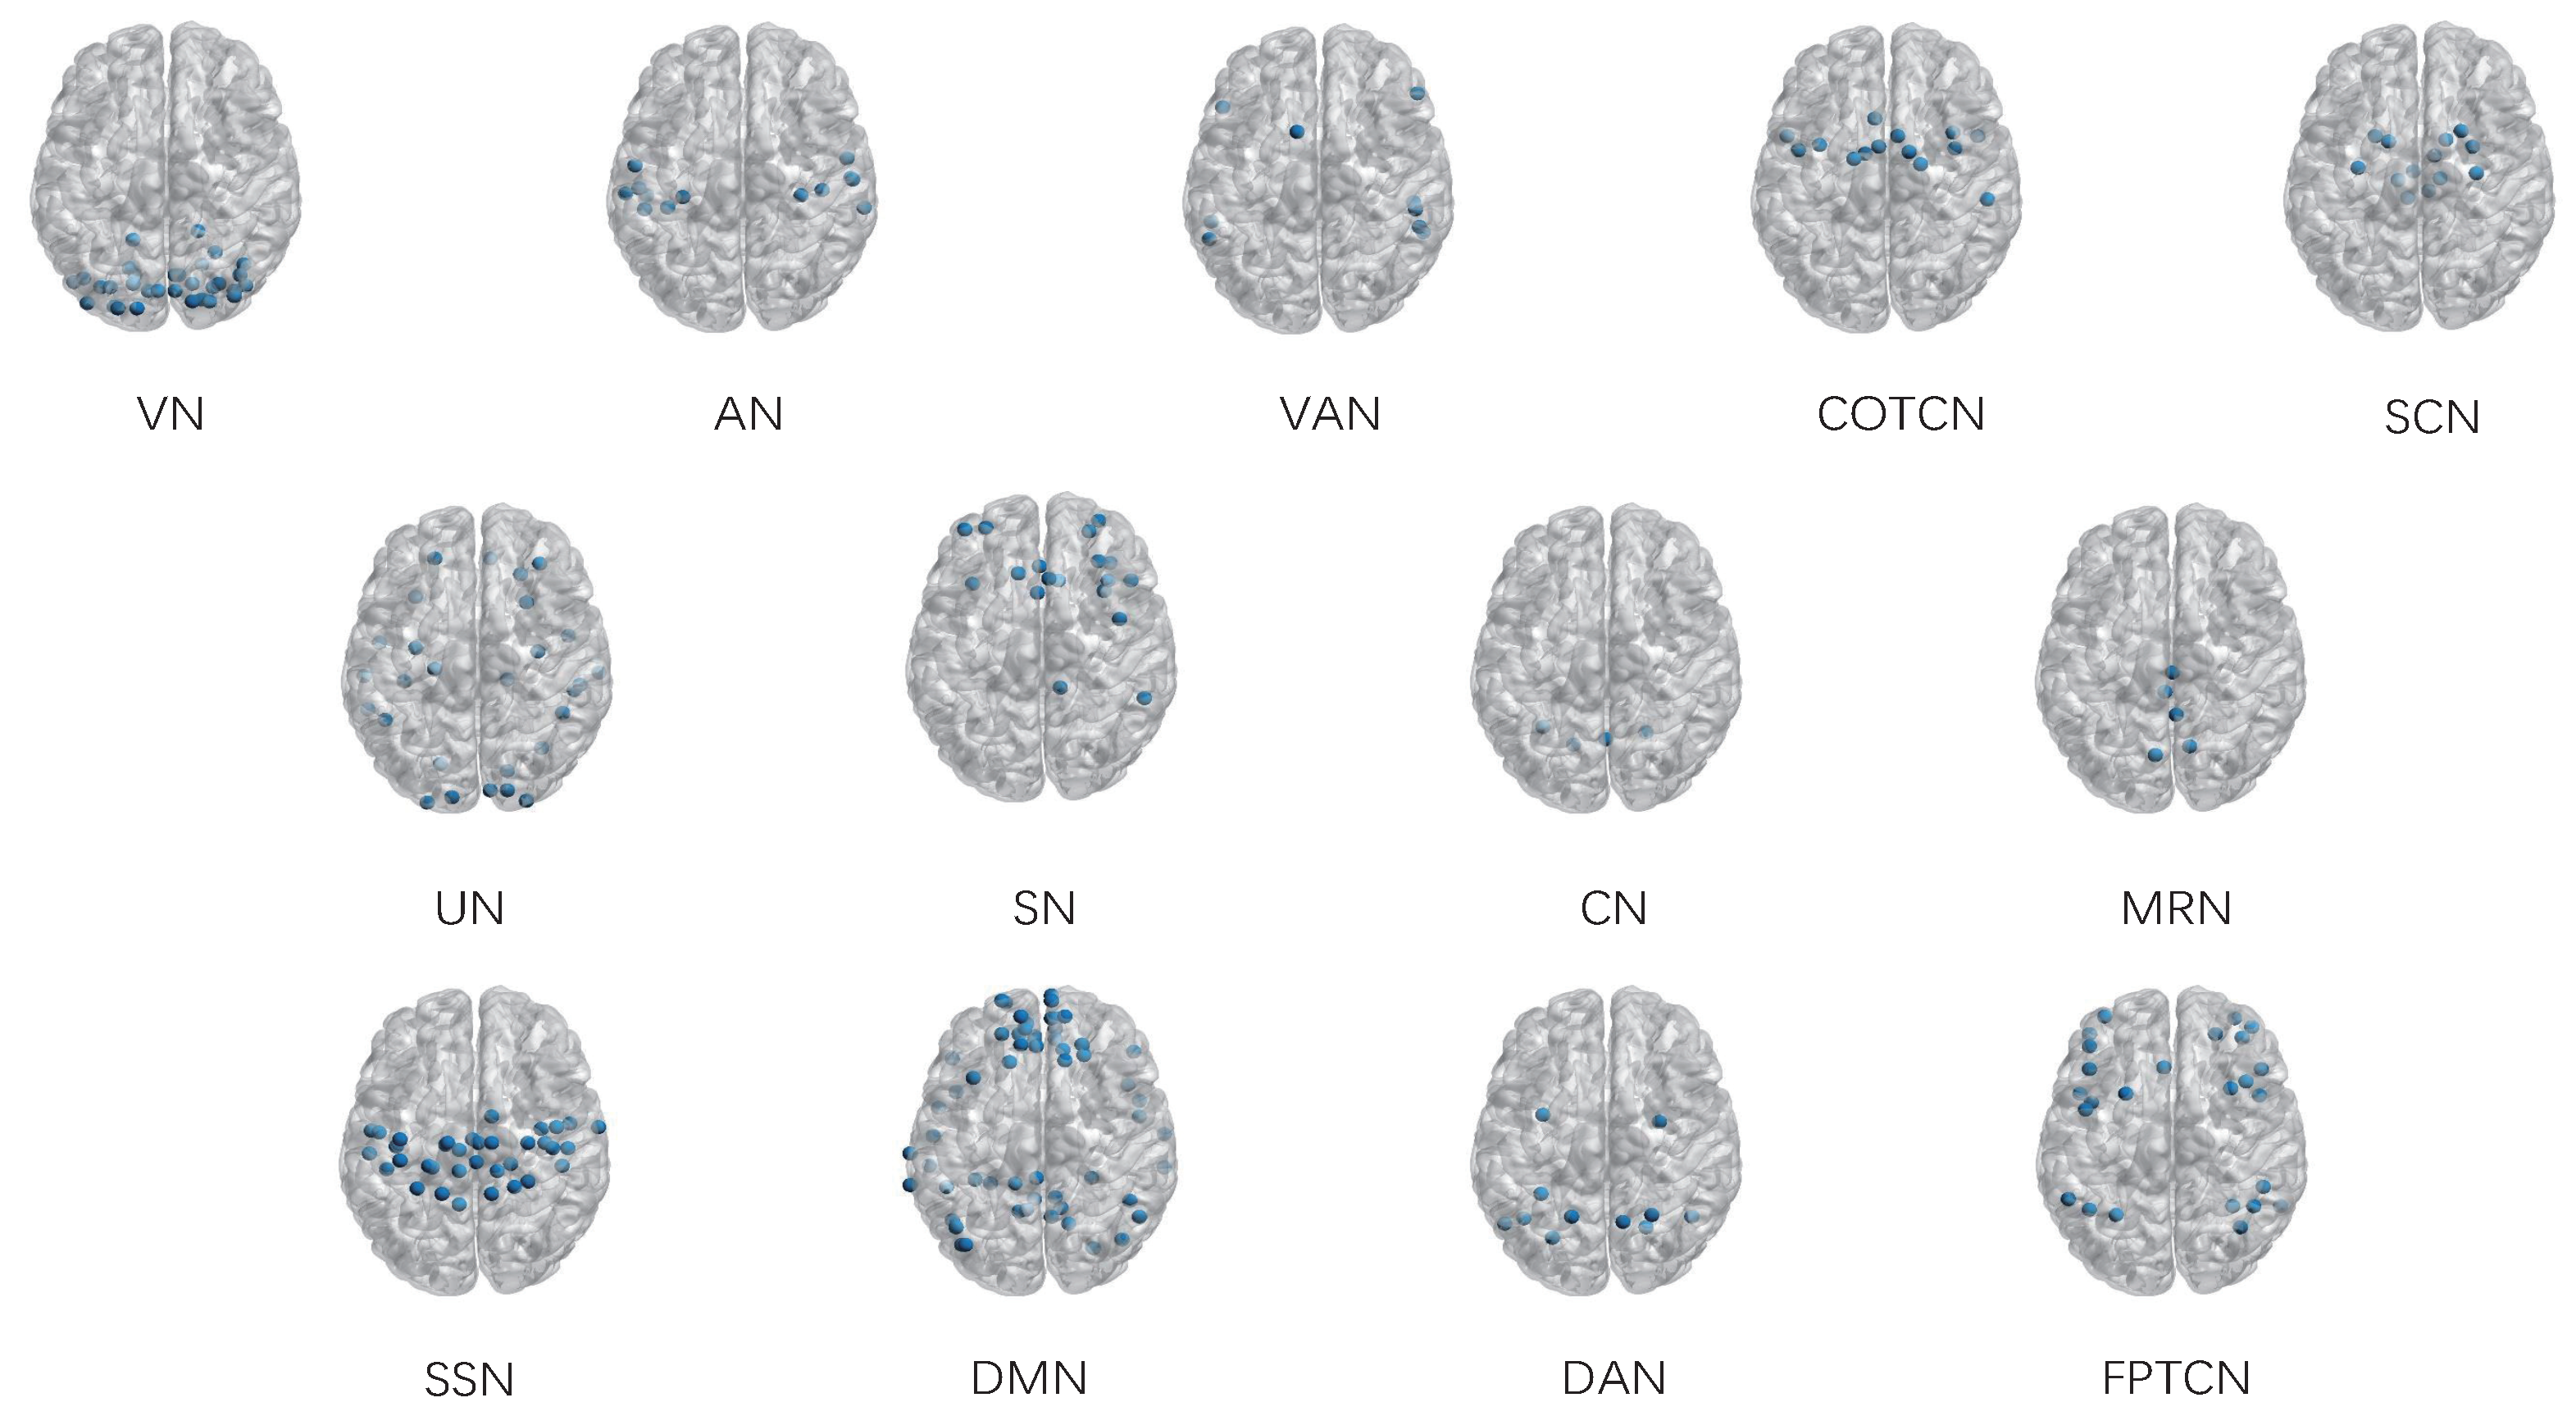
Figure 5.
The significant differences of functional connections between young adults and children.

Figure 6.
Different distributions of the 104 functional connections among the 12 certain resting state networks (RSNs).
Figure 6.
Different distributions of the 104 functional connections among the 12 certain resting state networks (RSNs).
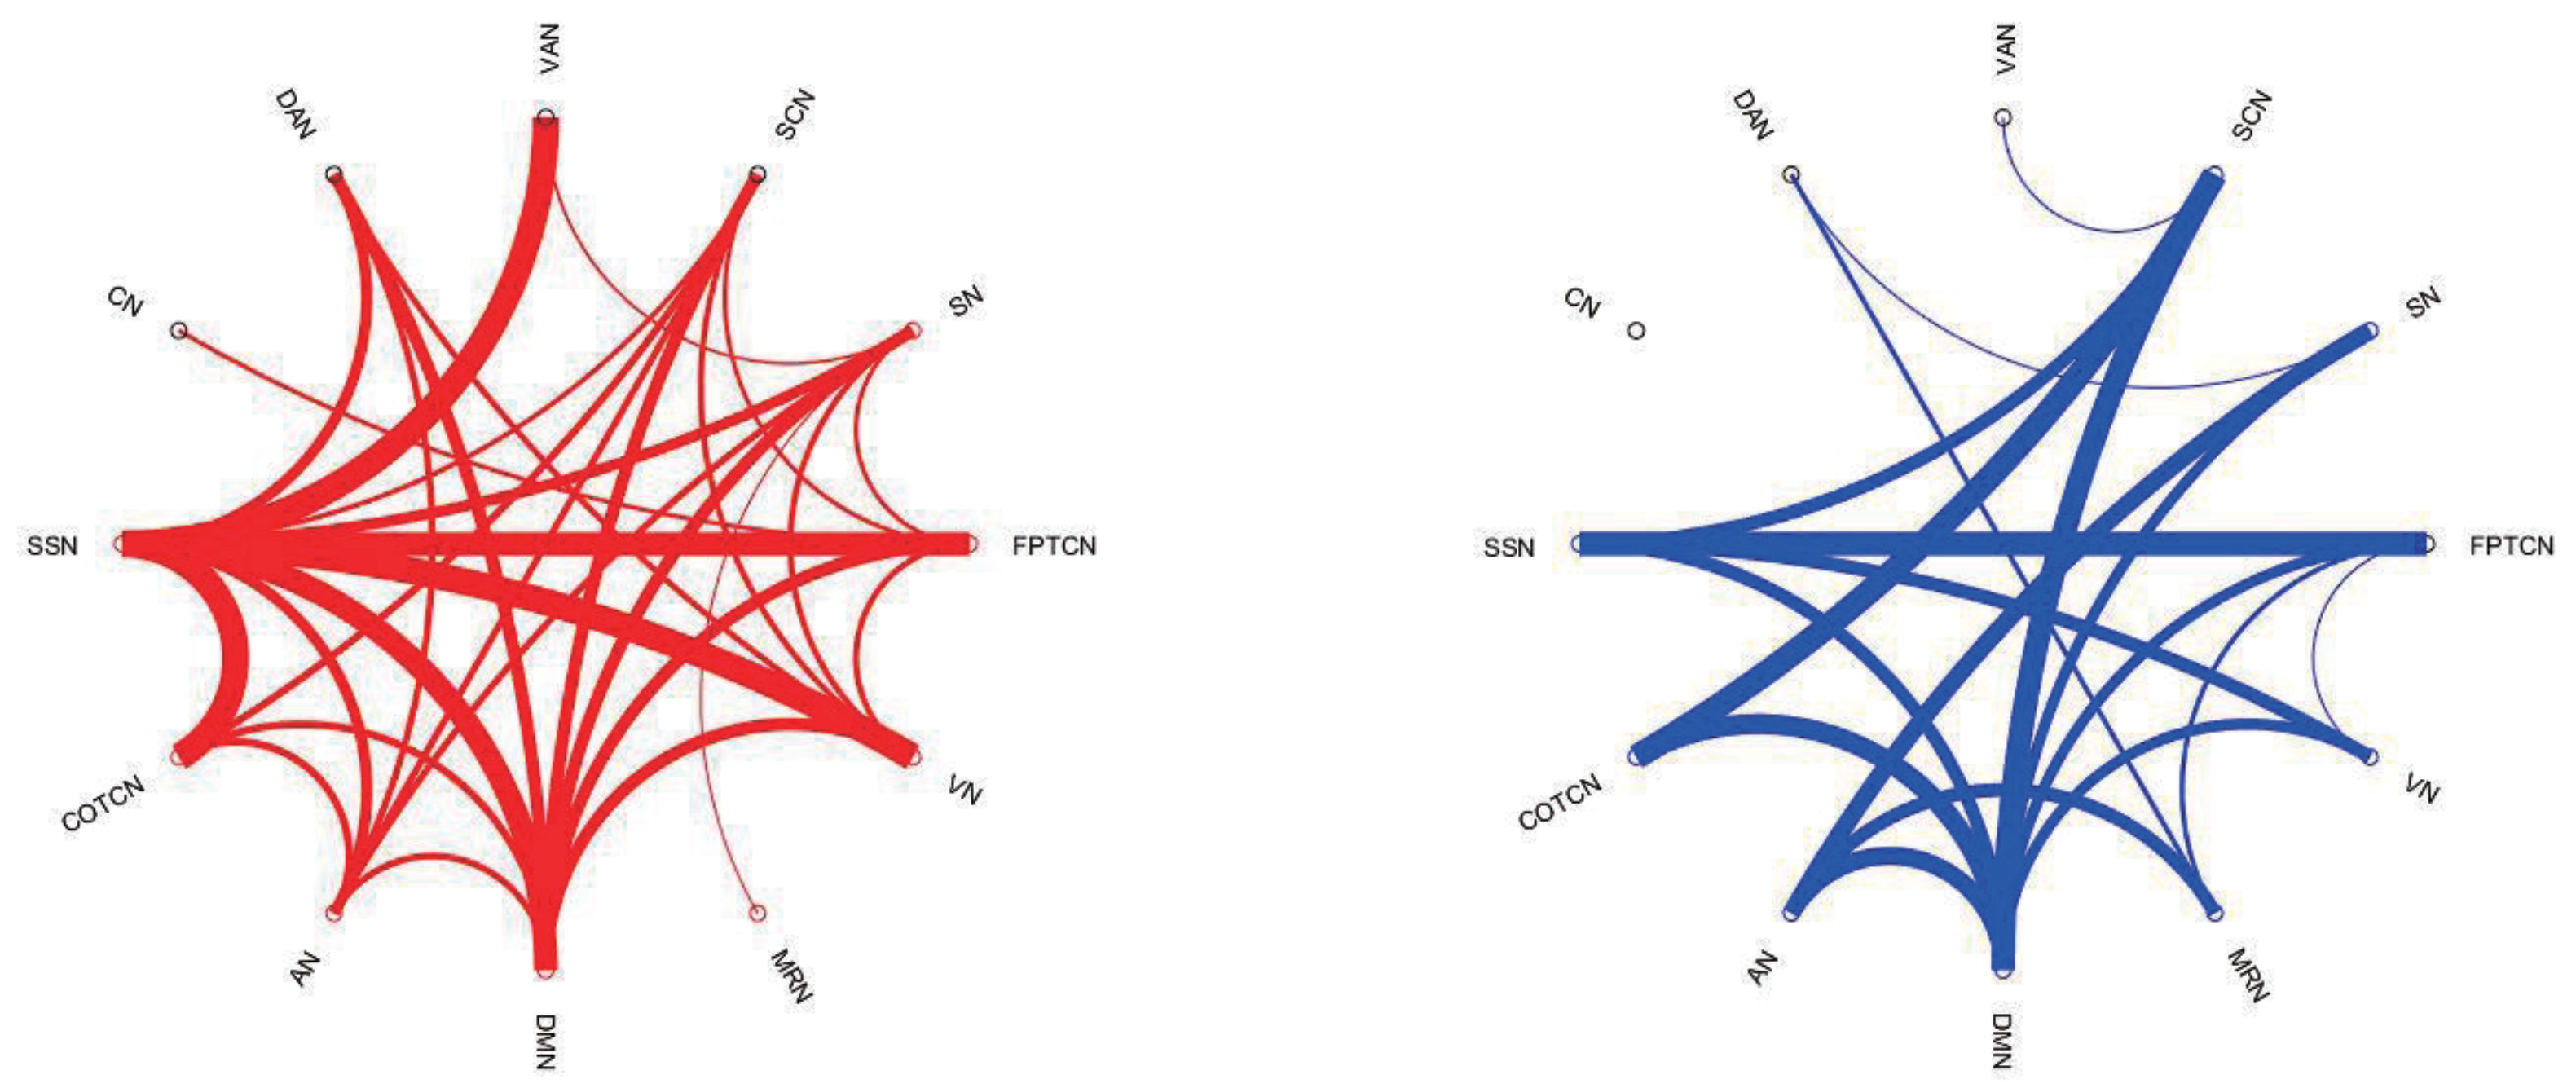
Figure 7.
The significant differences of functional connectivity on regions of interest (ROIs) between young adults and children, where the red lines represent those strengthened functional connections in the brains of young adults relative to children, and the blue lines represent the weakened functional connections.

Figure 8.
The classification accuracy rate (CAR) results of different feature selection methods. Maximum correlation minimum redundancy with mutual information difference (mRMR-MID), maximum correlation minimum redundancy with mutual information entropy (mRMR-MIQ), feature section with random forest by Gini index (RFFS-GINI), and feature section with random forest by out of bag data (RFFS-OOB).


Table 1.
Demographic characteristics of the subjects.
| Children | Young Adults | |
|---|---|---|
| Number | 193 | 204 |
| Gender (male/female) | 91/102 | 81/123 |
| Age (Mean ± SD, months) | 124.06 ± 11.33 | 231.50 ± 12.14 |
| Ethnicity | ||
| ASIAN | 3 (1.5%) | 0 (0%) |
| AFRICAN | 77 (39.9%) | 74 (36.3%) |
| AMERICAN | 0 (0%) | 2 (1%) |
| OTHER/MIXED | 20 (10.4%) | 17 (8.3%) |
| CAUCASIAN/WHITE | 92 (47.7%) | 111 (54.4%) |
| HAWAIIAN/PACIFIC | 1 (0.5%) | 0 (0%) |
Table 2.
Different measuring parameters of the topological properties for brain network.
| Measure | Definition |
|---|---|
| Cc: Clustering coefficient | |
| Lp: Characteristic path length | |
| : local efficiency | |
| : global efficiency |
Where is the number of triangles around node i, is the number of links connected directly to node i, is the shortest path length between node i and node j.
Table 3.
Average classification performance of different feature selection methods. Sensitivity (SS), specificity (SC), positive predictive value (PPV) and negative predictive value (NPV).
Table 3.
Average classification performance of different feature selection methods. Sensitivity (SS), specificity (SC), positive predictive value (PPV) and negative predictive value (NPV).
| Methods | CAR | SS | SC | PPV | NPV |
|---|---|---|---|---|---|
| Two-step FS | 0.9063 | 0.8951 | 0.9041 | 0.9026 | 0.8942 |
| SVM-RFE | 0.8922 | 0.8787 | 0.8930 | 0.8975 | 0.8827 |
| RFFS-OOB | 0.8756 | 0.8601 | 0.8734 | 0.8651 | 0.8669 |
| RFFS-GINI | 0.8645 | 0.8514 | 0.8584 | 0.8581 | 0.8512 |
| FSCS | 0.8253 | 0.8305 | 0.8285 | 0.8208 | 0.8378 |
| mRMR-MID | 0.8190 | 0.8129 | 0.8140 | 0.8108 | 0.8301 |
| mRMR-MIQ | 0.8059 | 0.8107 | 0.8175 | 0.8108 | 0.8308 |
© 2019 by the authors. Licensee MDPI, Basel, Switzerland. This article is an open access article distributed under the terms and conditions of the Creative Commons Attribution (CC BY) license (http://creativecommons.org/licenses/by/4.0/).
Share and Cite
MDPI and ACS Style
Qiao, C.; Gao, B.; Lu, L.-J.; Calhoun, V.D.; Wang, Y.-P. Two-Step Feature Selection for Identifying Developmental Differences in Resting fMRI Intrinsic Connectivity Networks. Appl. Sci. 2019, 9, 4298. https://doi.org/10.3390/app9204298
AMA Style
Qiao C, Gao B, Lu L-J, Calhoun VD, Wang Y-P. Two-Step Feature Selection for Identifying Developmental Differences in Resting fMRI Intrinsic Connectivity Networks. Applied Sciences. 2019; 9(20):4298. https://doi.org/10.3390/app9204298
Chicago/Turabian StyleQiao, Chen, Bin Gao, Lu-Jia Lu, Vince D. Calhoun, and Yu-Ping Wang. 2019. "Two-Step Feature Selection for Identifying Developmental Differences in Resting fMRI Intrinsic Connectivity Networks" Applied Sciences 9, no. 20: 4298. https://doi.org/10.3390/app9204298
Note that from the first issue of 2016, this journal uses article numbers instead of page numbers. See further details here.