Photonic-Assisted Scanning Receivers for Microwave Frequency Measurement
by
 , , and
Shijie Song
1 ,
,
Xiaoke Yi
1,*,
Lu Gan
2,
Wenjian Yang
1,
Linh Nguyen
1,
Suen Xin Chew
1,
Liwei Li
1 and
Robert A. Minasian
1 1
School of Electrical and Information Engineering, The University of Sydney, Camperdown, NSW 2006, Australia
2
College of Engineering, Design and Physical Science, Brunel University, London UB8 3PH, UK
*
Author to whom correspondence should be addressed.
Appl. Sci. 2019, 9(2), 328; https://doi.org/10.3390/app9020328
Submission received: 23 November 2018
/
Revised: 10 January 2019
/
Accepted: 14 January 2019
/
Published: 17 January 2019
(This article belongs to the Special Issue Microwave Photonics 2018)
Abstract
:We present a novel technique based on matrix pencil assisted deconvolution to improve the measurement resolution in scanning receiver systems for microwave frequency measurements. By modeling the scanning receiver output as the cross-correlation of the input modulated signal with the filter’s spectral response and applying the matrix pencil algorithm to convolve the detected optical signal at the receiver output, our technique offers precise estimations of both the frequency and power information of microwave signals with an improved measurement resolution. A multi-tone microwave signal measurement based on an optical filter is experimentally demonstrated, showing a significant measurement resolution reduction from 1 GHz to 0.4 GHz for two radio frequency (RF) tones, which is only about 30.2% of the optical filter bandwidth.
1. Introduction
Microwave frequency measurement plays a critical role in applications such as radar and electronic warfare to perform real-time microwave spectrum activity monitoring and instantaneous identification of unknown microwave signals. Recently, various photonic-assisted approaches have been proposed to exploit their inherent advantages such as wide instantaneous bandwidth and immunity to electromagnetic interference [1]. These approaches can be loosely categorized into three broad classes. The first class is formed by channelized receivers, which perform frequency measurement by splitting and filtering the input radio frequency (RF) spectrum into multiple narrowband channels to monitor and detect the presence of any incoming RF signals in each channel. Technologies such as optical combs, parametric mixers, spectral hole burning, and temporal channelization [2,3,4,5], have been demonstrated to realize a channelized RF filter bank. These schemes require multiple light sources or a bank of highly selective optical filters in combination with an array of photodetectors, both of which incur significant bulk and weight. In addition, precise optical channel alignment is also essential.
The second class of approach is based on the concept of frequency-to-power mapping, where a relationship between the frequency of the RF signal of interest and the detected optical power is established [6,7,8,9,10,11]. This frequency-dependent power ratio, which is often referred to as the amplitude comparison function, has been demonstrated using a pair of photodetectors or optical power meters to detect the output optical powers from a complementary filter pair or an add-drop optical filter, such as those based on ring resonator and phase shifted Bragg grating. Whilst this approach achieves high precision for estimating an unknown frequency, it is more often limited by its inadequacy to measure multiple microwave frequencies simultaneously in a spectrally cluttered environment. To enable the measurement of multiple microwave frequencies, a variation of this approach was presented based on stimulated Brillouin scattering (SBS) with the use of multiple optical modulators.
Photonic frequency scanning approaches, on the other hand, form the third class for implementing microwave frequency measurement [12,13,14,15,16,17,18,19,20]. This technique can be realized in a simple configuration with a single laser, an electro-optic modulator (EOM), an optical filter, and a low-speed photodetector whilst demonstrating the capability to perform single and multiple frequency measurements. Frequency scanning can be easily achieved via tuning the carrier frequency of the laser or the center wavelength of the optical filter. Current developments in integrated optical filters have demonstrated a fast-swept filter based on an interior-ridge micro-ring with a mean sweep rate of 22,600 nm/s, which makes a monolithically integrated on-chip scanning receiver with compact size and low power consumption possible [21].
Classical scanning receivers implement RF sensing via measuring the time delay occurring relative to a reference time of filter shaped pulses detected by a photodetector. However, due to the bandwidth of the filter, each single RF frequency component will spread out, thus forming a broader distribution which mimics the filter shape in the time domain. With the reduction in separation between closely spaced RF frequency components, the dip between two pulse peaks slowly merges and eventually disappears, leading to a limited measurement resolution. In [12], a scanning receiver with a resolution of about 5 GHz is experimentally demonstrated via a micro-ring resonator with a bandwidth of 5 GHz, which shows the limitation of the measurement resolution governed by the bandwidth of the optical filter employed in the scanning receiver.
In this letter, we adopted the concept of deconvolution, which is commonly used in areas such as optical imaging and spectroscopy to break the Rayleigh criterion for point spread functions [22,23], for scanning receiver systems for RF frequency measurement. Specifically, the matrix pencil method, which enables a precise recovery of frequency components via solving a generalized eigenvalue problem, was adopted for deconvolution due to its high robustness to noise [24]. The information of the input microwave signals is directly obtained from its reconstructed spectrum by means of deconvolving the system’s output using matrix pencil method, thus improving the resolution and accuracy of the scanning system. As a proof of concept, a frequency measurement of both single-tone and multiple-tone microwave signals was conducted, and the results show that this method is effective in recovering the frequency information with high resolution and accuracy.
2. Principle of Operation
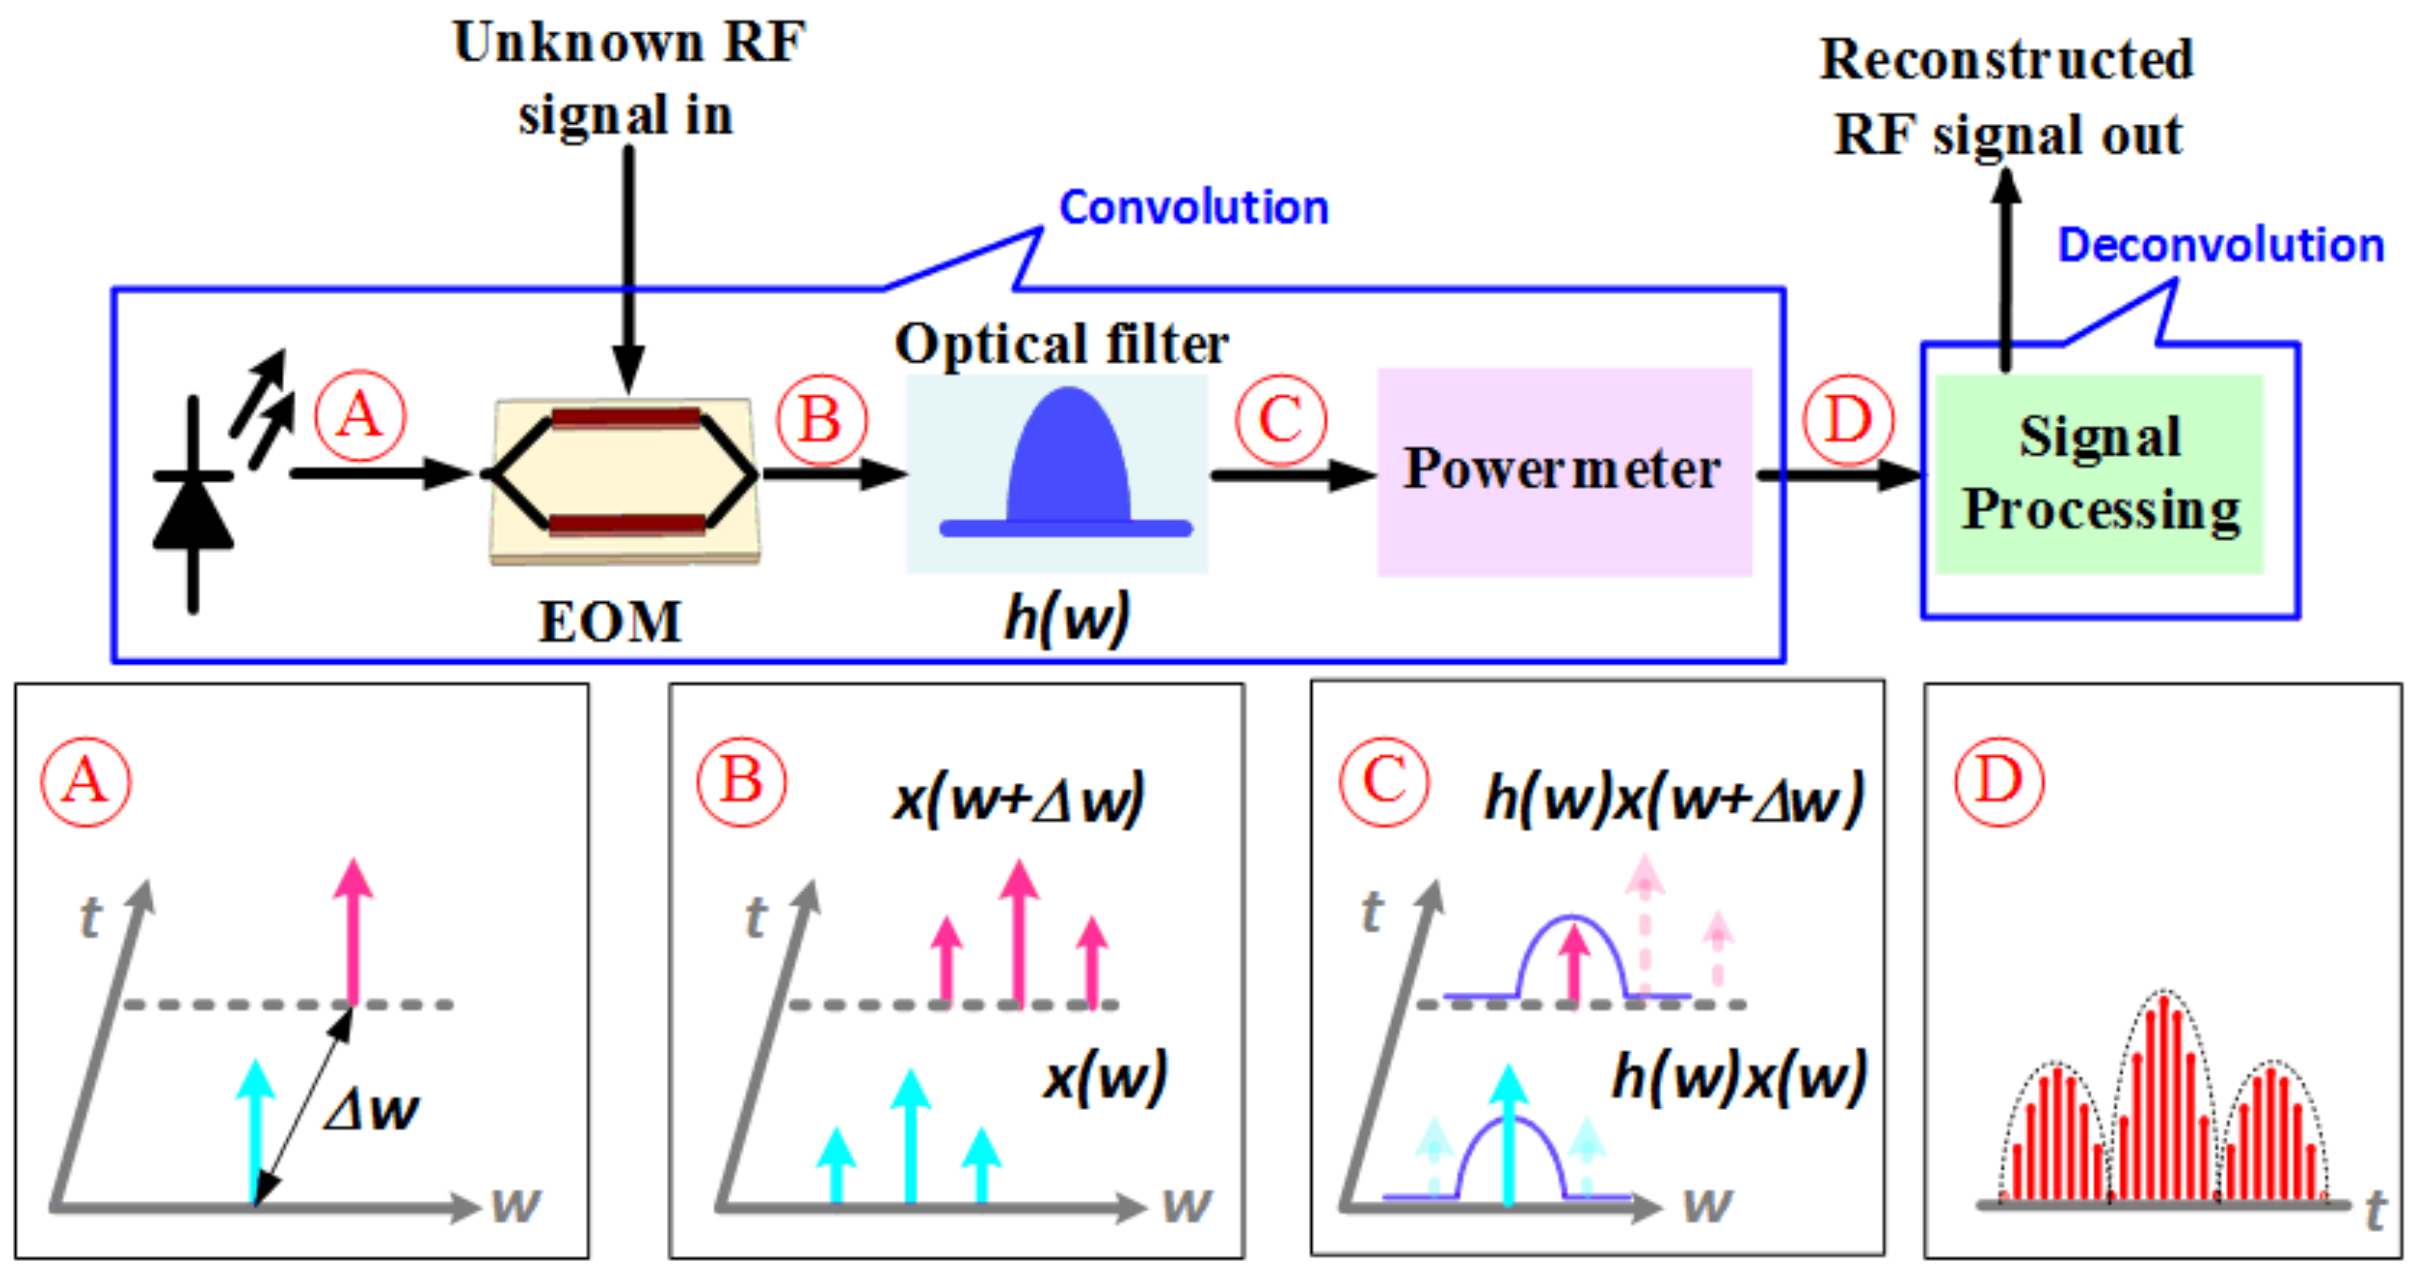
The operation of the scanning system can be divided into four steps, as illustrated in Figure 1. First, a fast-swept tunable laser produces an optical carrier (point A, inset (A) in Figure 1). Second, an EOM modulates the unknown input RF signal onto the carrier frequency, hence generating the upper and lower sidebands, with each sideband containing an entire copy of the microwave spectral information (point B, inset (B) in Figure 1). When the carrier frequency changes with a constant sweeping step Δw, the modulated signal is successively shifted across the filter response in the frequency domain, which can be represented by x(w + nΔw), where n denotes the number of steps, n=1,2,…,N. Third, an optical filter with spectral response h(w) acts as an optical spectral weight that multiplies the frequency spectrum of the modulated signal at each frequency with the spectral weight at that frequency (point C, inset (C) in Figure 1), which results in a weighted signal h(w)x(w + nΔw). Fourth, an optical power meter is employed to sum the power of the weighted signal across the entire frequency range, which is the integration operation (point D, inset (D) in Figure 1).
The power meter readout after n sweeping steps, y[n], can be expressed mathematically as
where w is the angular frequency, h(w) is the spectral response of the optical filter, and * depicts the cross-correlation operator. It can be noted that the operation of cross-correlation can be represented as convolution simply by pre-flipping the spectrum of the modulated signal x(w). Given the typical case of a double sideband optical modulation where the sidebands are symmetrical, the operation of the scanning system can thus be directly described by the convolutional model [25].
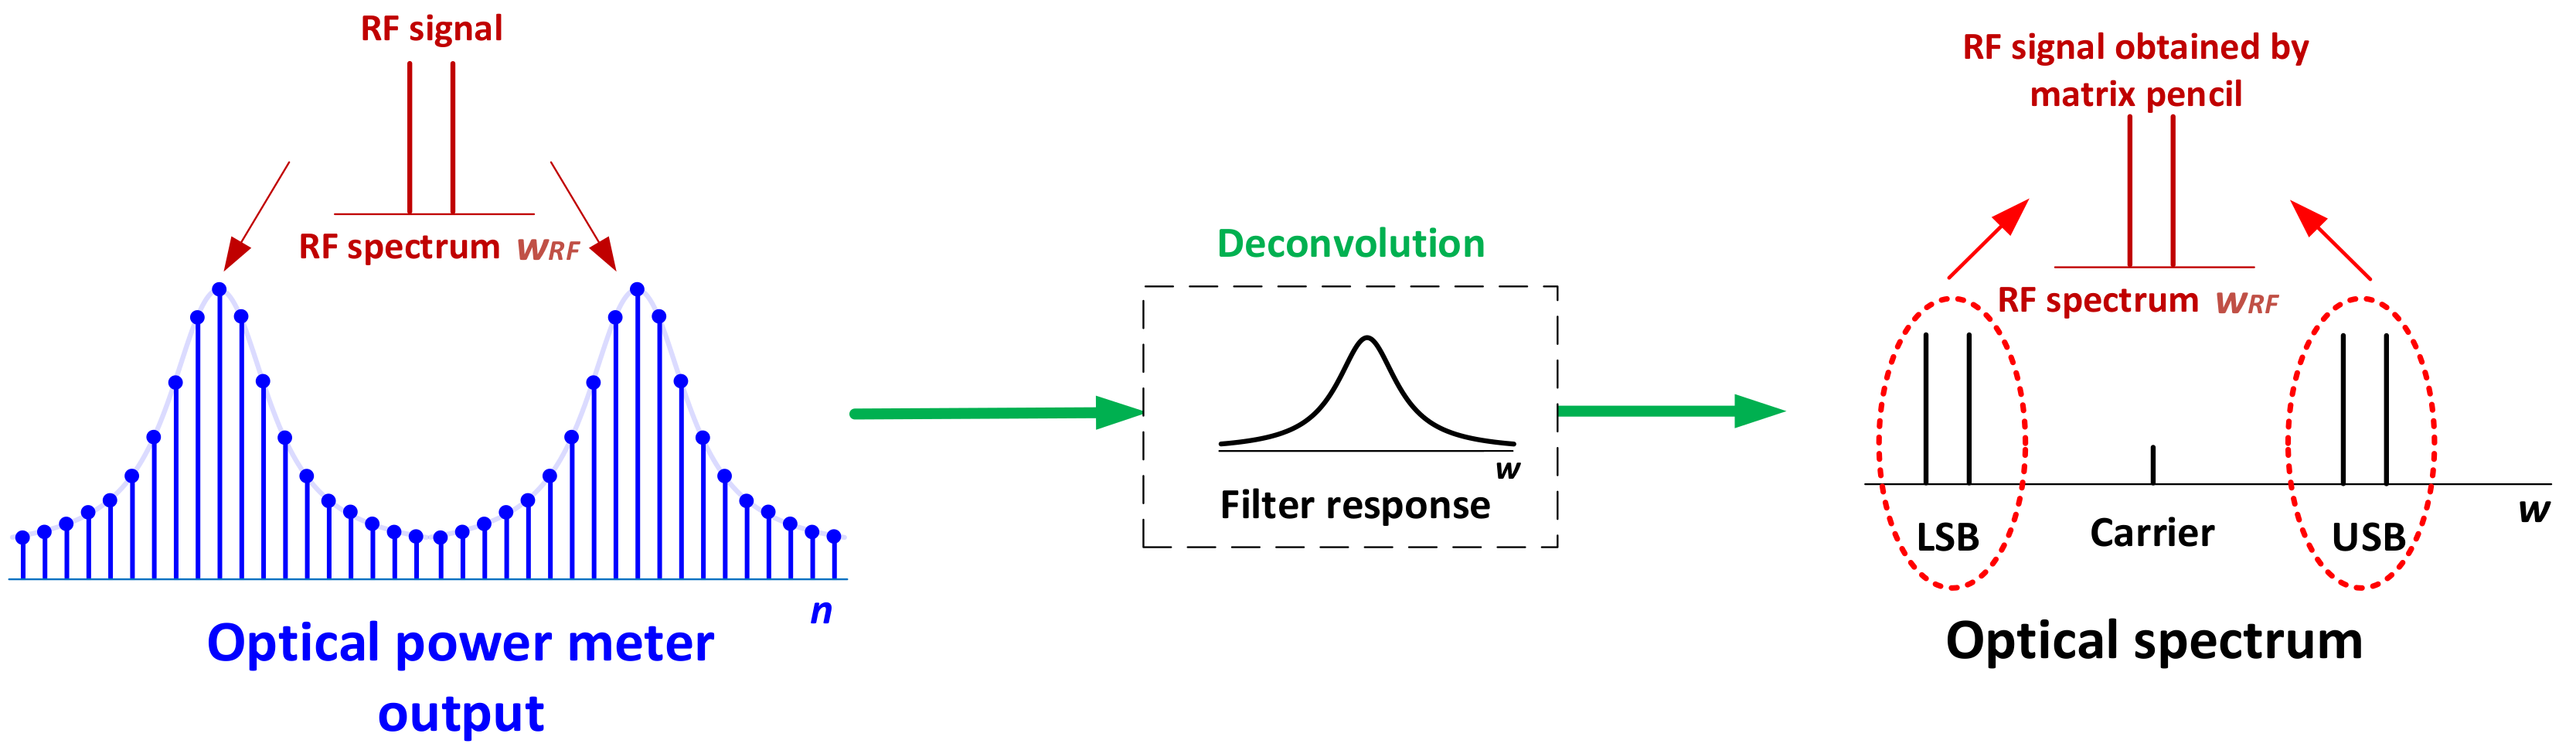
Figure 2 illustrates the advantage of our proposed scanning system—based on deconvolution—over the conventional threshold detection method [16] by using a two-tone RF signal as an example. As shown in Equation (1), the detected optical power in the scanning receiver forms a convolutional result, as the intensity over time represents the intensity sum of shifted pulses of the filter shape where the location of each pulse is determined by the frequency of optical components. Therefore, if two RF tones are too closely spaced, the two shifted pulses would merge into one, therefore making it impossible or extremely difficult to resolve the location of each individual pulses via the conventional detection method. In contrast, the deconvolution theorem we propose eliminates the detrimental effect of filter shape on the power meter reading by using an effective matrix pencil method to reconstruct the original spectrum of an input RF signal, hence breaking the measurement limit inherent in conventional methods.
Due to the sampling nature of scanning receivers, Equation (1) can be rewritten in a discrete model where the spectrum of the modulated signal and filter response can be represented by their sampled values at a constant frequency interval Δw as x[n] and h[n], respectively. Then, a discrete Fourier transform can be adopted to convert the operation of convolution to multiplication. The Fourier transform representation of x[n], x[k], is given by
where Y[k] and H[k] are the discrete Fourier transforms of y[n] and h[n], respectively.
To reconstruct X[k], deconvolution based on matrix pencil method is used, and X[k] is modelled as a sum of exponential sinusoids in the presence of noise, which has the following form
where nk is the noise and M is the number of sinusoids. For double sideband modulation where the input microwave signal has P tones, M is equal to 2P + 1. wt and |bt| are the frequencies and amplitudes of the sinusoids, respectively. Specifically, to solve wt and |bt|, which correspond to the frequency and amplitudes of the modulated signal, the Hankel matrices based on Y[k] are first constructed as
where L is called the pencil parameter. Then the singular value decomposition (SVD) of the matrix is carried out as
where [Uz] and [Vz] are unitary matrices and [Σz] is the diagonal matrix for [Ωz] (z=0,1), respectively. H denotes a complex conjugate. Eventually, by solving the generalized eigenvalues of [Ω0] − λ[Ω1], the amplitude (|bt|) and the frequency (wt) of the frequency components for the modulated optical signal (x[n]) can be obtained. It can be noted that with the recent advent of analog-to-digital converters developed in complementary metal–oxide–semiconductor platforms that are available up to 65 Gsamples/s [26], such digital signal processing can be performed at extremely high speeds.
3. Experimental Results
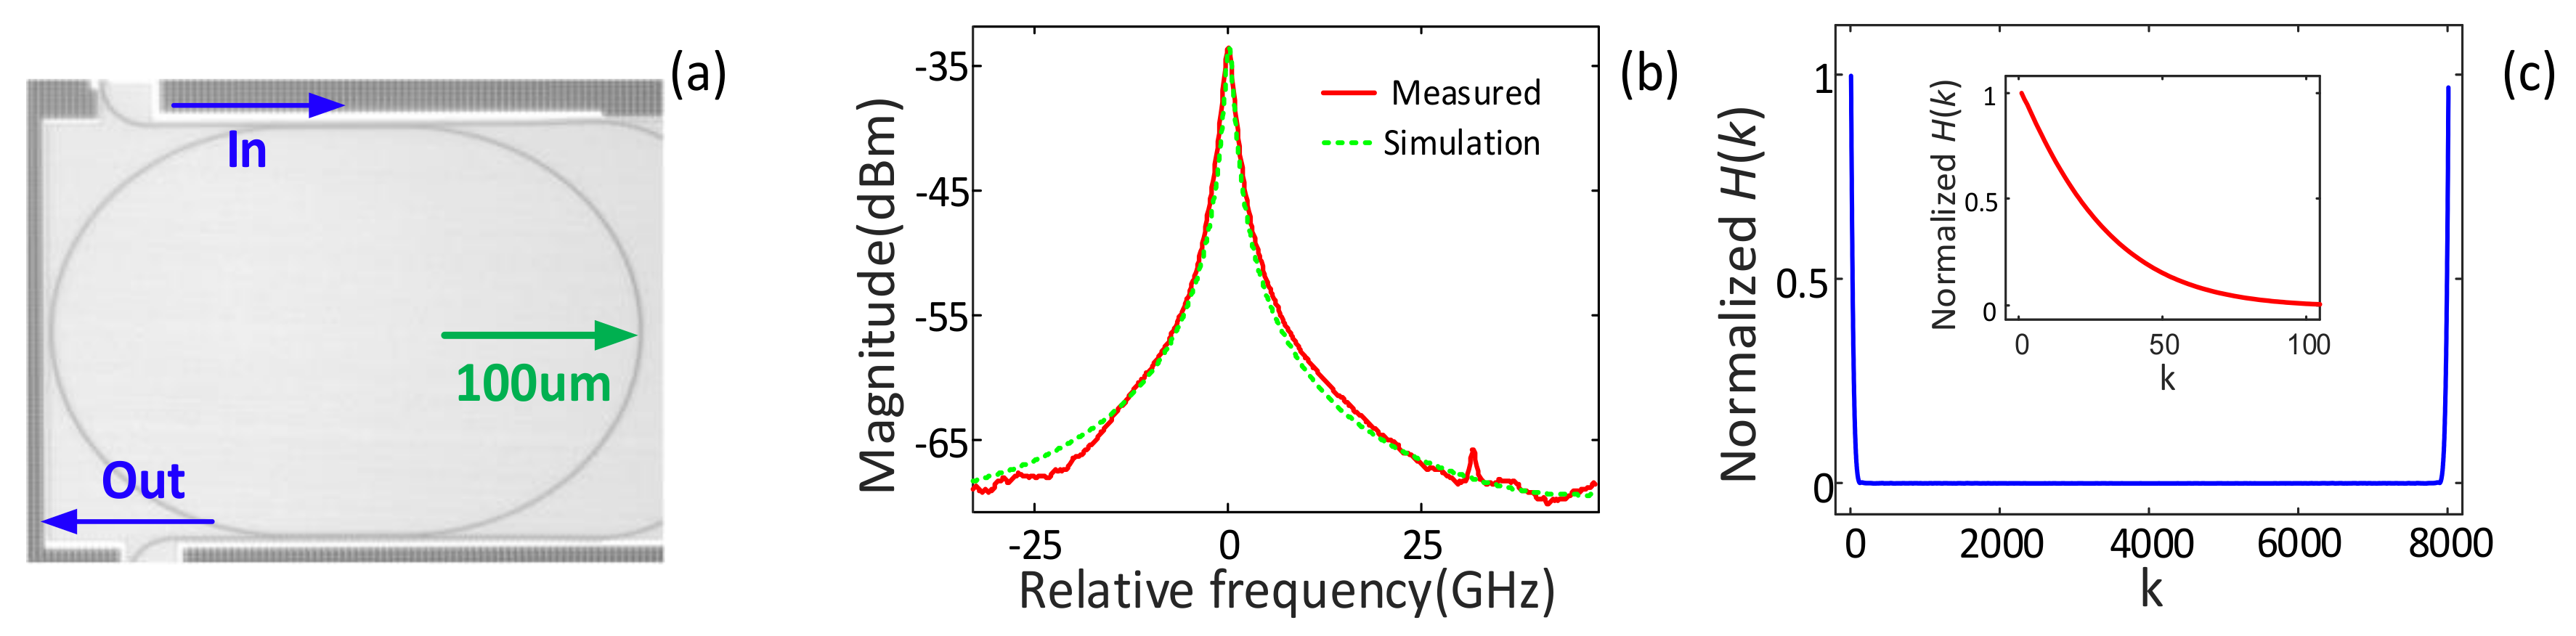
As a proof of concept, an experiment was conducted based on the setup depicted in Figure 1. The filter, which consists of two straight bus waveguides and a racetrack waveguide, was fabricated on a silicon-on-insulator (SOI) wafer via ePIXfab. The scanning electron microscope (SEM) image of this filter is shown in Figure 3a. The silicon core waveguides have a fixed height and width of 220 nm and 450 nm, respectively, and the coupling gap spacing between the bus waveguide and the racetrack ring resonator is designed to be about 620 nm to obtain a bus-to-ring cross power coupling coefficient of 0.0125. Additionally, the length of the straight sections and the bend radius of the curved sections of the racetrack ring resonator are designed to be 50 µm and 100 µm, respectively. The discrete spectral response of the optical filter, h(n), was measured by sweeping the optical carrier of the laser and measuring the power at filter output. The optical carrier was generated by a laser (Keysight 81960A, Santa Rosa, CA, USA) and was swept from 1546.6 nm to 1547.4 nm with a constant step of 0.1 pm, thus generating 8000 effective points recorded by an optical power meter (Keysight N7744A, Santa Rosa, CA, USA). Figure 3b shows the measured output power, where the horizontal axis represents the relative frequency counted from the step number of the tunable laser. For comparison, the simulated response of the filter is also plotted. The measured output shows a Lorentzian-shape with a 3-dB bandwidth of about 1.325 GHz, which agrees well with the simulated filter response. The corresponding quality factor, which is defined as the ratio of the resonance frequency to filter bandwidth, is around 1.5 × 10⁵. The discrete Fourier transform of the measured filter output H[k] was also computed and is displayed in Figure 3c. It should be mentioned that half of the transform H[k] is a mirror image caused by the Hermitian symmetry property, since h(n) is a real-valued sequence. Upon neglecting the mirror image symmetry, H[k] showed a low-pass effect with limited bandwidth, as illustrated in the inset of Figure 3c. To minimize the impact of noise on filter response, only the first 85 Fourier coefficients of H[k] are considered in the convolution theorem [27]. This facilitates a reconstruction with up to 85 / 2 ≈ 44 spectral lines including optical carrier and 1st-order sidebands induced by RF tones [28].
First, a single-tone RF signal generated by a vector network analyzer (Keysight N5230A, Santa Rosa, CA, USA) was applied to a low-biased EOM (Sumitomo T.DEH1.5-40, Osaka, Japan) to evaluate the system performance. Figure 4a shows the measured power output of the scanning receiver y[n] (n=1,2….8000) at an input RF frequency of 20 GHz. As expected, three peaks with the shape of filter response were observed, which was a result of the convolution product of the filter, the optical carrier, and two 1st-order sidebands. Figure 4b plots the reconstructed optical spectrum of the modulated signal based on the matrix pencil method where the number of sinusoids M was set to 3 and the pencil parameter was set to 32, which were found to be the optimum values within the range recommended in Reference [29] to reduce the noise sensitivity of the matrix pencil method. Thanks to the linear mapping between frequency and time, the frequency of the input RF signal is proportional to the sweeping step difference between the upper sideband (USB) and lower sideband (LSB). In this experiment, the sweeping step of the laser was 0.1 pm and the step difference between the two sidebands was 3187, thus representing an estimated RF frequency of 19.9188 GHz and a measurement error of 81.2 MHz.
Moreover, the proposed signal reconstruction based on deconvolution also provides amplitude information of the microwave signal. The input RF power derived from the optical sideband to carrier ratio (OSCR), which is defined as the power ratio between the 1st-order sidebands and the optical carrier, shows a good agreement with the theoretical OSCR value calculated based on the applied DC bias and switching voltages of the modulator employed. Next, we adjusted the input RF power to −5 dBm to further demonstrate this technology. Figure 4c,d show the measured power output of the scanning receiver and the reconstructed optical spectrum of the modulated signal, respectively. When the input RF power was reduced from 0 dBm to −5 dBm, the corresponding OSCR obtained from the reconstructed LSB (USB) spectrum was decreased from 2.7048 to 0.8702 (2.6695 to 0.8585), which indicates a power drop of 4.925 dB (4.927 dB) and agrees well with the theoretical value.
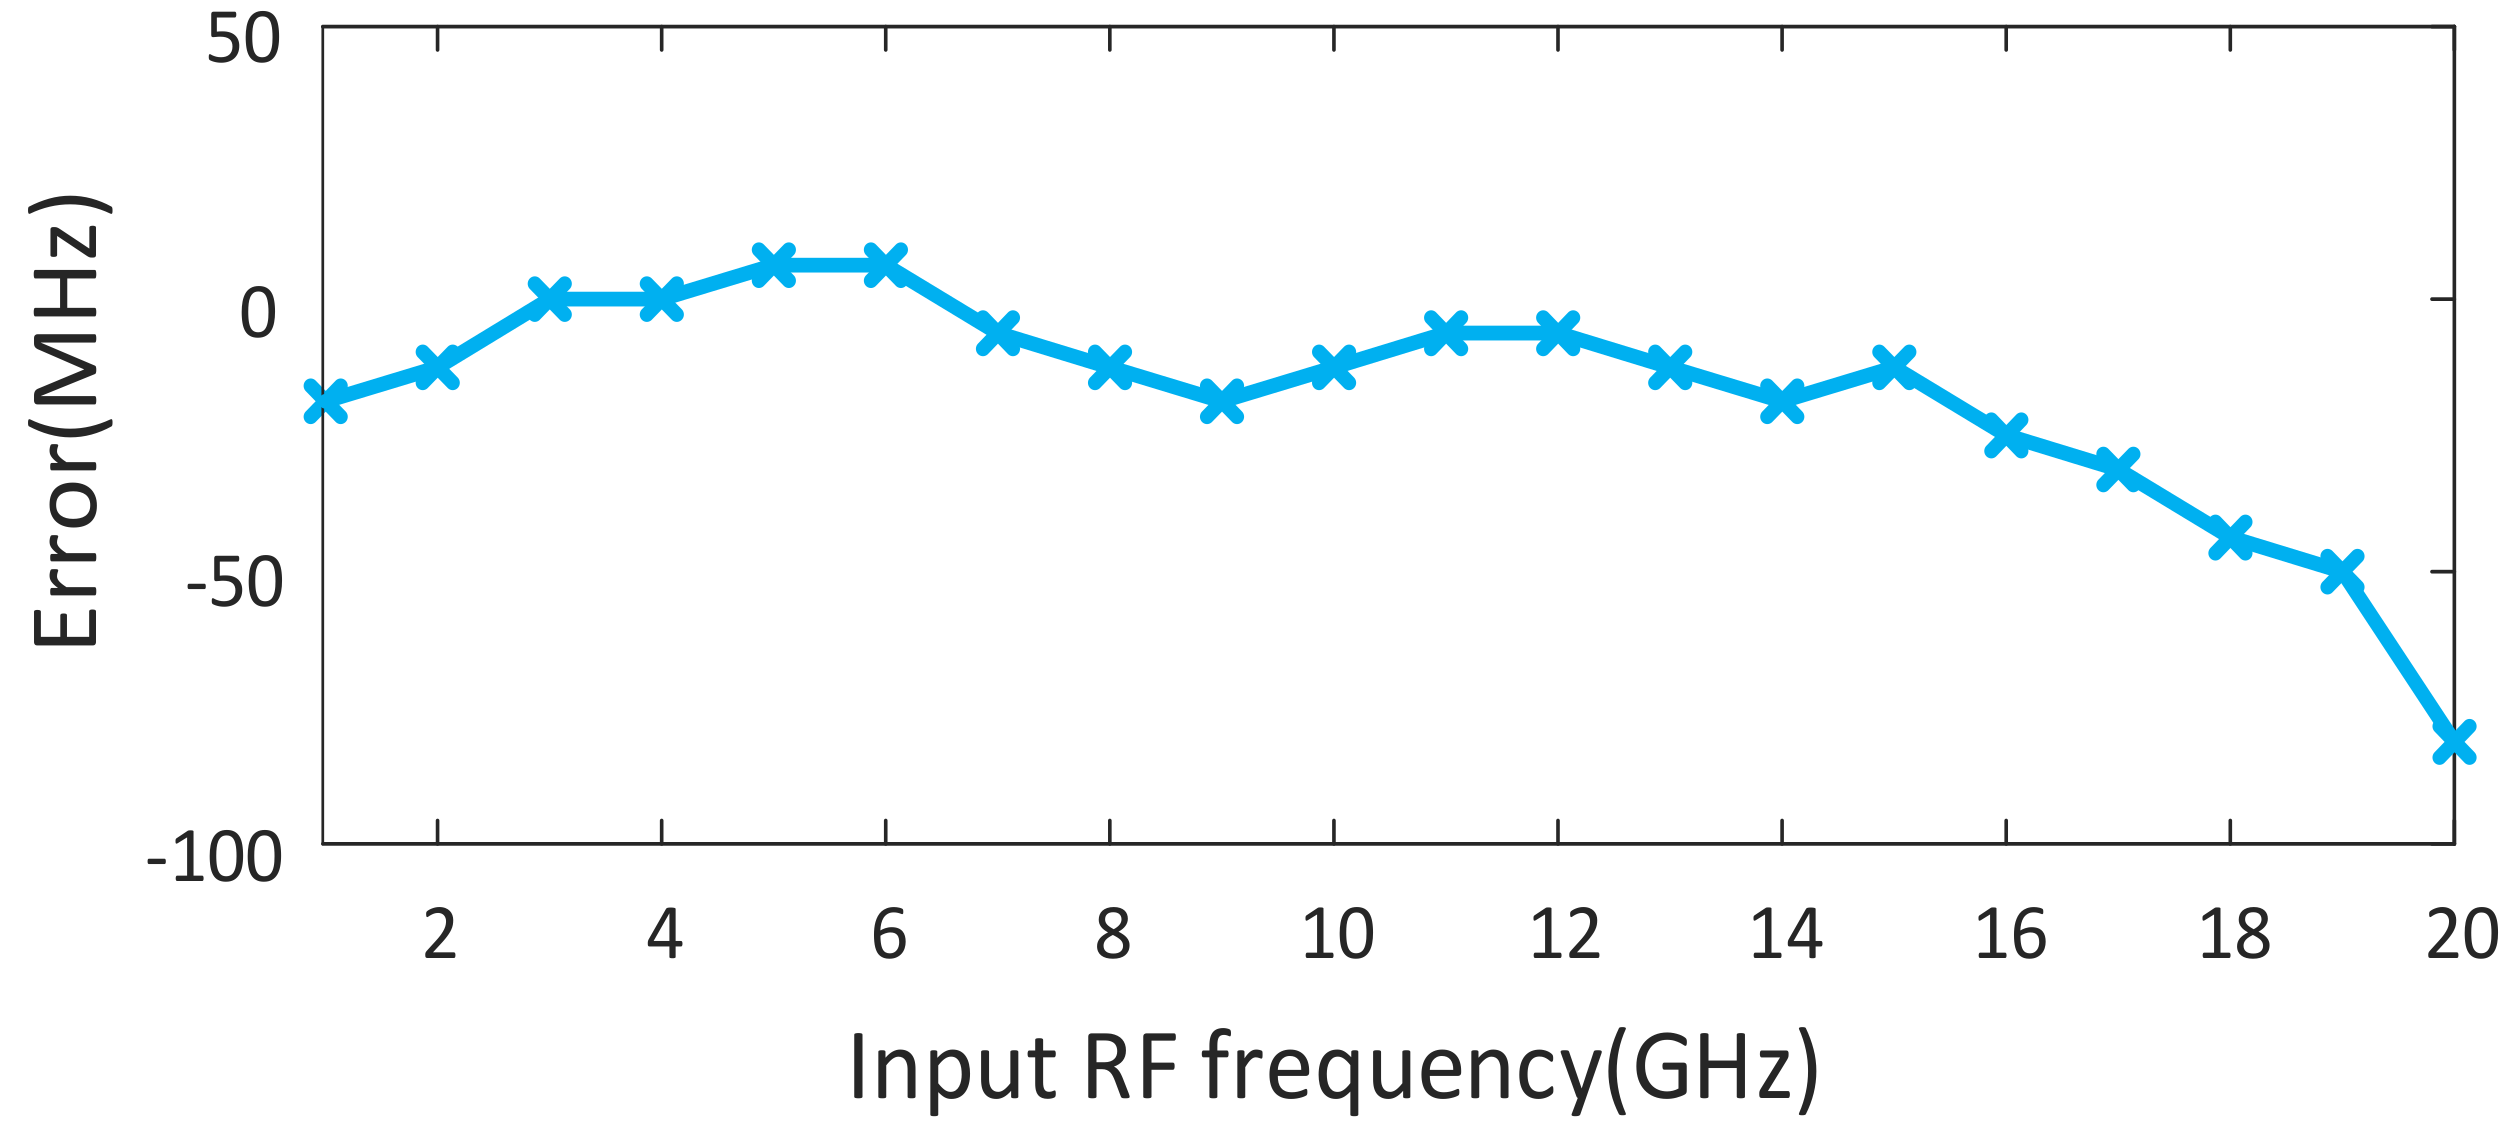
Figure 5 shows the measurement error based on the deconvolution method when the RF frequency is varied from 1 GHz to 20 GHz with a step of 1 GHz, during which the upper frequency was limited by the RF signal generator used in the experiment. The power of the input RF signal was fixed at 0 dBm. It can be seen that the proposed method is capable of characterizing a wide range of RF frequencies with an average measurement error of about 19.06 MHz across the whole measurement range.
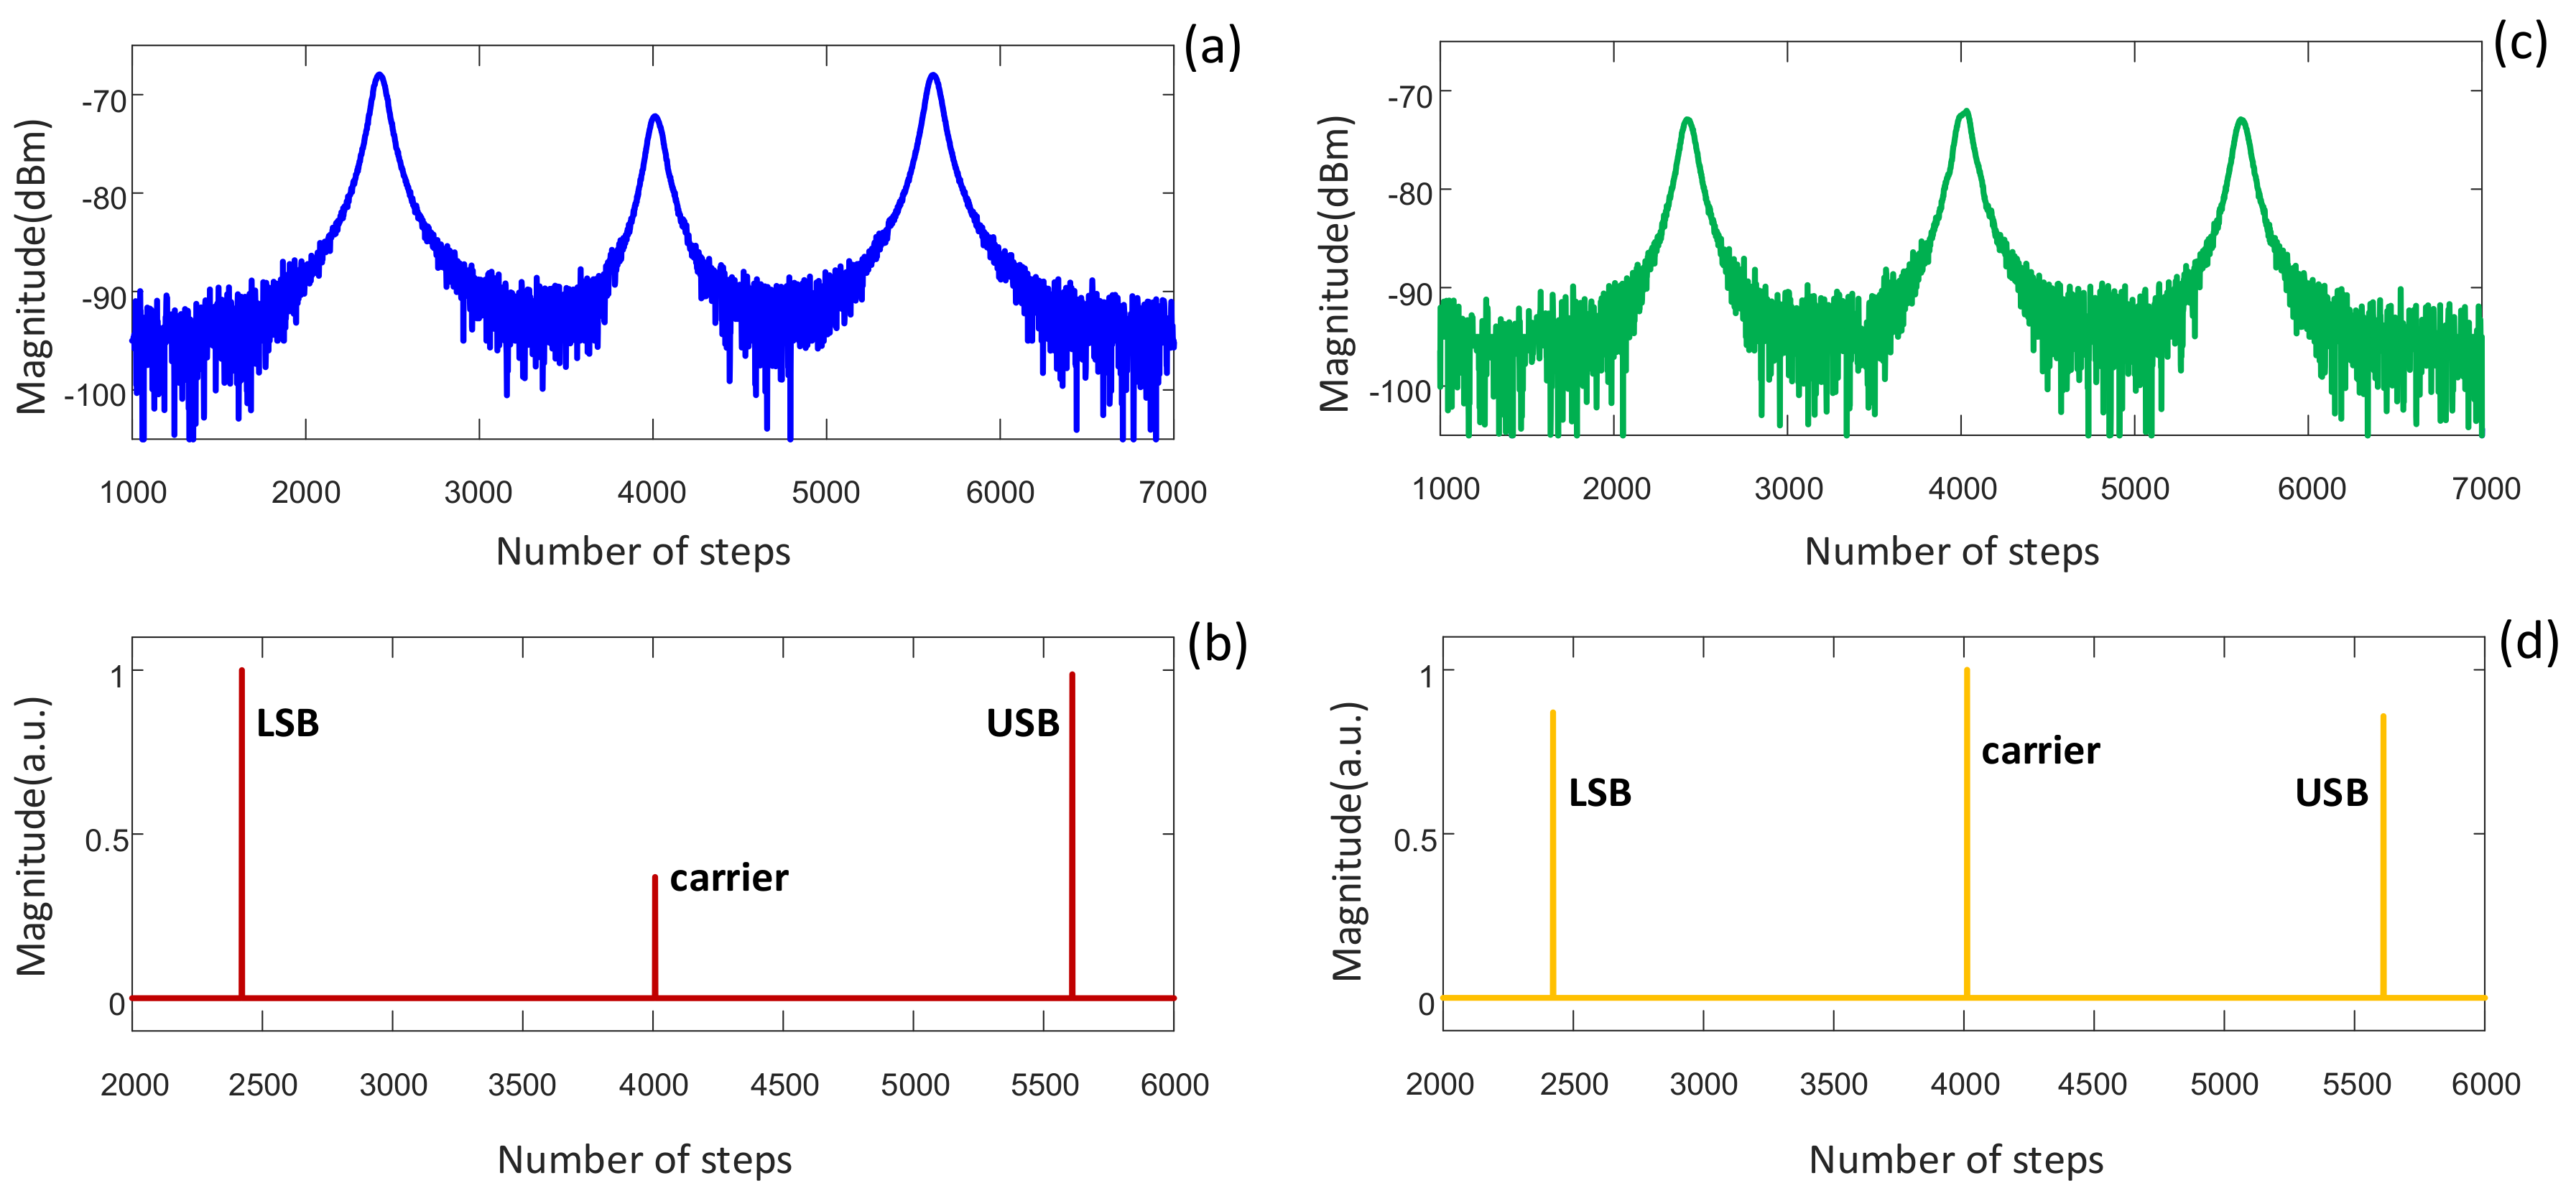
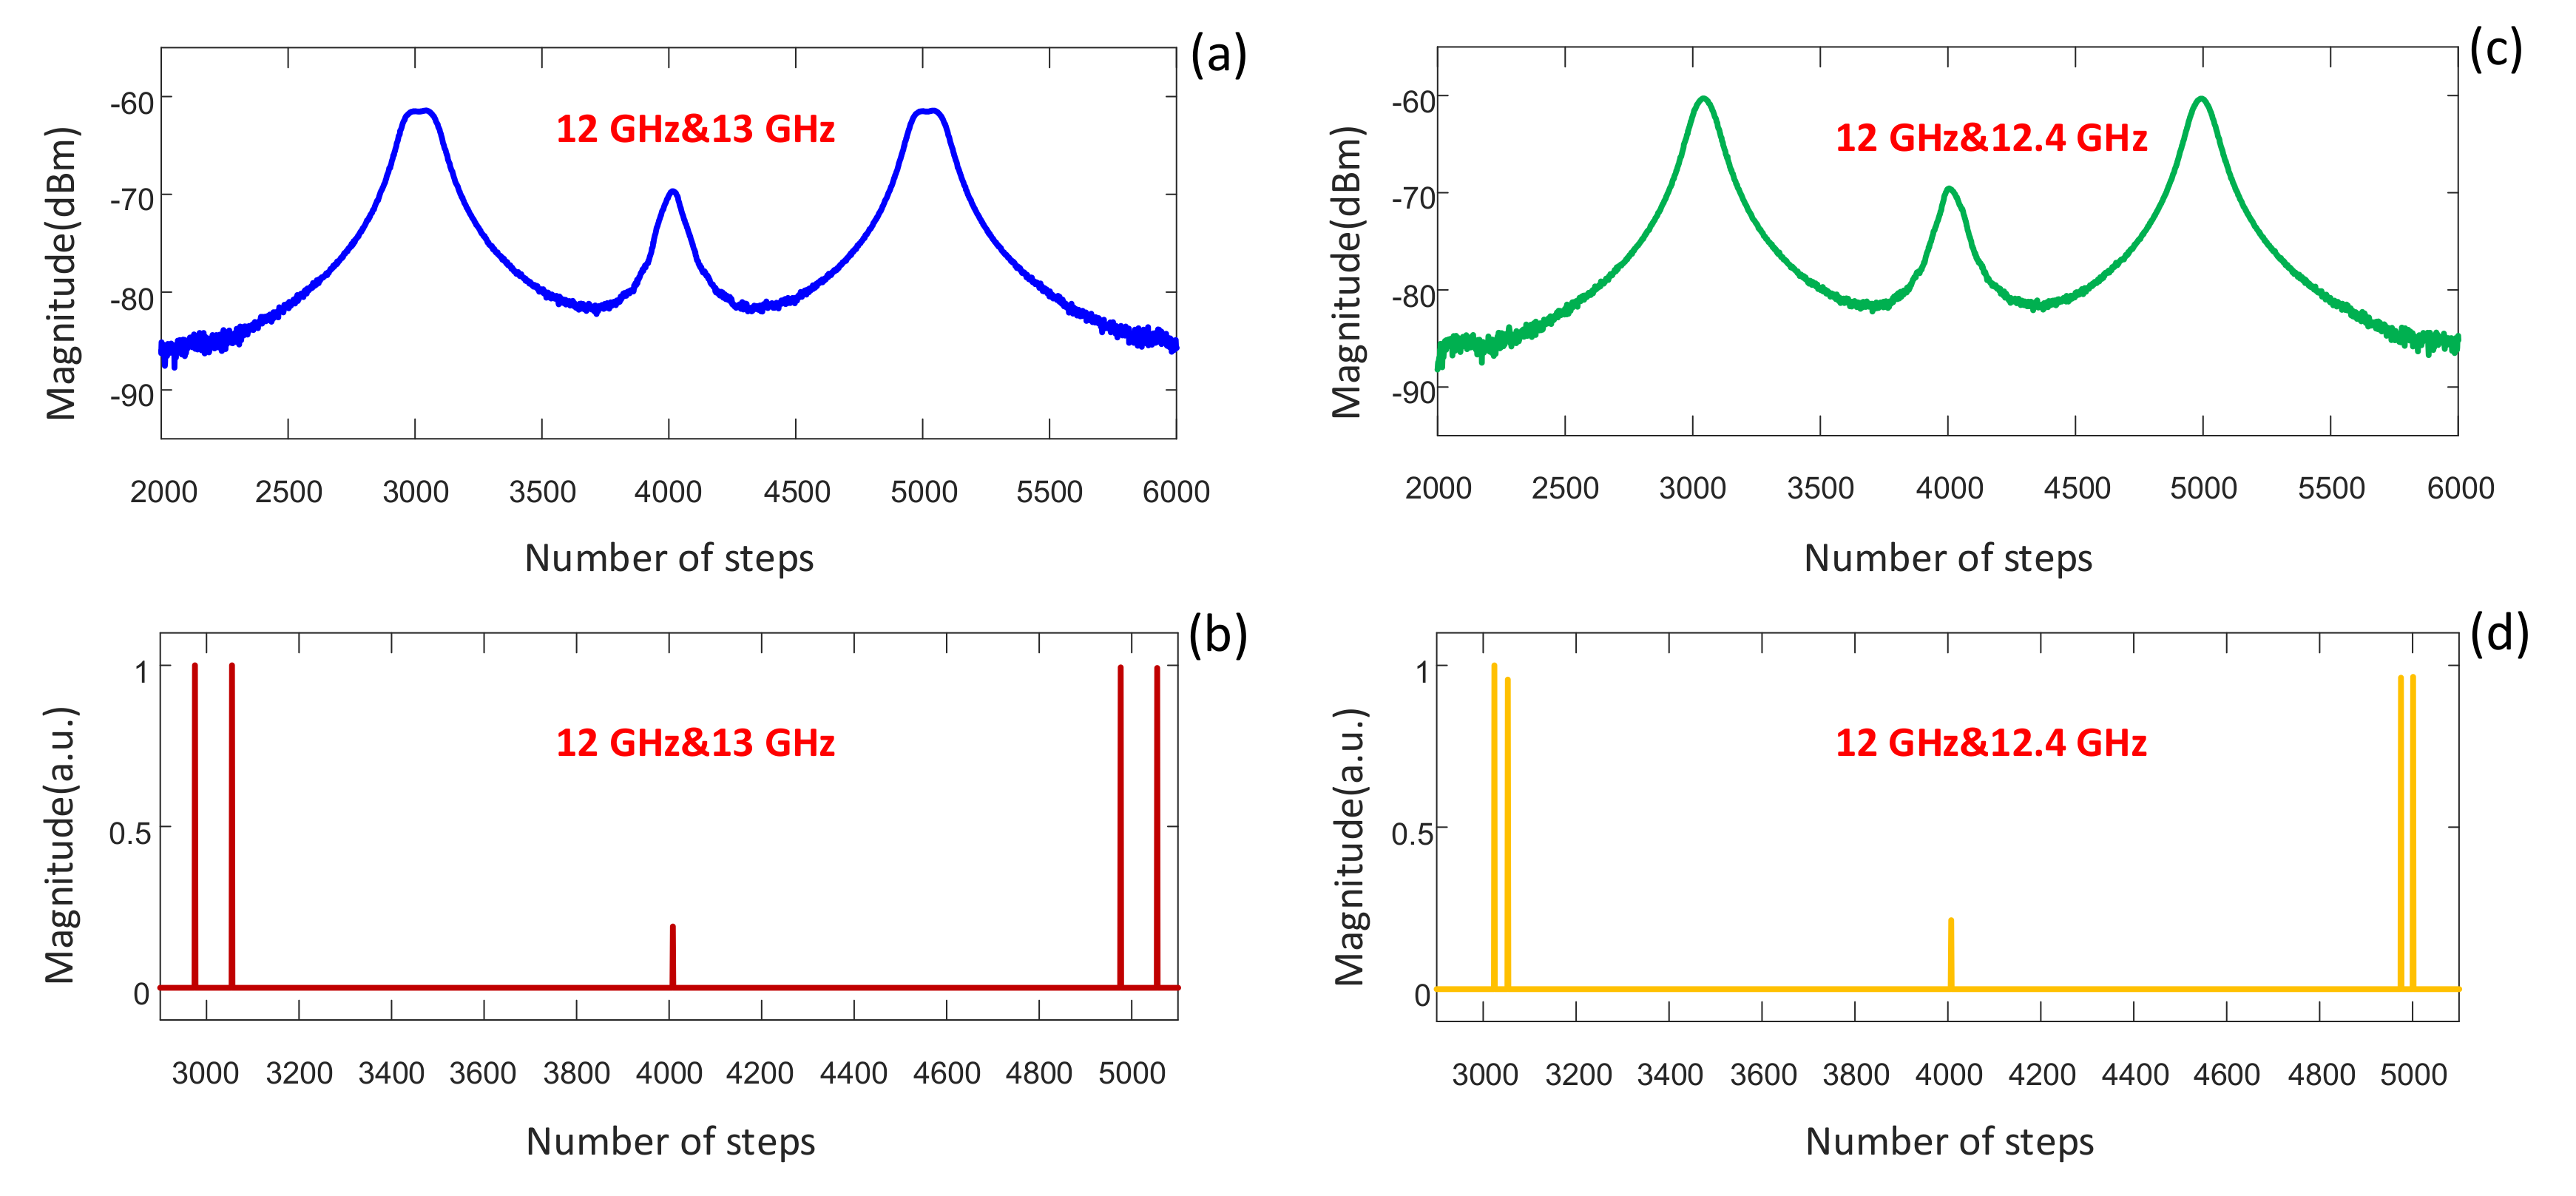
To investigate the resolution of the proposed technique for multiple-tone microwave frequency measurements, a two-tone RF signal was injected to the EOM. Figure 6a,c show the measured outputs of the scanning receiver with the RF signal having two tones with an equal RF power of 0 dBm at 12 GHz and 13 GHz and 12 GHz and 12.4 GHz, respectively. When the two-tone RF signal was spaced 1 GHz apart, Figure 6a shows that the filter shape pulses generated by the 12 GHz and 13 GHz RF frequency components had almost merged, and what should have been two obvious peaks were now barely distinguishable. The measurement resolution without applying the deconvolution technique is thus said to be limited to 1 GHz. Further reducing the spacing between the two-tone RF signals to 0.4 GHz showed complete overlap of the filter peaks as shown in Figure 6c. In contrast, Figure 6b,d illustrate the reconstructed RF spectrum by using the matrix pencil assisted deconvolution method to resolve the RF signals. A clear resolution of the two frequency components corresponding to the two tones in the original microwave signal with almost identical intensity in each sideband was achieved. For a microwave signal with input tones at 12 GHz and 13 GHz, the step differences for the two RF tones were, according to the reconstructed spectrum, 1921 and 2080, which represent measurement errors of 6.25 MHz and 0 MHz, respectively. When the frequency separation was further reduced to 0.6 GHz (input tones at 12 GHz and 12.4 GHz), the step difference for the two reconstructed RF tones was 1922 and 1977, which translate to small measurement errors of only 12.5 MHz and 43.7 MHz for the two tones, respectively. More importantly, the reconstruction result demonstrates the significance of using the proposed deconvolution method to achieve a much higher resolution of 0.4 GHz, which is only around 30% of the filter bandwidth. This resolution could be further improved by increasing the signal-to-noise ratio of the scanning system, which is primarily attributed to the high fiber-to-chip coupling loss of the employed filter. A total insertion loss of 34 dB for the optical filter was experimentally measured. There was mainly two factors contributing to the loss. One was the fiber-to-chip loss of around 29 dB, which arose from the pair of vertical grating couplers. This can be improved via optimizing the coupling design between SOI waveguides and optical fibers, where a coupling loss of less than 1 dB has been demonstrated in integrated filters [30]. This can be adopted to vastly reduce the insertion loss of the filter and thus achieve a better signal-to-noise ratio of the system. The other factor was the waveguide propagation loss as the light propagates along the micro-ring resonator, which is around 2.5 dB/cm. Significant reduction of the propagation loss can be realized via adopting a monolithic waveguide of wedge geometry, high-aspect-ratio Si3N4 waveguides, and waveguide based on high-quality silicon oxynitride films [31,32,33,34]. In [31], an optical delay line fabricated on a silicon chip was presented, and it exhibited an average measured waveguide loss of 0.08 ± 0.01 dB/m in long spirals. It is expected that with the optimization of the optical waveguide and integrated fiber-to-chip couplers, it will be possible to boost the detected signal intensity, thus achieving an improved signal-to-noise ratio. Apart from the effect of the signal-to-noise ratio, it is noted that the measurement resolution is also dependent on the spectral line shape of the optical filter adopted in the scanning system. Given the same bandwidth, optical filters with a Lorentzian profile—such as fiber Bragg gratings—and ring resonators are preferred, as they exhibit superior recovery accuracy than the ones with a Gaussian profile [35]. Additionally, advanced super-resolution methods such as atomic norm minimization [28] can be adopted to further improve the performance of the scanning system.
4. Conclusions
In conclusion, we have proposed and demonstrated a novel approach to improve the measurement resolution of photonic-assisted scanning receiver systems in which the spectrum of input microwave signals is recovered using a matrix pencil based deconvolution method. As a proof of concept, signal reconstruction of both amplitude and frequency information has been demonstrated. A two-tone microwave signal measurement with a resolution reduced from 1 GHz to 0.4 GHz has also been experimentally demonstrated in a scanning receiver where an optical filter with a bandwidth as wide as 1.325 GHz has been employed. The presented deconvolution theorem offers an effective and widely applicable solution for improving the resolution and accuracy performance of various scanning receiver systems and is highly promising for meeting the increasingly stringent requirements in applications such as radar and electronic warfare.
Author Contributions
Conceptualization—S.S. and X.Y.; data curation—S.S. and W.Y.; methodology—S.S. and L.G.; supervision—X.Y. and L.N.; writing—review and editing—S.X.C., L.L. and R.M.
Funding
This research was supported by the Australian Department of Defence.
Acknowledgments
The authors would like to extend their thanks to Keith Powell from the University of Sydney for his valuable contributions to this work.
Conflicts of Interest
The authors declare no conflict of interest.
References
- Zou, X.; Lu, B.; Pan, W.; Yan, L.; Stöhr, A.; Yao, J. Photonics for microwave measurements. Laser Photonics Rev. 2016, 10, 711–734. [Google Scholar] [CrossRef] [Green Version]
- Xie, X.; Dai, Y.; Xu, K.; Niu, J.; Wang, R.; Yan, L.; Lin, J. Broadband photonic RF channelization based on coherent optical frequency combs and I/Q demodulators. IEEE Photonics J. 2012, 4, 1196–1202. [Google Scholar]
- Wiberg, A.O.; Esman, D.J.; Liu, L.; Adleman, J.R.; Zlatanovic, S.; Ataie, V.; Myslivets, E.; Kuo, B.P.; Alic, N.; Jacobs, E.W.; et al. Coherent filterless wideband microwave/millimeter-wave channelizer based on broadband parametric mixers. J. Lightw. Technol. 2014, 32, 3609–3617. [Google Scholar] [CrossRef]
- Berger, P.; Attal, Y.; Schwarz, M.; Molin, S.; Louchet-Chauvet, A.; Chanelière, T.; Le Gouët, J.L.; Dolfi, D.; Morvan, L. RF spectrum analyzer for pulsed signals: Ultra-wide instantaneous bandwidth, high sensitivity, and high time-resolution. J. Lightw. Technol. 2016, 34, 4658–4663. [Google Scholar] [CrossRef]
- Wang, C.; Yao, J. Ultrahigh-resolution photonic-assisted microwave frequency identification based on temporal channelization. IEEE Trans. Microw. Theory Tech. 2013, 61, 4275–4282. [Google Scholar] [CrossRef]
- Lu, B.; Pan, W.; Zou, X.; Luo, B.; Yan, L.; Liu, X.; Xiang, S. Photonic frequency measurement and signal separation for pulsed/CW microwave signals. IEEE Photonics Technol. Lett. 2013, 25, 500–503. [Google Scholar] [CrossRef]
- Marpaung, D. On-chip photonic-assisted instantaneous microwave frequency measurement system. IEEE Photonics Technol. Lett. 2013, 25, 837–840. [Google Scholar] [CrossRef]
- Fandiño, J.S.; Muñoz, P. Photonics-based microwave frequency measurement using a double-sideband suppressed-carrier modulation and an InP integrated ring-assisted Mach–Zehnder interferometer filter. Opt. Lett. 2013, 38, 4316–4319. [Google Scholar] [CrossRef]
- Burla, M.; Wang, X.; Li, M.; Chrostowski, L.; Azaña, J. Wideband dynamic microwave frequency identification system using a low-power ultracompact silicon photonic chip. Nat. Commun. 2016, 7, 13004. [Google Scholar] [CrossRef] [Green Version]
- Liu, L.; Qiu, H.; Chen, Z.; Yu, Z. Photonic Measurement of Microwave Frequency with Low-Error based on an Optomechanical Microring Resonator. IEEE Photonics J. 2017, 9, 1–11. [Google Scholar] [CrossRef]
- Zou, X.; Chi, H.; Yao, J. Microwave frequency measurement based on optical power monitoring using a complementary optical filter pair. IEEE Trans. Microw. Theory Tech. 2009, 57, 505–511. [Google Scholar]
- Zhou, F.; Chen, H.; Wang, X.; Zhou, L.; Dong, J.; Zhang, X. Photonic Multiple Microwave Frequency Measurement Based on Frequency-to-Time Mapping. IEEE Photonics J. 2018, 10, 1–7. [Google Scholar] [CrossRef]
- Zheng, S.; Ge, S.; Zhang, X.; Chi, H.; Jin, X. High-resolution multiple microwave frequency measurement based on stimulated Brillouin scattering. IEEE Photonics Technol. Lett. 2012, 24, 1115–1117. [Google Scholar] [CrossRef]
- Preussler, S.; Schneider, T. Stimulated Brillouin scattering gain bandwidth reduction and applications in microwave photonics and optical signal processing. Opt. Eng. 2016, 55, 031110. [Google Scholar] [CrossRef]
- Li, R.; Chen, H.; Yu, Y.; Chen, M.; Yang, S.; Xie, S. Multiple-frequency measurement based on serial photonic channelization using optical wavelength scanning. Opt. Lett. 2013, 38, 4781–4784. [Google Scholar] [CrossRef] [PubMed]
- Nguyen, T.A.; Chan, E.H.; Minasian, R.A. Photonic multiple frequency measurement using a frequency shifting recirculating delay line structure. J. Lightw. Technol. 2014, 32, 3831–3838. [Google Scholar] [CrossRef]
- Guo, H.; Xiao, G.; Mrad, N.; Yao, J. Measurement of microwave frequency using a monolithically integrated scannable echelle diffractive grating. IEEE Photonics Technol. Lett. 2009, 21, 45–47. [Google Scholar]
- Winnall, S.; Lindsay, A. A Fabry-Perot scanning receiver for microwave signal processing. IEEE Trans. Microw. Theory Tech. 1999, 47, 1385–1390. [Google Scholar] [CrossRef]
- Rugeland, P.; Yu, Z.; Sterner, C.; Tarasenko, O.; Tengstrand, G.; Margulis, W. Photonic scanning receiver using an electrically tuned fiber Bragg grating. Opt. Lett. 2009, 34, 3794–3796. [Google Scholar] [CrossRef]
- Ye, C.; Fu, H.; Zhu, K.; He, S. All-optical approach to microwave frequency measurement with large spectral range and high accuracy. IEEE Photonics Technol. Lett. 2012, 24, 614–616. [Google Scholar] [CrossRef]
- Li, N. C-band swept wavelength erbium-doped fiber laser with a high-Q tunable interior-ridge silicon microring cavity. Opt. Express 2016, 24, 22741–22748. [Google Scholar] [CrossRef] [PubMed]
- Yan, L.; Liu, H.; Zhong, S.; Fang, H. Semi-blind spectral deconvolution with adaptive Tikhonov regularization. Appl. Spectrosc. 2012, 66, 1334–1346. [Google Scholar] [CrossRef] [PubMed]
- Chung, J.; Kim, J.; Ou, X.; Horstmeyer, R.; Yang, C. Wide field-of-view fluorescence image deconvolution with aberration-estimation from Fourier ptychography. Biomed. Opt. Express 2016, 7, 352–368. [Google Scholar] [CrossRef] [PubMed] [Green Version]
- Sheshyekani, K.; Fallahi, G.; Hamzeh, M.; Kheradmandi, M. A general noise-resilient technique based on the matrix pencil method for the assessment of harmonics and interharmonics in power systems. IEEE Trans. Power Deliv. 2017, 32, 2179–2188. [Google Scholar] [CrossRef]
- Yarlagadda, R. Analog and Digital Signals and Systems; Springer: Berlin/Heidelberg, Germany, 2010. [Google Scholar]
- Rezania, A.; Cartledge, J.C. Transmission performance of 448 Gb/s single-carrier and 1.2 Tb/s three-carrier superchannel using dual-polarization 16-QAM with fixed LUT based MAP detection. J. Lightw. Technol. 2015, 33, 4738–4745. [Google Scholar] [CrossRef]
- Campisi, P.; Egiazarian, K. Blind Image Deconvolution: Theory and Applications; CRC Press: Boca Raton, FL, USA, 2016. [Google Scholar]
- Candè, E.J.; Fernandez-Granda, C. Towards a Mathematical Theory of Super-resolution. Commun. Pure Appl. Math. 2014, 67, 906–956. [Google Scholar] [CrossRef]
- Hua, Y.; Sarkar, T.K. Matrix pencil method for estimating parameters of exponentially damped/undamped sinusoids in noise. IEEE Trans. Acoust. Speech Signal Process. 1990, 38, 814–824. [Google Scholar] [CrossRef]
- Bakir, B.B.; De Gyves, A.V.; Orobtchouk, R.; Lyan, P.; Porzier, C.; Roman, A.; Fedeli, J.M. Low-Loss (<1 dB) and Polarization-Insensitive Edge Fiber Couplers Fabricated on 200-mm Silicon-on-Insulator Wafers. IEEE Photonics Technol. Lett. 2010, 22, 739–741. [Google Scholar]
- Lee, H.; Chen, T.; Li, J.; Painter, O.; Vahala, K.J. Ultra-low-loss optical delay line on a silicon chip. Nat. Commun. 2012, 3, 867. [Google Scholar] [CrossRef] [Green Version]
- Bauters, J.F.; Heck, M.J.; John, D.; Dai, D.; Tien, M.C.; Barton, J.S.; Leinse, A.; Heideman, R.G.; Blumenthal, D.J.; Bowers, J.E. Ultra-low-loss high-aspect-ratio Si3N4 waveguides. Opt. Express 2011, 19, 3163–3174. [Google Scholar] [CrossRef]
- Rangarajan, B.; Kovalgin, A.Y.; Wörhoff, K.; Schmitz, J. Low-temperature deposition of high-quality silicon oxynitride films for CMOS-integrated optics. Opt. Lett. 2013, 38, 941–943. [Google Scholar] [CrossRef] [PubMed]
- Belt, M.; Davenport, M.L.; Bowers, J.E.; Blumenthal, D.J. Ultra-low-loss tantalum pentoxide (Ta2O5)-core/SiO2-clad planar waveguides on Si substrates. Optica 2017, 4, 532–536. [Google Scholar] [CrossRef]
- Bendory, T. Robust recovery of positive stream of pulses. IEEE Trans. Signal Process. 2017, 65, 2114–2122. [Google Scholar] [CrossRef]
Figure 1.
Schematic diagram of the scanning receiver system. Insets (A), (B), (C) and (D) illustrate the operation principle of the scanning system at points (A), (B), (C) and (D), respectively.
Figure 1.
Schematic diagram of the scanning receiver system. Insets (A), (B), (C) and (D) illustrate the operation principle of the scanning system at points (A), (B), (C) and (D), respectively.

Figure 2.
Comparison of the scanning systems based on deconvolution and the conventional method.

Figure 3.
(a) Top-down SEM image of the fabricated SOI single-ring filter. (b) Measured (red) output of the scanning receiver when no RF signal is applied and simulated (green) spectral responses of the optical filter. (c) Fourier transform of the measured filter response, H(k). Inset: Zoomed-in H(k).

Figure 4.
(a) Measured output signal and (b) reconstructed spectrum with the input RF power at 0 dBm. (c) Measured output signal and (d) reconstructed spectrum with the input RF power at −5 dBm.
Figure 4.
(a) Measured output signal and (b) reconstructed spectrum with the input RF power at 0 dBm. (c) Measured output signal and (d) reconstructed spectrum with the input RF power at −5 dBm.

Figure 5.
Measurement error as a function of the input RF frequency.

Figure 6.
(a) Measured output signal and (b) reconstructed spectrum with input RF tones at 12 GHz and 12.4 GHz. (c) Measured output signal and (d) reconstructed spectrum with input RF tones at 12 GHz and 13 GHz.
Figure 6.
(a) Measured output signal and (b) reconstructed spectrum with input RF tones at 12 GHz and 12.4 GHz. (c) Measured output signal and (d) reconstructed spectrum with input RF tones at 12 GHz and 13 GHz.

© 2019 by the authors. Licensee MDPI, Basel, Switzerland. This article is an open access article distributed under the terms and conditions of the Creative Commons Attribution (CC BY) license (http://creativecommons.org/licenses/by/4.0/).
Share and Cite
MDPI and ACS Style
Song, S.; Yi, X.; Gan, L.; Yang, W.; Nguyen, L.; Chew, S.X.; Li, L.; Minasian, R.A. Photonic-Assisted Scanning Receivers for Microwave Frequency Measurement. Appl. Sci. 2019, 9, 328. https://doi.org/10.3390/app9020328
AMA Style
Song S, Yi X, Gan L, Yang W, Nguyen L, Chew SX, Li L, Minasian RA. Photonic-Assisted Scanning Receivers for Microwave Frequency Measurement. Applied Sciences. 2019; 9(2):328. https://doi.org/10.3390/app9020328
Chicago/Turabian StyleSong, Shijie, Xiaoke Yi, Lu Gan, Wenjian Yang, Linh Nguyen, Suen Xin Chew, Liwei Li, and Robert A. Minasian. 2019. "Photonic-Assisted Scanning Receivers for Microwave Frequency Measurement" Applied Sciences 9, no. 2: 328. https://doi.org/10.3390/app9020328
Note that from the first issue of 2016, this journal uses article numbers instead of page numbers. See further details here.